Abstract
In response to the problems encountered during the pressure-driven oil recovery process in low-permeability oil reservoirs, such as slow pressure transmission, poor liquid supply, vulnerability of the reservoir to damage, and difficulties in injection and production, in order to achieve the goal of high-quality water injection development, based on the theories of rock mechanics and seepage mechanics, combined with large-scale physical model experiments, acoustic emission crack monitoring, and microscopic scanning technology, an oil reservoir and fracture model was established to conduct a feasibility analysis of pressure-driven assisted pressure reduction and enhanced injection, and it was successfully applied in the exploration and development practice of the Shengli Oilfield. The research shows the following: (1) During the pressure-driven process, the distribution of the fracture network system is relatively limited. In the early stages of the process, there will be minor fractures, but they do not communicate or activate effectively. The improvement of physical properties and pore-throat structure is negligible. As the injection flow rate increases, the effective fracture network system begins to be established, and the range of fluid coverage begins to expand. With the progress of the pressure-driven process, the hydraulic fractures gradually extend, the number of activated original fractures gradually increases, the communication area between hydraulic fractures and original fractures gradually increases, and the reservoir modification effect gradually improves. (2) Based on the compression cracking experiment of large object molds, it is concluded that generating effective micro-cracks and activating them to form efficient diversion channels is the key to pressure flooding injection. Combining the mechanical characteristics of the rock in the target layer to precisely control the injection speed and injection pressure can maximize the fracture network, thereby improving the reservoir to achieve the purpose of pressure reduction and injection increase. (3) Different pressure flooding injection parameters were set for the low-permeability oil reservoirs in the study area to simulate the fracture network expansion. Finally, it was concluded that the optimal injection speed for fracture expansion was 1.2 m3/min and the optimal total injection volume was 20,000 m3. Through research, the mechanism of pressure-driven injection and the extent of reservoir modification caused by this pressure-driven process have been enhanced in terms of understanding.
1. Introduction
Low-permeability reservoirs refer to those with relatively low permeability, usually less than 50 mD. Low-permeability reservoirs are characterized by deep burial, low abundance, poor physical properties, and strong heterogeneity. The seepage capacity of the reservoir is poor, and artificial fracturing modification further aggravates the heterogeneity of the reservoir. Reservoir development faces the problems of difficult injection, low production efficiency, and coexistence of water flooding and water diversion. Hydraulic fracturing is a key technology for the effective development of such difficult-to-access oil and gas resources. Hydraulic fracturing technology involves injecting fracturing fluid at high pressure at the bottom of the well to cause the formation to rupture and form a fracture network of a certain scale. After creating the fractures, proppants are injected to ensure a certain flow diversion capacity, changing the fluid flow at the bottom of the well from radial to linear, reducing energy loss, and thereby increasing production. However, the conventional fracturing operation procedure is cumbersome. The injected fracturing fluid needs to be backdrained after the gel is broken. If the gel is broken and the backdraining is not thorough, it will affect the fracture diversion capacity and cause a certain degree of pollution. Similarly, hydraulic fracturing also has the problems of a small swept range of fracture control and limited transformation effect. To improve the fracturing effect and enhance production capacity, the oilfield site has proposed an integrated fracturing oil displacement technology of “pressure–injection–production”, also known as “pressure flooding”. Pressure flooding is a complete set of construction techniques for continuous reservoir development formed by combining the production increase and injection process, conventional water flooding or chemical agent flooding [1,2,3,4,5,6,7,8,9].
The commonality between pressure flooding and fracturing is that they both create fractures in the reservoir to form seepage channels with certain diversion capacity and increase the contact area with the reservoir. The difference lies in that conventional fracturing needs to avoid the filtration loss of fracturing fluid, and the working fluid only plays a role in creating fractures. However, in the pressure flooding process, the oil displacement agent that can create fractures but does not need to be backdrained is injected. The oil displacement agent can increase the fluid infiltration range in the reservoir, reduce the rock fracture pressure, increase the elastic energy of the reservoir, and can have a displacement reaction with crude oil, thereby enhancing the recovery rate. When designing oil displacement agents, it is necessary to consider how to make the oil displacement agents filter out up and down along the way as much as possible. For this purpose, oil displacement agents with low viscosity, high oil washing efficiency, no wall formation, good compatibility with low-permeability reservoirs, strong filtration loss, and good compatibility with subsequent injected fluids should be selected to prevent pollution and damage to the reservoir [10,11,12,13,14,15,16,17].
Since the 1960s, foreign scholars have conducted research on the percolation and oil recovery theory of fractured oil fields. They proposed a dual-porosity medium model, analyzed the characteristics of multiphase unstable flow, and summarized the oil–water movement and percolation laws, providing a theoretical basis for the research on pressure drive technology in China. The Daqing Lamaizhen Oilfield in China conducted the first on-site experiment of “pressure drive technology” in 2017 and achieved good production increase results. In subsequent water drive research, it was proved that the pressure drive had a better effect on increasing fluid and oil production than ordinary fracturing.
This research fully took into account the actual situation on the site of the study area. Considering factors such as cost, the pressure-bearing performance of the pump unit, and the operability of the scheme adjustment and implementation, water was selected as the oil displacement agent. In response to the problems encountered during the pressure-driven oil recovery process in low-permeability oil reservoirs, such as slow pressure transmission, poor liquid supply, easy damage to the reservoir, and difficulty in injection and production, aiming to achieve the goal of high-quality water injection development, guided by the theories of rock mechanics and seepage mechanics, based on large-scale physical model experiments + acoustic emission fracture monitoring and combined with microscopic scanning technology, an oil reservoir and fracture model was established to conduct a feasibility analysis of pressure-driven auxiliary depressurization and increased injection. Utilizing the ground high-pressure pump unit, with ultra-high pressure, micro-fractures, or even fracture pressure for pumping, a large amount of water was injected in a short period of time. Then, through well shutdown, oil–water replacement, and pressure diffusion, the reservoir was charged, improving the development effect [18,19,20,21,22,23,24].
2. Geological Overview of the Study Area
Dalu Lake Oilfield is located in the northeast of Gaoying County, Zibo City, Shan-dong Province. It is adjacent to the Yellow River in the north and the Xiaoqing River in the south. It is a special low-permeability oilfield that was put into development in 1991. Its structural position is in the northwest of the Boxing Depression in the Dongying Basin, at the northern end of the Jinjia-Fanjia nose-shaped structure. The overall feature is a west-high and east-low, north-high and south-low slope. It is mainly composed of block structures and has multiple sets of fracture systems, forming a complex combination of blocks. The activity of faults plays a key role in the migration of oil and gas and the formation of traps. The main oil layers in the Daluhu Oilfield are concentrated. Its main oil-bearing layer systems are the second and third stages of sand. The oil layer in the second stage of sand is thin but has a stable distribution and is a sheet-like sand deposition. The third section of Sha developed into small potato-shaped turbid sand bodies, with a geological oil reserve of 62.0 × 10⁴ tons (Figure 1). The second section of Fan 18 Block Sha in the study area is divided into four sand layer groups. The main oil-bearing layer system is the third sand group of Sha 2. The lithology of the strata in the second section of Sha 2 is mainly gray and argillaceous siltstone. The structural burial depth of the third sand group of the second section of Sha 2 is about 2460 m. During the sedimentary period of the third sand group of the second section of Fan 18 Block Sha, the sedimentary sand body at the leading edge of the delta was mainly developed, with an average porosity of 16.6%. The air permeability is 5.9 × 10⁻³ µm2. The sand group 3 of the second sand section is an overall mesophilic and low-permeability reservoir. Based on the analysis of the mercury pressure data of Well Fan 182, the average pore-throat radius of the Sha 2 is 2.29 μm, the maximum pore-throat radius is 5.97 μm, and the main pore-throat range is 1.6–5.7 μm. The research block is currently in the development stage of low extraction degree, low oil recovery rate and medium and low water content. With the continuous progress and in-depth application of water injection development technology, the water injection pressure of the research block shows a gradually increasing trend. At present, it is urgently necessary to use pressure flooding technology for pressure reduction and injection increase, so as to improve the reservoir and increase the recovery rate. This paper takes the low-permeability sandstone reservoir in Fan 18 Block of Daluhu Oilfield as the research object. Starting from the theories of rock mechanics and seepage mechanics, based on the large physical model test and combined with microscopic scanning technology, it reveals the pressure flooding mechanism, clarifies the key factors of pressure reduction and injection increase, establishes the numerical model of the pressure flooding water-injected reservoir in the corresponding test area, and on the basis of the research on the reservoir modification mechanism of pressure flooding, combined with the reservoir characteristics, establishes reservoir and fracture models, conducts feasibility analysis of pressure flooding-assisted pressure reduction and injection increase, and proposes an optimization scheme of pressure flooding injection parameters suitable for the study area.
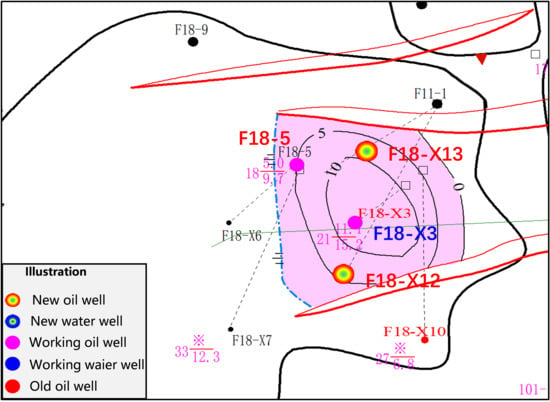
Figure 1.
The equal-thickness diagram of the small oil layer in the middle section of Block Sha No. 3 of Fan 18-3.
3. Large Object Mold Test
The true triaxial hydraulic fracturing experiment carried out in this research adopted the pressure drive physical simulation experimental device and the triaxial stress–fluid–structure coupling experimental system independently developed by Xi’an University of Science and Technology. The experimental system consists of a high-pressure chamber, a stress loading and control system, a fracturing system, a testing system, and a data acquisition and control system, etc. Meanwhile, the influences of temperature field, seepage field, and stress field, etc. on the fracturing of rock samples were considered. During the simulation test, a high-precision strain acquisition device and a gas pressure and flow monitoring system were utilized to analyze the variation laws of pump pressure, flow rate, and time during the pressure drive process. Using the fracturing system, the hydraulic fracturing characteristics of rock samples under true triaxial stress were studied, and the variation laws of characteristic parameters such as the fracturing initiation pressure, fracturing frequency, fracturing direction, and permeability of rock samples were analyzed. The acoustic emission system is equipped to detect the crack initiation and spatial distribution characteristics. The application of true triaxial overpressure and tridirectional loading can achieve static and dynamic loads. The overpressure loading is 30 Mpa, which can simulate the seepage experiment under true triaxial conditions. It can help us detect the fracture initiation and propagation characteristics, as well as the acoustic emission characteristics during the fracturing process, so as to conduct flow detection, temperature detection, and stress–strain detection.
3.1. Experimental Sample
This sample was taken from the field outcrop of the target layer. Using a rock cutter, the sample was cut into cubic rock blocks with a size of 300 mm × 300 mm × 300 mm, and a φ 6 mm × 120 mm fracturing pipe was pre-embedded on one side (Figure 2). The collected samples were sealed and transported in a fixed manner. The coal body was processed into cubic specimens with dimensions of 300 mm × 300 mm × 300 mm using a cutting machine. The sides of each cube were polished and corner filled, ensuring that all sides of the cubes were flat and intact. A φ 20 mm × 150 mm fracturing hole was constructed at the center of one side, and the sealing cylinder base connection (fracturing pipe) was installed in the fracturing hole using sealant. Strain gauges were attached to the two adjacent sides of the sample, and the sample was placed in the sealing cylinder. Square plugs and sealing cover plates were placed on the top of the sealing cylinder and sealed with sealant. The assembly was then placed on the misaligned loading component and fixed in the high-pressure chamber as a whole (Figure 3). The basic physical parameters of the rock samples are shown in Table 1.
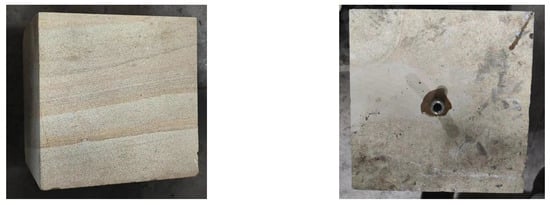
Figure 2.
Rock sample specifications and reserved injection holes.
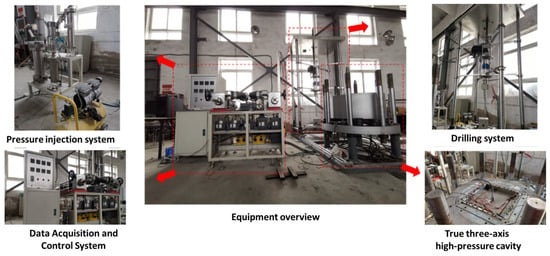
Figure 3.
True three-axis hydraulic fracturing system.

Table 1.
Basic physical parameters of rock samples.
3.2. Experimental Plan
(1) Based on the rock mechanics parameters (fracture pressure, Young’s modulus, and Poisson’s ratio) of the sample from the sampling point’s plunger, triaxial pressures of 15 MPa, 12 MPa, and 10 MPa were set;
(2) Set constant injection displacement/variable displacement injection;
(3) Monitor the pressure changes and injection volume throughout the process;
(4) The acoustic emission device is used in coordination to monitor cracks;
(5) After the cracking occurs, stop the experiment and conduct a micro-evaluation.
The sample is connected to the water injection system, the fracturing system, etc., through the reserved pipeline interface in the high-pressure chamber. The high-pressure chamber is sealed, and water is filled into the chamber to provide the minimum principal stress σ3 required for the test. To verify whether the performance of the test system meets the test requirements, the true triaxial stress seepage and fracturing tests are carried out successively. We open the valves of the fracturing system and the gas inlet valve; inject the pink fracturing tracer into the rock mass through the liquid injection pump; introduce a certain amount of He (used for monitoring and judging the coal body connection effect) through the inlet; install a pressure sensor at the end of the fracturing pipe to monitor the injection pressure of the fracturing fluid in real time; draw graphs showing the changes in rock fracture initiation pressure, fracturing times, etc., during the fracturing process. When the inlet gas pressure, outlet gas pressure, and fracturing pressure are approximately equal, it can be determined that the fracturing process is complete (Figure 2).
3.3. Experimental Process
(1) Constant injection displacement
The injection pressure curve during the compression drive process is shown in Figure 4a. With continuous injection, the overall displacement pressure shows a stepped-increasing characteristic and remains stable at a certain pressure (9.81 Mpa, rupture pressure 25 Mpa). The occasional fluctuations during the process should be caused by the generation of micro-cracks inside the core. Before the internal cracks of the core pass through and cause core rupture, the displacement pressure rises rapidly (the maximum injection pressure was 19.2 Mpa), and then drops rapidly.
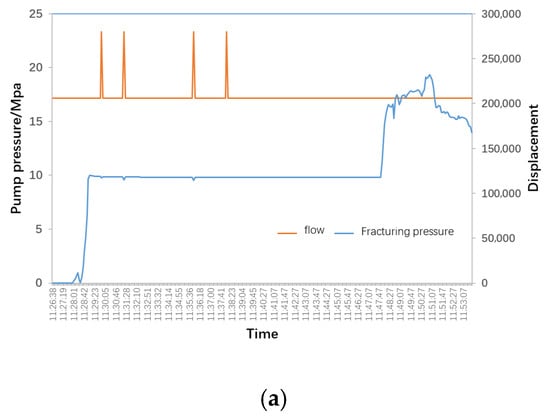
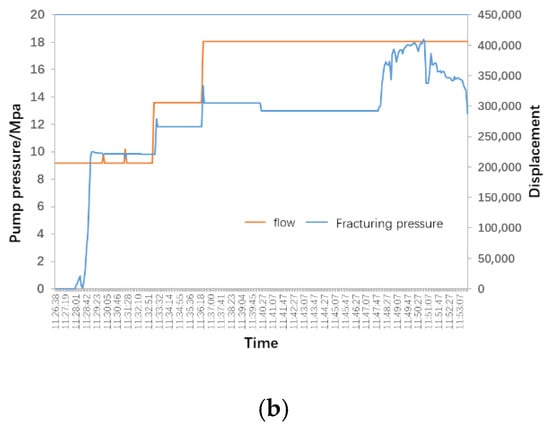
Figure 4.
True triaxial hydraulic fracturing test monitoring. (a) Constant injection displacement, (b) stepped injection displacement.
(2) Stepwise injection displacement
The injection pressure curve of the compression drive process is shown in Figure 4b. With the increase in the injection displacement, the displacement pressure shows a characteristic of stepwise increase. When the displacement is increased, there will be a pulse of pressure that first rises and then falls. After that, the pressure remains stable until the displacement is changed next time. Through the analysis of the injection pressure curve, during the compression drive process, within a wide displacement range, there are characteristics of rock fracture. The maximum injection pressure is 18.1 Mpa.
3.4. Experimental Analysis
(1) Constant injection displacement
During the compression drive process, the injection pressure will rise rapidly in the early stage and stabilize at a certain pressure. Crack penetration is achieved before approaching the rupture pressure (19.2 Mpa/25 Mpa), during which micro-cracks are generated.
(2) Stepwise injection displacement
Each time the displacement is increased, there will be a pulse of pressure that first rises and then falls. After that, the pressure remains stable and unchanged until the next change in displacement. Before approaching the rupture pressure (18.1 Mpa/25 Mpa), the crack penetration is achieved, during which micro-cracks are generated.
The comprehensive experimental analysis shows that the constant injection displacement is at 13.99 Mpa, and the maximum injection pressure is 19.2 Mpa. The stepped injection displacement is at 12.8 Mpa, and the maximum injection pressure is 18.1 Mpa. It is comprehensively concluded that the essence of additional injection should be to generate more micro-cracks by controlling the displacement and further connect them into a crack network. Under the same injection volume, the constant injection method results in a faster increase in pressure of the rock sample, thereby generating a greater fracture pressure.
3.5. Microscopic Scanning of the Core
The cast thin sheet analysis was carried out on the plunger core of the core cube after the hydraulic fracturing was completed. The core sampling positions are shown in the following figure. As can be seen from Figure 5, core sampling was conducted on all surfaces of the cube sample (small columns were removed at the circular × mark), which can comprehensively detect whether cracks and micro-cracks occur in different directions.
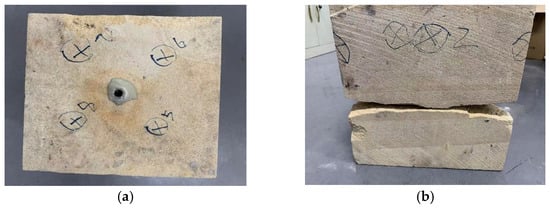
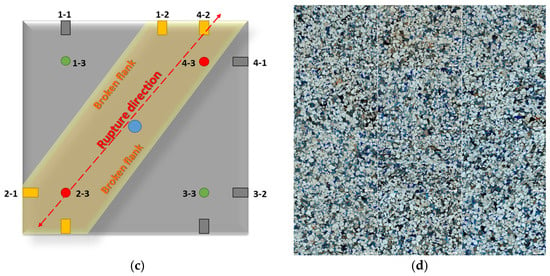
Figure 5.
Comparison of cracks in cast thin sheets at different positions under core microscopy. (a) The core sampling position at the top of the sample, (b) core sampling position on the side of the sample, (c) schematic diagram of the sampling location for the plunger rock sample, (d) microscopic scanning images of core samples from different locations.
No continuous and interconnected micro-cracks were observed in the thin sections of core castings at different orientations. The statistics of the microscopic images of the main direction, flanking, and base of the fracture show no significant difference in the distribution of large pores and thick throats, indicating that the fracturing did not form continuous and connected micro-fractures. Porosity is directly proportional to the porosity rate and inversely proportional to the permeability. There is no obvious correlation between pore permeability and pore diameter. This indicates that although fracturing destroys the pore structure, it does not form continuous and interconnected micro-cracks (Figure 6).
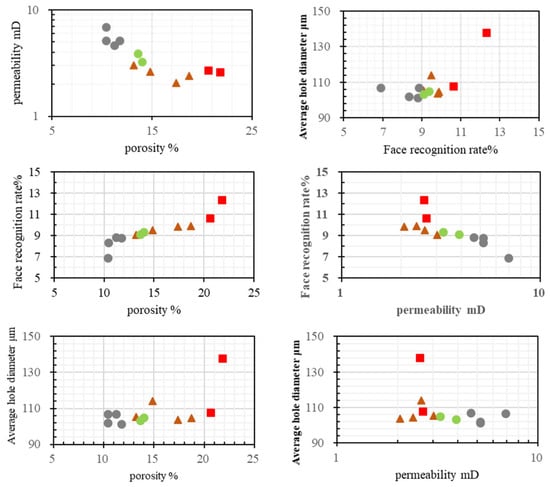
Figure 6.
Analysis of porosity, face ratio, permeability, and pore diameter at different locations.
Based on the scanning of the fracture distribution of the core at different periods of compression drive, it was found that in the early stage of compression drive, there were no channels, no cracks, and the pressure spread range was small. Micro-cracks occur and penetrate in the later stage of compression drive.
4. Numerical Simulation and Scheme Design
4.1. Model Establishment and Historical Fitting
In this study, Petrel (2019) and Eclipse software (2020) were employed, and the numerical simulation method was adopted. Based on the geological model and the simulated fracture network expansion, the injection effect after pressure drive was evaluated to verify whether the pressure drive in low-permeability oil reservoirs can improve the reservoir and thereby achieve enhanced injection and extraction.
The area where the well group FJF18-X208 is located was selected as the study area. The average porosity was 19.5% and the average permeability was 20.3 mD, which belonged to a low-permeability reservoir. The area of the study zone is 1.37 km2. A three-dimensional geological model was established. The planar grid is 10 m × 10 m, and the three sand bodies in the second section of the sand are divided into 10 layers of grids vertically. Due to the small area of this well group and the relatively weak heterogeneity of reservoir physical properties in this area, the average values of the porosity model, permeability model, and original oil saturation model are all taken to establish the results. The specific basic parameters of the reservoir model are shown in Table 2.

Table 2.
Reservoir model basic parameters.
There are a total of 4 production wells and 1 injection well in the research block. The historical fitting of daily oil production, daily water production, daily liquid production, and daily water production in the study block was conducted (Figure 7), and the fitting rate reached 80%. The reserve calculation result of the study area is 58.51 × 10⁴ tons. Up to now, the cumulative crude oil extracted is 7.09 × 10⁴ tons, and the extraction degree is 12.11%. During the numerical simulation process, the original formation pressure was 23.6 MPa, the bottom hole flow pressure of the injection well was 30 MPa, the bottom hole flow pressure of the production well was 9 Mpa, the upper limit of liquid production in the production well was 20 m3/d, the upper limit of injection volume in the injection well was 30 m3/d, and the simulation production time was 10 years (Figure 7).
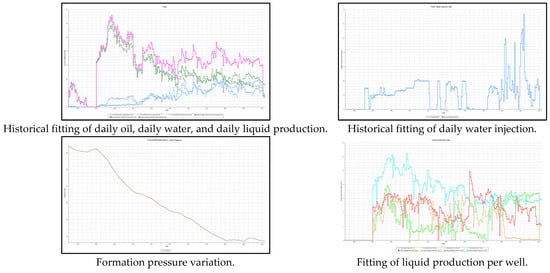
Figure 7.
Historical fitting.
4.2. Simulation of Pressure Drive Seam Mesh Expansion
The low-permeability reservoir pressure-driven fracture network expansion model is based on the improved displacement discontinuity method, and it considers the combined stress field distribution with multiple fracture interference and three fracture expansion mechanical discrimination modes, as well as the variable step size expansion of fractures. It consists of four parts: the parameter input system, the multi-fracture trajectory solution system, the artificial fracture expansion system, and the natural fracture expansion system, and can be used for the simulation calculation of pressure-driven fracture networks in vertical wells or horizontal wells.
We set the injection speeds of 0.6 m3/min, 0.8 m3/min, 1.0 m3/min, 1.2 m3/min, and 1.4 m3/min, respectively. The total injection volumes of 5000 m3, 10,000 m3, 15,000 m3, 20,000 m3, 25,000 m3, and 30,000 m3 were used to simulate the expansion of the reservoir slit network in the study area, and the average slit network band length (ABL) and average slit network bandwidth (ABW) under different injection parameters were obtained. The area of the renovation zone (SRA) and the average crack width (AFW).
As shown in Figure 8, when the injection rate is between 0.6 m3/min and 1.2 m3/min, the average length of the perforation net belt, the area of the modified zone, the average width of the perforation net belt, and the average width of the fractures all show a linear growth. After 1.2 m3/min, the increase rate of the area of the modified zone and the average width of the perforation net belt decreases. Considering factors such as the on-site equipment modification (requiring the replacement of higher-power injection pumps), water supply volume, water quality (difficulty in water collection and limited water purification capacity), and the comprehensive analysis of the expansion effects of the average length of the perforation net belt, the area of the modified zone, the average width of the perforation net belt, and the average width of the fractures, the optimal injection rate is determined to be 1.2 m3/min.
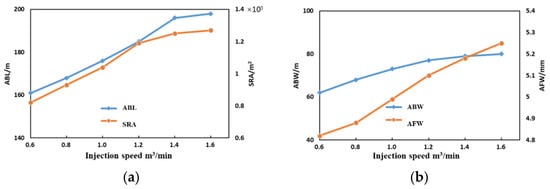
Figure 8.
Simulation results of reservoir gap network expansion at different injection speeds. (a) The average length of the seam mesh belt and the area of the transformation zone under different injection speeds, (b) the average seam network bandwidth and average crack width at different injection speeds.
It can be seen from Figure 9 that after the total injection volume is approximately 20,000 m3, the increase rates of the average seam mesh belt length, the area of the renovation zone, and the average seam mesh bandwidth significantly slow down, while the growth rate of the average crack width does not change much. Considering the crack expansion effect and economic factors comprehensively, the optimal total injection volume is 20,000 m3.
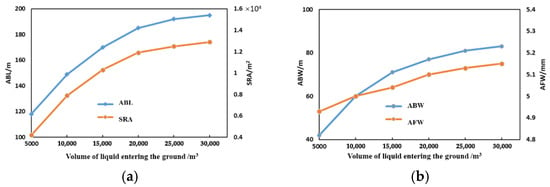
Figure 9.
Simulation results of reservoir gap network expansion with different total injection volumes. (a) The average length of the seam mesh belt and the area of the renovation zone under different total injection volumes, (b) average crack network bandwidth and average crack width under different total injection volumes.
5. Discussion
Therefore, the distribution of the slit net system generated during the pressure flooding process is relatively limited. In the early stage of pressure flooding, fine cracks will occur, but there is no effective communication and activation, and the improvement of physical properties and pore throat structure is negligible. With the increase in injection displacement, an effective slit net system begins to be established, and the range affected by the fluid begins to expand. The large object model experiment effectively simulated the relationship between the injection displacement gradient and the pressure. Meanwhile, through acoustic emission and microscopic scanning, it was found that the effectively communicating slit network structure is the key to achieving pressure reduction and injection increase in the pressure flooding process. However, considering the cost and complexity of the experiment, it is necessary to analyze more injection schemes and feasibility analyses based on the experimental results of the large object model with the help of numerical simulation methods.
This study, based on large-scale physical model experiments, acoustic emission crack monitoring, and combined with microscopic scanning technology, reveals the pressure-driven mechanism. It further discovers the key factors for pressure reduction and injection increase, providing parameter support for numerical simulation. A parameter optimization method based on seam network expansion for pressure-driven assisted pressure reduction and injection was proposed, providing a basis for the design of pressure-driven assisted pressure reduction and injection schemes.
The pressure-driven technology involves complex geological conditions and reservoir characteristics, and requires high-precision geological exploration and reservoir description techniques to support it. A relatively ideal fracture network structure can be formed only when the injection pressure exceeds the fracture pressure. During the pressure-driven process, precise control of parameters such as water injection pressure and water injection volume is necessary. Due to the acidification construction carried out in some wells, various metal compounds precipitate as the pH of the near-well area increases. Long-term water injection corrodes the pipelines and forms substances such as iron hydroxide. This has an adverse impact on the pressure-driven unblocking process. The currently proposed optimization plan (with the optimal injection speed of 1.2 m3/min and the optimal total injection volume of 20,000 m3) is limited by various factors such as economic cost and time cost of on-site construction. It is possible to consider pressure-driven + additives as an effective unblocking mode. The key lies in the interaction process between the additives and the multi-sensitive formations. Selecting appropriate additives and a reasonable acid erosion scheme for different types of blockages can prevent the occurrence of secondary precipitation and avoid the blockage of the micro-cracks caused by the precipitation [25,26,27,28,29].
6. Conclusions
(1) Numerical simulation of water injection under pressure drive for different types of low-permeability oil reservoirs shows that the injection rate, total injection volume, and static bottom hole pressure during the pressure drive process are positively correlated with the fracture network area within a certain range. The lower the reservoir permeability, the greater the injection rate and injection pressure required for pressure drive. Pressure drive can increase the average formation pressure, reduce the pressure around the injection wells, and enhance the injection capacity. The lower the reservoir permeability, the smaller the increase in average formation pressure and the lower the injection capacity.
(2) Based on the compression cracking experiment of large object molds, it is concluded that generating effective micro-cracks and activating them to form efficient diversion channels is the key to pressure flooding injection. Combining the mechanical characteristics of the rock in the target layer to precisely control the injection speed and injection pressure can maximize the fracture network, thereby improving the reservoir to achieve the purpose of pressure reduction and injection increase. The constant injection displacement is at 13.99 Mpa, and the maximum injection pressure is 19.2 Mpa. The stepped injection displacement is at 12.8 Mpa, and the maximum injection pressure is 18.1 Mpa.
(3) Different pressure flooding injection parameters were set for the low-permeability oil reservoirs in the study area to simulate the fracture network expansion. Finally, it was concluded that the optimal injection speed for fracture expansion was 1.2 m3/min, and the optimal total injection volume was 20,000 m3.
Author Contributions
Conceptualization, B.C. and R.Z.; methodology, B.C., J.S. and Q.Z.; validation, B.C.; formal analysis, J.S.; investigation, R.Z.; writing—original draft, B.C.; writing—review and editing, B.C. and J.S.; Visualization, J.H.; supervision, J.H., B.C. and J.S. All authors have read and agreed to the published version of the manuscript.
Funding
The research was supported by 2023 Natural Science Basic Research Project of Shaanxi Province (Grant No. 2023-JC-QN-0320) and 2023 General special scientific research project of Shaanxi Provincial Education Department (Grant No. 23JK0595) and Sinopec Key Laboratory of Oil and Gas Reservoir Formation Open Fund 2021.
Data Availability Statement
The data presented in this study are available upon request from the corresponding author. The data are not publicly available due to privacy restrictions.
Conflicts of Interest
Author Qunqun Zhou was employed by the company Shengli Oilfield Dongsheng Jinggong Petroleum Development Group Co., Ltd. The remaining authors declare that the research was conducted in the absence of any commercial or financial relationships that could be construed as a potential conflict of interest.
References
- Yang, H.; Zhang, Y.; Shen, J.; Li, M.; Zhang, X.; Jiang, H.; Li, H.; Peng, L.; Sarsenbekuly, B.; Kang, W. Mechanistic Insights into Nanoparticle-Modified Polymer Flooding for Enhanced Oil Recovery. Langmuir ACS J. Surf. Colloids 2025, 41, 22036–22047. [Google Scholar] [CrossRef]
- Lu, S.; Zhang, Z.; Dai, L.; Jia, N. Enhancing Oil Recovery Through Vibration-Stimulated Waterflooding: Experimental Insights and Mechanisms. Fuels 2025, 6, 56. [Google Scholar] [CrossRef]
- Gang, H.U. A new method for calculating volumetric sweep efficiency in a water-flooding oilfield. Pet. Explor. Dev. 2013, 40, 111–114. [Google Scholar] [CrossRef]
- Yuan, Z.; Yang, B.; Yang, L.; Gu, W.; Chen, X.; Kang, B.; Li, C.; Zhang, H. Water-cut rising mechanism and optimized water injection technology for deepwater turbidite sandstone oilfield: A case study of AKPO Oilfield in Niger Delta Basin, West Africa. Pet. Explor. Dev. 2018, 45, 302–311. [Google Scholar] [CrossRef]
- Saadat, M.; Tsai, P.A.; Ho, T.H.; Øye, G.; Dudek, M. Development of a microfluidic method to study enhanced oil recovery by low salinity water flooding. ACS Omega 2020, 5, 17521–17530. [Google Scholar] [CrossRef]
- Yi, L.; Jinfa, Z. Research on Optimization of Water Quality Index System for Low Permeability Reservoir Water Injection Development. Chem. Technol. Fuels Oils 2023, 58, 1018–1026. [Google Scholar] [CrossRef]
- Shao, Z. Research and Field Application on Extreme Subdivision Water Injection Technology for Low Permeability Reservoirs. J. Phys. Conf. Ser. 2024, 2834, 012120. [Google Scholar] [CrossRef]
- Zhang, L.; Xu, C.; Zhang, K.; Yao, C.; Yang, Y.; Yao, J. Production optimization for alternated separate-layer water injection in complex fault reservoirs. J. Pet. Sci. Eng. 2020, 193, 107409. [Google Scholar] [CrossRef]
- Ding, B.; Guan, B.; Liu, W.; Chen, B.; Sun, J.; Li, M.; Wu, W.; Hua, S.; Geng, X.; Chen, W.; et al. Mechanism of Improving Water Flooding Using the Nanofluid Permeation Flooding System for Tight Reservoirs in Jilin Oilfield. Energy Fuels 2021, 35, 17389–17395. [Google Scholar] [CrossRef]
- Li, C.; Yang, J.; Ye, J.; Zhou, J.; Zhang, R.; Feng, Q. Semi-analytical modeling of advanced water injection in low permeability reservoirs under non-Darcy-flow condition. Adv. Mech. Eng. 2019, 11, 1687814019846767. [Google Scholar] [CrossRef]
- Youjun, J.; Vafai, K.; Xu, H.; Jianjun, L. Analysis of the channeling of water injection in low permeability reservoirs with interlayer considering the seepage–stress coupling. Int. J. Numer. Methods Heat Fluid Flow 2020, 31, 2599–2622. [Google Scholar] [CrossRef]
- Lin, J.; Jiang, R.; Shen, Z.; Wang, Q.; Cui, Y.; Ni, Q.; Zhang, F. Comprehensive characterization investigation of multiple time-varying rock-fluid properties in waterflooding development. J. Energy Resour. Technol. 2022, 144, 073001. [Google Scholar] [CrossRef]
- Zhu, W.; Gao, Y.; Wang, Y.; Liu, P.; Liu, Y. The injection capacity evaluation of high-pressure water injection in low permeability reservoir: Numerical and case study. Front. Earth Sci. 2024, 12, 1411451. [Google Scholar] [CrossRef]
- Abedifar, M.; Zakariaei, S.J.S.; Abdideh, M.; Kord, S.; Hajipour, M. Analysis of deformation and induced stress fields in wells during water flooding operations of carbonate reservoirs. J. Pet. Explor. Prod. Technol. 2025, 15, 71. [Google Scholar] [CrossRef]
- Yazhou, Z.; Wenbin, Y.; Daiyin, Y. Experimental investigation on reservoir damage caused by clay minerals after water injection in low permeability sandstone reservoirs. J. Pet. Explor. Prod. Technol. 2021, 12, 915–924. [Google Scholar] [CrossRef]
- Zhao, M.; Guo, X.; Wu, Y.; Dai, C.; Gao, M.; Yan, R.; Cheng, Y.; Li, Y.; Song, X.; Wang, X.; et al. Development, performance evaluation and enhanced oil recovery regulations of a zwitterionic viscoelastic surfactant fracturing-flooding system. Colloids Surf. A Physicochem. Eng. Asp. 2021, 630, 127568. [Google Scholar] [CrossRef]
- Amir, Z.; Saaid, I.M.; Jan, B.M.; Patah, M.F.A.; Khalil, M.; Bakar, W.Z.W. PAM/PEI polymer gel for water control in high-temperature and high-pressure conditions: Core flooding with crossflow effect. Korean J. Chem. Eng. 2022, 39, 605–615. [Google Scholar] [CrossRef]
- Li, J.; Zhang, W.; Qu, B.; Zhen, E.; Qian, Z.; Ma, S.; Qin, F.; You, Q. Physical Modeling of High-Pressure Flooding and Development of Oil Displacement Agent for Carbonate Fracture-Vuggy Reservoir. Processes 2025, 13, 71. [Google Scholar] [CrossRef]
- Sesetty, V.; Ghassemi, A. A numerical study of sequential and simultaneous hydraulic fracturing in single and multi-lateral horizontal wells. J. Pet. Sci. Eng. 2015, 132, 65–76. [Google Scholar] [CrossRef]
- Weng, X.W. Modeling of complex hydraulic fractures in naturally fractured formation. J. Unconv. Oil Gas Resour. 2015, 9, 114–135. [Google Scholar] [CrossRef]
- Ren, L.; Su, Y.; Zhan, S.; Hao, Y.; Meng, F.; Sheng, G. Modeling and simulation of complex fracture network propagation with SRV fracturing in unconventional shale reservoirs. J. Nat. Gas Sci. Eng. 2016, 28, 132–141. [Google Scholar] [CrossRef]
- Wu, K.; Olson, J.E. Investigation of Critical In Situ and Injection Factors in Multi-Frac Treatments: Guidelines for Controlling Fracture Complexity. In Proceedings of the SPE Hydraulic Fracturing Technology Conference, The Woodlands, TX, USA, 4–6 February 2013. SPE-163821-MS. [Google Scholar]
- Wu, K.; Olson, J.E. Simultaneous multifracture treatments: Fully coupled fluid flow and fracture mechanics for horizontal wells. SPE J. 2015, 20, 337–346. [Google Scholar] [CrossRef]
- Xue, L.; Zhang, J.; Chen, G.; Wang, X.; Huang, X.; Li, X.; Wang, Y.; Lu, J. Enhance oil recovery by carbonized water flooding in tight oil reservoirs. Geoenergy Sci. Eng. 2025, 244, 213430. [Google Scholar] [CrossRef]
- Sun, Q.; Zhang, N.; Liu, W.; Li, B.; Li, S.; Bhusal, A.; Wang, S.; Li, Z. Insights into enhanced oil recovery by thermochemical fluid flooding for ultra-heavy reservoirs: An experimental study. Fuel 2023, 331, 125651. [Google Scholar] [CrossRef]
- Ganiyeva, A.; Karabayanova, L.; Pourafshary, P.; Hashmet, M.R. The Performance of Engineered Water Flooding to Enhance High Viscous Oil Recovery. Appl. Sci. 2022, 12, 3893. [Google Scholar] [CrossRef]
- Yu, Q.; Liu, Y.; Liang, S.; Tan, S.; Sun, Z.; Yu, Y. Experimental study on surface-active polymer flooding for enhanced oil recovery: A case study of Daqing placanticline oilfield, NE China. Pet. Explor. Dev. Online 2019, 46, 1206–1217. [Google Scholar] [CrossRef]
- Shang, X.; Bai, Y.; Sun, J.; Dong, C. Performance and displacement mechanism of a surfactant/compound alkaline flooding system for enhanced oil recovery. Colloids Surf. A Physicochem. Eng. Asp. 2019, 580, 123679. [Google Scholar] [CrossRef]
- Pashchenko, A.O.; Borodina, A.N.; Yavorska, O.O.; Ishkov, V.V.; Cherniaiev, O.V. Application of polymer flooding to increase oil recovery. IOP Conf. Ser. Earth Environ. Sci. 2024, 1415, 012054. [Google Scholar] [CrossRef]
Disclaimer/Publisher’s Note: The statements, opinions and data contained in all publications are solely those of the individual author(s) and contributor(s) and not of MDPI and/or the editor(s). MDPI and/or the editor(s) disclaim responsibility for any injury to people or property resulting from any ideas, methods, instructions or products referred to in the content. |
© 2025 by the authors. Licensee MDPI, Basel, Switzerland. This article is an open access article distributed under the terms and conditions of the Creative Commons Attribution (CC BY) license (https://creativecommons.org/licenses/by/4.0/).