Article

An Investigation of Water–Heat–Force Coupling During the Early Stage of Shaft Wall Pouring in Thick Topsoil Utilizing the Freezing Method

1
Engineering Research Center of Underground Mine Construction, Ministry of Education, Anhui University of Science and Technology, Huainan 232001, China
2
School of Civil Engineering and Architecture, Anhui University of Science and Technology, Huainan 232001, China
3
State Key Laboratory of Intelligent Construction and Healthy Operation and Maintenance of Deep Underground Engineering, China University of Mining and Technology, Xuzhou 221116, China
*
Author to whom correspondence should be addressed.
Processes 2025, 13(10), 3319; https://doi.org/10.3390/pr13103319
Submission received: 28 August 2025 / Revised: 1 October 2025 / Accepted: 11 October 2025 / Published: 16 October 2025

Abstract

The freezing method is widely employed in the construction of a vertical shaft in soft soil and water-rich strata. As the construction depth increases, investigating the water–heat–force coupling effects induced by the hydration heat (internal heat source) of concrete is crucial for the safety of the lining structure and its resistance to cracking and seepage. A three-dimensional coupled thermal–hydraulic–mechanical analysis model was developed, incorporating temperature and soil relative saturation as unknown variables based on heat transfer in porous media, unsaturated soil seepage, and frost heave theory. The coefficient type PDE module in COMSOL was used for secondary development to solve the coupling equation, and the on-site temperature and pressure monitoring data of the frozen construction process were compared. This study obtained the model-related parameters and elucidated the evolution mechanism of freeze–thaw and freeze–swelling pressures of a frozen wall under the influence of hydration heat. The resulting model shows that the maximum thaw depth of the frozen wall reaches 0.3576 m after 160 h of pouring, with an error rate of 4.64% compared to actual measurements. The peak temperature of the shaft wall is 73.62 °C, with an error rate of 3.76%. The maximum influence range of hydration heat on the frozen temperature field is 1.763 m. The peak freezing pressure is 4.72 MPa, which exhibits a 5.03% deviation from the actual measurements, thereby confirming the reliability of the resulting model. According to the strength growth pattern of concrete and the freezing pressure bearing requirements, it can provide a theoretical basis for quality control of the lining structure and a safety assessment of the freezing wall.

1. Introduction

Vertical shaft construction plays a crucial role in mineral resource extraction, underground transportation and national defense, energy storage, and underground space development. Therefore, the stability of the shaft walls directly affects the safety and efficiency of underground engineering. The vertical shaft freezing method is the primary technique employed in the construction of vertical shafts through thick topsoil layers [1,2], where artificial strata freezing [3,4] acts as a safety barrier for traversing unstable strata. During the construction period of the deep shaft, the freezing wall created an unfavorable low-temperature environment for the concrete of the shaft wall [5]. The hydration heat of the concrete caused the freezing wall to melt and thin and also resulted in a significant temperature difference between the interior and exterior of the shaft, which was the primary cause of cracks in the shaft wall [6,7]. The freezing wall thawing process induced by the heat of hydration is an important factor affecting the safety of a project [8,9]. The hydrothermal coupling analysis of frozen walls and shaft walls has always been a key research issue in the field of frozen drilling; for example, Levin [10] thermally monitored the thawing of a freezing wall during the excavation of a shaft in a potash mine and analyzed the effects of the heat of hydration of the concrete on the depth of thawing of the freezing wall and the freezing pressure, which provided great possibilities for controlling and optimizing mining operations. Hu [11,12] and Wu [13] derived an analytical solution for the artificial freezing temperature field through theoretical analysis and established an analytical theory for freezing wall temperature measurement, which provides a theoretical basis for the design of freezing walls. Yu [14] studied the evolution of early-stage temperature stresses on the inner wall after concrete pouring and developed a mechanical model that considers thermo-mechanical coupling conditions, providing theoretical support for predicting the timing and location of early-stage cracks in shaft walls constructed using the freezing method. Wang [15] studied the coupling of cement hydration and permafrost during drilling construction in the Arctic region and investigated the distribution law of temperature, ice water content, and other physical quantities of permafrost under the heat of cement hydration through numerical simulation. Chen [16] and Hani et al. [17] studied the influence law of the heat of hydration of concrete on the temperature field of a frozen wall and explored the strength and stability of the frozen wall during the construction period. Zhang [18] investigated the interaction between the temperature field of a shaft wall and the temperature field of a freezing wall during freezing by establishing a physical similarity simulation test of an engineering prototype and verified the results of the model test in combination with actual measurements. Zhang et al. [19] studied the coupled evolution law of multiple fields during freezing and excavation through numerical simulation methods and obtained the variation in the temperature field of a frozen wall. Yang [20] and Yan [21] established hydrothermal coupling based on the porous medium method, simulated the freezing process of soil, and studied the temperature evolution, water migration, and frost heaving deformation of the frozen wall to explore the freezing law of deep wells. Wang [22] employed a combined approach of field monitoring results and numerical simulation to investigate the mechanism by which concrete hydration heat influences the temperature field of permafrost surrounding cast-in-place piles as well as the impact of different construction seasons on the boundary conditions of the pile side and the temperature field of permafrost. He analyzed the distribution law of the pile-soil temperature field in time and space as well as the boundary conditions of the pile side and the temperature field of permafrost in the construction season.
The above research has achieved important results in the thermo-hydraulic coupling of frozen walls, but existing studies have mostly focused on the thermo-hydraulic coupling issues during the freezing period, neglecting the safety impact of the lining pouring during the construction period on the frozen wall. Furthermore, the evolution of the temperature field also affects the strength and safety of the lining. High-performance concrete used in large-volume casting exhibits characteristics such as intense early reactions, rapid release of hydration heat, and high temperature rises. These characteristics have a significant impact on the freezing wall and are an important factor that cannot be ignored in the water–thermal–mechanical multi-field coupling analysis of freezing method construction. Given this, a three-dimensional analysis model coupling the thermal, hydraulic, and hydrothermal fields with temperature and soil relative saturation as unknown variables was established based on heat transfer in porous media, unsaturated soil seepage, and frost heave theory. The coupled equations were solved using the coefficient-type PDE module in COMSOL Multiphysics 6.1 (COMSOL Inc., Burlington, MA, USA) for secondary development. Taking the field temperature and frost heave force monitoring data analysis of the vertical shaft freezing construction of the Wanfu Coal Mine in the Juye Coalfield, Shandong Province, as an example, the model parameters were determined and set, revealing the evolution mechanism of the freezing and thawing of the freezing wall and the freezing pressure, thereby providing theoretical and technical support for the safety of freezing method construction in underground engineering.

2. Data Analysis of Field Measurements

Wanfu Coal Mine is located in the Juye Coalfield in southwestern Shandong Province, China, as shown in Figure 1. It uses a vertical shaft development method and has a designed production capacity of 180 MT/a. The auxiliary shaft is constructed using the freezing method, and the vertical shaft crossing the topsoil layer has the following characteristics:
(1)
The thickness of the loose layer of the Quaternary (Q) and Neoproterozoic (N) deposits is large, reaching 780 m, and the proportion of clay is high and expansive, especially the thick clay layer in the lower part of the Neoproterozoic (N), which is semiconsolidated and has a low water content, which is unfavorable for the freezing construction of the shaft.
(2)
The loose Quaternary (Q) layer is 119.45–163.70 m thick, with an average thickness of 139.27 m. It is divided into two sections. The upper section is mainly composed of brownish-yellow, yellowish-brown clayey sand and sandy clay interspersed with fine sand and thin layers of medium sand. It is loose, has good water permeability, and is the main aquifer of the Quaternary system. The lower section is mainly brownish-yellow, gray–green, light purple–red sandy clay; clay; sand with clayey sand; and lenticular silt, and at the bottom, there is a layer of clay containing iron and manganese nodules and ginger stones, with good water insulation, alluvial river, and lake deposits; it is not integrated into the Neoproterozoic system (N).
(3)
The thickness of the Neogene series (N) ranged from 483.00 to 650.75 m, with an average of 575.46 m. According to its physical characteristics, the upper section is divided into two sections: the upper section is 213.60–307.10 m thick, with an average of 574.46 m. The upper section is dominated by thick layers of brownish-yellow and light-red clays and sandy clays interspersed with silty sand, fine sand, and clay-like sand, which are loose, unconsolidated, and locally microconsolidated. The lower section is composed of grayish-green, brownish-yellow fine sand; silty sand; and clayey silty sand mixed with light purple clay, which is the main water-bearing section of the upper Tertiary System. The clay layer contains blocky, plate-like, and crystalline cluster-like gypsum, unconsolidated, locally slightly consolidated, or semiconsolidated. Clay and sandy clay are prone to absorb water and swell. The sand layer is loose and fluid. The lower section is 189.40–377.30 m thick, with an average thickness of 310.33 m. It is mainly composed of thick layers of grayish-green and brown clays and sandy and silty sandy clays, with thin layers of silty sand and fine sand in some areas. It is semiconsolidated and locally unconsolidated. Clay and sandy clay have water absorption ability and plasticity. At the bottom are layers of clay and clayey sand and gravel containing more calcareous nodules or gravel, which are not integrated into the underlying strata.
(4)
The loose Quaternary (Q) layer is unconsolidated and consists mainly of soft plastic clay, sandy clay, loose powder sand, and fine sand layers. The loose layer of the Neoproterozoic system (N) is semiconsolidated, with hard plastic clay, soft plastic clay and expansive clay, calcareous clay, and sand layers; the sand layer is loose and mobile. The thicknesses of the upper and lower sand layers are large; the thickness of the clay layer is large, and it is interspersed with massive and columnar gypsum crystals, which easily disintegrate and loosen when it meets with water.
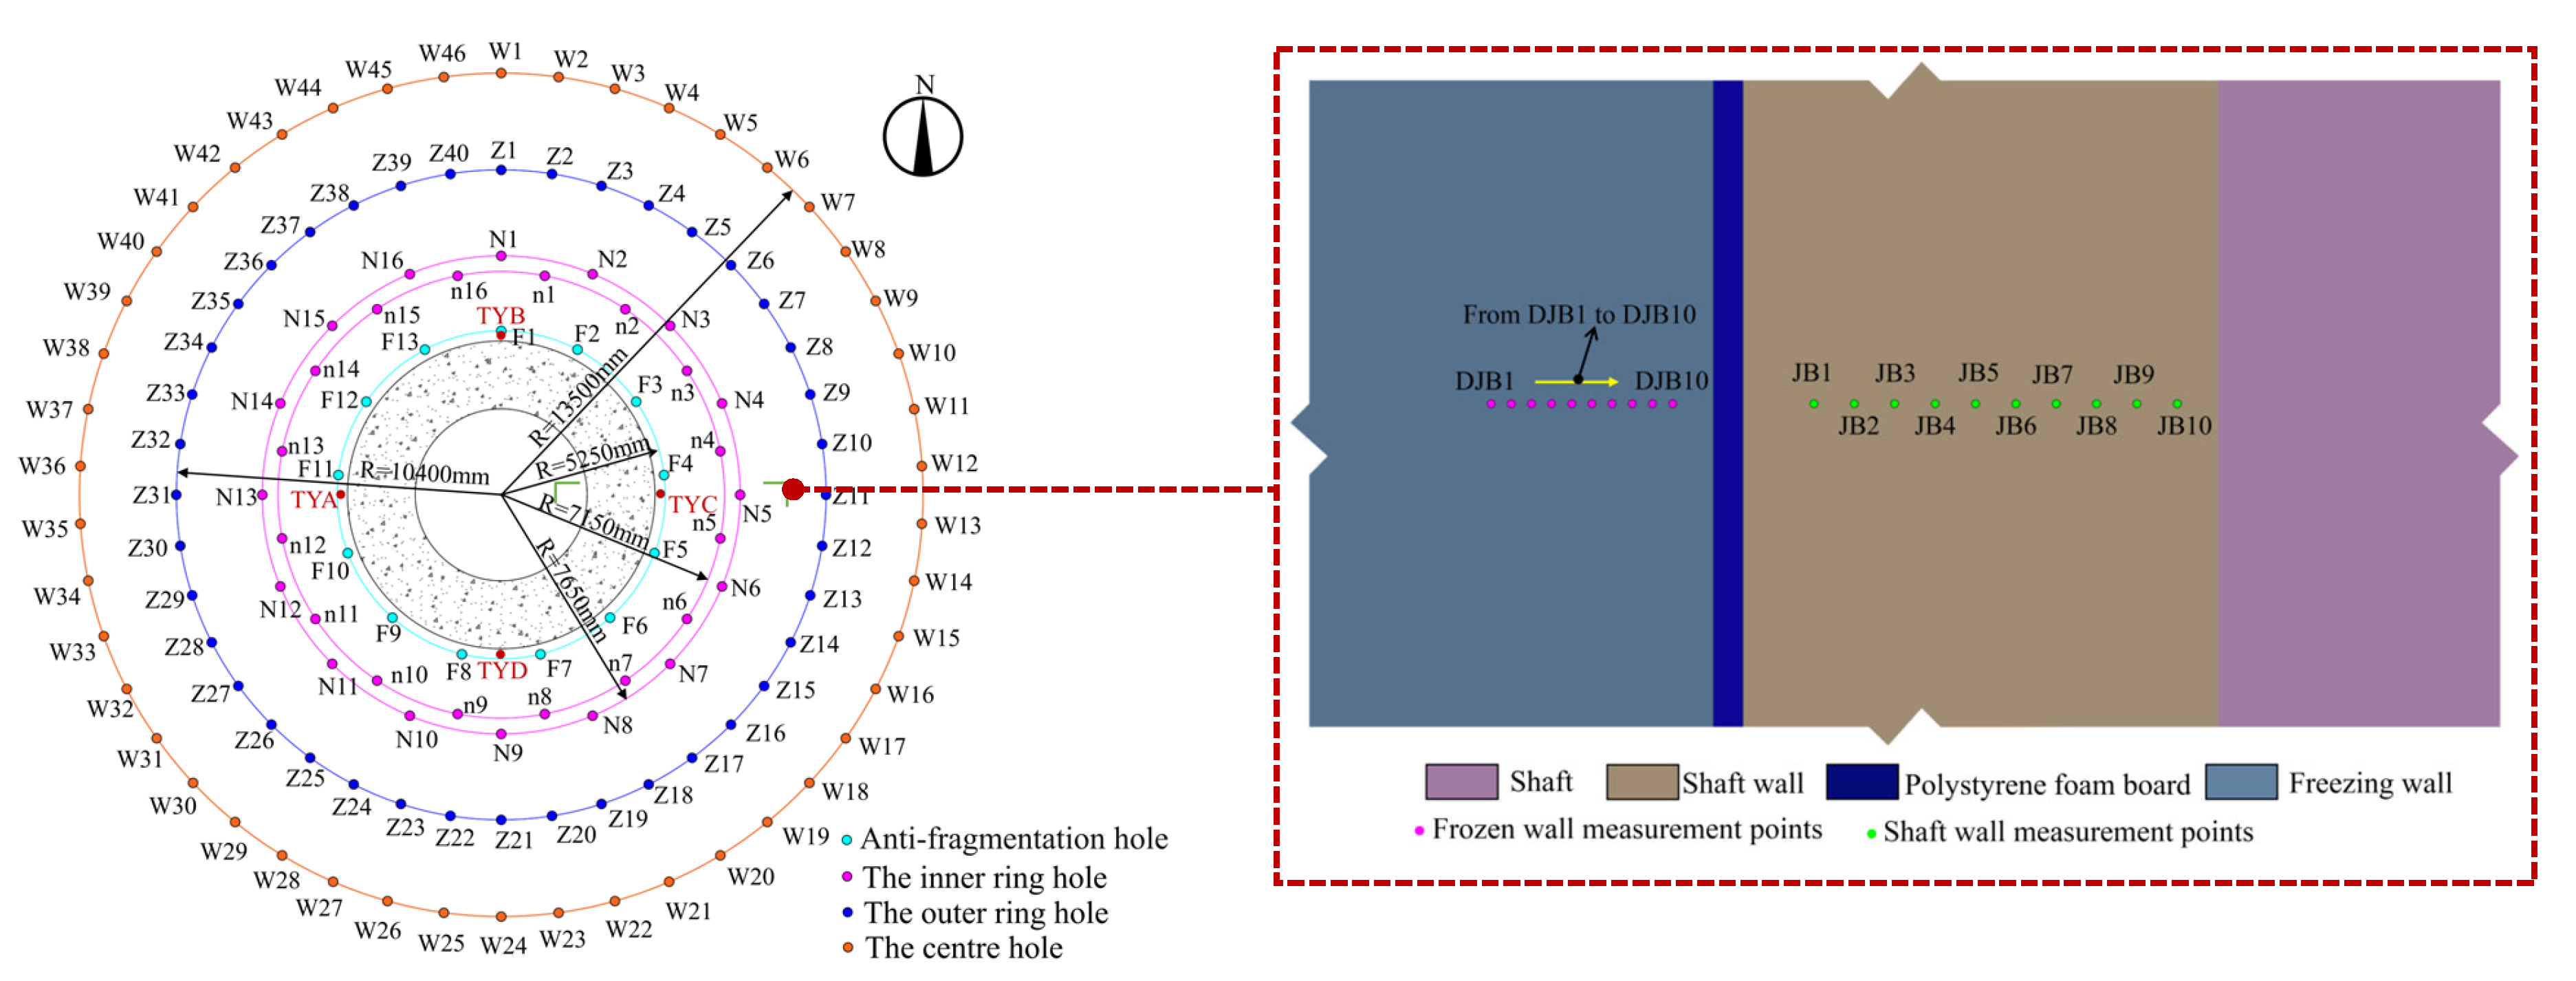
The freeze hole positions are shown in Figure 2, arranged in four circles. The anti-fragmentation hole ring diameter is 10.5 m, with 13 holes with hole depths of 342 m. The inner ring has an inner diameter of 14.3 m, with 16 holes, while the outer ring has an outer diameter of 15.3 m, with 16 holes, and a hole depth of 783 m. The diameter of the central hole ring is 20.8 m, with 40 holes divided into long and short legs with depths of 894 m and 783 m, respectively. The diameter of the outer ring hole is 27 m, the depth of the hole is 775 m, and there are 46 holes. The anti-fragmentation hole and inner ring hole share a single brine system, while the middle ring hole and outer ring hole have separate brine systems.
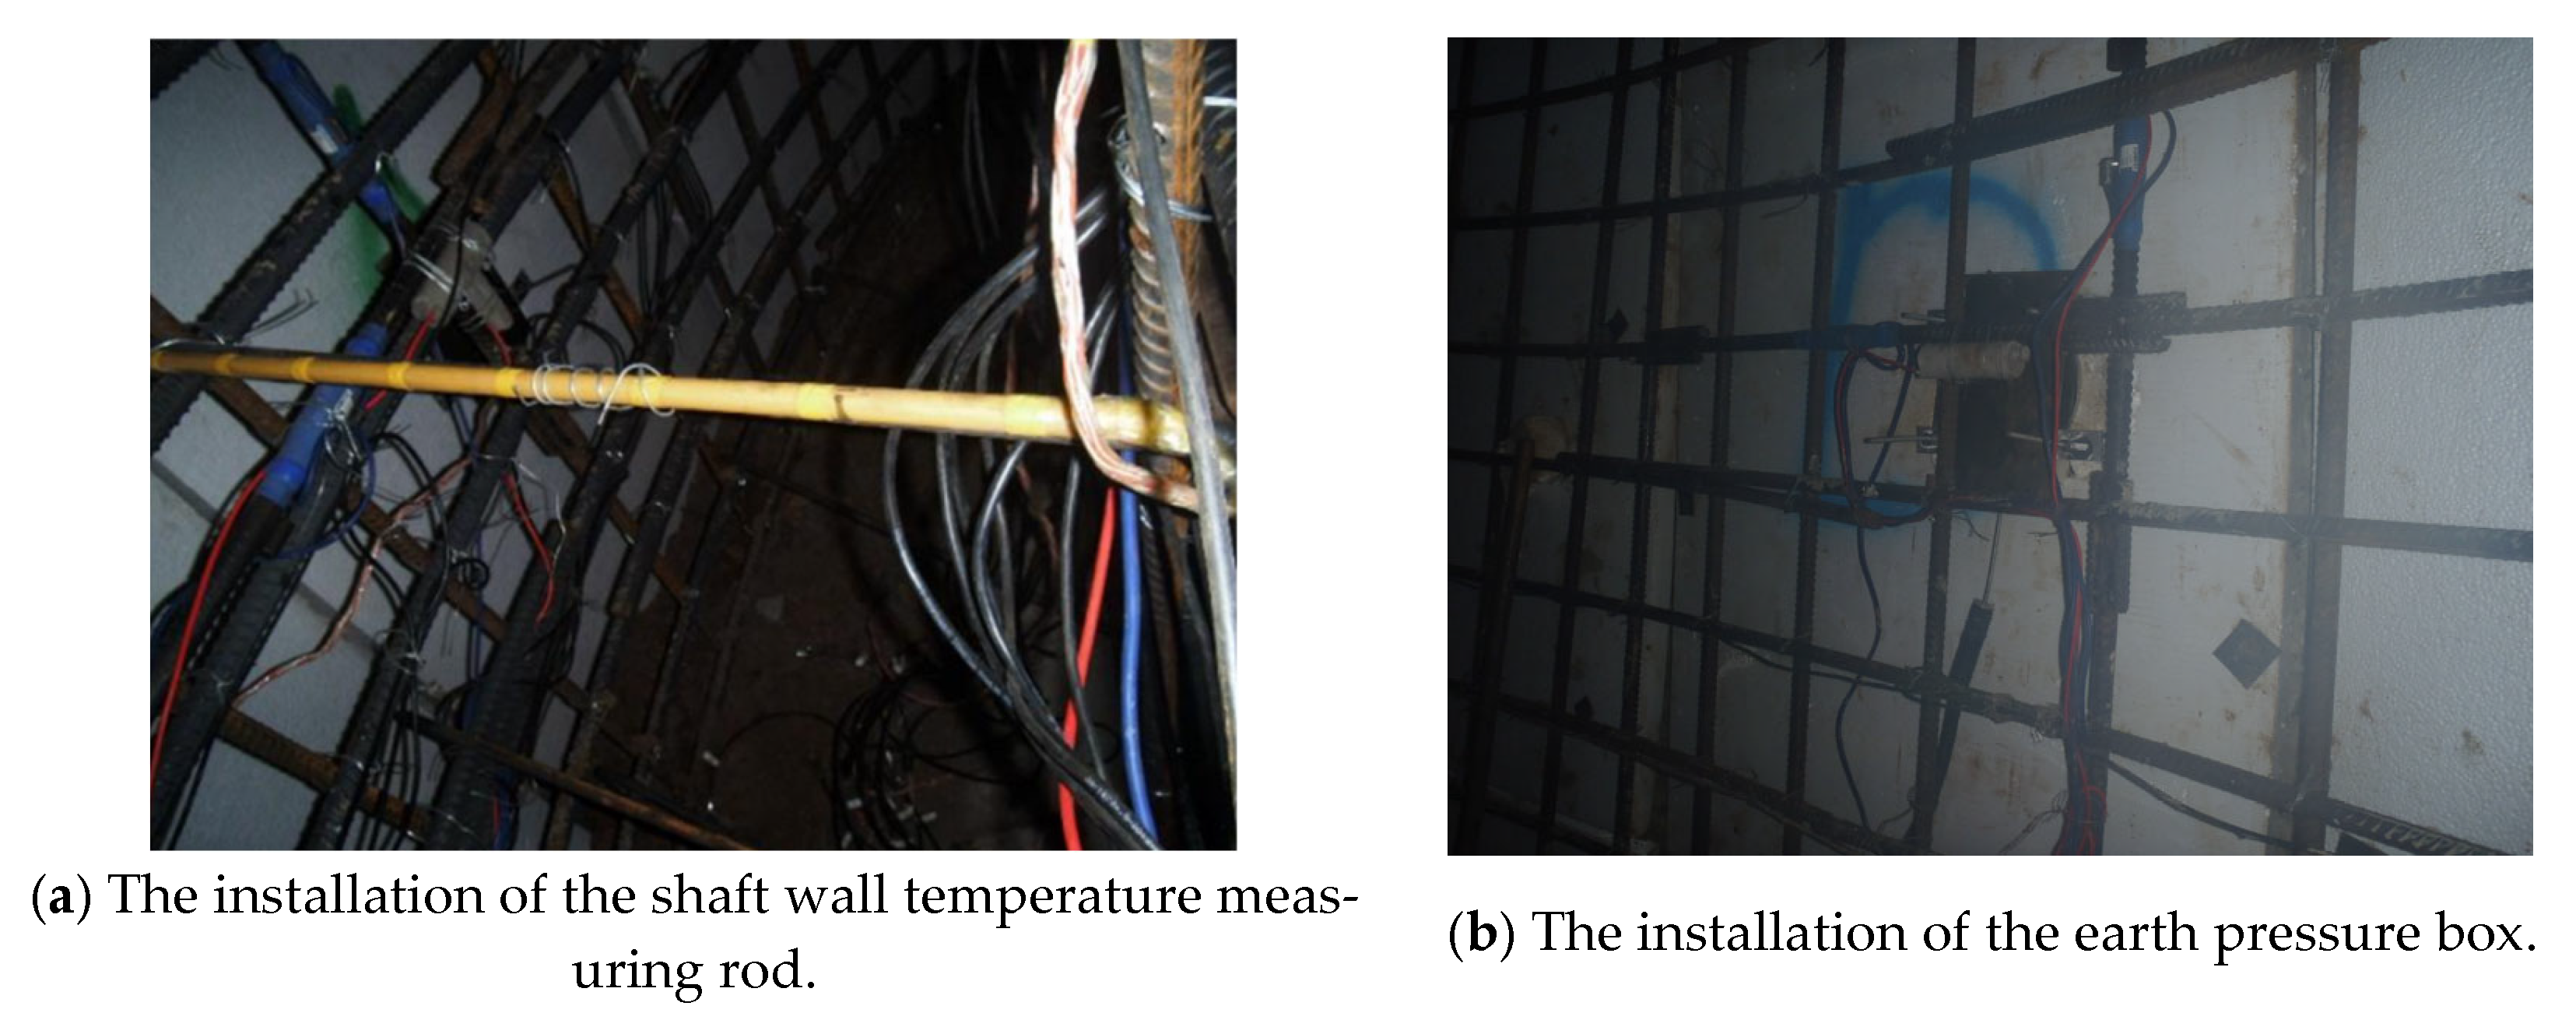
To investigate the impact of the hydration heat of high-performance concrete lining on the frozen wall, four key layers were selected for real-time monitoring below a depth of 200 m: ( depth: 627.5 m, clay; depth: 661.5 m, sandy clay; depth: 693.5 m, clay; depth: 732.5 m, fine sand, lining thickness 1.175 m, CF80). The measurement point layout is shown in Figure 2. Four temperature measurement points were arranged radially along the lining and frozen wall in the west, north, east, and south directions, respectively, and were labeled A, B, C, and D; each temperature measurement rod had 10 measurement points spaced at equal intervals, which were numbered JB1 to JB10 and DJB1 to DJB10, respectively. The soil pressure box was set up in the west, north, east, and south directions as TYA, TYB, TYC, and TYD, respectively; the measurements of on-site temperature and the installation of the earth pressure box are shown in Figure 3.

Temperature Field Evolution Law of Shaft Wall Concrete

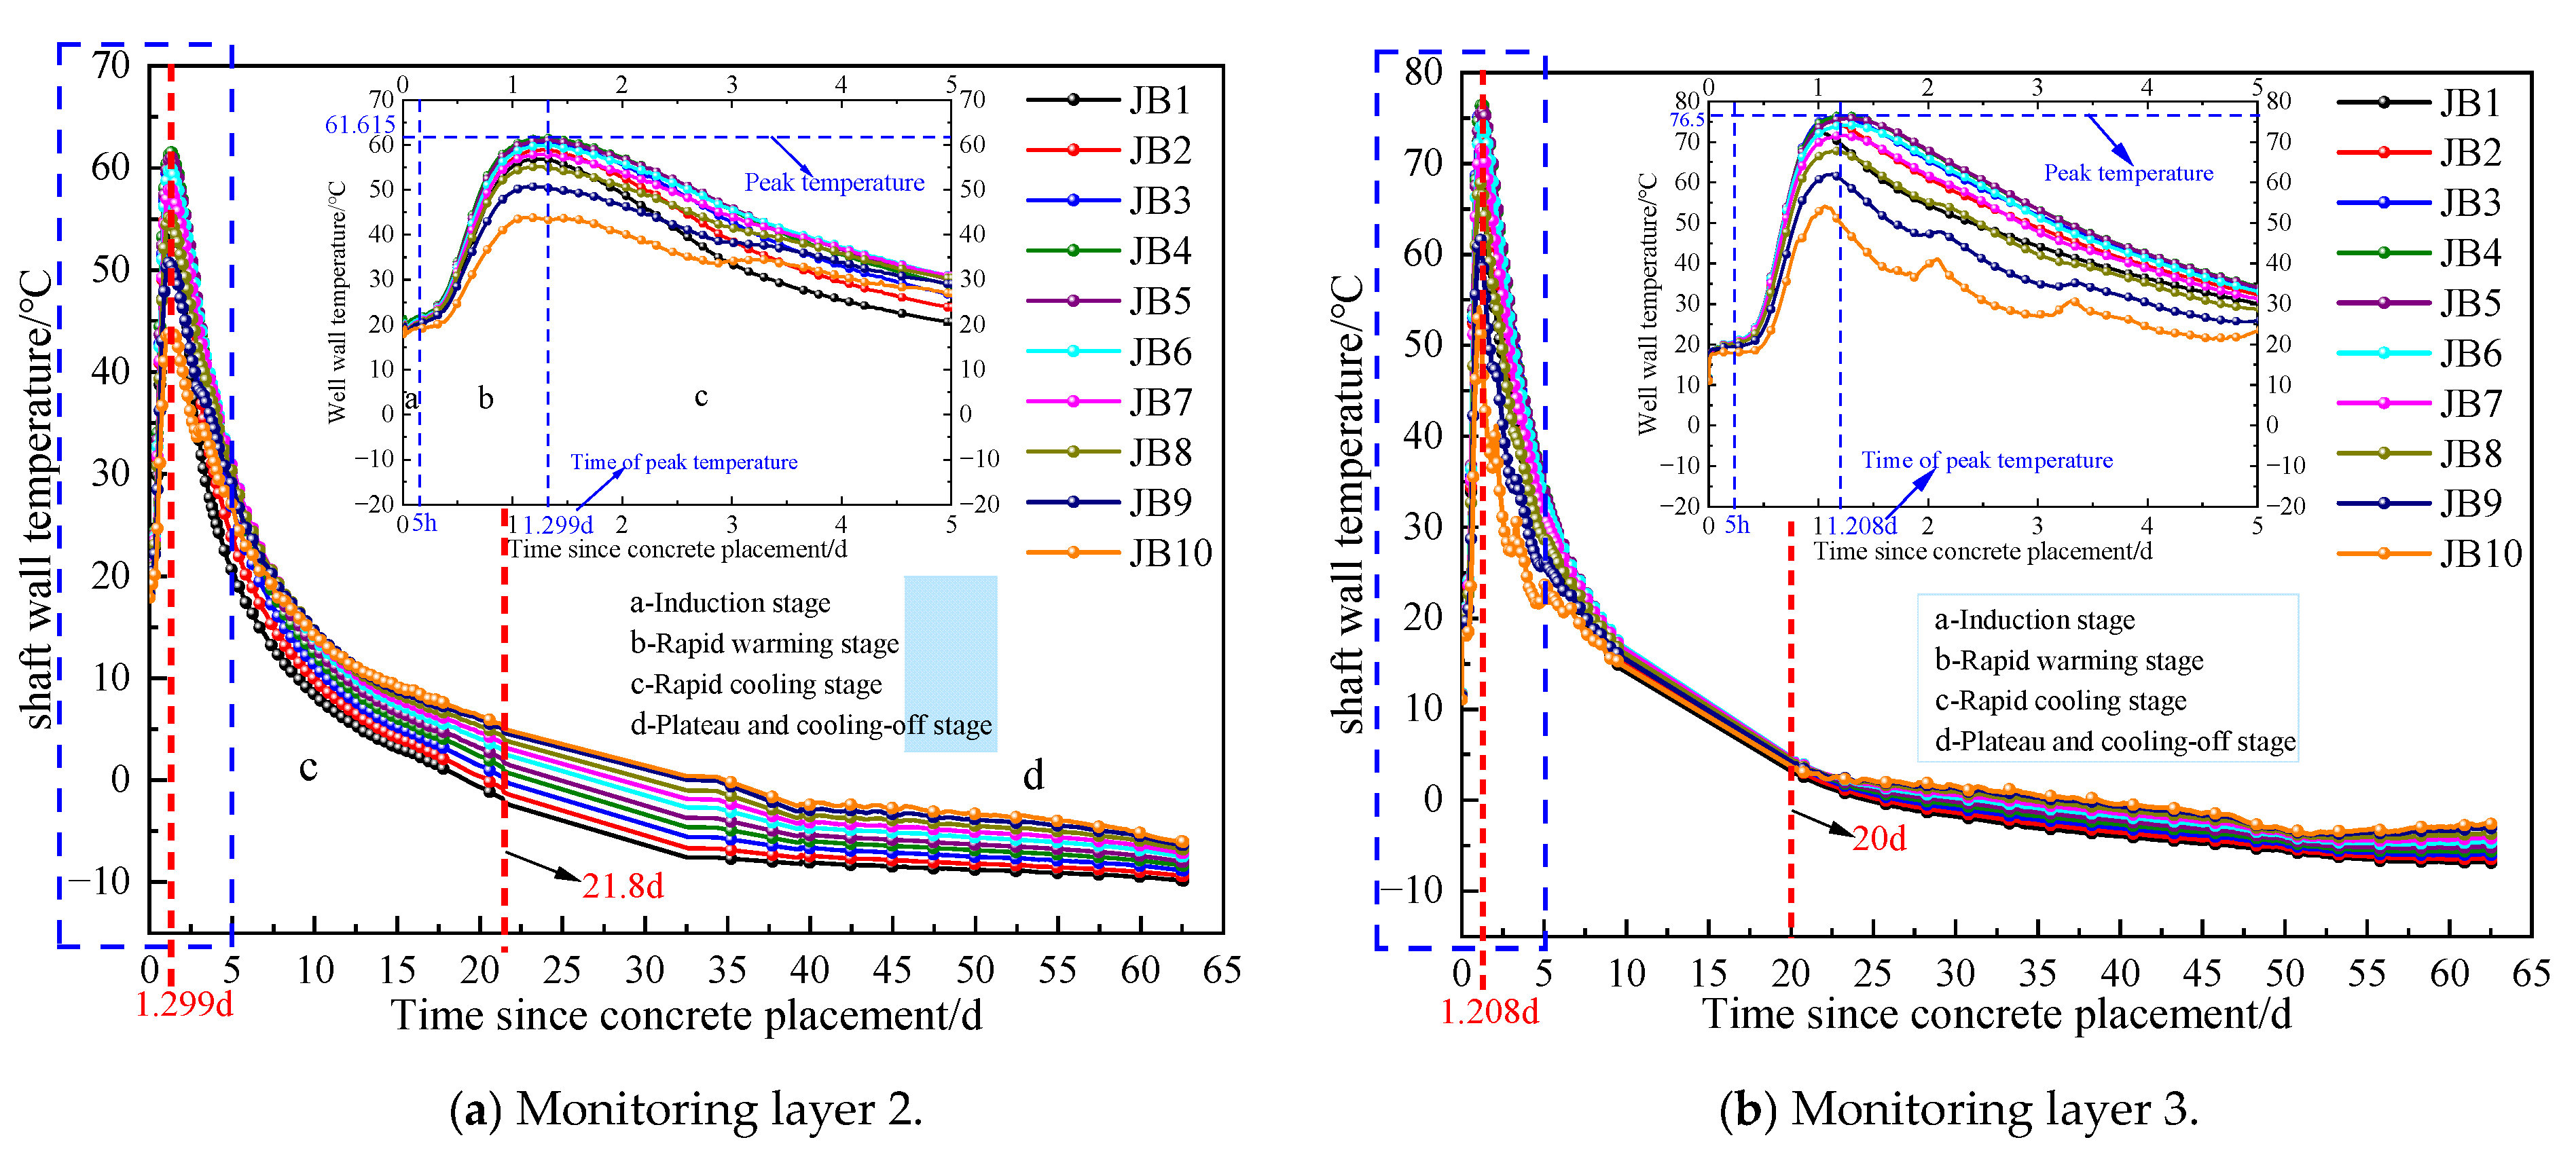
The monitoring data of the temperature field of the concrete lining shows that all monitoring layers of the shaft wall lining exhibit the same evolutionary pattern. Figure 4 shows the curves of the actual measured shaft wall temperature over time. The peak temperature of the shaft wall lining was reached approximately 1.3d after pouring (2nd and 3rd layers). From the overall data of each monitoring layer, the peak temperature and the time it reaches peak temperature are positively correlated with the thickness of the lining and the initial pouring temperature. The development patterns of the temperature field in the shaft wall lining were summarized as follows: After the steel fiber concrete lining was poured, it underwent a hydration induction period lasting approximately 0–5 h; subsequently, the rate of hydration heat released gradually accelerated, causing the temperature of the shaft wall lining to rise rapidly until it reached its peak temperature, marking the rapid heating phase. After the peak of hydration heat released, the heat released decreased, and the temperature then dropped rapidly due to continuous heat input. The hydration reaction of the concrete weakened, marking the rapid cooling phase; finally, it entered a steady cooling phase until it stabilized, marking the steady cooling phase.
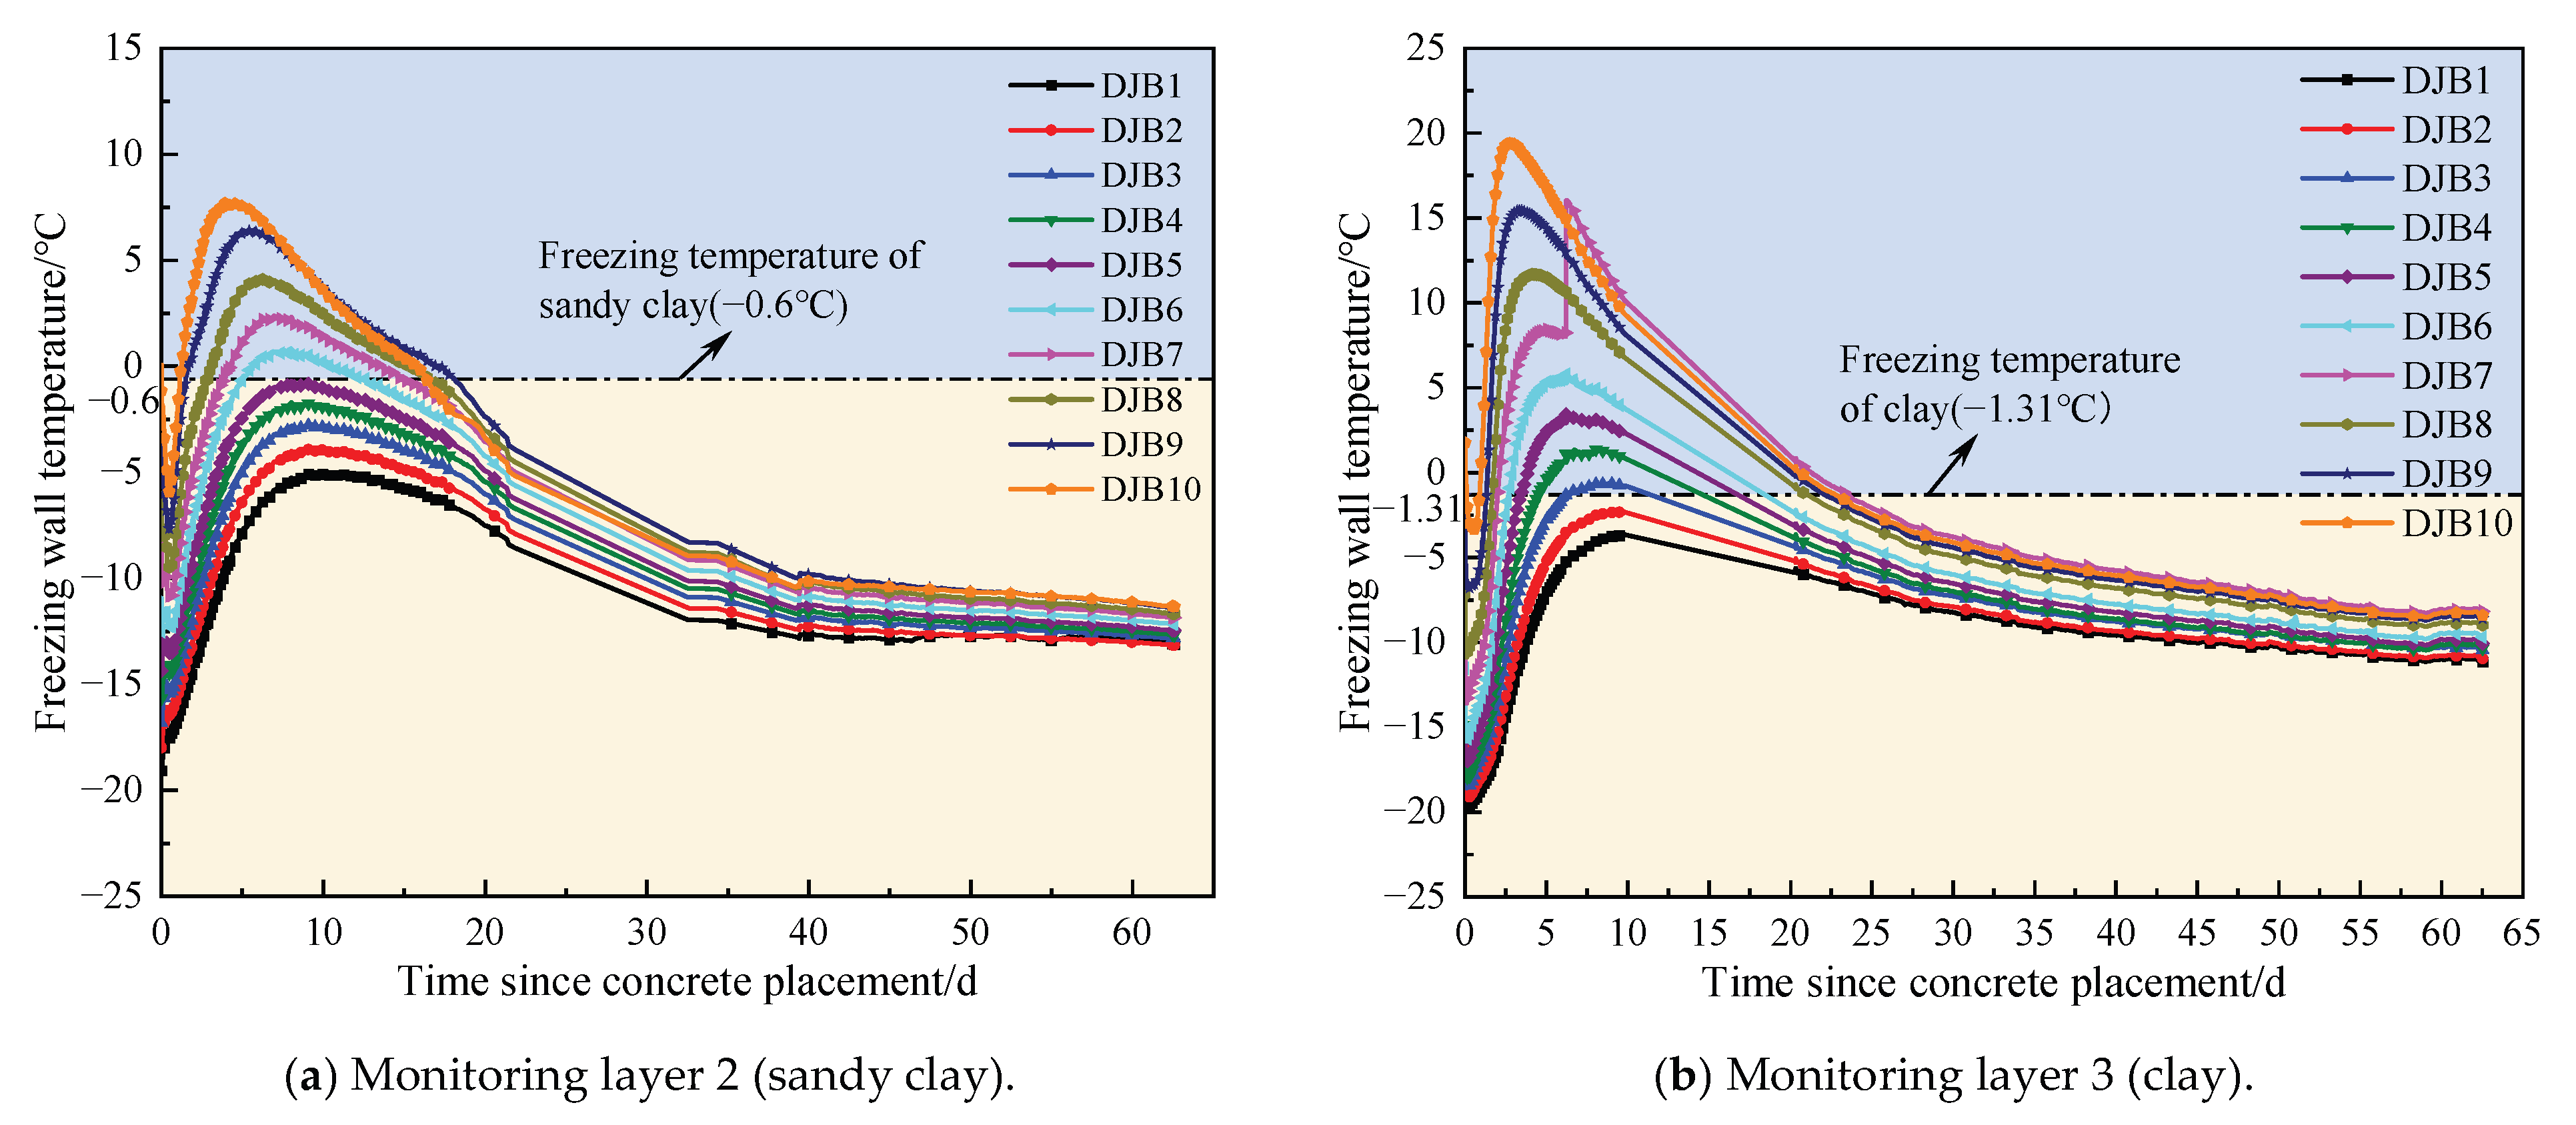
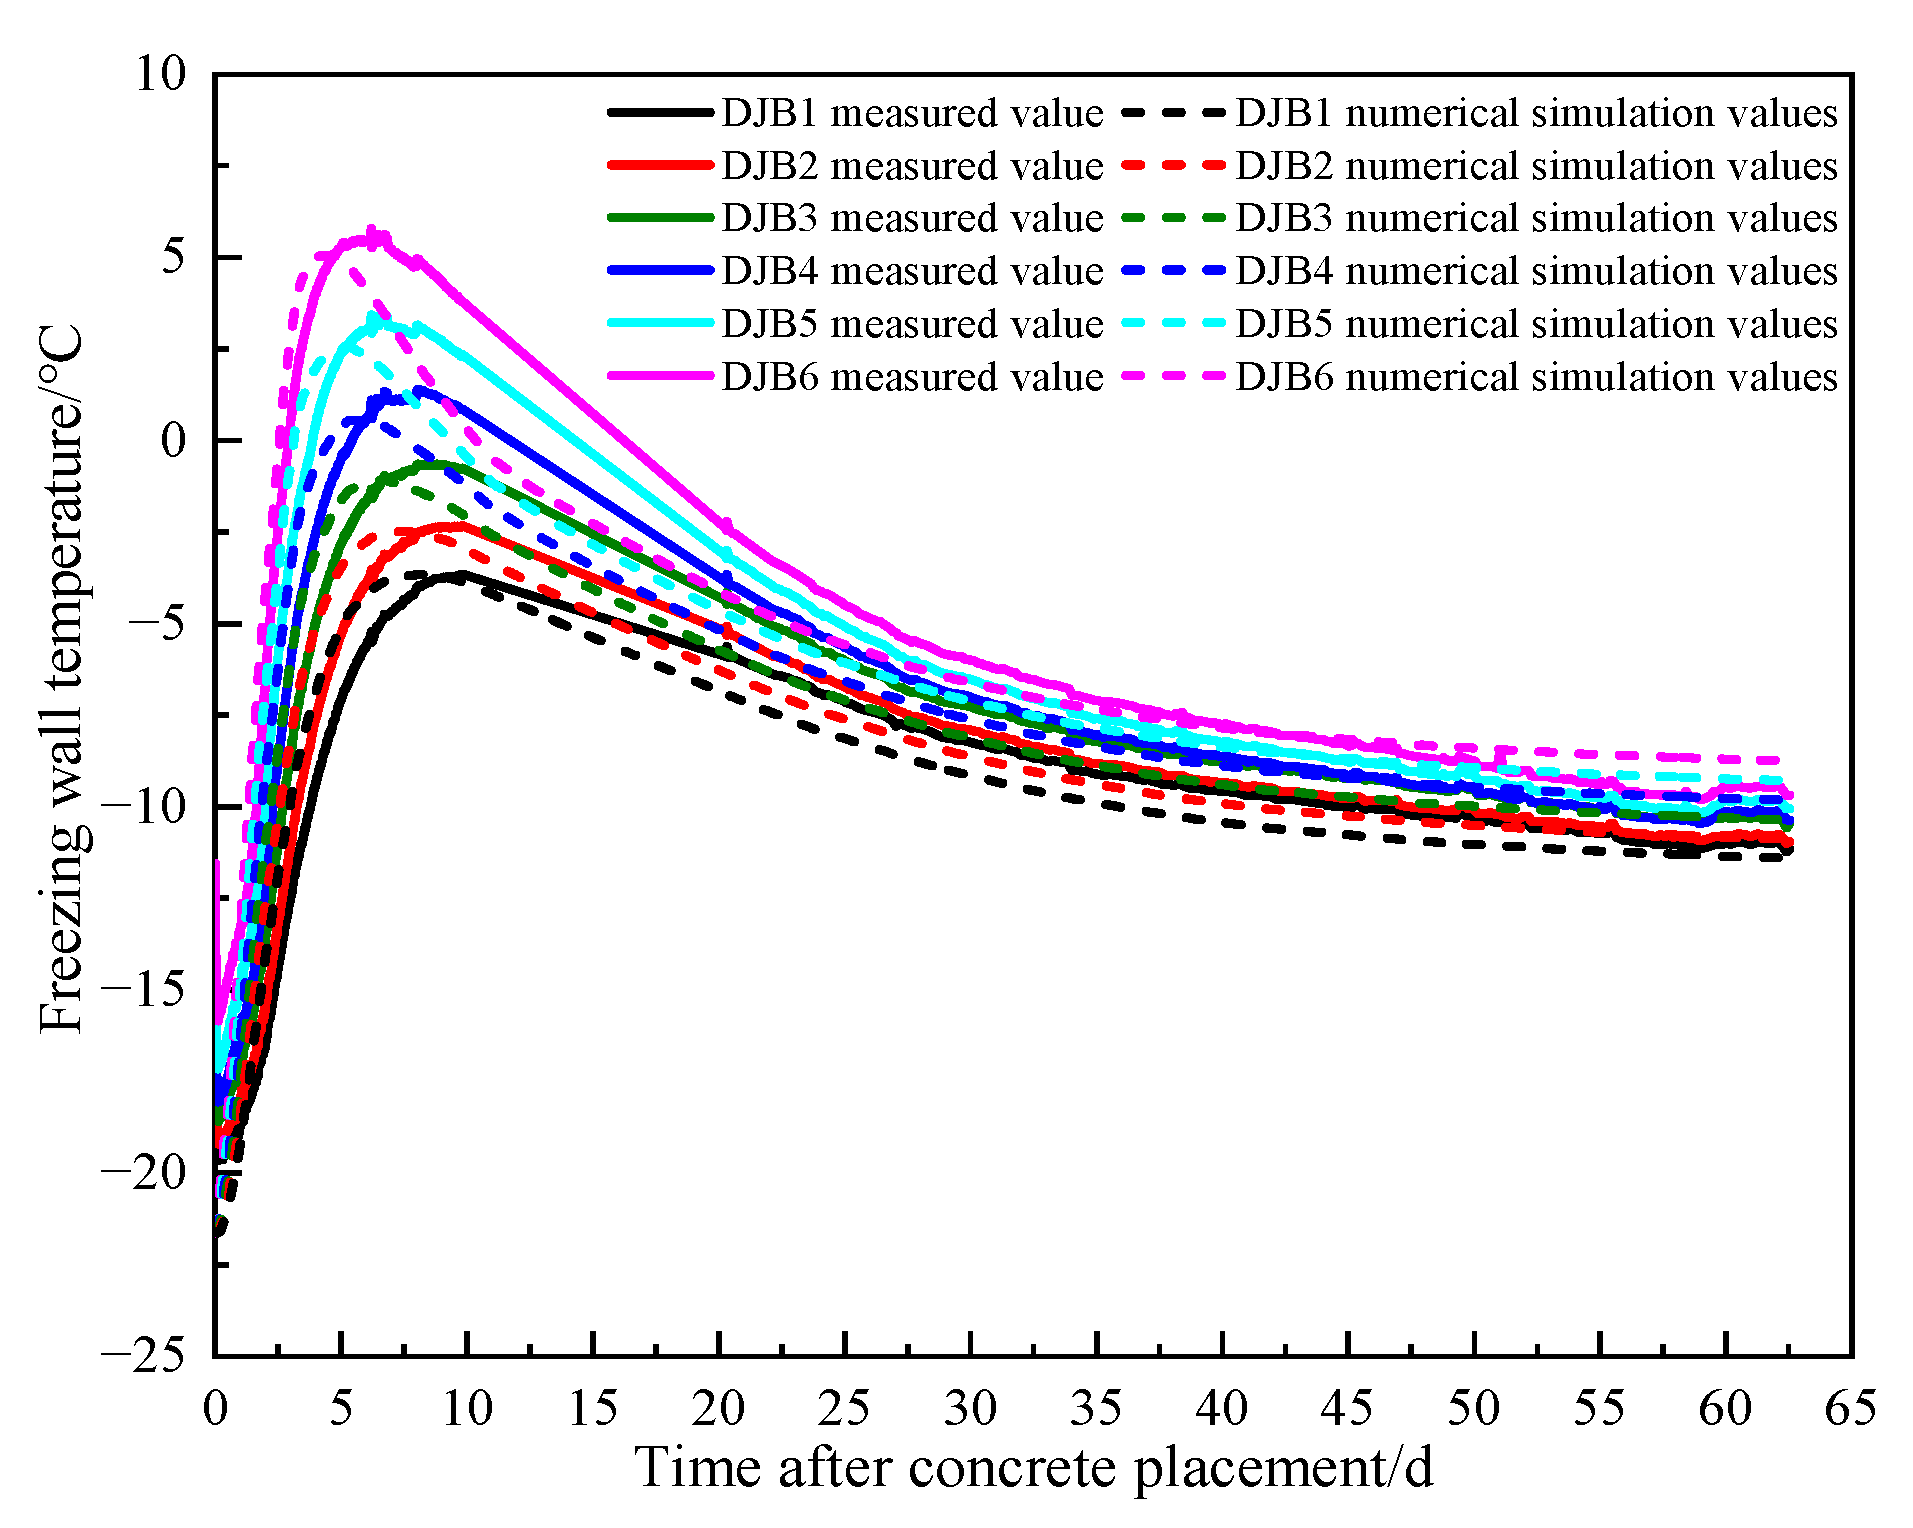
The curves showing the changes in the temperature of the frozen wall over time, as measured on-site, are shown in Figure 5 (2nd and 3rd layers); the time taken for measurement points DJB1 to DJB10 to reach peak temperature showed a decreasing trend, indicating that hydration heat has a significant impact on the temperature distribution of the frozen wall. The experimental results showed that the freezing temperature of sandy clay was −0.6 °C and that of clay was −1.31 °C, which can be used to determine the thawing range of the frozen wall. Approximately 10 d after concrete pouring, the frozen wall rapidly warmed up; the peak temperature of the second layer DJB5 was −0.7 °C, below the freezing temperature, while the temperature of DJB6 was 0.8 °C, above the freezing temperature. Therefore, the thawing range was between DJB5 and DJB6. The peak temperature of the third monitoring layer DJB2 was −2.3 °C, and the temperature of DJB3 was −0.6 °C, with the thawing range between DJB2 and DJB3. The maximum thawing depth of the second layer was around 8 d, and that of the third monitoring layer was around 7 d; furthermore, the thawing depth of the clay layer in the third layer was greater than that of the sandy clay layer in the second layer. The disparity in thawing behavior between clay layers and sandy clay layers stems fundamentally from their differing particle composition, structural configuration, and water migration capacity. Clay layers possess a lower thermal conductivity and higher volumetric heat capacity, resulting in slower heat transfer yet superior heat storage capability. This facilitates heat accumulation near the borehole wall, yielding characteristics of thorough thawing with shallow penetration depth and steep temperature gradients. Their extremely low permeability impedes the drainage of thaw water, frequently inducing high pore water pressure at the freeze–thaw interface. This reduces the effective stress within the soil, significantly softening its strength and making it more susceptible to plastic deformation or thaw settlement [23,24]. In contrast, sandy clay layers exhibit superior thermal conductivity but lower volumetric heat capacity. Heat transfers rapidly and requires less energy for temperature elevation. Consequently, under identical hydration heat sources, the thawing front in sandy clay layers may advance more swiftly, forming a thicker thawed zone within the frozen wall but with a gentler temperature gradient. Their favorable permeability allows thaw water to migrate freely, preventing the accumulation of pore water pressure; soil strength recovers more rapidly, with deformation primarily manifesting as stable drainage consolidation rather than abrupt thaw settlement [25]. This provides a degree of support to the wellbore, offering relative structural safety advantages. As the heat of hydration decreased, the temperature of the freezing wall began to drop, cold energy continued to be input into the freezing hole, and the freezing wall began to refreeze; at around 17 d, the temperature at monitoring point DJB10 in the second monitoring layer dropped to the freezing temperature, and at around 23 d, monitoring point DJB10 in the third monitoring layer began to refreeze.
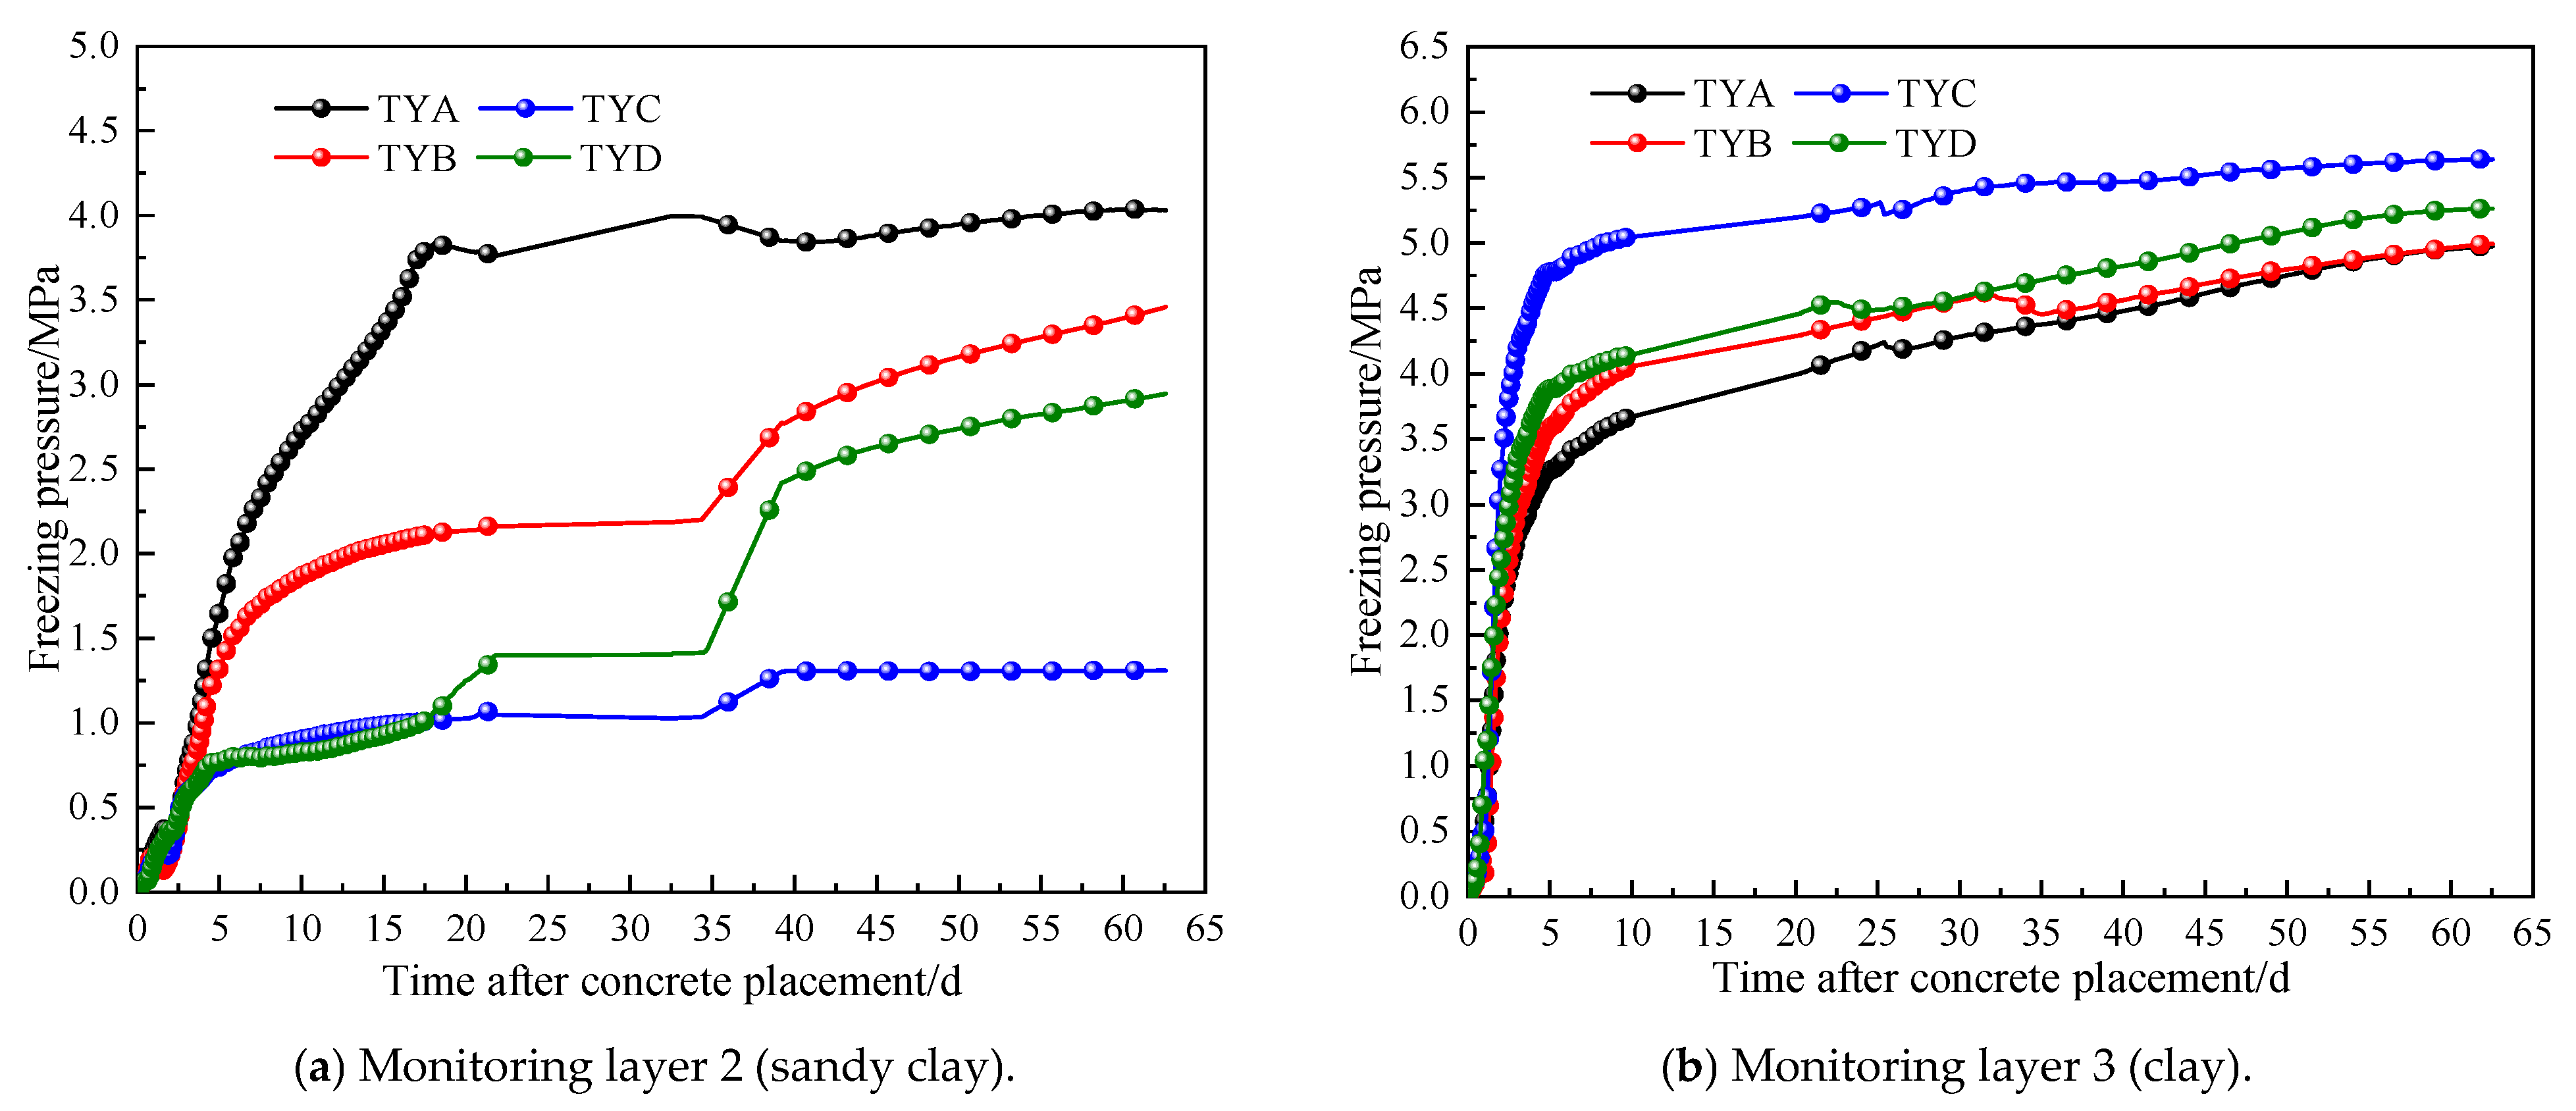
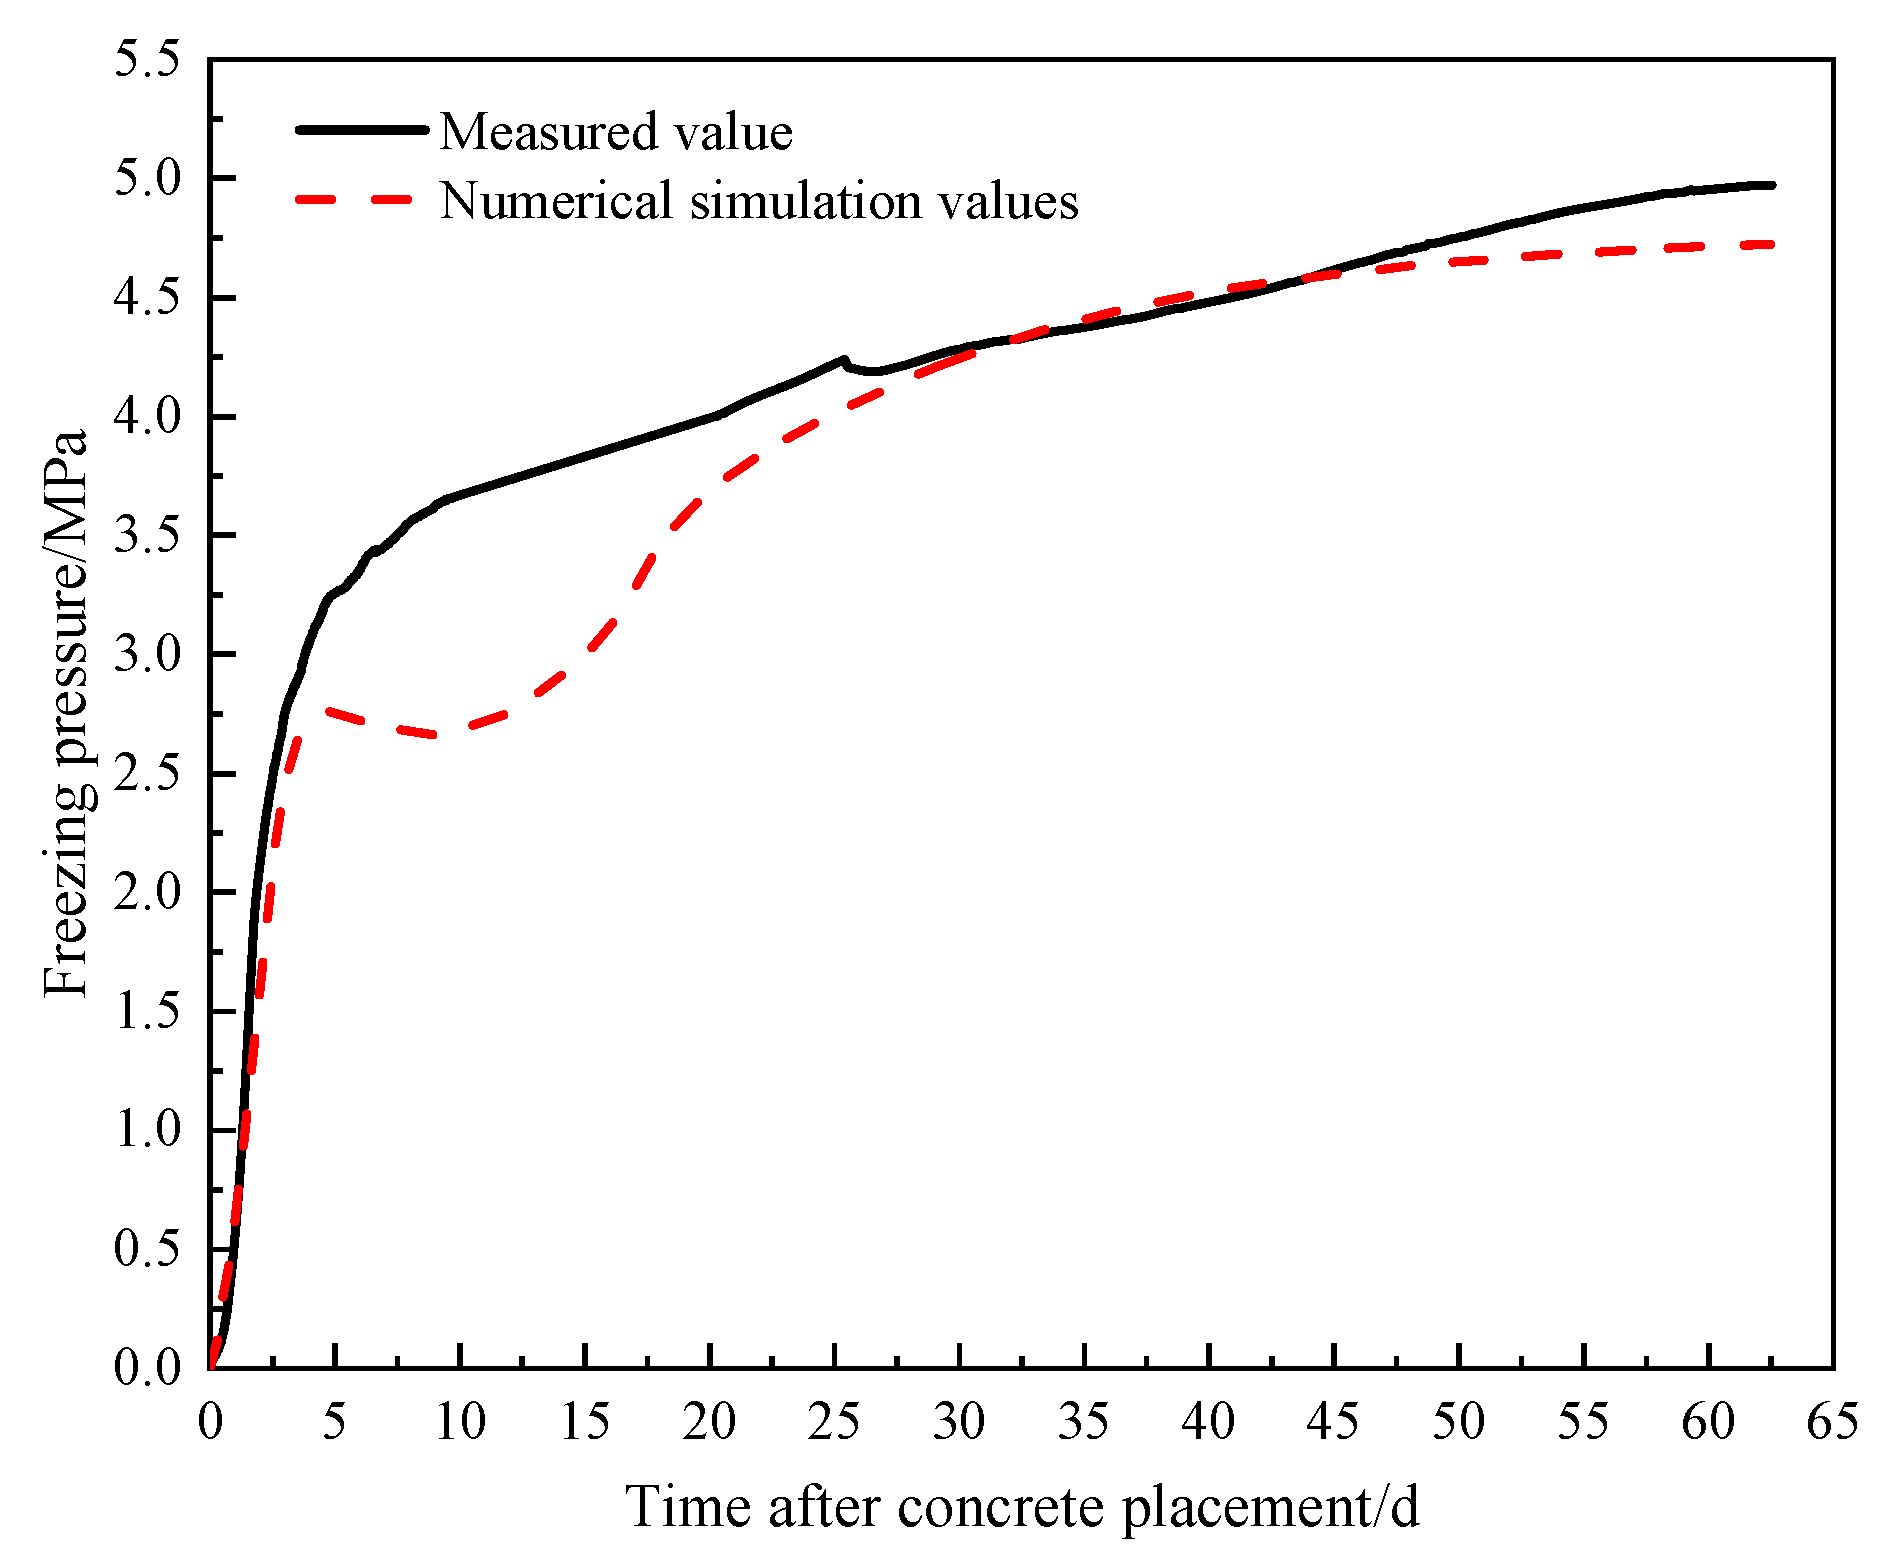
Freezing pressure is the primary load borne by the shaft wall lining during the freezing period; the partial on-site measured freezing pressure versus time curve is shown in Figure 6 (2nd and 3rd layers). The second monitoring layer showed a rapid increase in freezing pressure 7.5 d after masonry, reaching a stable trend at around 50 d. The third monitoring layer entered a rapid growth phase in freezing pressure 6.2 d after masonry, reaching a peak at around 60 d. The empirical value for bearing earth pressure in the frozen wall design is 0.013 H [26], while monitoring data showed that the ratio of the peak frozen pressure to the design bearing capacity is approximately 0.5 for the second layer and approximately 0.6 for the third layer. Given that formwork removal occurs early in the construction of vertical shafts using the freezing method, the early strength of the outer wall concrete is extremely important for ensuring the safety of the shaft lining.

3. High-Strength Concrete CF80 Thermal Insulation Temperature Rise Test

3.1. Experimental Steps

Taking high-performance steel fiber concrete CF80 as an example, polystyrene foam boards with a density greater than 15 kg/m3 were used as the insulation layer (approximating an adiabatic environment), concrete specimens measuring 420 × 420 × 440 mm were cast, and the adiabatic temperature rise changes during the early-age period were measured. Figure 7 shows the entire experimental process.

3.2. Analysis of Experimental Data

The measured temperature is shown in Figure 8. The first 0 to 10 h after concrete pouring was the induction period, during which the hydration temperature rose slowly; from 10 to 25 h, the temperature rose rapidly as the hydration reaction intensified, releasing internal heat rapidly and reaching the highest adiabatic temperature increase. From 25 to 40 h, the temperature rose slowly as the hydration reaction slowed down, the rate of temperature increased dropped rapidly, and the internal temperature reached its highest value; after 40 h, the temperature remained relatively stable, with a slight downward trend in the later stages.

3.3. Determination of Parameters

There are numerous factors that influence the hydration heat of concrete [27], including the composition and quantity of cementitious materials and mineral admixtures as well as the water-to-cement ratio; relevant studies have pointed out that the function of concrete hydration heat as a function of time mainly includes exponential, hyperbolic, and composite exponential types. Regression analysis of actual measurement data showed that the composite exponential type had a high degree of conformity.
θ t = θ 0 1 e a t b
θ 0 = Q 0 W C c ρ c
where θ 0 is the adiabatic temperature rise, °C; a and b are constant coefficients; t is the age, h; Q 0 is the cumulative hydration heat generated per unit of cementitious material, kJ/kg; W is the amount of cementitious material used per unit volume of concrete, kg/m3; C c is the specific heat, kJ/(kg·°C); and ρ c is the density, kg/m3.
The concrete employed in the on-site works was high-performance steel fiber-reinforced concrete CF80. CF80 concrete adopted P.O52.5 Portland cement with rapid early strength development, which can enable large-volume well wall concrete to quickly acquire load-bearing capacity, thereby shortening the safety risk period due to its own insufficient strength under the protection of frozen walls. The numerical model developed herein specifically addressed the hydration heat issues of such large-volume concrete with rapid early-hardening characteristics. It is suitable for accurately simulating the dynamic influence of the hydration heat release process in large-volume concrete, formulated with high early-strength cement upon the temperature field of the freeze wall. The adiabatic temperature rise measured by the experiment was 49.1 °C, and the constant coefficient a was 1.92. The coefficient b was 3.49. Before being poured into the mold, the concrete had been mixed for nearly one hour, with a temperature rise of 3 °C; due to adiabatic errors in this experiment, heat loss was calculated at 8–10%, with a cement content of 400 kg/m3, a density of CF80 at 2491 kg/m3, and a specific heat capacity of 0.95 (kg·°C). The hydration heat release of the concrete was calculated to be 342.5–385.3 kJ.

4. Modeling of Coupled Hydrothermal Analysis via the Freezing Method

4.1. Control Equations for the Permafrost Temperature Field

For the temperature field equation of the frozen wall, based on Fourier’s law, the latent heat of phase change is treated as a heat source; according to the law of energy conservation in porous media, the differential equation [28] can be obtained:
ρ C θ T t = λ θ 2 T + Q H
where θ is the volumetric water content; T is the temperature of the soil, °C; t is the time, s; ρ C θ is the equivalent volumetric heat capacity of the soil, J/(m3·K); λ θ is the equivalent thermal conductivity of the soil; and Q H is the latent heat of phase change.
The heat released by the pore water phase turning into ice is as follows:
Q H = L ρ i θ i t
where L is the latent heat of phase change of water, taken as 335 kJ/kg; ρ i is the density of ice, kg/m3; and θ i is the volume fraction of pore ice.
The equivalent volumetric heat capacity of the soil–water–ice mixture [29] is expressed as follows:
ρ C θ = 1 θ s ρ s C s + θ u ρ w C w + θ i ρ i C i
where ρ s and ρ w are the densities of the soil particles and water, respectively, kg/m3; θ s is the saturated volumetric water content of the soil; θ u is the volume content of unfrozen water in the permafrost; and C s , C w , and C i are the specific heat capacities of the soil particles, water, and ice, respectively, J/(kg·K).
The equivalent thermal conductivity of the soil–water–ice mixture [30] is expressed as follows:
λ θ = λ s 1 θ s λ w θ u λ i θ i
where λ s , λ w , and λ i are the thermal conductivities of the soil particles, water, and ice, respectively, W/(m·K).

4.2. Controlling Equations for the Permafrost Moisture Field

According to the law of conservation of mass during the freezing and thawing process of soil; based on Richard’s equation, the differential equation for the migration of unfrozen water in unsaturated soil [31,32] is as follows:
θ u t + ρ i ρ w θ i t = D θ u θ u + K θ u
where K θ u is the permeability coefficient of unsaturated soil and where D θ u is the diffusivity of water in permafrost; the corresponding formula is as follows:
D θ u = K a θ u C θ u I
where K a θ u is the permeability of the soil, m/s; C θ u is the specific water capacity, 1/m; and I is the impedance factor, which is calculated as follows:
I = 10 θ i
K a θ u is calculated via the Gardner model [32] via the following equation:
K a θ u = K s K r = K s S l 1 1 S 1 m m 2
C θ u is calculated via the VG [33,34] model via the following equation:
C θ u = a m 1 m θ s θ r S 1 m 1 S 1 m m
where K s is the saturated permeability coefficient; K r is the relative permeability coefficient; θ r is the residual water content; l is the pore connectivity parameter of the soil; S is the relative saturation of the soil; and a and m are parameters determined by the nature of the soil.
Between the frozen wall heat conduction equation and the moisture field equation, a linkage equation B T must also be introduced to achieve the coupling of the equations. In this paper, we chose the solid–liquid ratio equation, which represents the ratio of the volume of pore ice to the volume of unfrozen water in frozen soil. The equation is as follows:
B T = θ i θ u = 1.1 T T f B 1 T < T f 0 T T f
where T f is the freezing temperature of the soil, °C; B is a constant related to the type of soil and salt content; and B is 0.61 for the sandy soil, 0.47 for the powdered soil, and 0.56 for the clay.
The relative saturation of permafrost is expressed as follows:
S = θ u θ r θ s θ r
Associative Equations (1), (2), (10) and (11) were obtained to control the temperature field with temperature T and relative soil saturation S as variables:
ρ C θ L ρ i θ s θ r S + θ r B T t T t + λ θ T = L ρ i θ s θ r B T S t
Associative Equations (5), (6), (10) and (11) were obtained to control the moisture field with temperature T and relative soil saturation S as variables:
1 + ρ i ρ w B T S t + ρ i ρ w B T t S + ρ i ρ w θ r θ s θ r B T t = D S S + K S

4.3. Temperature Field Control Equations for the Shaft Wall Concrete and Foam Plate

For the heat generation process of concrete hydration, the governing equation for heat transfer [35] is as follows:
ρ c C c T t λ c 2 T = q
where ρ c is the density of the concrete, kg/m3; C c is the specific heat capacity of the concrete, kJ/(kg·°C); λ c is the coefficient of thermal conductivity of the concrete; and q is the rate of heat generation of the heat of hydration of the concrete.
The hydration heat release per cubic meter of concrete can be expressed by the following equation:
Q t = C c ρ c θ t = C c ρ c θ 0 1 e a t b = W Q 0 1 e a t b
where Q 0 is the total cumulative heat of hydration generated at t , kJ/kg, and t is the age, d.
The derivative of Equation (17) with respect to time t yields the heat generation rate q of concrete hydration. The formula is as follows:
q = d Q t d t = a b W Q 0 t b 1 e a t b
To reduce the effect of hydration heat on the freezing wall, a polystyrene foam board was added in the project to reduce the heat transfer efficiency, and the controlling equation of its heat transfer was the same as that of the heat transfer of the hydration heat of the concrete; however, the polystyrene foam board does not have an internal heat source, so it is 0. The equations are as follows:
ρ m C m T t λ m 2 T = 0
where ρ m is the density of the polystyrene foam board, kg/m3; C m is the specific heat capacity of the polystyrene foam board, kJ/(kg·°C); and λ m is the thermal conductivity of the concrete.

4.4. Coupled Hydrothermal Control Equations

Assuming that the frost heave of frozen soil satisfies isotropic linear elastic characteristics, the frost heave of frozen soil is generally expressed by the frost heave rate; the formula for calculating the frost heave rate of the frost line can be expressed as follows [36]:
η l = V V + 1 3 1
where V is the volume of expansion of the soil after freezing and where V is the volume of the soil before freezing.
The calculation method for the frost heave coefficient is as follows:
η α = η l T = V 2 V 1 V + 1 3 1 T 2 T 1
where V 1 is the frost heave volume of the soil sample at temperature T 1 ; V 2 is the frost heave volume of the soil sample at temperature T 2 ; and V is the initial volume of the soil sample.
The strain caused by frost heaving is as follows:
ξ = η α T T 0
where T is the instantaneous temperature of the frozen soil, °C, and T 0 is the freezing temperature of the soil, °C.

4.5. Secondary Development of Coupled Models Based on PDE Modules

The coefficient-type partial differential equation module (PDE module) was selected in COMSOL to establish a coupled equation with temperature (Equation (14)) and soil relative saturation (Equation (15)) as variables and then solved together with the stress field control equation (Equation (22)) to obtain the hydrothermal coupling equation at the initial stage of lining pouring. The soil portion was represented using the coefficient-form partial differential equations in the PDE interface, while the concrete and polystyrene foam board portions were represented using the heat equation in the PDE interface.

5. Numerical Calculation Model Determination

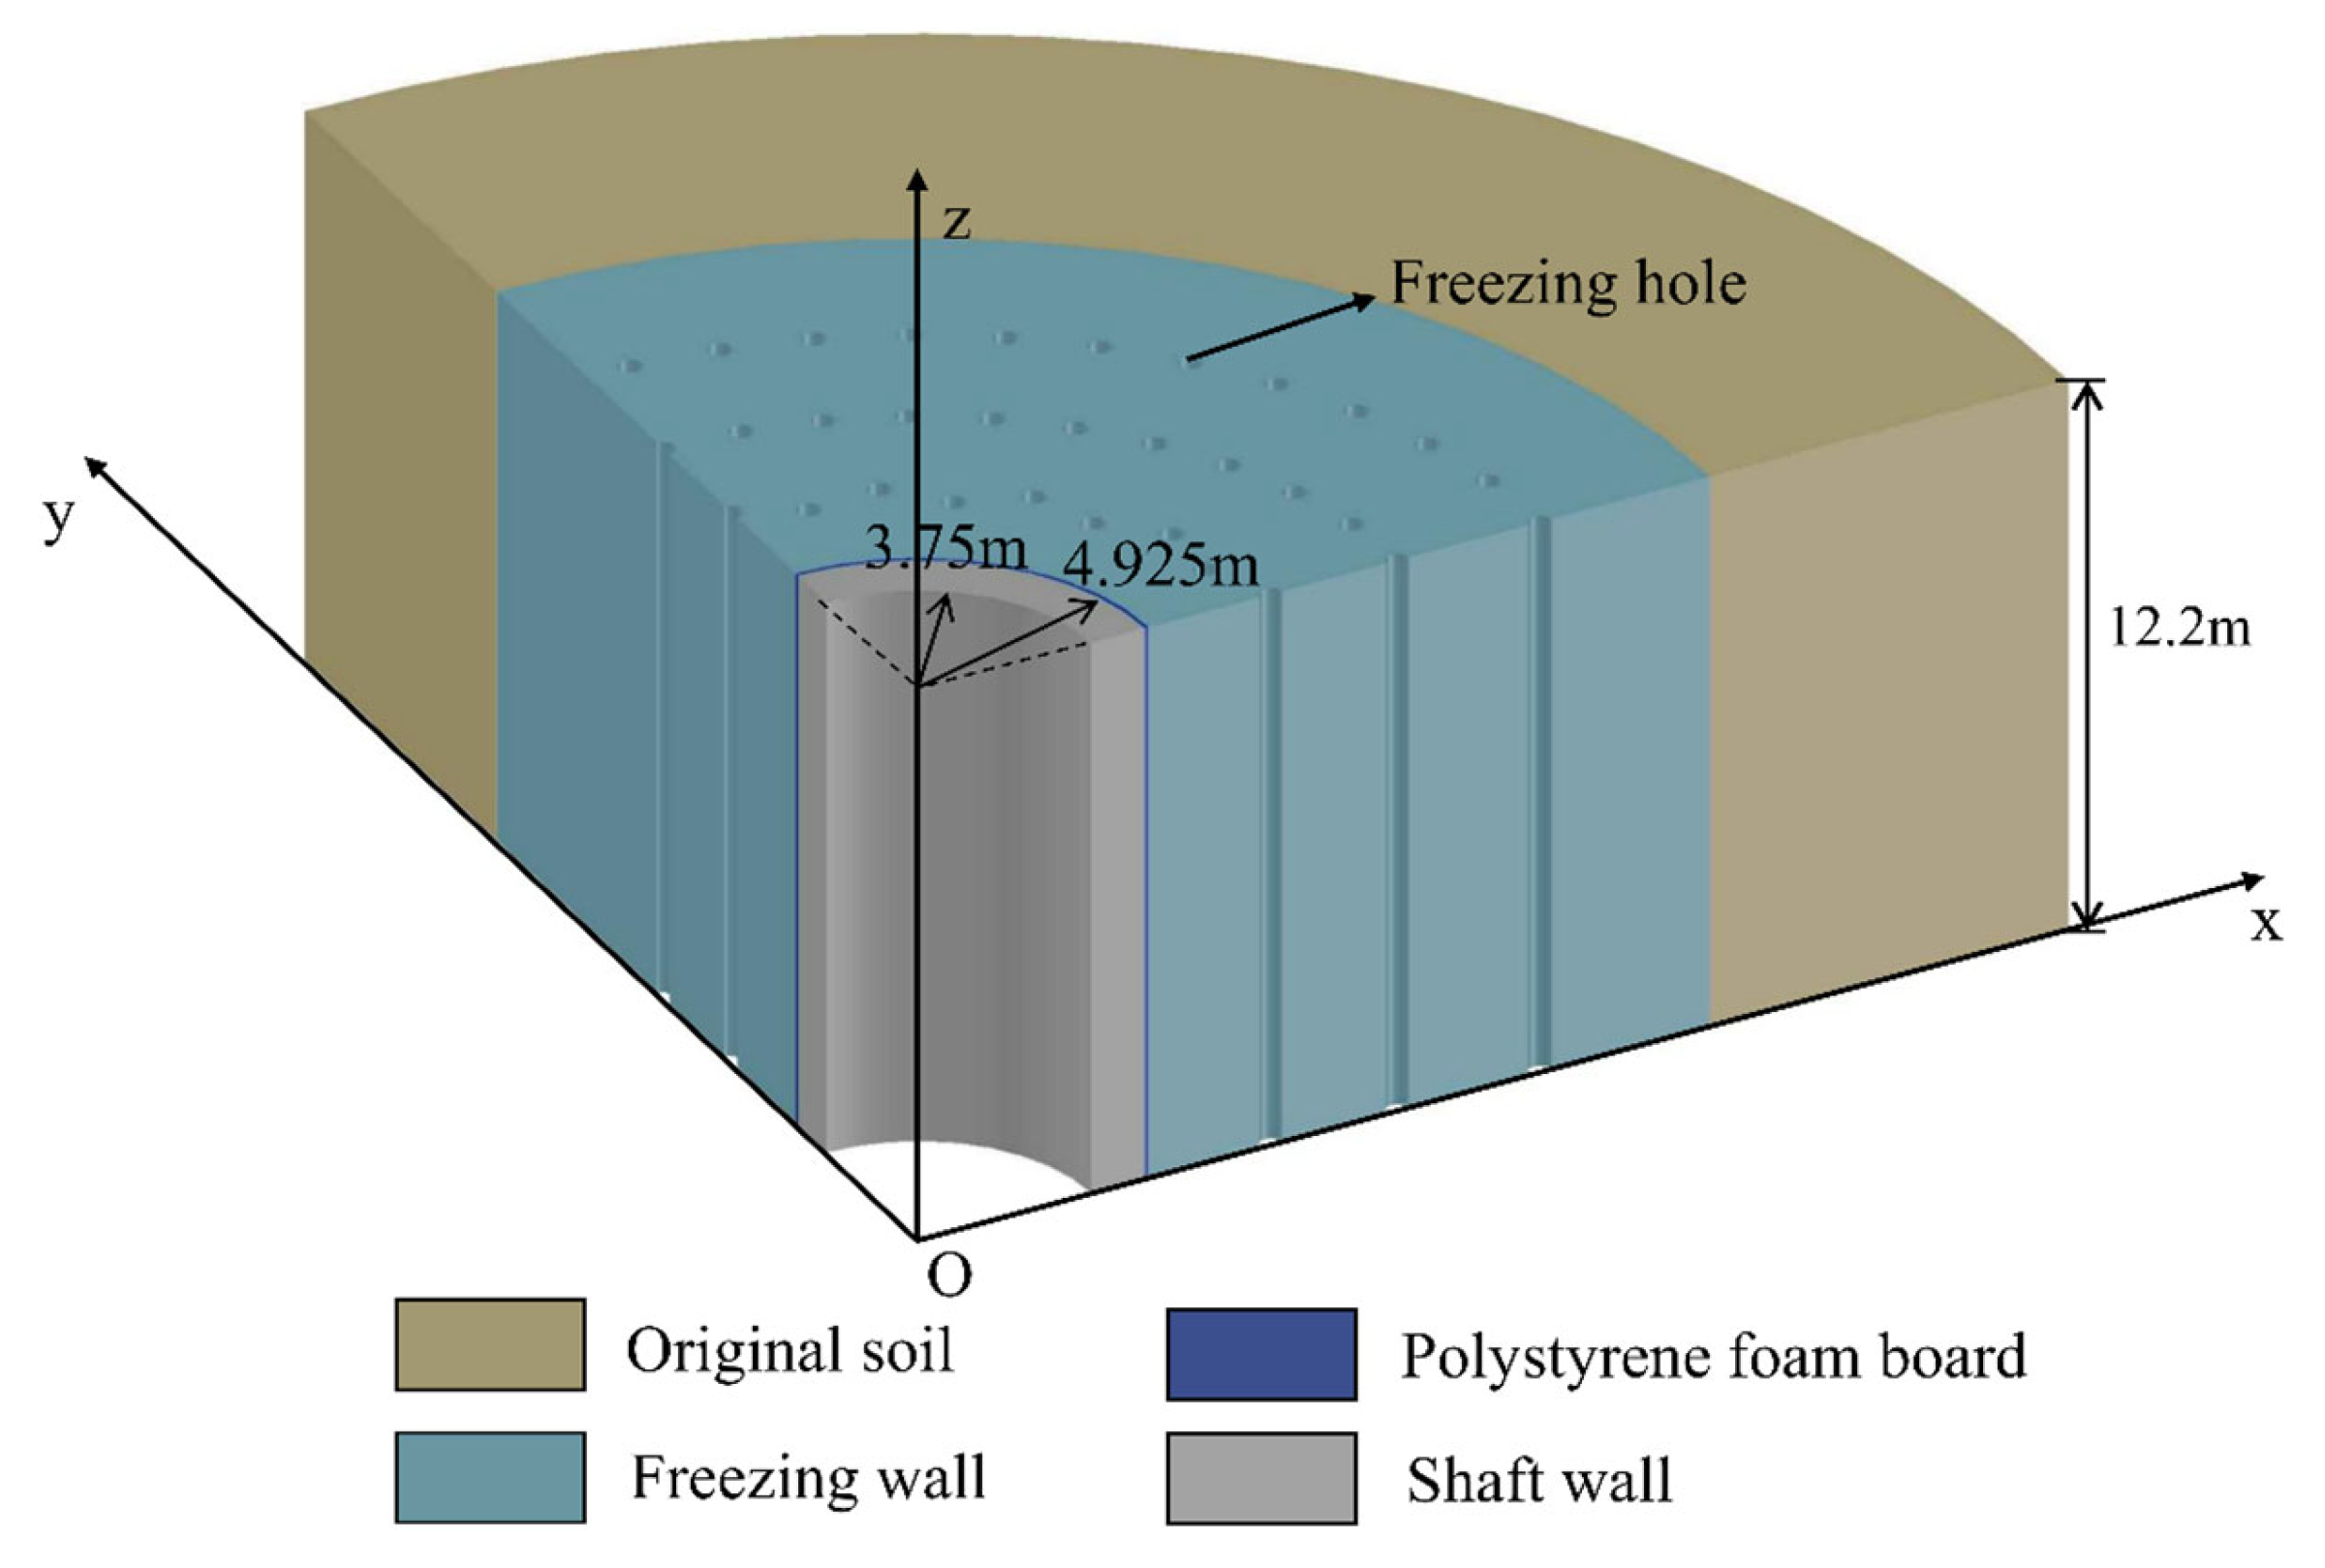
The working conditions of the third monitoring layer were selected as the sample analysis object of the above model, as shown in Figure 9. Basic assumption conditions were as follows: ① The soil was homogeneous, continuous, isotropic unsaturated soil. ② The polystyrene foam board was compressed once after the lining was poured, and only the change in thermal conductivity was considered. ③ The outer boundary of the model was an adiabatic boundary. ④ The salt water temperature was directly applied to the boundary of the freezing pipe as the temperature load, which did not change with time.

5.1. Model Physical Parameters

The simulation of the temperature field in the above example involved physical parameters of materials such as soil, ice, water, and concrete, as shown in Table 1 and Table 2. The density of polystyrene foam board was 17 kg/m 3, and its specific heat capacity was 2.1 kJ/(kg °C); after the shaft wall lining was poured, the thermal conductivity of the polystyrene foam board increased with time, and its equivalent thermal conductivity is shown in Table 3. The coefficient of the thermal expansion of steel fiber-reinforced concrete was 7 × 10⁻⁶/℃, and the Poisson’s ratio was 0.2; the elastic modulus was considered to vary with time, as shown in Table 4. After the polystyrene foam board was poured for the shaft wall lining, it was rapidly compressed, with an elastic modulus of 10 MPa and a Poisson’s ratio of 0.499. The frost heave rate, elastic modulus, and Poisson’s ratio of frozen soil all varied with temperature, as shown in Table 5 specifically:

5.2. Boundary Condition Setting

The temperature field of the strata was divided into a freezing-affected zone and an initial ground temperature zone; the measured initial temperature of the freezing wall was −21.6 °C, the initial concrete temperature at the time of casting was 18.5 °C, and the heat transfer coefficient of the inner surface of the shaft wall was 18.46 kJ/(m2·h·°C). The inner boundary conditions of the shaft wall lining were set as Dirichlet boundaries, with the average construction period temperature taken as 0 °C. The freezing temperatures for the outer ring holes of the freezing holes were set at −26 °C, the middle ring holes at −26 °C, and the inner ring holes at −28 °C. The outer boundary of the model was a fixed constraint, while the freezing holes and inner boundary conditions were free boundary conditions. When the ground stress was in equilibrium, the external load on the freezing wall was assumed to be the original horizontal pressure value of the soil, using the heavy liquid formula:
P = 0.013 H
where P is the external load on the frozen wall, MPa; H is the depth of the soil, m.

6. Comparison and Analysis of Numerical Calculation Results

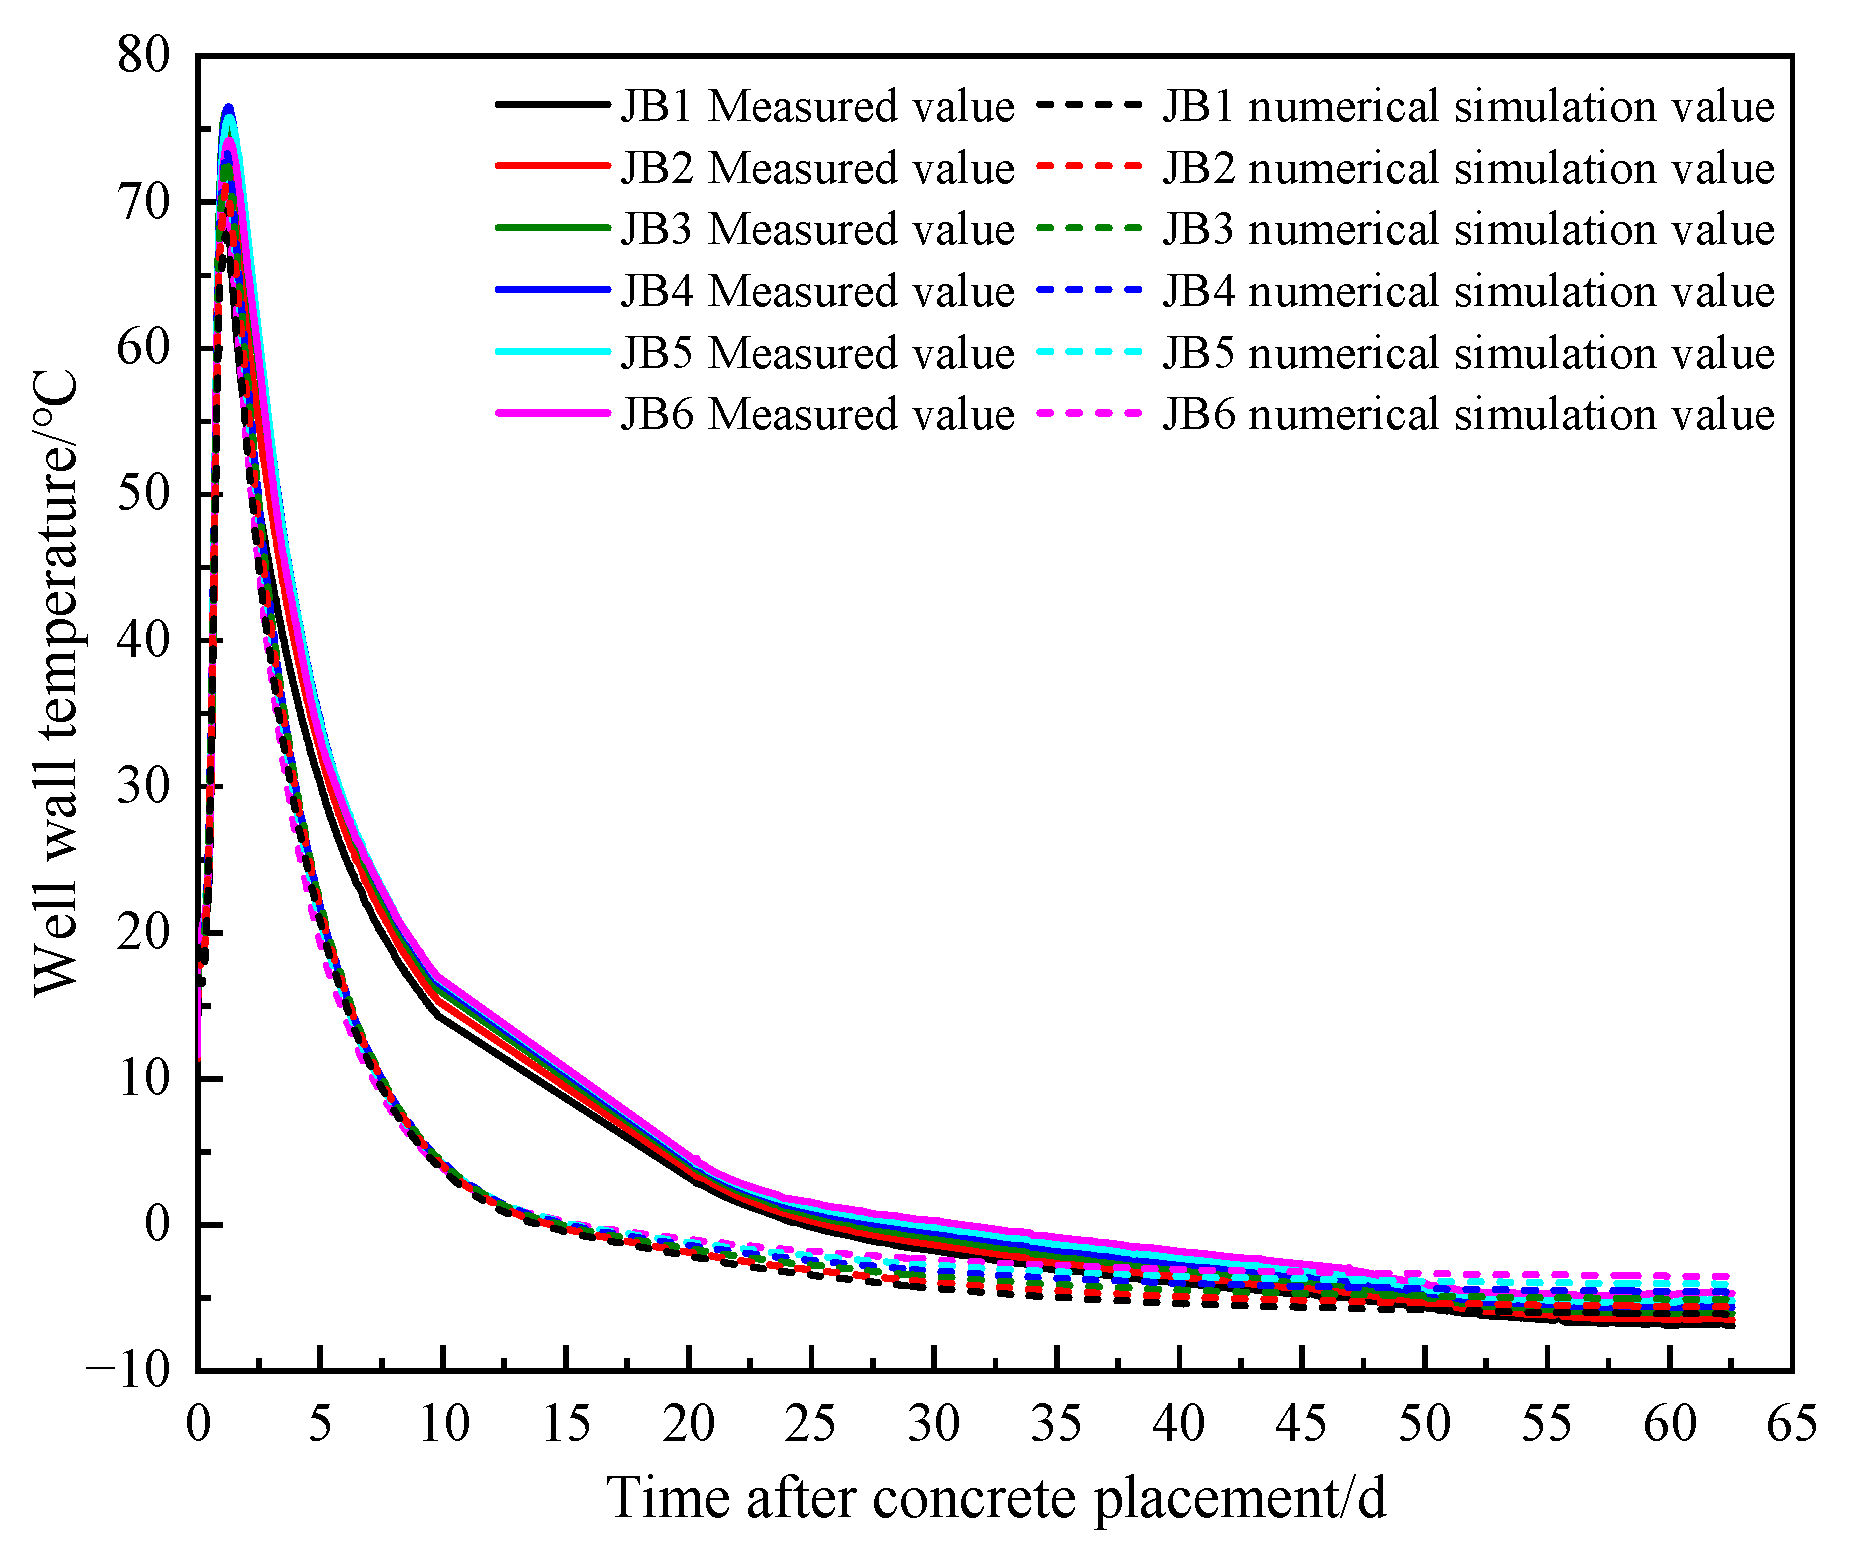
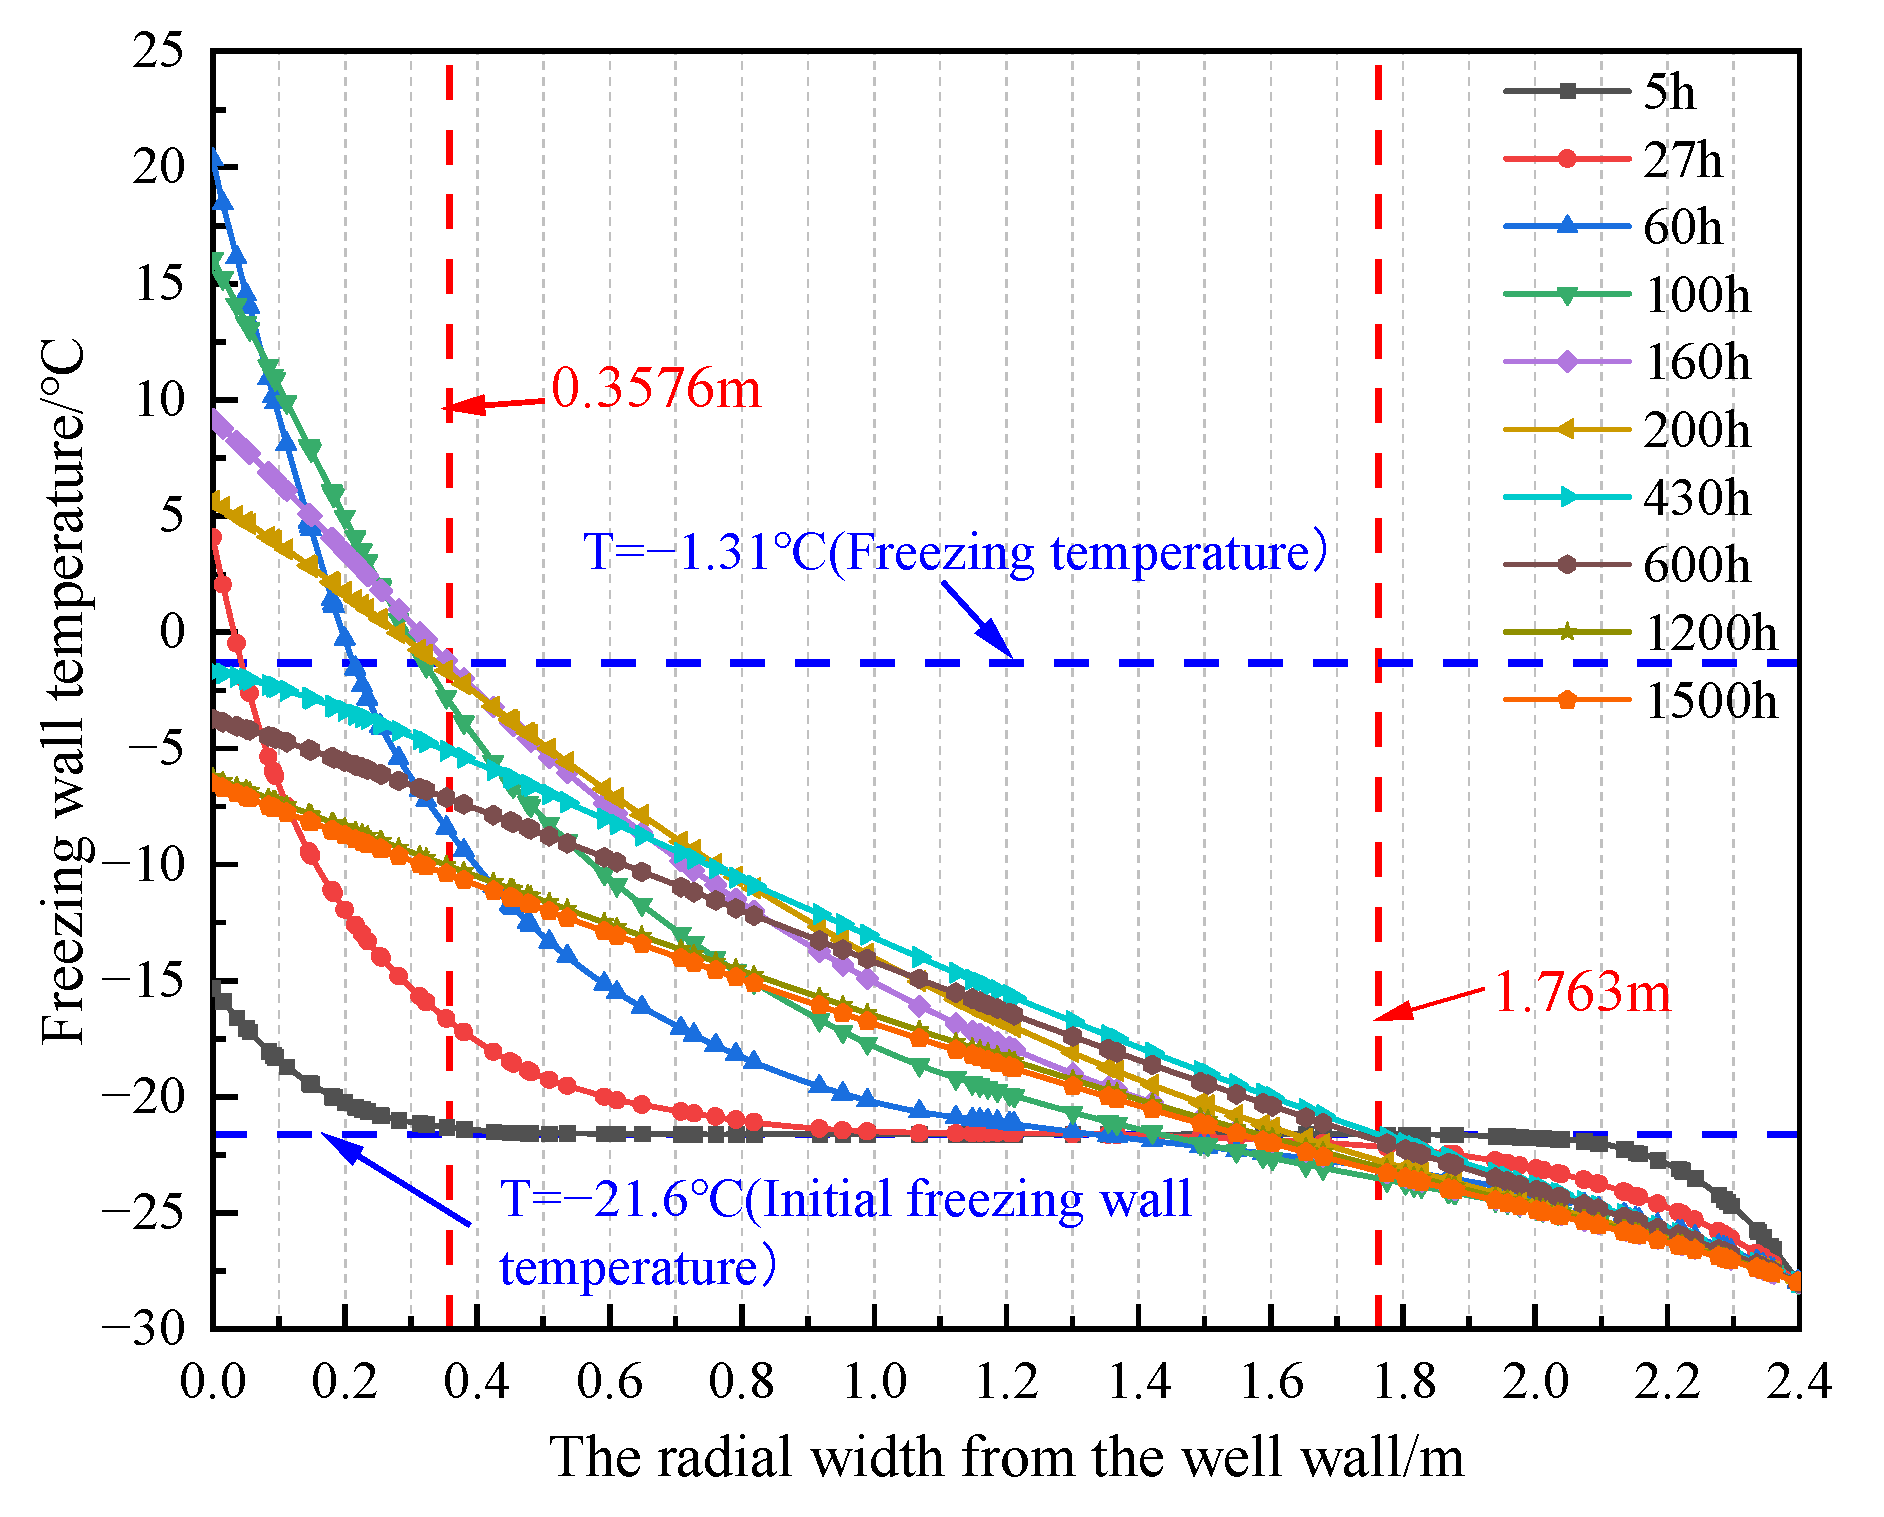
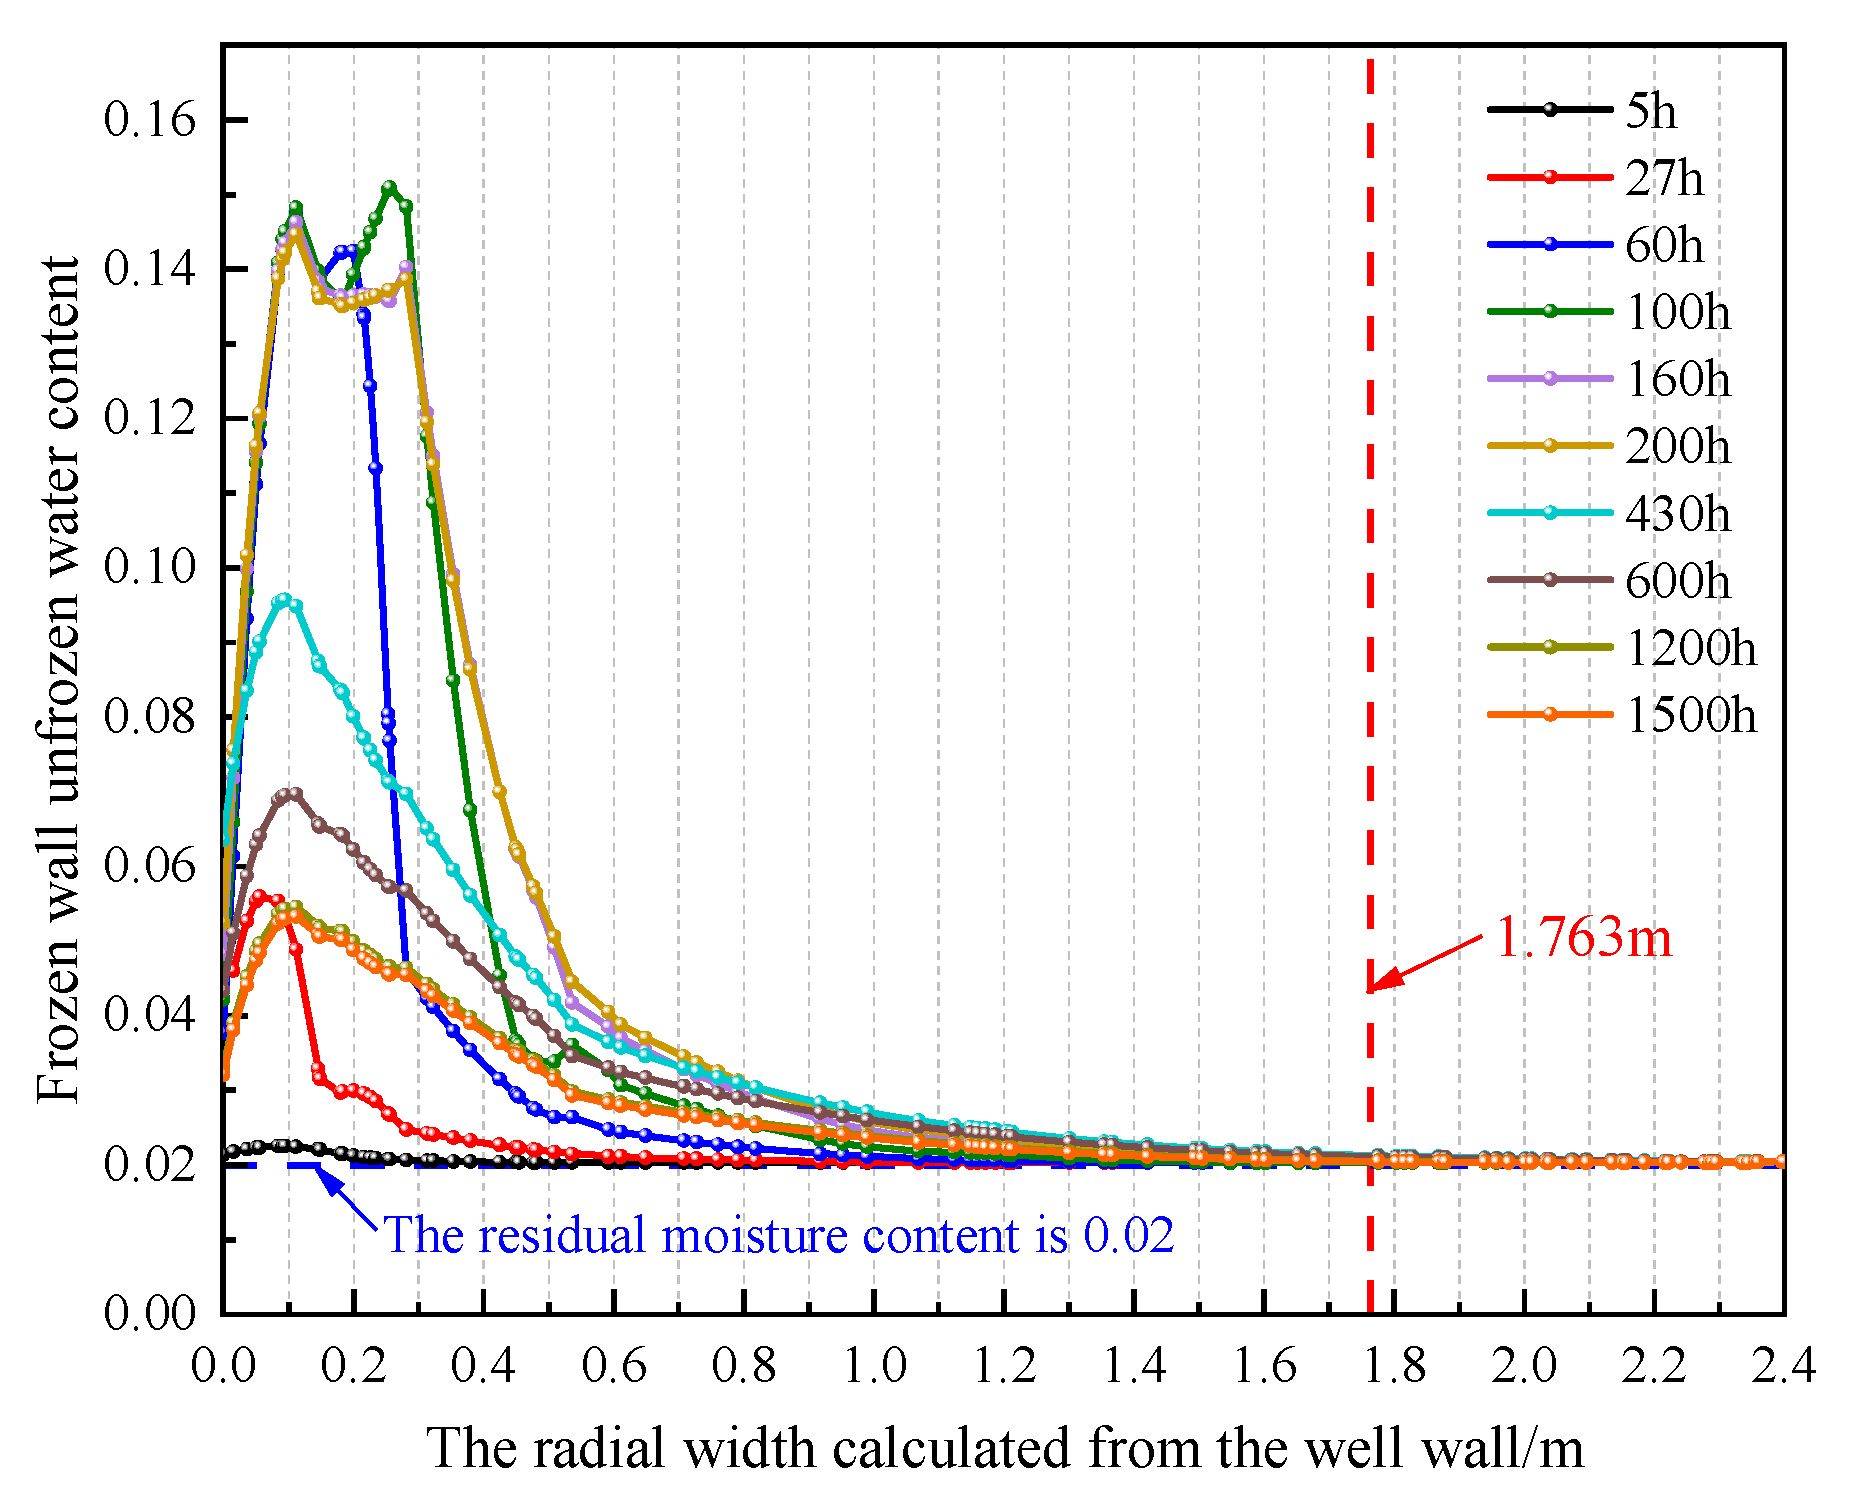
The temperature field distribution after pouring was obtained through the above modeling calculations, as shown in Figure 10. The calculated peak temperature of the shaft wall caused by the hydration heat of steel fiber concrete reached 73.62 °C around 27 h, while the measured value reached a peak temperature of 76.5 °C around 29 h; the relative error method was employed to calculate the error rate, and the error rate between the model and the measured results was 3.76%. The comparison between the model numerical calculation results and the measured temperatures at various monitoring points on the well wall is shown in Figure 11. The temperature field evolution was divided into an induction period, a rapid heating period, a rapid cooling period, and a steady cooling period, and the evolution patterns were generally consistent, verifying the feasibility and reliability of the numerical model calculations. As shown in Figure 12, the freezing wall was affected by the hydration heat of the lining, with temperatures increasing as one approaches the shaft wall; at the contact surface after 60 h, the peak temperature reached 20.35 °C. Based on the freezing temperature of clay, the frozen wall reached a maximum thaw depth of 0.3576 m at 160 h, while the measured value reached a maximum thaw depth of 0.375 m around 7 d; the error rate between the model and the measured data was 4.64%. The model calculation resulted for the freezing wall temperature at various monitoring points were compared with the measured temperatures, as shown in Figure 13, validating the reliability of the model. The numerical model developed in this study employed a reasonable simplification for the thermal exchange boundary between the inner surface of the tunnel wall and the ambient air, omitting detailed consideration of fluctuations in the convective heat transfer coefficient caused by dynamic factors such as the excavation rate, construction duration, and seasonal ventilation. Field measurements indicated that discrepancies between observed and simulated temperature fields attributable to these factors primarily occurred during the refreezing phase. This phase lasted approximately 7.5 d, representing a relatively brief period within the entire freezing cycle. Temperature prediction errors during this interval remained low, thus not compromising the model’s utility for engineering safety control. Meanwhile, model analysis can reverse deduce the migration law of the water division field in the frozen wall. As the frozen wall thaws, the volume content of unfrozen water gradually increases, as shown in Figure 14, and the unfrozen water content near the shaft wall decreases in a small range because the hydration heat of the shaft wall concrete caused thermal expansion of the shaft wall, resulting in a certain displacement. The early-displacement cloud map after concrete pouring is shown in Figure 15; the thermal expansion of the shaft wall causes compression on the frozen wall, reducing the porosity of the soil on the frozen wall and resulting in a decrease in the unfrozen water content. The initial temperature of the freezing wall was −21.6 °C, and the residual moisture content of the frozen soil was 0.02; it can be determined that the maximum value of the influence range of the hydration heat of steel fiber concrete on freezing reaches 1.763 m at 430 h. As time progresses, the rate of hydration heat generation in the concrete decreased, and its impact on the freezing wall temperature also gradually diminished; the freezing tube continuously supplied cold energy to the freezing wall, causing its temperature to drop rapidly and initiating refreezing.
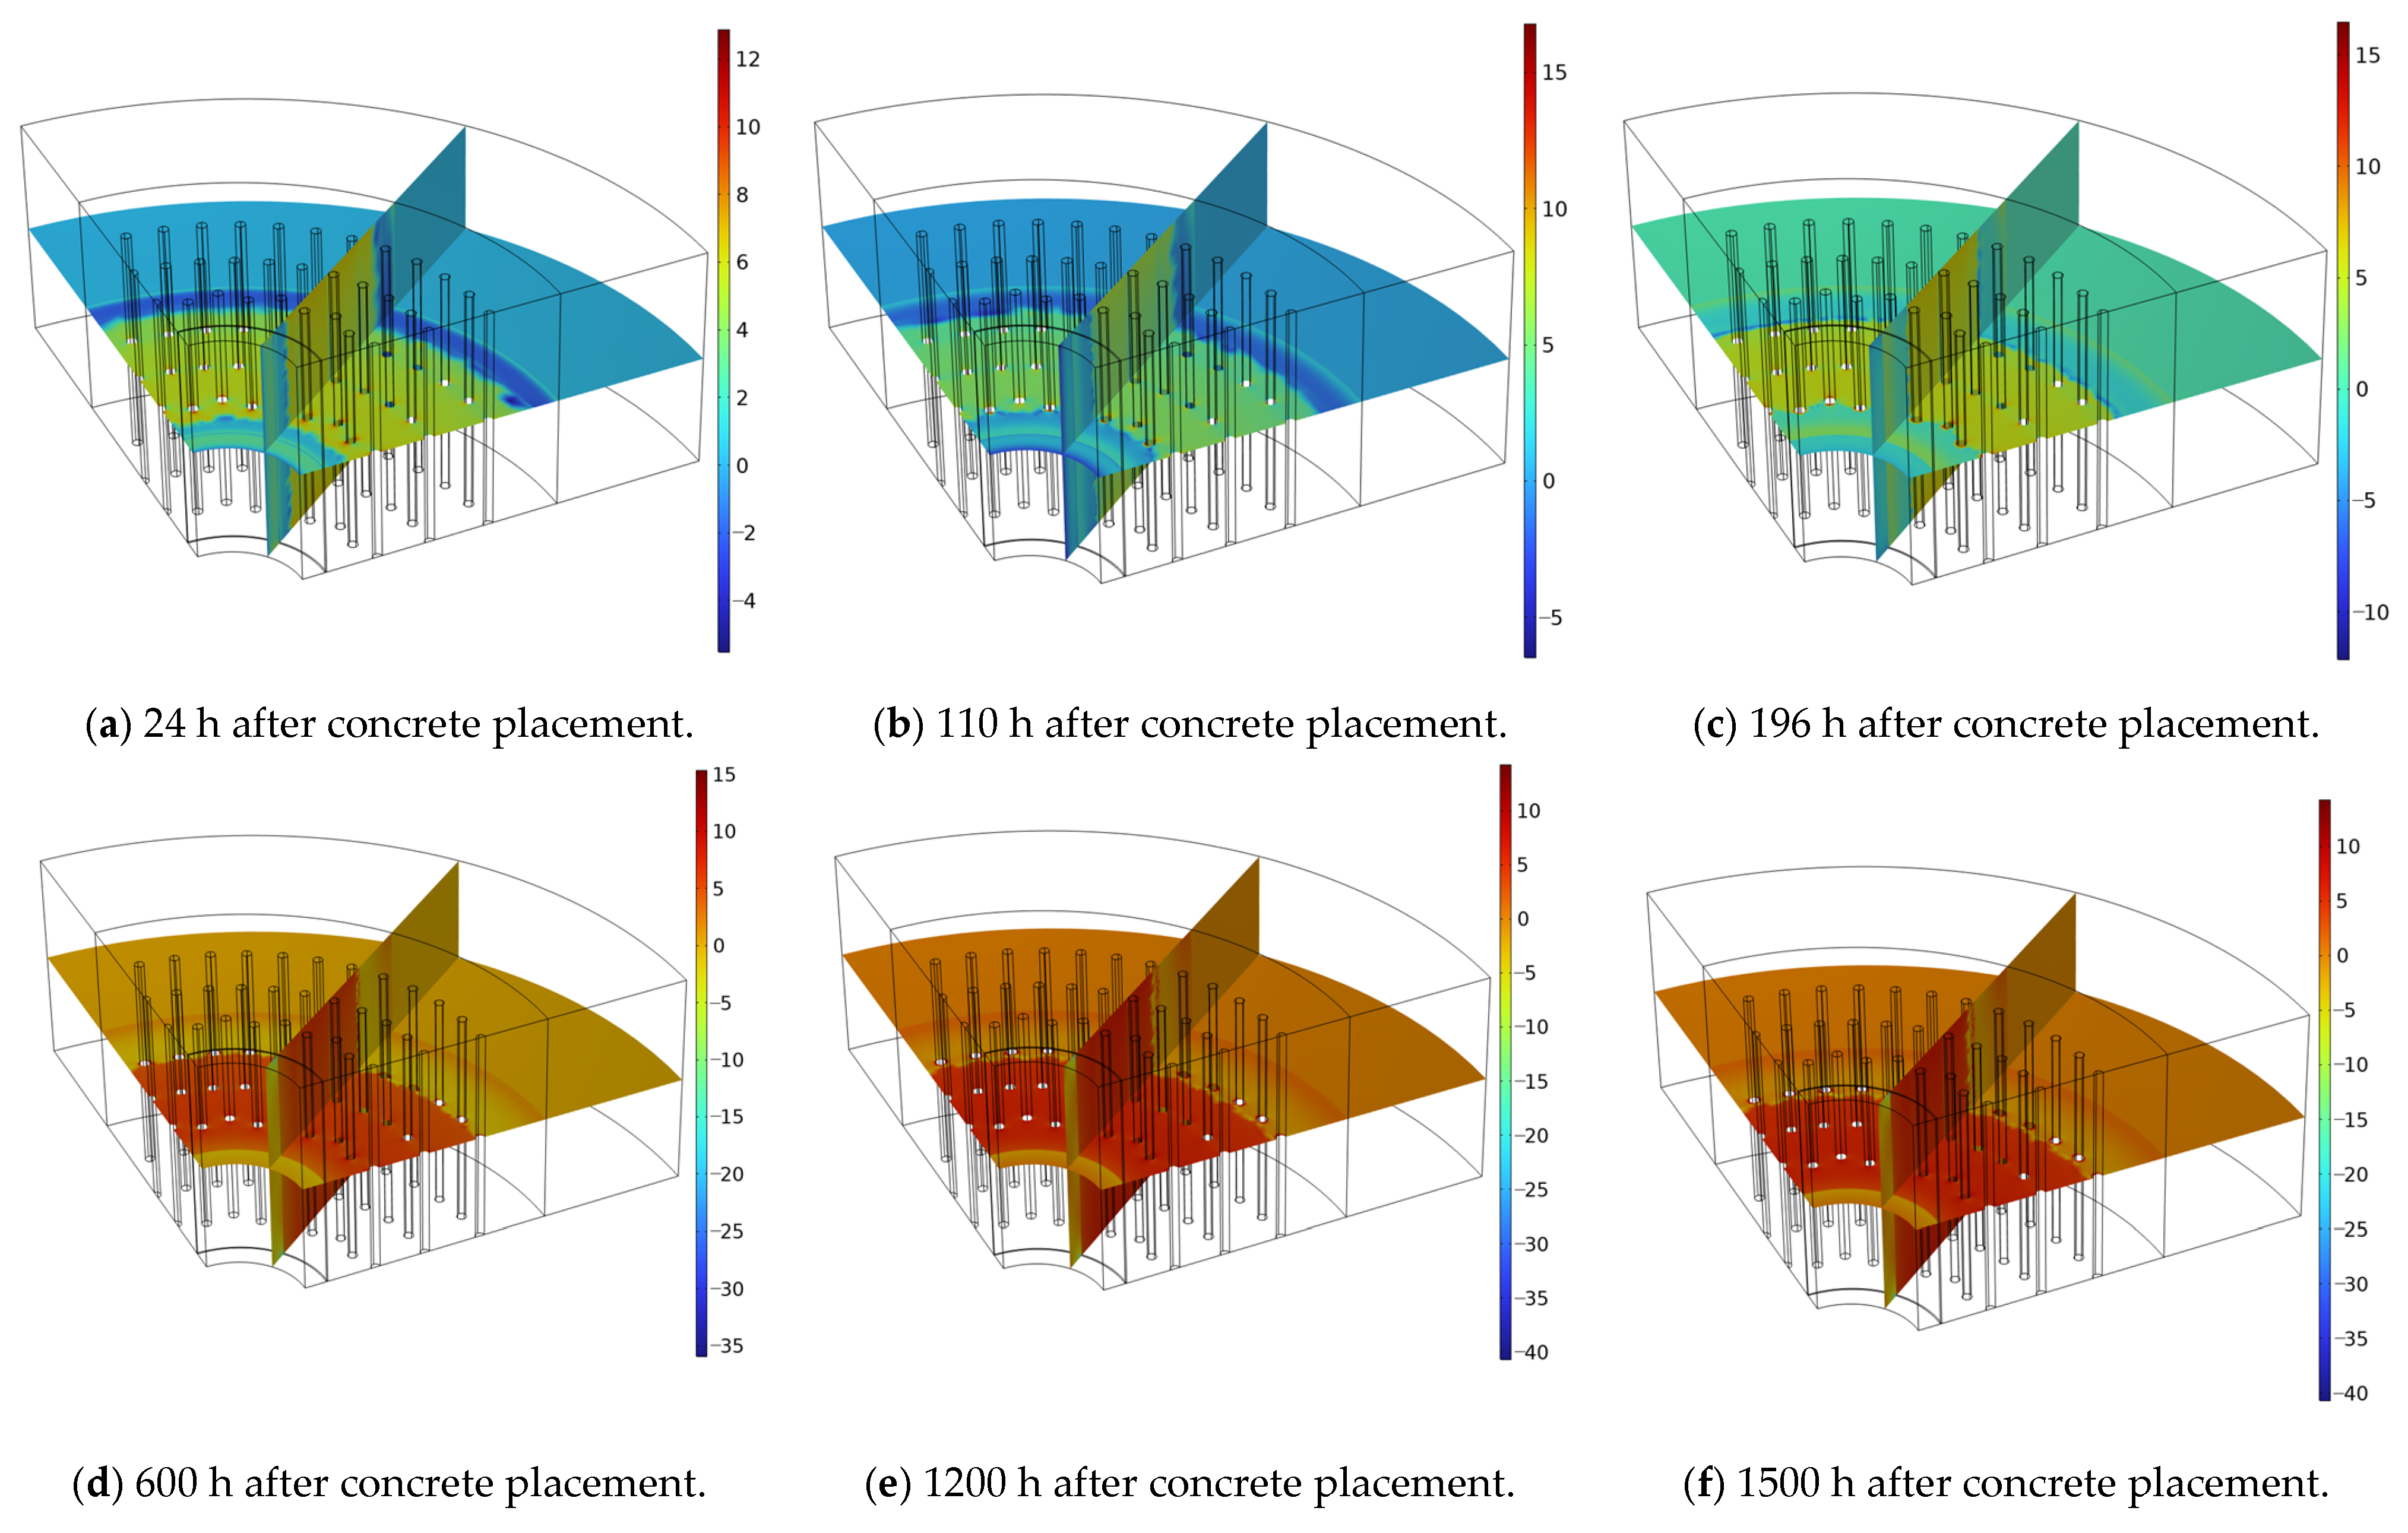
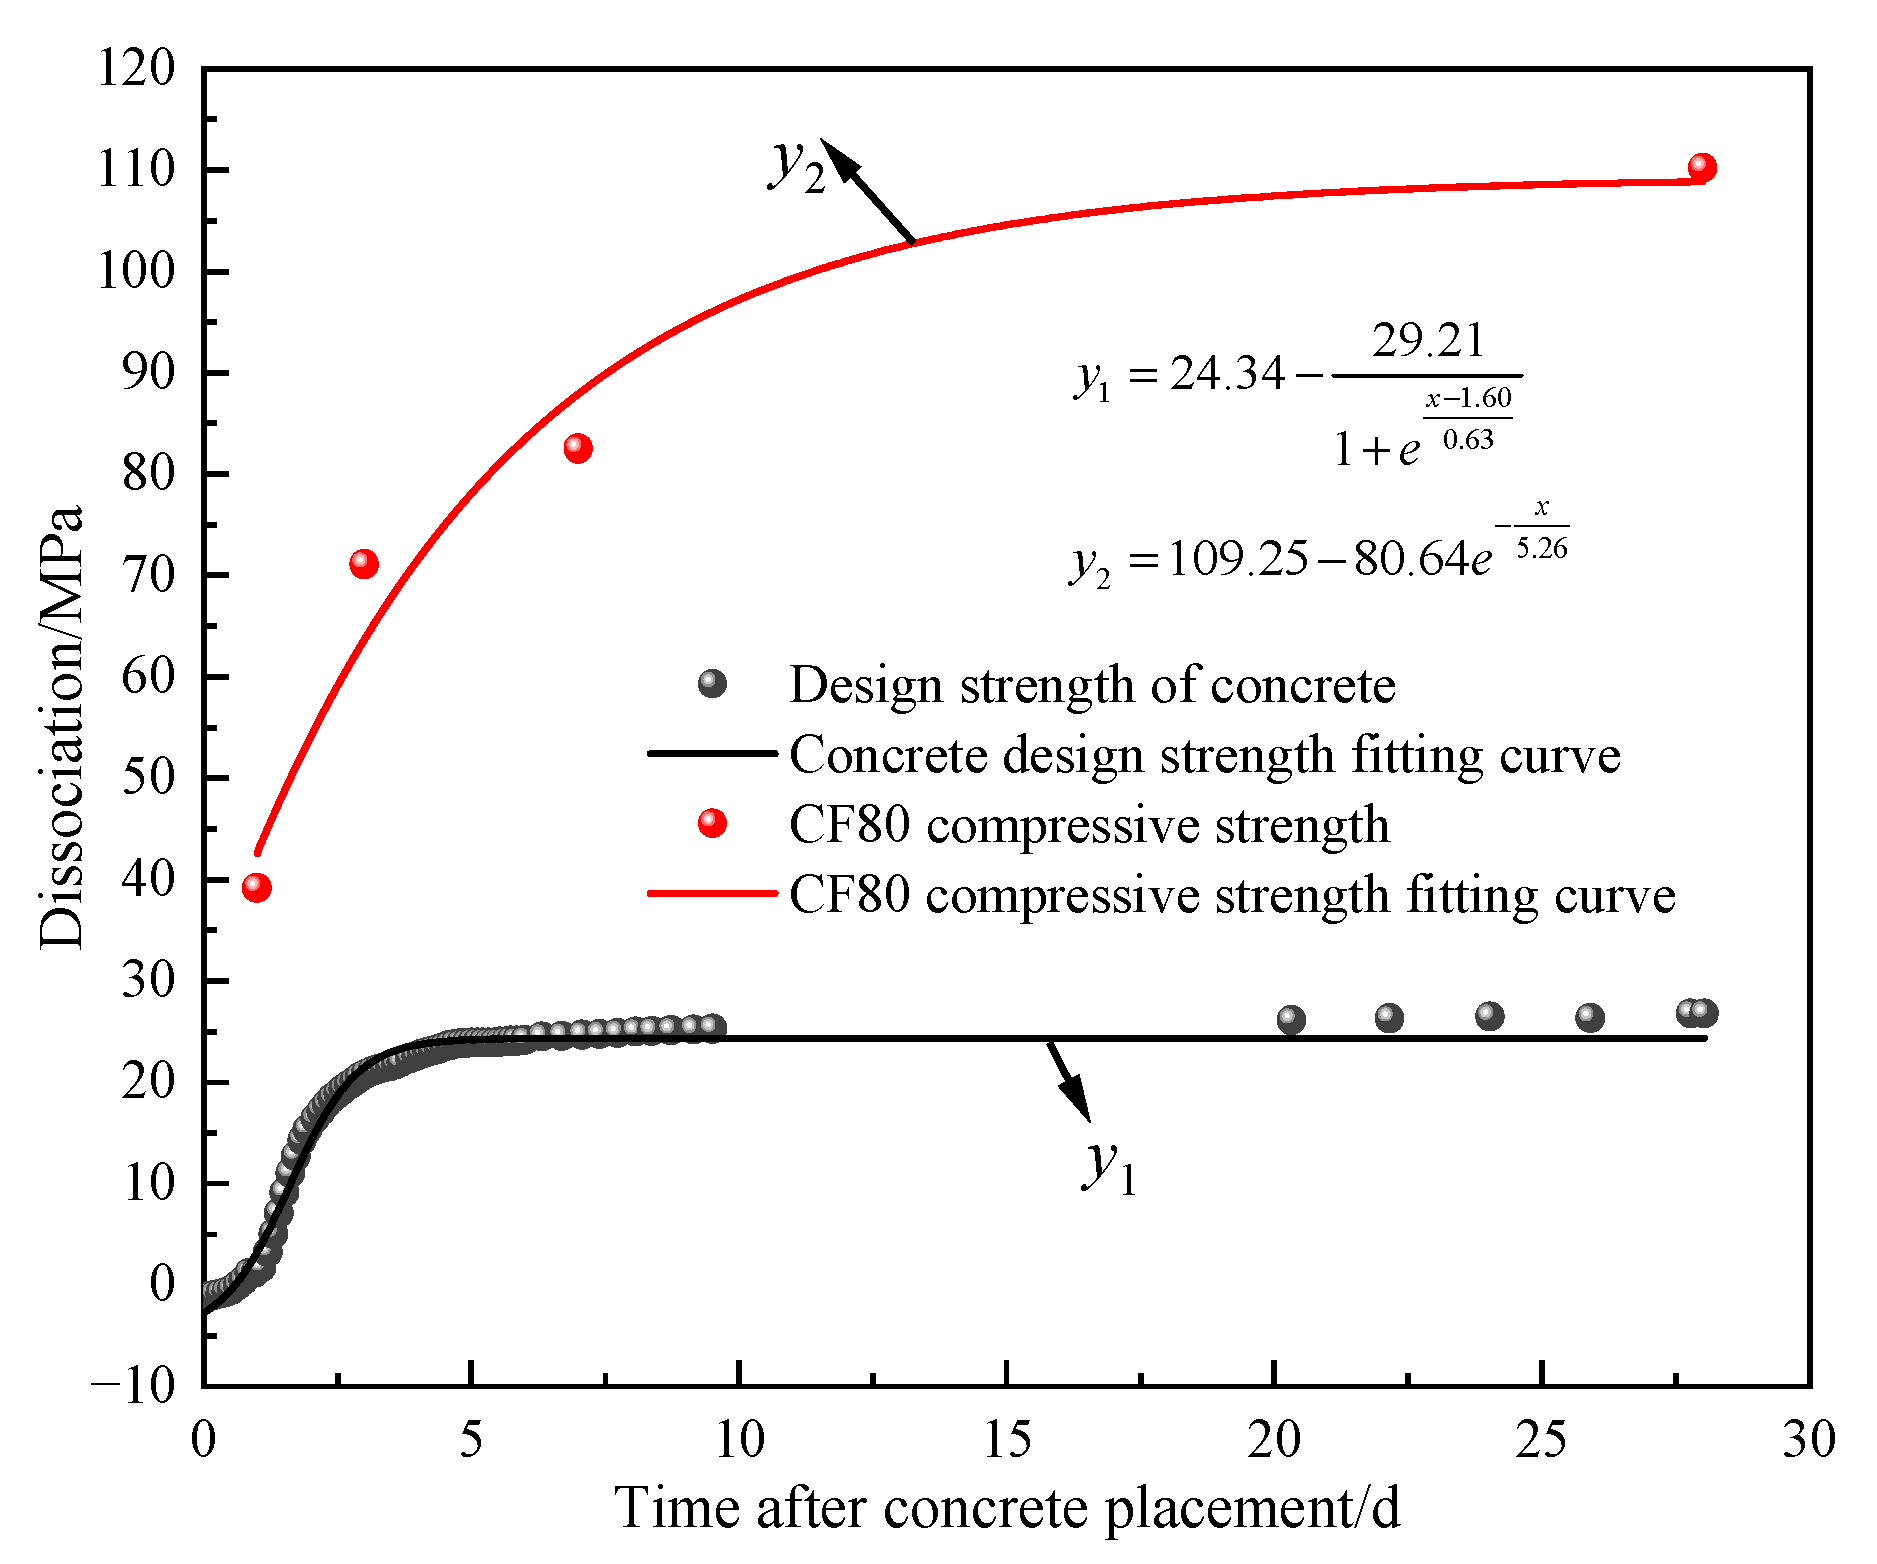
Figure 16 shows the freezing pressure cloud diagrams of the frozen wall at 24, 110, 196, 600, 1200, and 1500 h after the pouring of steel fiber concrete, as shown in Figure 16a–c. This stage was caused by the hydration heat of the steel fiber concrete, leading to the melting of the frozen soil; around 110 h or approximately 4.583 d, the pressure entered a slow decline phase, and after the frozen soil melted, the ice transformed into water and was expelled, causing the soil to compress and reducing the freezing pressure. As shown in Figure 16c–f, this stage marked the beginning of the refreezing phase of the thawed permafrost; at 196 h or approximately 8.17 d, the freezing pressure showed an upward trend, which is roughly consistent with the refreezing time of the freezing wall of approximately 7 d. The simulated freezing pressure reached a peak of 4.72 MPa around 61.7 d, while the measured value reached a peak of 4.97 MPa around 62 d, and the relative error method was employed to calculate the error rate. The error rate between the simulated and measured values was 5.03%. After reaching its maximum peak, the frozen soil pressure tended to level off over time. Figure 17 shows a comparison between the measured and simulated values of freezing pressure at measurement point A; the measured values at the site are basically consistent with the numerical simulation values. If the early strength growth of the shaft wall lining cannot meet the requirements of freezing pressure growth, the shaft wall will inevitably suffer damage. The CF80 steel fiber concrete mix design and strength growth law obtained through indoor experiments are shown in Table 6.
When the shaft wall is simplified into an axisymmetric plane strain problem, the stress distribution is determined by the Lame solution when subjected to an external pressure P only:
σ r = P R 2 R 2 r 2 1 r 2 ρ 2
σ τ = P R 2 R 2 r 2 1 + r 2 ρ 2
where σ r is the radial stress; σ τ is the circumferential stress; P is the external pressure, MPa; r is the inner diameter, m; and R is the outer diameter, m.
When ρ = r , σ r = 0 is obtained, σ τ = 2 P R 2 R 2 r 2 , and substituting the above equation into the third strength theory gives the following:
2 P R 2 R 2 r 2 = f d
The simplification yields an equation for the thickness of the shaft wall:
t c = r f d f d 2 P 1 = R r
where t c is the thickness of the shaft wall, m, and where f d is the design value of the strength of the shaft wall material, MPa.
When the shaft wall is a reinforced concrete structure, the strength design value of the wall material [37] is as follows:
f d = f c + ρ min   f y
where f c = 0.9 f c , f y = 0.9 f y , and ρ min = 0.004 . f c is the design value of the strength of the concrete, MPa; f y is the design strength of the steel bar, MPa, where the design strength of the steel bar is 335 MPa; and ρ min is the minimum reinforcing ratio.
The design strength of concrete is obtained from the simplification of Equations (27) and (28):
f c = 2.22 P t c r + 1 2 t c r + 1 2 1 1.34
The external pressure P varies with time. The maximum freezing pressure value measured on-site is selected to derive the curve showing how the design strength of concrete changes with time, the curve showing how the compressive strength of steel fiber concrete shaft walls changes with time within 28 d, and the corresponding fitted curves, as shown in Figure 18. It can be seen that the compressive strength of the shaft walls exceeds the design strength of the concrete, and the steel fiber concrete shaft walls will not be damaged by freezing soil pressure in the early stages.

7. Conclusions

Taking engineering prototypes and actual measurement data analysis as examples, a three-dimensional model of hydrothermal coupling between the poured lining and the frozen wall in freeze–thaw construction was established to study the mutual influence between them. The main conclusions obtained are as follows:
(1)
A coupled thermal–hydraulic three-field analysis model was established based on heat transfer in porous media, seepage in unsaturated soil, and frost heave theory, with temperature and soil relative saturation as unknown variables (see Equations (14), (15) and (22)); the study determines reasonable values and settings for parameters such as the expansion deformation coefficient, equivalent thermal conductivity, and specific heat capacity of the three-phase medium; an adiabatic temperature rise model; a VG stagnant water model; and a Gardner permeability model, providing a theoretical basis for modeling and analyzing water–heat–force coupling under the influence of hydration heat during the initial pouring of the lining in frozen construction methods.
(2)
An analysis of multi-layer field measurement data shows that the thickness of the shaft well lining and the initial temperature are positively correlated with the peak temperature of the shaft well wall, while the initial temperature is negatively correlated with the age of the peak temperature. After the steel fiber concrete is poured, the temperature rise changes in four stages: induction, rapid heating, rapid cooling, and steady cooling. The time taken for measurement points DJB1 to DJB10 to reach peak temperature showed a decreasing trend; the maximum thawing depth times for the second and third layers were approximately 8 d and 7 d, respectively, and the thawing range of the clay layer in the third layer was greater than that of the sandy clay layer in the second layer. The peak freezing pressures for the second and third layers were 0.5 and 0.6 times the design bearing capacity, respectively, to ensure the structural safety of the shaft wall; there were high requirements for the early-age strength of the outer concrete during construction.
(3)
Taking the third layer as the model example, the unfrozen water content was determined to reach a maximum thaw depth of 0.3576 m after 160 h of pouring, and the error rate between the model and the measured data was 4.64%; the peak temperature of the shaft wall caused by hydration heat reached 73.62 °C at around 27 h, with an error rate of 3.76% between the model and the measured results. The freezing pressure reached a peak of 4.72 MPa around 61.7d, with an error rate of 5.03% between the model and measured data, validating the reliability of the numerical model; additionally, the compressive strength growth of the shaft wall lining met the load-bearing requirements for freezing pressure.
The water–heat–force coupled model developed in this study successfully reveals the thermodynamic influence mechanism of concrete hydration heat during the construction phase on the formation process of frozen walls within clay layers. However, the current model does not yet account for groundwater seepage effects or the differential impacts of varying soil layer properties. To enhance the model’s applicability and predictive accuracy under complex engineering geological conditions, subsequent research will focus on incorporating coupled seepage field analysis. Comparative studies across multiple soil layers and operational scenarios will systematically investigate the evolution patterns of frozen walls at varying depths under the coupled effects of hydration heat and seepage. Simultaneously, the research perspective will be extended from the construction phase to the operational stage. By establishing a long-term performance evaluation model, it will comprehensively analyze the coupled effects of time-varying ground pressure, groundwater chemical corrosion, and periodic temperature fluctuations. This approach will provide a theoretical foundation for the durability design and full-life-cycle management of lining structures. At the engineering application level, efforts will focus on developing an intelligent decision support system based on real-time temperature prediction. Key technological breakthroughs will target dynamic optimization of insulation layer design, intelligent recommendation of low-heat concrete mix proportions, and precise evaluation of early-stage freeze resistance. This will drive the transformation of artificial freezing construction methods from traditional experience-based approaches to digital, intelligent predictive control, providing advanced technical support and solutions for underground engineering construction in complex environments.

Author Contributions

Y.Y.: Writing—review and editing, Writing—original draft, Software, Methodology, Data curation. J.P.: Methodology, Investigation. J.Z.: Writing—review and editing, Methodology, Data curation. C.Z.: Methodology, Investigation. All authors have read and agreed to the published version of the manuscript.

Funding

This work was supported by the Engineering Research Center of Underground Mine Construction, Ministry of Education, Anhui University of Science and Technology (JYBGCZX2022102).

Data Availability Statement

Data will be made available on request.

Conflicts of Interest

The authors declare that they have no known competing financial interests or personal relationships that could have appeared to influence the work reported in this paper.

References

  1. Pilecki, Z.; Krawiec, K.; Pilecka, E.; Nagy, S.; Łątka, T. Temperature anomaly as an indicator of groundwater flow prior to the shaft sinking with the use of artificial ground freezing. Eng. Geol. 2025, 347, 107916. [Google Scholar] [CrossRef]
  2. Semin, M.; Golovatyi, I.; Levin, L.; Pugin, A. Enhancing efficiency in the control of artificial ground freezing for shaft construction: A case study of the Darasinsky potash mine. Clean. Eng. Technol. 2023, 18, 100710. [Google Scholar] [CrossRef]
  3. Zhang, S.; Yue, Z.; Lu, X.; Zhang, Q.; Sun, T.; Qi, Y. Model test and numerical simulation of foundation pit constructions using the combined artificial ground freezing method. Cold Reg. Sci. Technol. 2022, 205, 103700. [Google Scholar] [CrossRef]
  4. Fu, Y.; Hu, J.; Wu, Y. Finite element study on temperature field of subway connection aisle construction via artificial ground freezing method. Cold Reg. Sci. Technol. 2021, 189, 103327. [Google Scholar] [CrossRef]
  5. Jiang, Z.; He, B.; Zhu, X.; Ren, Q.; Zhang, Y. State-of-the-art review on properties evolution and deterioration mechanism of concrete at cryogenic temperature. Constr. Build. Mater. 2020, 257, 119456. [Google Scholar] [CrossRef]
  6. Do, T.A.; Hoang, T.T.; Bui-Tien, T.; Hoang, H.V.; Do, T.D.; Nguyen, P.A. Evaluation of heat of hydration, temperature evolution and thermal cracking risk in high-strength concrete at early ages. Case Stud. Therm. Eng. 2020, 21, 100658. [Google Scholar] [CrossRef]
  7. Hong, M.; Lei, D.; Hu, F.; Chen, Z. Assessment of void and crack defects in early-age concrete. J. Build. Eng. 2023, 70, 106372. [Google Scholar] [CrossRef]
  8. Del Savio, A.A.; La Torre Esquivel, D.; Carbajal, E.P.; de Andrade Silva, F. Experimental and analytical study of temperatures developed by the heat of hydration of high-strength self-compacting mass concrete. Case Stud. Constr. Mater. 2024, 22, e04098. [Google Scholar] [CrossRef]
  9. Kanavaris, F.; Jedrzejewska, A.; Sfikas, I.P.; Schlicke, D.; Kuperman, S.; Smilauer, V.; Honorio, T.; Fairbairn, E.M.R.; Valentim, G.; de Faria, E.F.; et al. Enhanced massivity index based on evidence from case studies: Towards a robust pre-design assessment of early-age thermal cracking risk and practical recommendations. Constr. Build. Mater. 2021, 271, 121570. [Google Scholar] [CrossRef]
  10. Levin, L.; Golovatyi, I.; Zaitsev, A.; Pugin, A.; Semin, M. Thermal monitoring of frozen wall thawing after artificial ground freezing: Case study of Petrikov Potash Mine. Tunn. Undergr. Sp. Technol. 2021, 107, 103685. [Google Scholar] [CrossRef]
  11. Hu, X.D.; Fang, T.; Han, Y.G. Mathematical solution of steady-state temperature field of circular frozen wall by single-circle-piped freezing. Cold Reg. Sci. Technol. 2018, 148, 96–103. [Google Scholar] [CrossRef]
  12. Hu, X.D.; Han, L.; Han, Y.G. Analytical solution to temperature distribution of frozen soil wall by multi-row-piped freezing with the boundary separation method. Appl. Therm. Eng. 2019, 149, 702–711. [Google Scholar] [CrossRef]
  13. Wu, T.; Zhou, X.; Zhang, L.; Zhang, X.; He, X.; Xu, Y. Theory and technology of real-time temperature field monitoring of vertical shaft frozen wall under high-velocity groundwater conditions. Cold Reg. Sci. Technol. 2021, 189, 103337. [Google Scholar] [CrossRef]
  14. Yu, X.; Li, F.; Zhang, J.; Ding, H.; Gao, W.; Zhang, S. Theoretical prediction of high-risk zone for early temperature cracks in well walls in deep-frozen shafts. Arch. Appl. Mech. 2023, 93, 1387–1400. [Google Scholar] [CrossRef]
  15. Wang, X.; Li, Z.; Sun, B.; Wang, Z.; Gao, Y.; Han, D.; Zhang, Y. Coupling mechanisms between cement hydration and permafrost during well construction in the Arctic region. Geoenergy Sci. Eng. 2023, 222, 211429. [Google Scholar] [CrossRef]
  16. Chen, W.; Wan, W.; He, H.; Liao, D.; Liu, J. Temperature Field Distribution and Numerical Simulation of Improved Freezing Scheme for Shafts in Loose and Soft Stratum; Springer: Vienna, Austria, 2024; Volume 57. [Google Scholar] [CrossRef]
  17. Hani, M.; Evirgen, B. Uncoupled thermo-hydro-mechanical modeling of a pykrete diaphragm wall for an alternative artificial ground freezing application. Comput. Geotech. 2024, 169, 106243. [Google Scholar] [CrossRef]
  18. Zhang, T. Study on the Evolution Law of Temperature Field of Frozen Well Wall in Deep and Thick Complex Formation; China University of Mining and Technology: Xuzhou, China, 2018. [Google Scholar]
  19. Zhang, J.; Wang, B.; Rong, C.; Long, W.; Yu, S. Temporal and Spatial Evolution Laws of Freezing Temperature Field in the Inclined Shaft of Water-Rich Sand Layers. Appl. Sci. 2023, 13, 8874. [Google Scholar] [CrossRef]
  20. Yang, Y.; Lei, D.; Chen, Y.; Cai, C.; Hou, S. Cold Regions Science and Technology Coupled thermal-hydro-mechanical model of deep artificial freezing clay. Cold Reg. Sci. Technol. 2022, 198, 103534. [Google Scholar] [CrossRef]
  21. Yan, Q.; Wu, W.; Zhong, H.; Zhao, Z.; Zhang, C. Temporal and spatial variation of temperature and displacement fields throughout cross-passage artificial ground freezing. Cold Reg. Sci. Technol. 2023, 209, 103817. [Google Scholar] [CrossRef]
  22. Wang, Y.; Mao, X.; Wu, Q.; Cai, P.; Ye, M.; Yin, S. Numerical Analysis of Concrete Hydration Heat Impact on Frozen Soil Temperature around Cast-in-Place Piles. Materials 2024, 17, 4375. [Google Scholar] [CrossRef]
  23. Lu, Y.; Liu, S.; Weng, L.; Wang, L.; Li, Z.; Xu, L. Fractal analysis of cracking in a clayey soil under freeze-thaw cycles. Eng. Geol. 2016, 208, 93–99. [Google Scholar] [CrossRef]
  24. Liu, J.; Xu, H.; Tao, Y.; Lyu, Q. Effects of clay content and subfreezing temperature on the freeze–thaw deformation properties of clayey soils. Catena 2024, 239, 107916. [Google Scholar] [CrossRef]
  25. An, R.; Zhang, X.; Wang, Y.; Liu, X.; Chen, C.; Gong, J. Freeze–Thaw Impact on Sandy Clay in Artificial Frozen Walls: An Investigation of Shear Strength and Pore-Size Distribution. Int. J. Geomech. 2022, 22, 04022230. [Google Scholar] [CrossRef]
  26. Liu, B.; Song, C.-J.; Li, T.; Yu, F. Interaction mechanism of deep-buried frozen soil wall and surrounding earth mass in excavation unloaded state. Editor. Off. J. China Coal Soc. 2012, 37, 3–7. [Google Scholar]
  27. Batog, M.; Giergiczny, Z. Influence of mass concrete constituents on its properties. Constr. Build. Mater. 2017, 146, 221–230. [Google Scholar] [CrossRef]
  28. Li, X.K.; Li, X.; Liu, S.; Qi, J.L. Thermal-seepage coupled numerical simulation methodology for the artificial ground freezing process. Comput. Geotech. 2023, 156, 105246. [Google Scholar] [CrossRef]
  29. Huang, X.; Rudolph, D.L. Coupled model for water, vapour, heat, stress and strain fields in variably saturated freezing soils. Adv. Water Resour. 2021, 154, 103945. [Google Scholar] [CrossRef]
  30. Liu, X.; Nowamooz, H.; Shen, Y.; Liu, Y.; Han, Y.; An, Y. Heat transfer analysis in artificial ground freezing for subway cross passage under seepage flow. Tunn. Undergr. Sp. Technol. 2023, 133, 104943. [Google Scholar] [CrossRef]
  31. Bai, Y.; Sun, Y.; Liu, W.; Sun, P.; Xiao, S. Model test study on the formation of basin-shaped freezing range in sandy gravel stratum under seepage conditions. Therm. Sci. Eng. Prog. 2024, 51, 102601. [Google Scholar] [CrossRef]
  32. Bai, Q.B.; Li, X.; Tian, Y.H.; Fang, J.H. Equations and numerical simulation for coupled water and heat transfer in frozen soil. Yantu Gongcheng Xuebao/Chin. J. Geotech. Eng. 2015, 37, 131–136. [Google Scholar] [CrossRef]
  33. Luckner, L.; van Genuchten, M.T.; Nielsen, D.R. A Consistent Set of Parametric Models for the Two-Phase Flowof Immiscible Fluids in the Subsurface. Water Resour. Res. 1989, 25, 2187–2193. [Google Scholar] [CrossRef]
  34. van Genuchten, M.T. A Closed-form Equation for Predicting the Hydraulic Conductivity of Unsaturated Soils. Soil Sci. Soc. Am. J. 1980, 44, 892–898. [Google Scholar] [CrossRef]
  35. Özişik, M.; David, W.; Hahn, M. Heat Conduction Fundamentals. In Heat Conduction; John Wiley & Sons, Ltd.: Hoboken, NJ, USA, 2012; Chapter 1; pp. 1–39. [Google Scholar] [CrossRef]
  36. Yang, T.J.; Wang, S.H.; Zhang, Z.; Gao, Y. Numerical Analysis on Hydro Thermal Coupling of Surrounding Rocks in Cold Region Tunnels. Dongbei Daxue Xuebao/J. Northeast. Univ. 2019, 40, 1178–1184. [Google Scholar]
  37. Su, L.F.; Cui, H.; Xu, B.Z. Research on Design Calculation Methods for Elasto-Plastic Vertical Shaft Walls. Coal Eng. 2018, 50, 1–5. [Google Scholar]
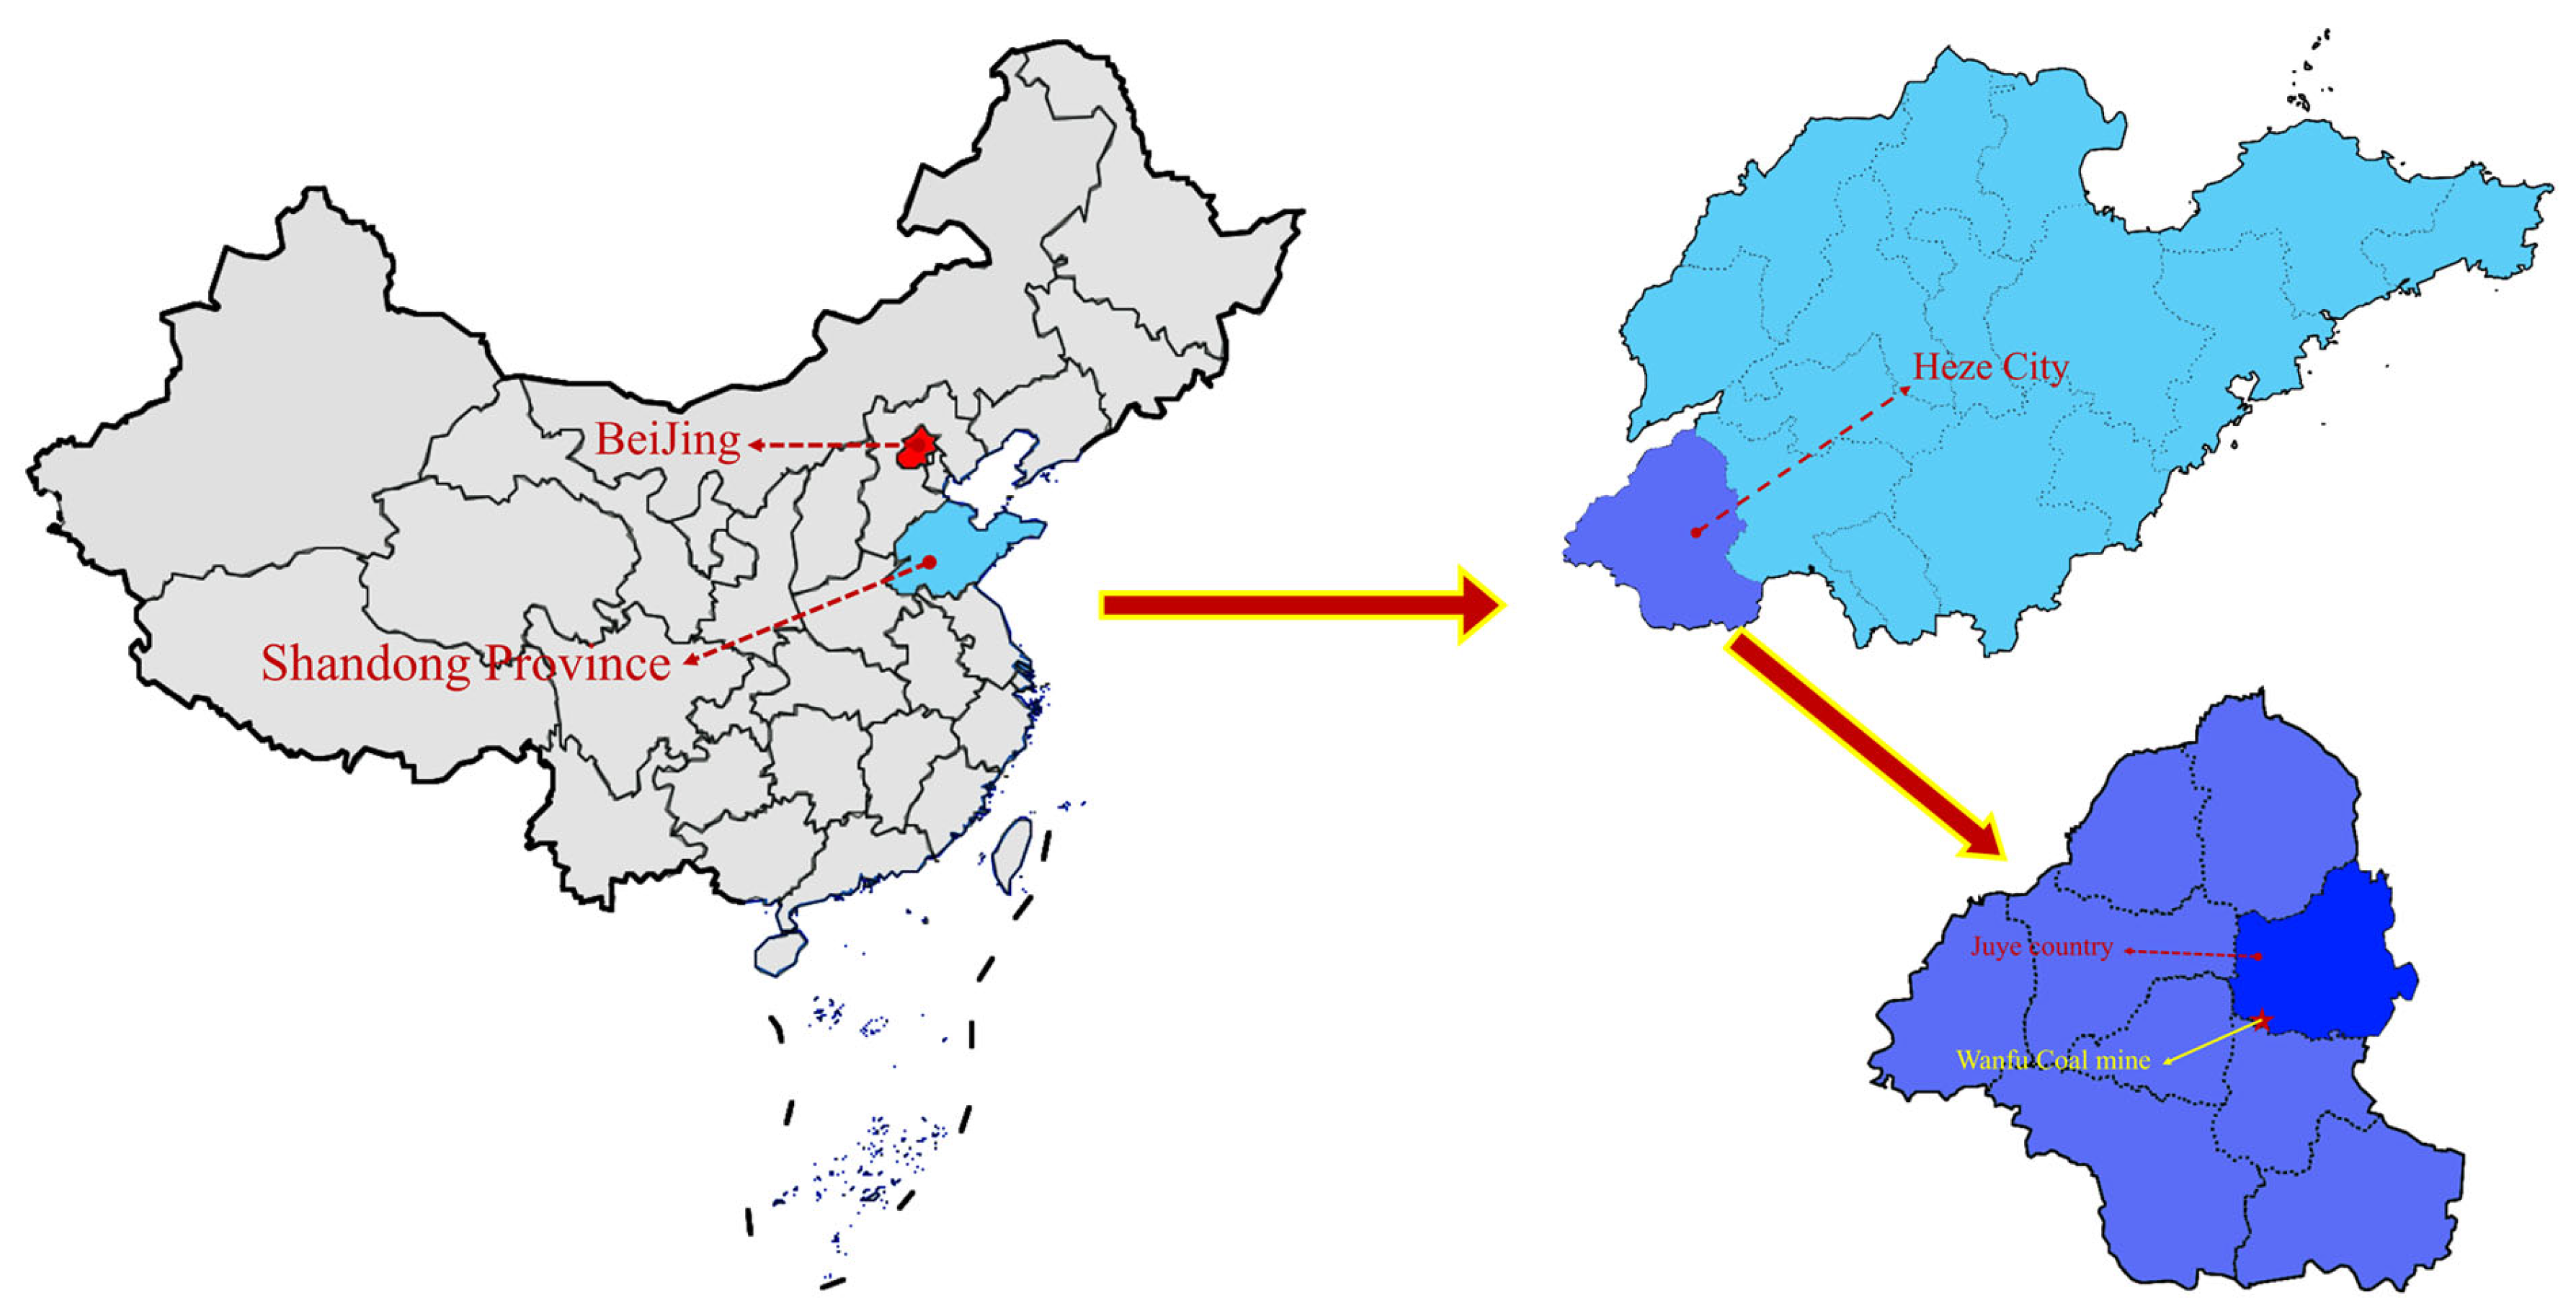
Figure 1. Location map of WangFu mine.
Processes 13 03319 g001
Figure 2. Freeze hole opening position and measurement point arrangement diagram.
Processes 13 03319 g002
Figure 3. The measurement of the on-site temperature and the layout of pressure boxes.
Processes 13 03319 g003
Figure 4. Variation curve of shaft wall temperature with time.
Processes 13 03319 g004
Figure 5. Variation curve of freezing wall temperature with time.
Processes 13 03319 g005
Figure 6. Variation curve of freezing pressure with time.
Processes 13 03319 g006
Figure 7. The experimental procedure for adiabatic temperature rise.
Processes 13 03319 g007
Figure 8. CF80 concrete adiabatic temperature rise curves and fitted curves.
Processes 13 03319 g008
Figure 9. Calculation model diagram.
Processes 13 03319 g009
Figure 10. Temperature field cloud of shaft wall after concrete casting.
Processes 13 03319 g010aProcesses 13 03319 g010b
Figure 11. Comparison between measured and simulated values of shaft wall temperature.
Processes 13 03319 g011
Figure 12. Variation curve of freezing wall temperature with radial width from shaft wall.
Processes 13 03319 g012
Figure 13. Comparison between measured and simulated values of freezing wall temperature.
Processes 13 03319 g013
Figure 14. Variation curve of unfrozen water content of frozen wall with radial width from shaft wall.
Processes 13 03319 g014
Figure 15. Displacement after early concrete placement.
Processes 13 03319 g015
Figure 16. Freezing pressure cloud of frozen wall after pouring.
Processes 13 03319 g016
Figure 17. Comparison of measured and simulated values of freezing pressure.
Processes 13 03319 g017
Figure 18. Curve of intensity versus time.
Processes 13 03319 g018
Table 1. Soil-related parameters.
ρ s
kg/m3
λ s
W/(m·K)
C s
kJ/(kg·K)
a
m−1
K s
m·s−1
m l θ s θ r T f
°C
19903.20.8332.655.8 × 10−70.260.50.3620.02−1.31
Table 2. Physical parameters of the steel fiber-reinforced concrete.
Thermal   Conductivity   λ c
W/(m·°C)
Specific   Heat   Capacity C c
kJ/(kg·°C)
Densities   ρ c
kg/m3
Cement Admixture   W
kg/m3
Q 0
kJ/kg
3.250.952491400385.3
Table 3. Equivalent thermal conductivity of polystyrene foam panels.
Time After Pouring of the Outer Wall/d0–11–22–3 3
Equivalent thermal conductivity/kJ/(m·h·°C)0.460.921.842.00
Table 4. Modulus of elasticity of steel fiber-reinforced concrete.
Times/d0–1.51.5–3.53.5–7.57.5–21
modulus of elasticity/GPa10253040
Table 5. Mechanical parameters of the frozen soil.
Soil Temperature/°CFrost Rate/%Modulus of Elasticity/MPaPoisson’s Ratio
−15/2940.152
−20/3370.137
−253.23750.128
−302.283840.127
−352.32/0.126
Table 6. Compressive strength of steel fiber-reinforced concrete CF80.
Concrete Curing Time/d13728
Compressive strength/MPa39.271.182.5110.2
Disclaimer/Publisher’s Note: The statements, opinions and data contained in all publications are solely those of the individual author(s) and contributor(s) and not of MDPI and/or the editor(s). MDPI and/or the editor(s) disclaim responsibility for any injury to people or property resulting from any ideas, methods, instructions or products referred to in the content.