Article

Modeling Anisotropic Permeability of Coal and Shale with Gas Rarefaction Effects, Matrix–Fracture Interaction, and Adsorption Hysteresis

1
PetroChina Huabei Oilfield Company, Renqiu 062550, China
2
State Key Laboratory of Oil and Gas Reservoir Geology and Exploitation, Southwest Petroleum University, Chengdu 610500, China
*
Author to whom correspondence should be addressed.
Processes 2025, 13(10), 3304; https://doi.org/10.3390/pr13103304
Submission received: 13 September 2025 / Revised: 8 October 2025 / Accepted: 14 October 2025 / Published: 15 October 2025
(This article belongs to the Special Issue Advances in Enhancing Unconventional Oil/Gas Recovery, 2nd Edition)

Abstract

Permeability of fissured sorbing rocks, such as coal and shale, controls gas transport and is relevant to a variety of scientific problems and industrial processes. Multiple gas transport and rock deformation mechanisms affect permeability evolution, including gas rarefaction effects, gas-sorption-induced anisotropic matrix–fracture interaction, and anisotropic deformation induced by effective stress variation. In this paper, a generic anisotropic permeability model is proposed to address the impacts of the above mechanisms and effects. Specifically, the influence of matrix–fracture interactions on permeability evolution is depicted through the nonuniform matrix swelling caused by the gas diffusion process from fracture walls into the matrix. The following characteristics are also incorporated in this model: (1) anisotropic mechanical and swelling properties, (2) arbitrary box-shaped matrix blocks due to the anisotropic rock structure, (3) adsorbability variation of different matrix blocks because of complex rock compositions, (4) adsorption hysteresis, and (5) dynamic tortuosity. The directional permeability models are derived based on the anisotropic poroelasticity theory and anisotropic swelling equations considering adsorption hysteresis. We use a gas-invaded-volume ratio to describe the nonuniform swelling of matrix blocks. Additionally, swelling of blocks with different adsorption and mechanical properties are characterized by a volume-weighted function. Finally, the anisotropic tortuosity is defined as a power law function of effective porosity. The model is verified against experimental data. Results show that four-stage permeability evolution with time can be observed. Permeability evolution in different directions follows its own ways and depends on anisotropic swelling, mechanical properties, and structures, even when the boundary conditions are identical. Adsorption hysteresis controls the local shrinkage region. Tortuosity variation significantly affects permeability but has the smallest influence on the local swelling region. The existence of multiple matrix types complicates the permeability evolution behavior.

1. Introduction

Rocks are generally anisotropic with their properties varying spatially and orientationally [1,2]. These properties, such as moduli, deformability, permeability, and the poromechanical responses of these rocks are frequently anisotropic [3,4]. It is widely reported that the permeability of coal and shale exhibits anisotropy to one extent or another [5,6,7]. In the literature, the permeability of these rocks is usually treated as isotropic, particularly in horizontal directions [5]. However, as illustrated in Figure 1, multi-scale fracture networks are well developed in structurally anisotropic shale and coal rocks. Their anisotropic nature and complex poromechanical behavior make it difficult to precisely describe the permeability evolution.
Many experimental investigations have been conducted to analyze directional permeability of fractured sorbing rocks. In terms of coal rocks, Tan et al. [5] measured coal permeability in three principal directions. Their results reveal that the face-cleat-direction permeability is 3.68 to 12.93 times larger than in the butt cleat direction. Liu et al. [11] performed anthracite coal permeability tests using cubic samples under true triaxial stress conditions. They found that the butt cleat plane exhibits a stronger stress sensitivity due to face cleat closure. Different from the above studies, Raza [12] used the mercury intrusion porosimetry combined with stress–strain measurements to obtain the cleat compressibility. The cleat compressibility can be utilized to calculate anisotropic coal permeability. Confining pressure can significantly affect cleat permeability, but its influence on permeability anisotropy is marginal [13]. As for shale rocks, Chalmers et al. [14] compared high-permeability isotropic and anisotropic Devonian shale samples. They found that anisotropic sample permeability is more stress sensitive. Bhandari et al. [15] documented vertical and horizontal permeability of Barnett Shale samples. When the confining pressure was increased from 10.3 to 41.4 MPa, the horizontal to vertical permeability ratio can be up to 40. Using cubic shale samples from the Longmaxi Formation, Pan et al. [16] conducted anisotropic permeability measurements and concluded that the permeability perpendicular to the bedding planes is approximately 4% of the permeability parallel to bedding. Their simulation results indicate that anisotropic permeability significantly affects gas production and should be applied to fluid flow modeling in shale gas reservoirs. Later, Ma et al. [17] investigated the relationship between the permeability directional dependency and fracture structures of cubic shale samples. The measured permeability ratios between the directions parallel and perpendicular to the bedding planes show a strong anisotropic feature and change from 5.2 to 510.5, while the permeability ratios between the two directions parallel to the bedding planes only range from 1.3 to 2.7.
Apart from experimental research, theoretical models are needed to explain laboratory observations and predict the permeability evolution under a wider spectrum of conditions. A variety of anisotropic permeability models have been established to describe the complex permeability evolution involved in gas migration within coal and shale rocks. Wu et al. [18] developed directional permeability–strain relations and found that coal permeability is dominated by boundary conditions, fracture distributions, and matrix–fracture interactions. Pan and Connell [19] added anisotropic swelling into the Shi and Durucan stress–permeability relationship [20] and proposed direction permeability ratios. Their work incorporated anisotropic swelling and structural anisotropy. To understand the links between sorption-induced coal permeability changes and directional strains, Liu et al. [21] proposed a modulus reduction ratio, which is the ratio of the coal bulk elastic modulus to the coal matrix modulus. It links anisotropic deformation and directional permeability. Chen et al. [22] optimized the design of multi-lateral wells for coal-seam-gas extraction based on a stress-dependent model with a certain permeability–anisotropy ratio. They found that anisotropic permeability is not only controlled by the rock structure and tortuosity, but also affected by directional swelling and mechanical properties. Then, Wang et al. [23] incorporated directional compaction, directional swelling, and non-Darcy flow to investigate gas extraction in coal seams. In their model, the Langmuir equation is extended to depict anisotropic swelling strains. To determine how anisotropic permeability changes under in situ conditions, Wang et al. [24] derived a directional permeability model for gas depletion under uniaxial conditions and considered the matrix internal swelling. Later, Moore et al. [7] formalized a transversely isotropic coal permeability model for vertically cleated coal rocks. Five elastic stiffness parameters (two Young’s moduli and three Poisson’s ratios) were used in their model. An et al. [25] presented a permeability model to evaluate anisotropic permeability changes caused by stress variation and gas adsorption/desorption and concluded that anisotropic permeability is crucial for well pattern selection. To include mining-induced mechanical responses, Zhang et al. [6] established an anisotropic permeability model that couples stress evolution, gas adsorption/desorption, and microfracture propagation. Their model can simulate stress evolution caused by different mining layouts. Li et al. [26] derived an anisotropic coal permeability model with the impact of heterogeneous fracture deformation and divided the coal rock into a soft part and a hard part. The magnitude of the permeability change under a certain confining stress depends on the proportion of the soft part. Based on the equivalent fracture aperture coefficient, Qi et al. [27] proposed an anisotropic coal permeability where this coefficient describes the anisotropy of mechanical and fluid flow properties. Through numerical simulation, they found that the differences in equivalent fracture aperture coefficients make the evolution trend significantly divergent in different directions even under the same boundary condition. Zeng et al. [28] utilized a new directional swelling model to address the impact of anisotropic local swelling on directional coal permeability evolution. More recently, Zeng et al. [29] established fully anisotropic coal permeability model involving gas slippage, creep deformation, and directional local matrix swelling/shrinkage based on the evolution of different strain components.
These directional permeability models may be versatile enough to explain certain field and laboratory observations; however, they neglect one or several of the following critical features of shale and coal rocks: (1) matrix block shapes of different rock samples can be divergent due to their unique sedimentary and tectonic processes; (2) the adsorbability and swelling properties are not identical for different matrix blocks within a rock because of nonuniform distributed organic materials and mineral components; (3) the swelling strains of the same rock vary orientationally [19]; (4) a conspicuous deviation (adsorption hysteresis) has been frequently observed when comparing the desorption and adsorption curves [30]; (5) rock deformation during fluid injection or extraction changes the flow channel tortuosity; and (6) the tight matrix blocks experience gas invading/depletion-induced nonuniform swelling/shrinkage which provides a long-term influence on permeability evolution [31]. The objective of this research is to incorporate all the above-mentioned aspects in anisotropic permeability modeling. Here, we develop an advanced anisotropic model for shale and coal rocks. Major methodologies used in this study are summarized as follows: (1) directional permeability models are built based on the anisotropic poroelasticity theory; (2) rectangular parallelepipeds (arbitrary box-shaped matrix blocks) serve as reasonable approximations for different shapes of matrix blocks; (3) a volume-average method is applied to represent the effects of adsorbability and swelling property variation of different matrix blocks within the rock; (4) modified Langmuir equations are utilized to depict directional swelling and adsorption hysteresis; (5) a dynamic porosity-tortuosity relation is inserted in our permeability model; and (6) gas invading/depletion-induced nonuniform swelling/shrinkage is simulated by a matrix–fracture pressure dependent gas invaded/depleted volume ratio [32]. The methodology section is organized as follows: the conceptual model is introduced first. The derivation of the gas invaded/depleted and uninvaded/undepleted matrix volume ratios that describe the magnitude of matrix–fracture interaction are presented later. Then, the local-swelling-induced fracture strain is calculated and will be used to describe the impact of matrix–fracture interaction on permeability. After that, matrix and fracture pressure terms are introduced according to matrix–fracture mass transfer. Next, the directional strain changes caused by directional swelling and effective stress variation are presented. Finally, by combining the gas rarefaction effects, the permeability models in different directions are obtained.

2. Conceptual Models

2.1. Matrix Blocks and Fractures

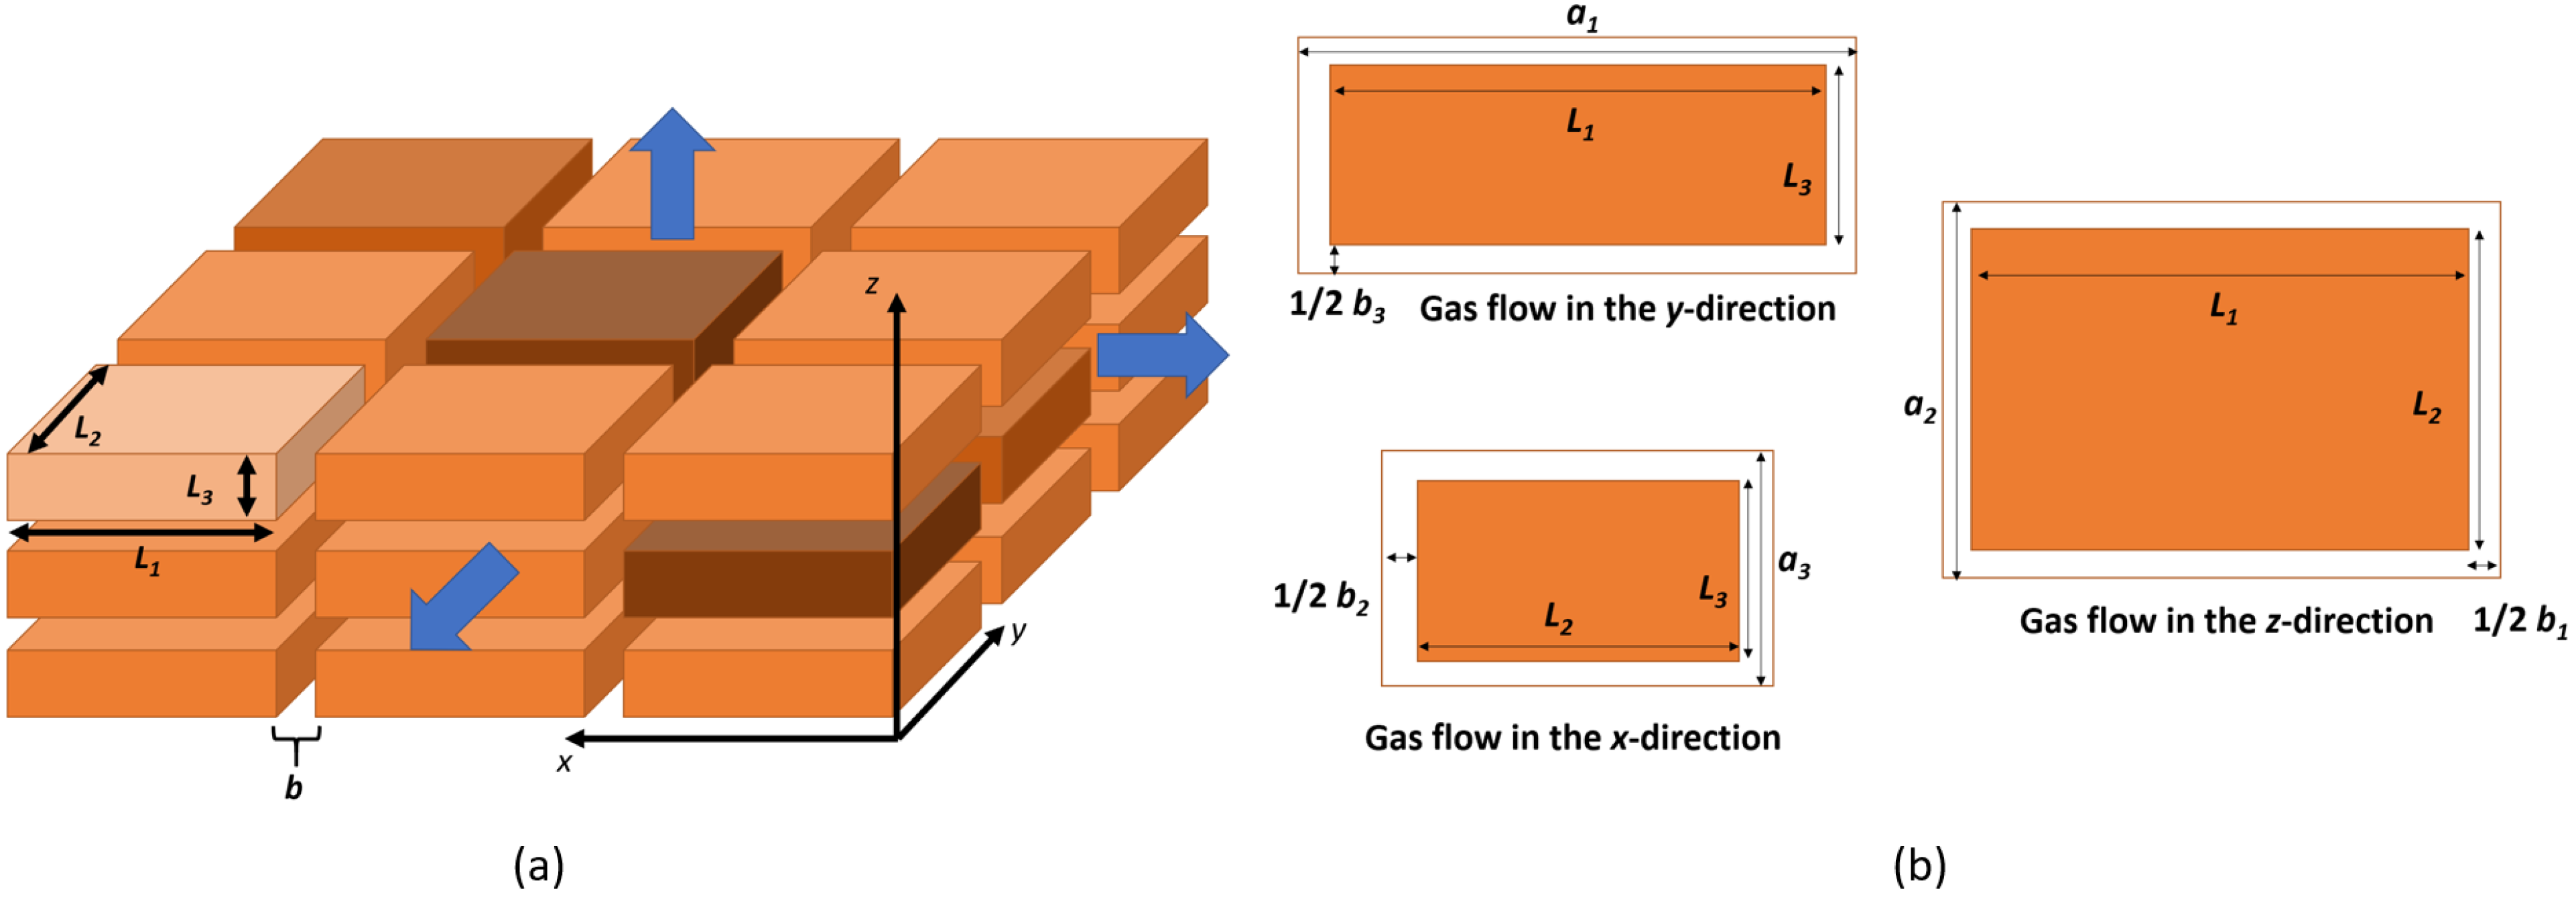
The coal and shale rocks are treated as a combination of matrix–block and fracture systems. In our conceptual model (Figure 2a), the effective pore space for gas flow is in the form of connected macro- or micro-fractures. The rocks consist of rectangular parallelepipeds and are orthotropic in their mechanical and swelling bulk properties. Similar to Reiss [33], it is assumed that both the flow channel aperture and the dimensions of the matrix block can be different. Here, L 1 , L 2 , and L 3 are the dimentions of the box-shaped block (m); a 1 , a 2 , and a 3 are the flow channel spacing in the three directions (m); and b 1 , b 2 , and b 3 are the corresponding flow channel aperture values (m), as shown in Figure 2b. The numbers 1, 2, and 3 represent x-, y-, and z-directions. In fact, because b L , it is assumed that a L in each direction. As illustrated in Figure 3, the tortuosity also exhibits anisotropy and is not identical in different directions.

2.2. Matrix–Fracture Interactions

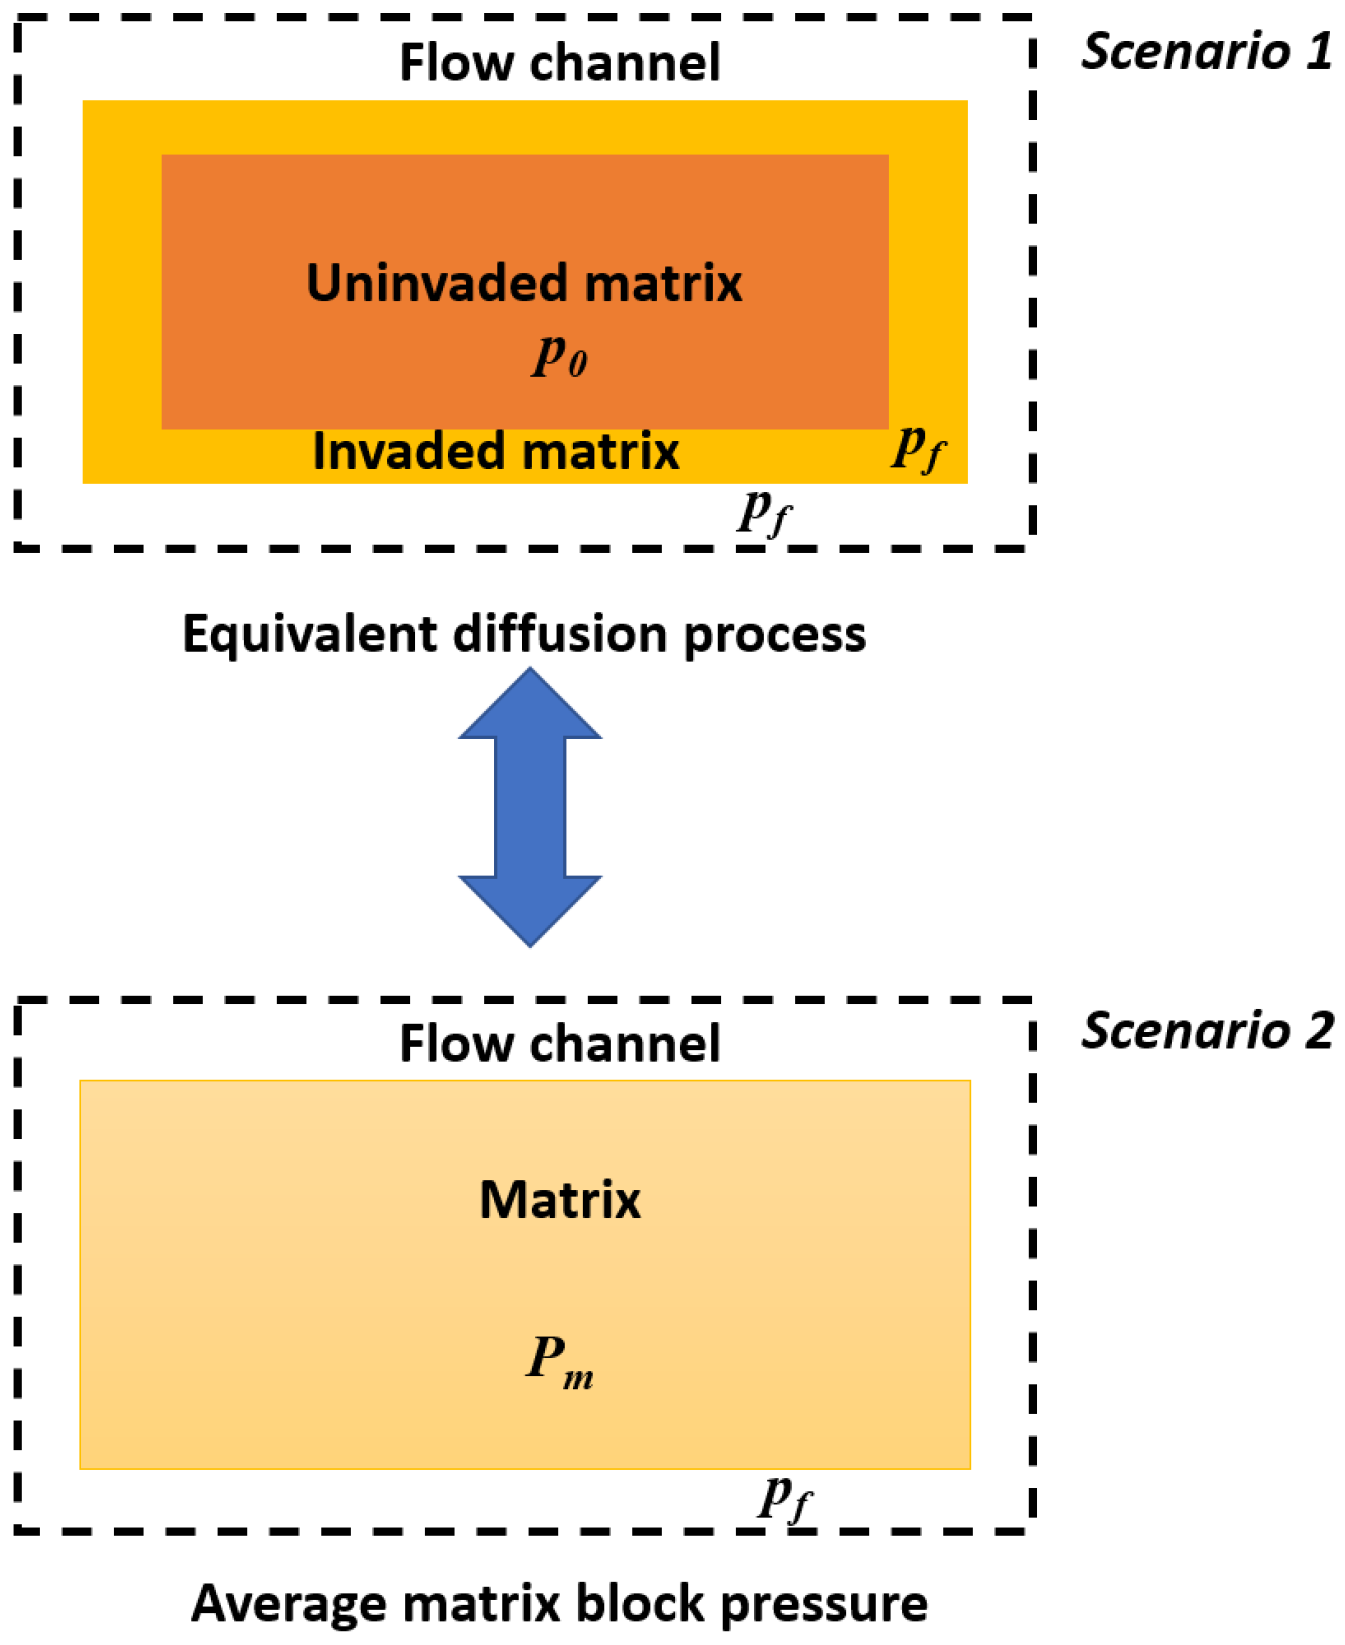
The gradual gas invading/depletion process from the fracture walls into the matrix during gas injection/extraction induces the transition from localized swelling/shrinkage at fracture surfaces to the bulk rock swelling/shrinkage (see Figure 4). The matrix swelling/shrinkage near the fracture surface is called local swelling, while the swelling/shrinkage of the whole rock refers to bulk swelling. The transition process between the two types of swelling/shrinkage generates matrix–fracture interactions. During gas injection or pressure depletion, the matrix block volume involves two parts: one is the gas invaded/depleted volume, and the other is the uninvaded/depleted volume under the initial condition. An invaded/depleted volume ratio is used to quantify how matrix swelling/shrinkage area expansion affects permeability evolution. It is the ratio of the gas invaded/depleted matrix volume to the total matrix volume, ranging from zero to one [32]. When the ratio is small, adsorption-induced matrix swelling is localized at the fracture surfaces and reduces the flow channel aperture. When the ratio increases, the whole rock swells, and localized swelling is transformed into bulk swelling, which enlarges both flow channel aperture and matrix block size. Since the matrix of coal and shale is usually extremely tight, this swelling transition procedure may last for a long time and would influence the long-term permeability evolution [31]. This ratio is used to characterize the magnitude of local and bulk swelling/shrinkage. In this study, a general pressure-dependent volume ratio is used. Two equivalent scenarios are used to represent matrix pressure and calculate the invaded/depleted volume ratio, as illustrated in Figure 4. Scenario 1 is the equivalent diffusion; it is similar to the previous study [32]. The gas invaded/depleted zone pressure is equal to the fracture (pore) pressure ( p f ), and the uninvaded/undepleted area pressure is equal to the initial pressure ( p 0 ). Scenario 2 shows the average pressure ( p m ) of the matrix block during gas invading/depletion. By using the volume-weighted average method, the following relations can be obtained:
p m V m = p f V e i n v + p 0 V e u n i n v ,
where V m , V e i n v , and V e u n i n v are the total matrix volume (m3), equivalent invaded/depleted matrix volume (m3), and the equivalent uninvaded/undepleted matrix volume (m3). The equilibrium diffusion is used because both p m and p f are functions of time, and the pressure distribution within the matrix during gas invaded is unknown. Even though one knows matrix pressure distribution, it is difficult to incorporate the distribution into the Langmuir equation to represent local swelling. Based on Equation (1), the pressure-dependent equivalent invaded/depleted and uninvaded/undepleted matrix volume ratios can be obtained as follows:
R e i n v = V e i n v V m = p m p 0 p f p 0 ,
R e u n i n v = 1 p m p 0 p f p 0 = p f p m p f p 0
In the next section, the expressions of p m and p f will be introduced. From Equations (2) and (3), it is clear that the fully invaded/depleted condition would be reached when p f = p m , which is consistent with the definition of equilibrium. For some coal samples, swelling in the direction perpendicular to bedding planes is approximately twice that of the direction parallel to bedding planes [19]. The local-swelling-induced directional matrix size change is defined based on Wang et al. [23], Peng et al. [34], and our previous study [32] as follows:
Δ L l i = ε l m s i L o i ,
where ε l m s i is the local swelling strain in direction i, and L o i is the original matrix size in direction i (m). According to Peng et al. [34], the local-swelling-induced fracture strain in direction i is
ε l f s i = b l i b o i = Δ L l i b o i = ε l m s i L o i b o i ε l m s i b o i + L o i b o i = ε l m s i a o i b o i ,
where b o i and a o i are the original fracture aperture and original fracture spacing in direction i (m), and L o i b o i . Detailed expressions of these swelling strains are given in the next section.

3. Formulation of the Conceptual Model

Based on the above conceptual model, one can derive the mathematical models including matrix and fracture pressure models, rock swelling models, and the directional permeability models.

3.1. Pressure of Matrix and Fracture Systems

The fracture (pore) pressure for gas injection is correlated as [32,35,36,37]
p f t = p 0 + p e p 0 1 e x p t / t d ,
where p e is the injection pressure (Pa) and t d = p e p 0 / C . Here, C is a coefficient (Pa/s) [35]. For gas depletion, the characteristic time t d = p e p 0 / C [32]. According to Zimmerman [38], the matrix–fracture mass exchange is given by
d p m t d t = α k m ϕ m c m a p p μ p f t p m t = α D m e p f t p m t ,
where k m is matrix block permeability (m2); ϕ m is the matrix block porosity; μ is the viscosity (Pa.s); and c m a p p is the apparent matrix compressibility with adsorption effects (Pa−1) [39,40]. It is difficult to obtain an analytical solution of p m t if one uses the dynamic expressions of all these matrix properties. In this situation, researchers [41,42,43] have suggested that using the average pressure p ¯ = p e + p 0 / 2 to linearize these transport properties. It should be noted that the term k m / ϕ m c m a p p μ is actually the matrix diffusivity with a unit of m2/s and use an equivalent matrix diffusivity ( D m e ) to approximate the transport properties during matrix–fracture inter-porosity flow. In our simulation, D m e is determined based on the literature data and experimental result matching. The equivalent diffusivity for practical applications can be directly measured using intact coal or shale samples (without fractures). Different matrix blocks may have different D m e . The shape factor in Equation (7) is calculated based on the matrix block geometry [44].
α = π 2 1 L 1 2 + 1 L 2 2 + 1 L 3 2
Since the influence of the block size change on shape factor calculation is marginal, one can assume α = α 0 . Initially, p m 0 = p 0 . Combining the initial condition and Equations (6)–(8) and solving Equation (7) yield
p m t = p e 1 e x p α D m e t + p 0 e x p α D m e t + α D m e p e p 0 α D m e 1 / t d e x p α D m e t e x p t / t d
Here, the matrix pressure for different types of matrix blocks is not identical because the matrix diffusivity varies with matrix types. The overall matrix pressure is p m = j = 1 n ω j p m , j , where the subscript j represents the jth matrix block type and ω j is its volume fraction.

3.2. Rock Swelling Models

The equivalent gas invading/depletion handles the transition from local swelling to bulk swelling. Here, the swelling strain differences are introduced for local and bulk swelling with consideration of adsorption hysteresis and different matrix types. These strain differences would be applied to the permeability equations. Adsorption hysteresis is frequently observed in gas-sorbing-rock systems [30,45]. The curves for desorption and adsorption of the same sample are not coincident [46]. Interestingly, the adsorption and desorption capacities are the same at the final equilibrium pressure (the intersection of adsorption and desorption curves) [47]. To describe the hysteresis phenomena, classical and modified Langmuir equations under the final equilibrium pressure ( p e q ) are used to represent volumetric adsorption and desorption capacities, respectively [47],
V a d = V a d L p e q p L + p e q = V d e = V d e L p e q ζ p L + p e q ,
where V a d is the adsorption capacity per unit matrix volume (m3/m3); V a d L is the Langmuir volume for gas isothermal adsorption (m3/m3); p L is the Langmuir pressure constant (Pa); V d e is the desorption capacity per unit matrix volume (m3/m3); V d e L is the Langmuir volume for gas isothermal desorption (m3/m3); and ζ is a hysteresis parameter that ranges from 0 to 1 [47]. In this study, the modified Langmuir equations of Wang et al. [23] and the adsorption hysteresis equations of Zhang and Liu [47] are used to define the following directional swelling/shrinkage strain differences [32]:
Δ ε b s i , a d = ε b s i , a d ε b s i 0 , a d = ε L b i , a d p f p f + p L b i p 0 p 0 + p L b i R e i n v ,
ε l f s i , a d = ε l m s i 0 , a d ε l m s i , a d a o i b o i = ε L m i , a d p m p m + p L m i p 0 p 0 + p L m i 1 R e i n v R e i n v a o i b o i ,
Δ ε b s i , d e = ε b s i , d e ε b s i 0 , d e = ε L b i , d e p f p f + ζ p L b i p 0 p 0 + ζ p L b i R e i n v ,
ε l f s i , d e = ε l m s i 0 , d e ε l m s i , d e a o i b o i = ε L m i , d e p m p m + ζ p L m i p 0 p 0 + ζ p L m i 1 R e i n v R e i n v a o i b o i ,
where the subscripts ad and de represent adsorption- and desorption-related properties; ε L b i and ε L m i are the directional bulk and matrix swelling strain constants; and p L b i and p L m i are the directional Langmuir pressure (Pa). ε L m is an invaded/depleted matrix volume parameter. Through multiplying it by R e i n v to represent total-matrix-volume-averaged effects. The bulk properties are the apparent rock properties which have included the influence of different matrix blocks. However, for local swelling/shrinkage, Equations (12) and (14) should be modified as volume-weighted ones to account for effects of different matrix blocks
ε l f s i , a d = j = 1 n ω j ε L m i , a d p m p m + p L m i p 0 p 0 + p L m i j R e i n v 1 R e i n v a o i b o i ,
ε l f s i , d e = j = 1 n ω j ε L m i , d e p m p m + ζ p L m i p 0 p 0 + ζ p L m i j R e i n v 1 R e i n v a o i b o i ,

3.3. Permeability Models

According to Reiss [33], the intrinsic permeability of a flow channel in Figure 2 is given by
k i n t = b 2 12 .
Since b i a i , the effective total porosity for gas flow is expressed by [33]
ϕ = b 1 a 1 + b 2 a 2 + b 3 a 3 .
The bulk permeability for direction 1 can be expressed as [33]
k 1 = b 2 2 12 b 2 a 2 + b 3 2 12 b 3 a 3 .
The tortuosity is expressed as a function of porosity [48]
τ = ϕ θ ,
where θ is an exponential coefficient. Due to the anisotropy, even with the same total porosity, the tortuosity for each flow direction may be different. The exponent is not universal [49] and has to be determined by matching with experimental data for each direction. Therefore, the bulk permeability becomes
k 1 = 1 τ 1 b 2 2 12 b 2 a 2 + b 3 2 12 b 3 a 3 = b 1 a 1 + b 2 a 2 + b 3 a 3 θ 1 b 2 3 12 a 2 + b 3 3 12 a 3
Similarly, one can have
k 2 = b 1 a 1 + b 2 a 2 + b 3 a 3 θ 2 b 1 3 12 a 1 + b 3 3 12 a 3 ,
k 3 = b 1 a 1 + b 2 a 2 + b 3 a 3 θ 3 b 2 3 12 a 2 + b 1 3 12 a 1 .
The strains and stresses are assumed to be positive in compression [50]. Considering the orthorhombic feature of rocks, the following anisotropic dual-porosity poroelastic equations with multiple matrix block types are obtained [51,52,53,54,55]:
d ε 11 = d a 1 a 1 = d σ 11 E 1 ν 21 d σ 22 E 2 ν 31 d σ 33 E 3 β 1 d p f j = 1 n ω j γ j d p m , j d ε b s 1 ,
d ε 22 = d a 2 a 2 = d σ 22 E 2 ν 12 d σ 11 E 1 ν 32 d σ 33 E 3 β 2 d p f j = 1 n ω j γ j d p m , j d ε b s 2 ,
d ε 33 = d a 3 a 3 = d σ 33 E 3 ν 13 d σ 11 E 1 ν 23 d σ 22 E 2 β 3 d p f j = 1 n ω j γ j d p m , j d ε b s 3 ,
where σ i i is the normal stress in the i-direction (Pa); E i is the Young’s modulus in direction i (Pa); and ν i j is the directional Poisson’s ratio. Note that the mechanical properties have the following relationships: ν 23 E 3 = ν 32 E 2 , ν 13 E 3 = ν 31 E 1 , and ν 12 E 2 = ν 21 E 1 . The shear moduli do not interact with the modes of interest for pore–fluid systems with orthotropic symmetry [51]. Here, β 1 , β 2 , and β 3 are expressed as [51,56]
β 1 = 1 E 1 ν 21 E 2 ν 31 E 3 1 3 K m = 1 E 1 ν 12 E 1 ν 13 E 1 1 3 K m = 1 3 K 1 1 3 j = 1 n ω j K m , j ,
β 2 = 1 E 2 ν 12 E 1 ν 32 E 3 1 3 K m = 1 E 2 ν 21 E 2 ν 23 E 2 1 3 K m = 1 3 K 2 1 3 j = 1 n ω j K m , j ,
β 3 = 1 E 3 ν 13 E 1 ν 23 E 2 1 3 K m = 1 E 3 ν 31 E 3 ν 32 E 3 1 3 K m = 1 3 K 3 1 3 j = 1 n ω j K m , j ,
γ j = 1 3 K m , j 1 3 K s , j ,
where K m is the average matrix bulk modulus (Pa); K m , j and K s , j are the matrix bulk modulus and rock grain modulus of matrix j (Pa); and K i is the bulk modulus in direction i (Pa). By following the assumption of Carroll [57] and assuming the grains themselves and the matrix blocks at the intact rock level [58] are uniform and isotropic, one can assume that K m = K s . Similarly, the flow channel aperture changes are
d ε f 11 = d b 1 b 1 = d σ 11 E f 1 ν f 21 d σ 22 E f 2 ν f 31 d σ 33 E f 3 β f 1 d p f j = 1 n ω j γ j d p m , j d ε b s 1 d ε l f s 1 ,
d ε f 22 = d b 2 b 2 = d σ 22 E f 2 ν f 12 d σ 11 E f 1 ν f 32 d σ 33 E f 3 β f 2 d p f j = 1 n ω j γ j d p m , j d ε b s 2 d ε l f s 2 ,
d ε f 33 = d b 3 b 3 = d σ 33 E f 3 ν f 13 d σ 11 E f 1 ν f 23 d σ 22 E f 2 β f 3 d p f j = 1 n ω j γ j d p m , j d ε b s 3 d ε l f s 3 ,
β f 1 = 1 E f 1 ν f 21 E f 2 ν f 31 E f 3 1 3 K m = 1 E f 1 ν f 12 E f 1 ν f 13 E f 1 1 3 K m = 1 3 K f 1 1 3 K m ,
β f 2 = 1 E f 2 ν f 12 E f 1 ν f 32 E f 3 1 3 K m = 1 E f 2 ν f 21 E f 2 ν f 23 E f 2 1 3 K m = 1 3 K f 2 1 3 K m ,
β f 3 = 1 E f 3 ν f 13 E f 1 ν f 23 E f 2 1 3 K m = 1 E f 3 ν f 31 E f 3 ν f 32 E f 3 1 3 K m = 1 3 K f 3 1 3 K m ,
Assuming that the mechanical properties are constants and by integrating Equations (24)–(26) and Equations (31)–(33), the following can be yielded:
a 1 a 1,0 = e x p σ 11 E 1 + ν 21 σ 22 E 2 + ν 31 σ 33 E 3 + β 1 p f + j = 1 n ω j γ j p m , j + ε b s 1 ,
a 2 a 2,0 = e x p σ 22 E 2 + ν 12 σ 11 E 1 + ν 32 σ 33 E 3 + β 2 p f + j = 1 n ω j γ j p m , j + ε b s 2 ,
a 3 a 3,0 = e x p σ 33 E 3 + ν 13 σ 11 E 1 + ν 23 σ 22 E 2 + β 3 p f + j = 1 n ω j γ j p m , j + ε b s 3 ,
b 1 b 1,0 = e x p σ 11 E f 1 + ν f 21 σ 22 E f 2 + ν f 31 σ 33 E f 3 + β f 1 p f + j = 1 n ω j γ j p m , j + ε b s 1 + ε l f s 1 ,
b 2 b 2,0 = e x p σ 22 E f 2 + ν f 12 σ 11 E f 1 + ν f 32 σ 33 E f 3 + β f 2 p f + j = 1 n ω j γ j p m , j + ε b s 2 + ε l f s 2 ,
b 3 b 3,0 = e x p σ 33 E f 3 + ν f 13 σ 11 E f 1 + ν f 23 σ 22 E f 2 + β f 3 p f + j = 1 n ω j γ j p m , j + ε b s 3 + ε l f s 3 .
The Knudsen-number-based approach is utilized to describe the influence of flow regimes on permeability evolution [32,59,60]. Recalling the directional bulk permeability equations and adding the influence of flow regimes, one can obtain the following permeability ratios:
k 1 k 1,0 = b 1 a 1 + b 2 a 2 + b 3 a 3 b 1,0 a 1,0 + b 2,0 a 2,0 + b 3,0 a 3,0 θ 1 b 2 3 12 a 2 C β a 2 1 + α k 2 K n 2 1 + 6 K n 2 1 + K n 2 + b 3 3 12 a 3 C β a 3 1 + α k 3 K n 3 1 + 6 K n 3 1 + K n 3 b 2,0 3 12 a 2,0 C β a 2,0 1 + α k 2,0 K n 2,0 1 + 6 K n 2,0 1 + K n 2,0 + b 3,0 3 12 a 3,0 C β a 3,0 1 + α k 3,0 K n 3,0 1 + 6 K n 3,0 1 + K n 3,0 ,
k 2 k 2,0 = b 1 a 1 + b 2 a 2 + b 3 a 3 b 1,0 a 1,0 + b 2,0 a 2,0 + b 3,0 a 3,0 θ 2 b 1 3 12 a 1 C β a 1 1 + α k 1 K n 1 1 + 6 K n 1 1 + K n 1 + b 3 3 12 a 3 C β a 3 1 + α k 3 K n 3 1 + 6 K n 3 1 + K n 3 b 1,0 3 12 a 1,0 C β a 1,0 1 + α k 1,0 K n 1,0 1 + 6 K n 1,0 1 + K n 1,0 + b 3,0 3 12 a 3,0 C β a 3,0 1 + α k 3,0 K n 3,0 1 + 6 K n 3,0 1 + K n 3,0 ,
k 3 k 3,0 = b 1 a 1 + b 2 a 2 + b 3 a 3 b 1,0 a 1,0 + b 2,0 a 2,0 + b 3,0 a 3,0 θ 3 b 2 3 12 a 2 C β a 2 1 + α k 2 K n 2 1 + 6 K n 2 1 + K n 2 + b 1 3 12 a 1 C β a 1 1 + α k 1 K n 1 1 + 6 K n 1 1 + K n 1 b 2,0 3 12 a 2,0 C β a 2,0 1 + α k 2,0 K n 2,0 1 + 6 K n 2,0 1 + K n 2,0 + b 1,0 3 12 a 1,0 C β a 1,0 1 + α k 1,0 K n 1,0 1 + 6 K n 1,0 1 + K n 1,0 ,
where the subscript 0 represents the initial conditions, C β a i is the flow channel shape correction function; β a i is the aspect ratio of a i / b i ; K n i is the Knudsen number, which is a function of b i and the mean free path; and α k i is a coefficient.

4. Model Verification

In this section, the anisotropic permeability model is verified against directional coal permeability measurement data under constant average pore (fracture) pressure conditions. Since the matrix–fracture pressure equilibrium is assumed to be achieved under constant pore pressure conditions [32,61], the reliability of the invaded volume ratio in handling matrix–fracture nonequilibrium is further checked by comparing it with shale permeability testing data from constant confining pressure conditions. Model validation for other mechanisms, such as directional swelling and adsorption hysteresis, has been validated by the original papers [23,47].

4.1. Constant Average Pore Pressure Conditions

In the constant average pore pressure experiment, the directional permeability measurement results are from the cubic coal sample (sample 1) of Tan et al. [5]. Direction 1 refers to the face cleat direction, direction 2 is the butt cleat direction, and direction 3 is perpendicular to the bedding planes. Methane adsorption had reached equilibrium before permeability measurement [5], which is consistent with the assumption for constant average pore pressure cases ( ε b s i = ε l f s i = 0 , p f = p m , and R e i n v = 1 ) [32,61]. Therefore, Equations (37)–(42) become [61]
a 1 a 1,0 = e x p σ 11 E 1 + ν 21 σ 22 E 2 + ν 31 σ 33 E 3 ,
a 2 a 2,0 = e x p σ 22 E 2 + ν 12 σ 11 E 1 + ν 32 σ 33 E 3 ,
a 3 a 3,0 = e x p σ 33 E 3 + ν 13 σ 11 E 1 + ν 23 σ 22 E 2 ,
b 1 b 1,0 = e x p σ 11 E f 1 + ν f 21 σ 22 E f 2 + ν f 31 σ 33 E f 3 ,
b 2 b 2,0 = e x p σ 22 E f 2 + ν f 12 σ 11 E f 1 + ν f 32 σ 33 E f 3 ,
b 3 b 3,0 = e x p σ 33 E f 3 + ν f 13 σ 11 E f 1 + ν f 23 σ 22 E f 2 .
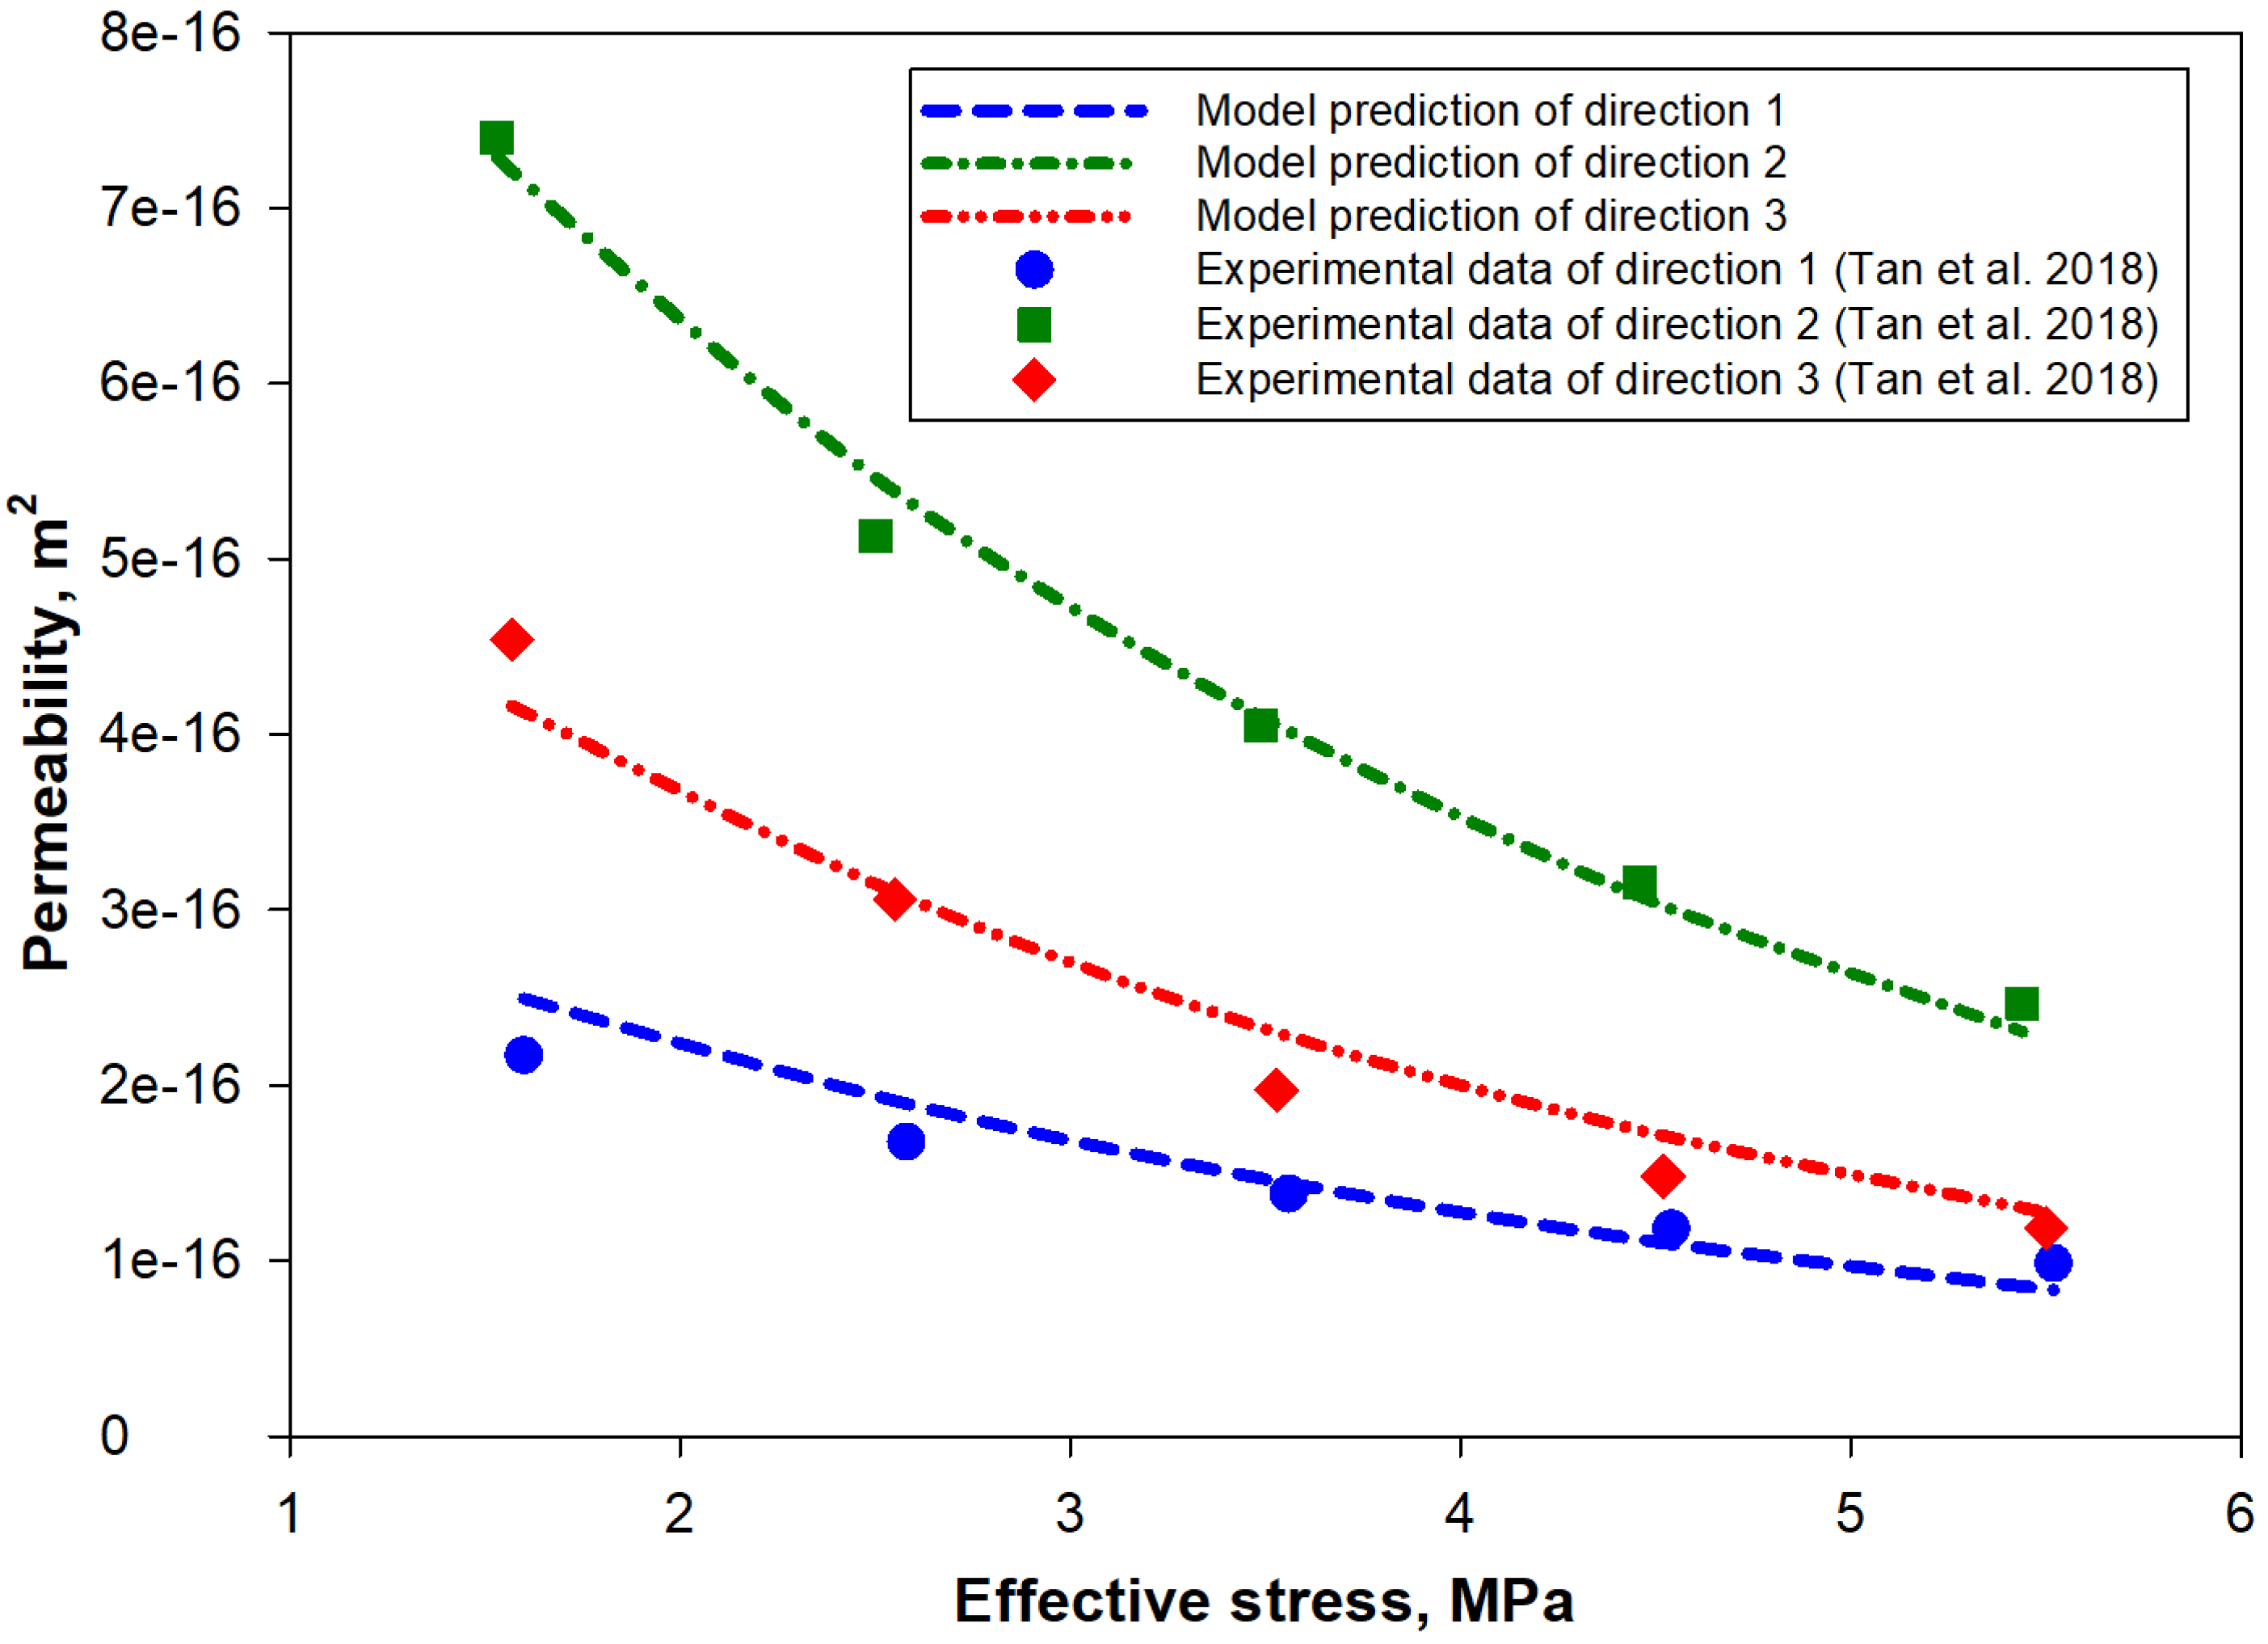
Substituting Equations (46)–(51) into Equations (43)–(45) yields the directional permeability models. Since the initial pressure and effective stress conditions for the three directional permeability measurement procedures are almost the same [5], the same initial flow channel spacing and aperture values are used in the three simulation cases. For the test in direction 1, the pore pressure was fixed at 1.55 MPa, and the confining pressure increased from 3.15 to 7.07 MPa. As for direction 2, the pore pressure was about 1.13 MPa with the confining pressure changed from 2.66 to 6.58 MPa. In the vertical-direction measurement, the pore pressure was around 1.08 MPa, while the confining pressure was within the range of 2.65 to 6.58 MPa. All the input parameters are selected from the literature and strictly determined through experimental data matching, as shown in Table 1. Figure 5 shows a good agreement between model prediction and experimental results. With the effective stress increases, the permeability in different directions drops in their own ways. The vertical permeability is higher than that in direction 1 because interconnected cleats are better developed in the vertical direction, which is evidenced by CT scanning [5]. Detailed explanation of experimental data has been given by Tan et al. [5]. The errors between calculation results and measured permeability are 4.25–15.6%, 1.29–6.58%, and 1.27–15.6% in directions 1, 2, and 3, respectively.

4.2. Constant Confining Pressure Conditions

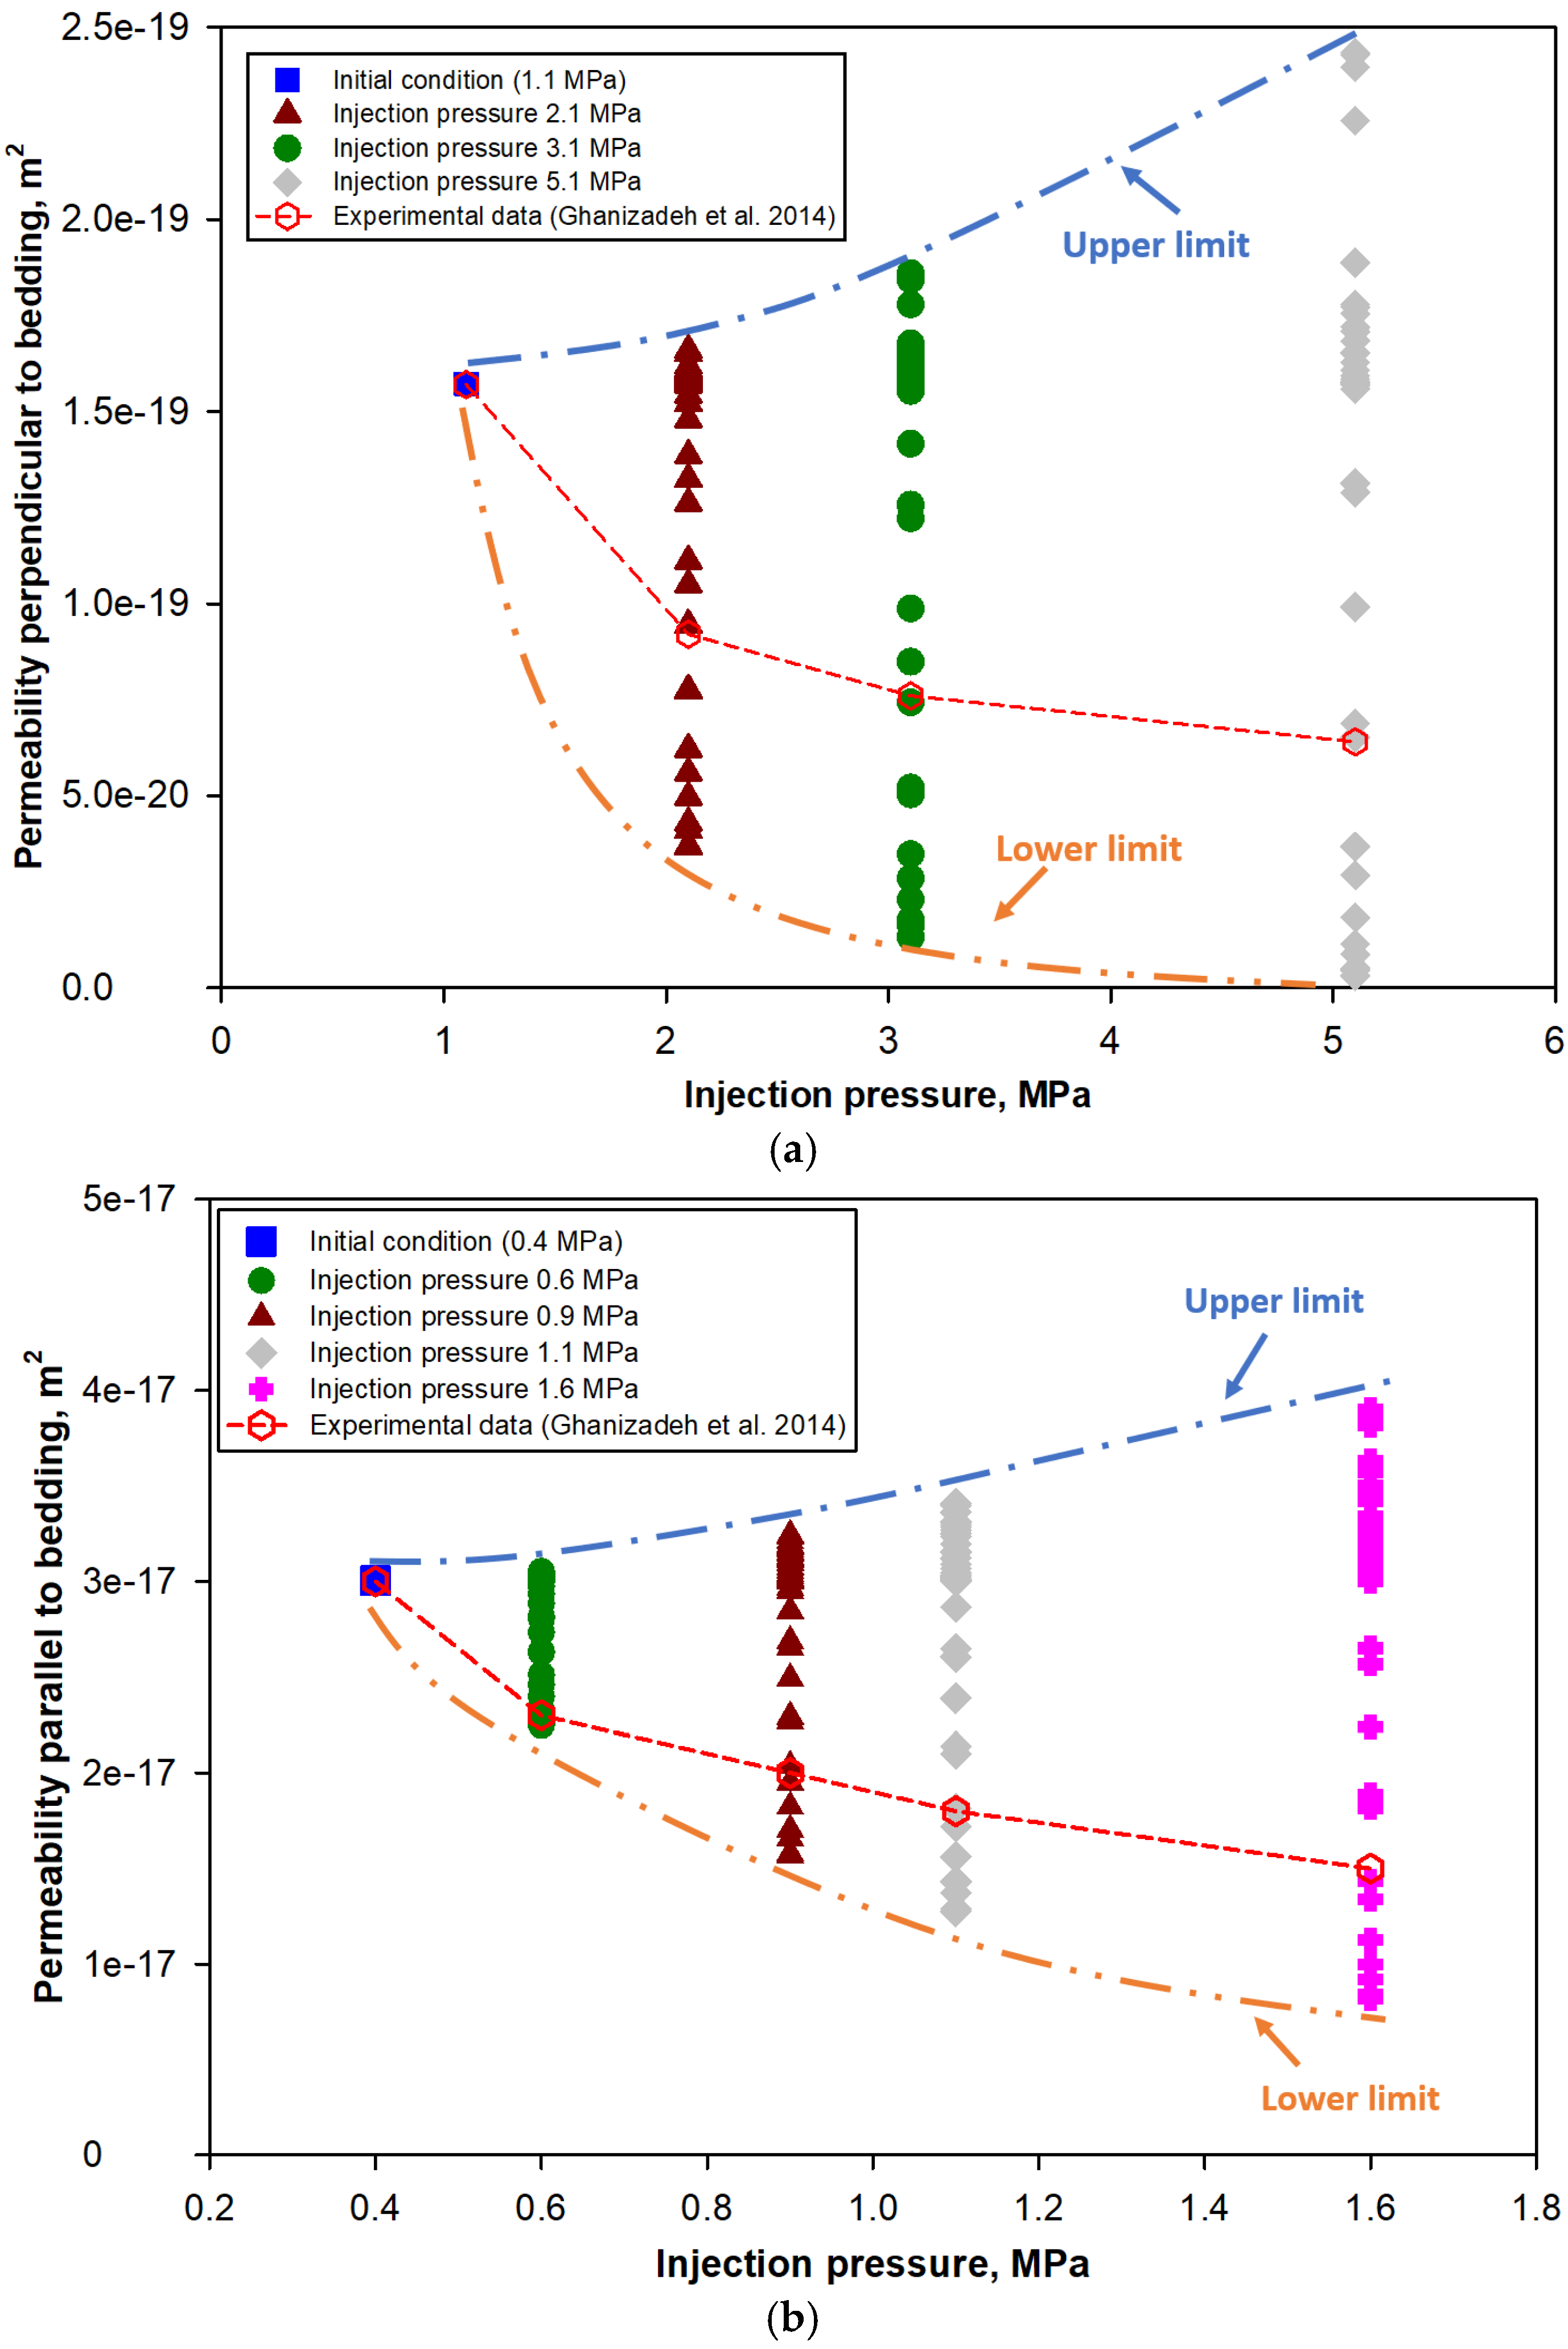
After checking the ability of handling anisotropic permeability evolution under constant average pore pressure conditions, the reliability of the invaded/depleted volume ratio is investigated. Experimental data matching is performed under constant confining pressure conditions. The two shale samples were collected from the same well at the same depth [66]. Their orientations with respect to bedding are perpendicular and parallel, respectively. Since only the permeability data in one horizontal direction are available, it is assumed that the permeability in direction 1 represents the permeability parallel to bedding. Methane is injected as the flowing fluid. Table 2 shows the permeability measurement data. The confining pressure of the two cases is fixed at around 30 MPa, while the pore pressure gradually increases. The effective porosity for gas flow can be significantly lower than the measured porosity because only flow channel porosity contributes to gas flow in our conceptual model [32]. The validation is presented in the form of permeability maps. The input parameters for simulation are listed in Table 3. The permeability maps of the two directions are shown in Figure 6a,b. Each vertical bar provides the range of permeability under a certain injection pressure level [67]. Each measured permeability value is only one point within the range. The upper and lower limits envelope the measured permeability curves. The upper boundary represents the final equilibrium permeability, and the lower boundary describes the permeability with maximum local swelling [32]. The values in between are all possible permeability points during a measurement procedure under a fixed injection condition [32]. Even the magnitudes of permeability in the two directions are dramatically different, the two permeability maps generated by this general anisotropic permeability model explain the experimental observations.
Note that this model is also capable of handling constant Terzaghi effective stress conditions if one uses σ = Δ p f in simulation as demonstrated.

5. Results and Discussion

After model validation, the calibrated permeability model is used to analyze directional permeability evolution. During the gas injection/production procedure within a reservoir, the overburden pressure is almost unchanged, which is similar to the constant confining pressure condition. Therefore, the constant confining pressure case in our model validation is used for analyses and discussion.

5.1. Anisotropic Permeability Ratios

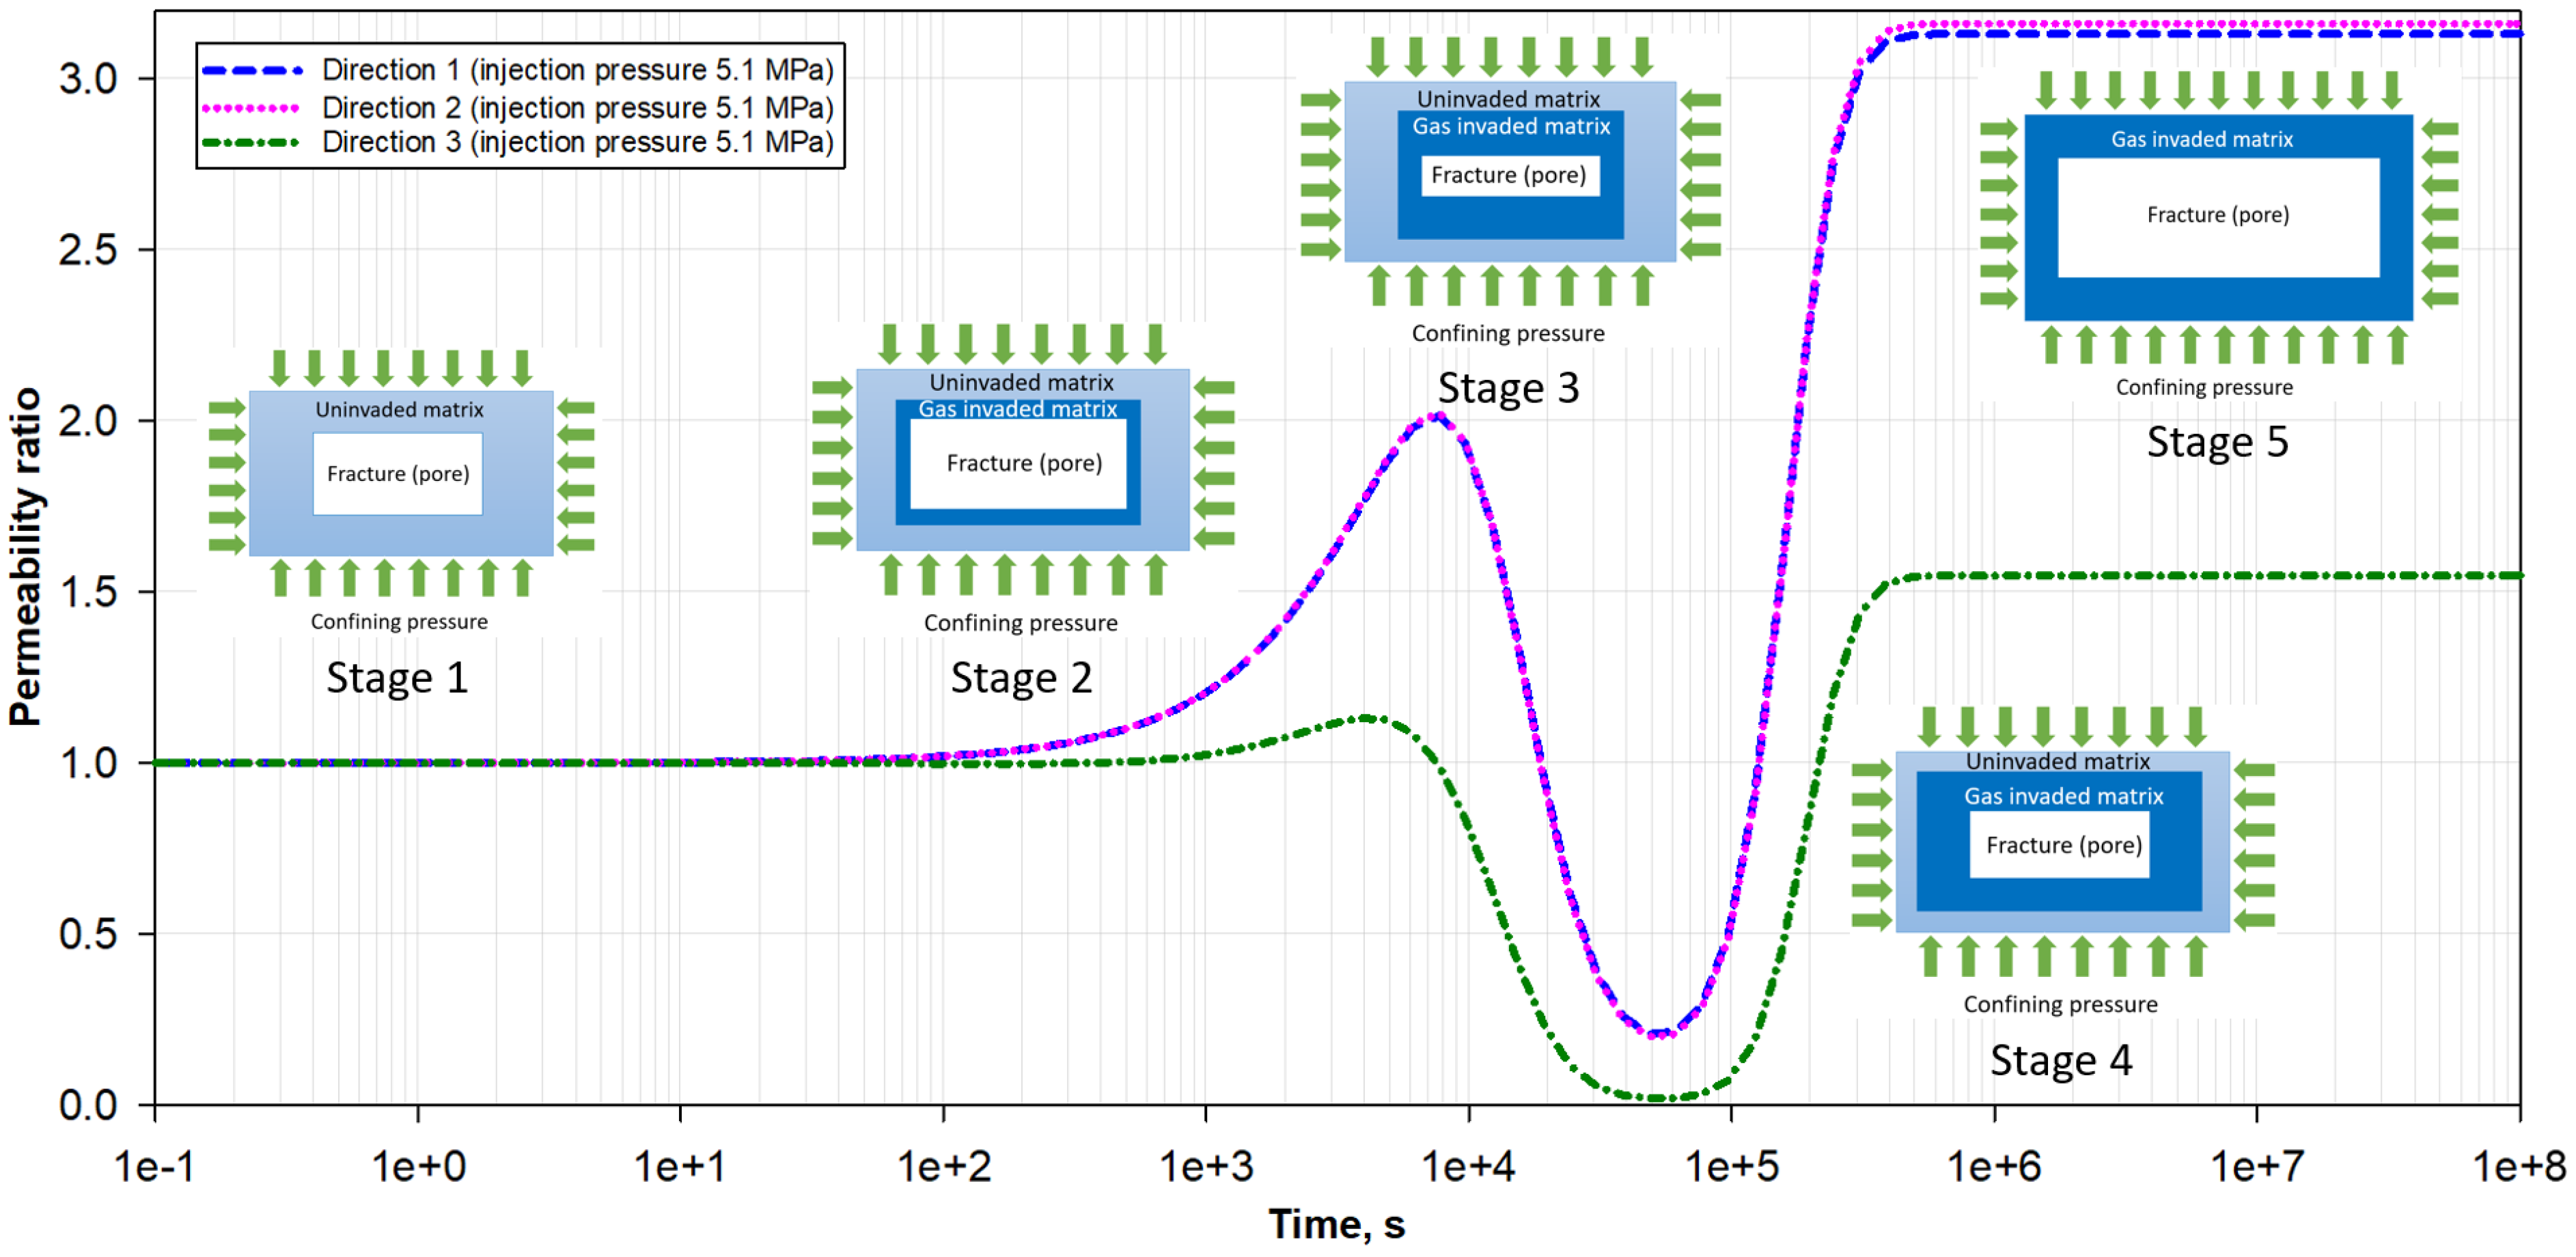
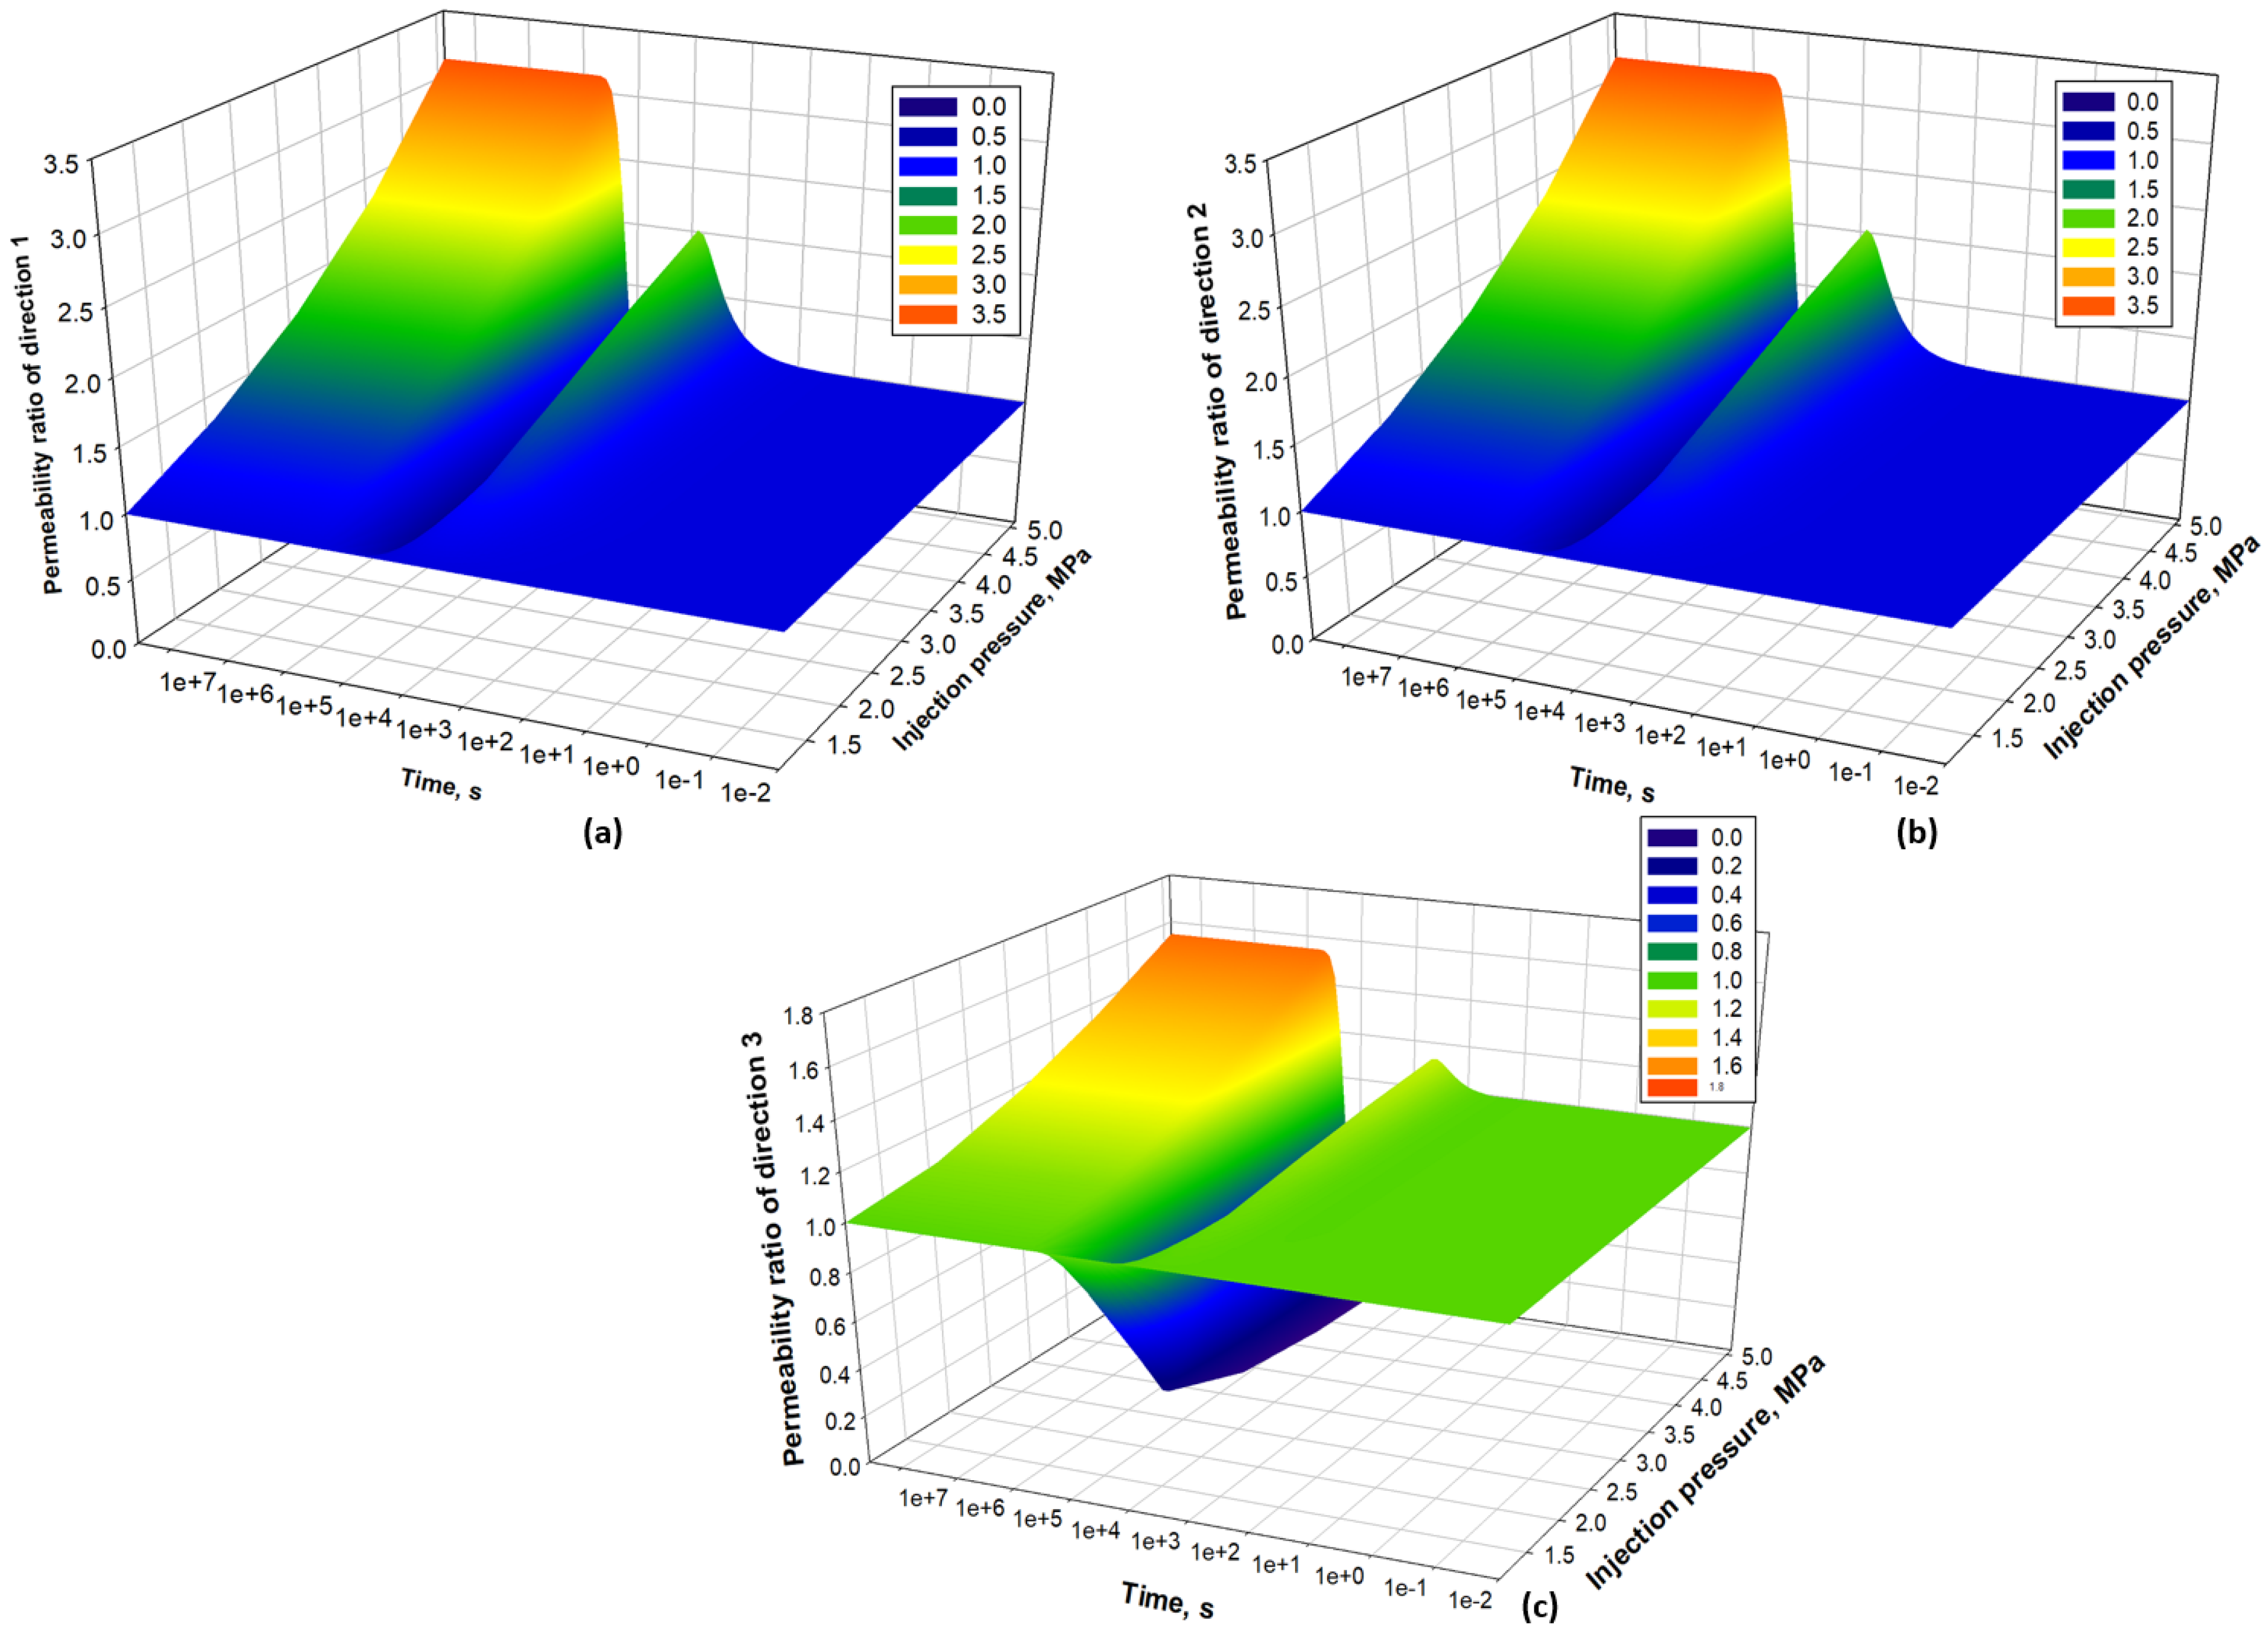
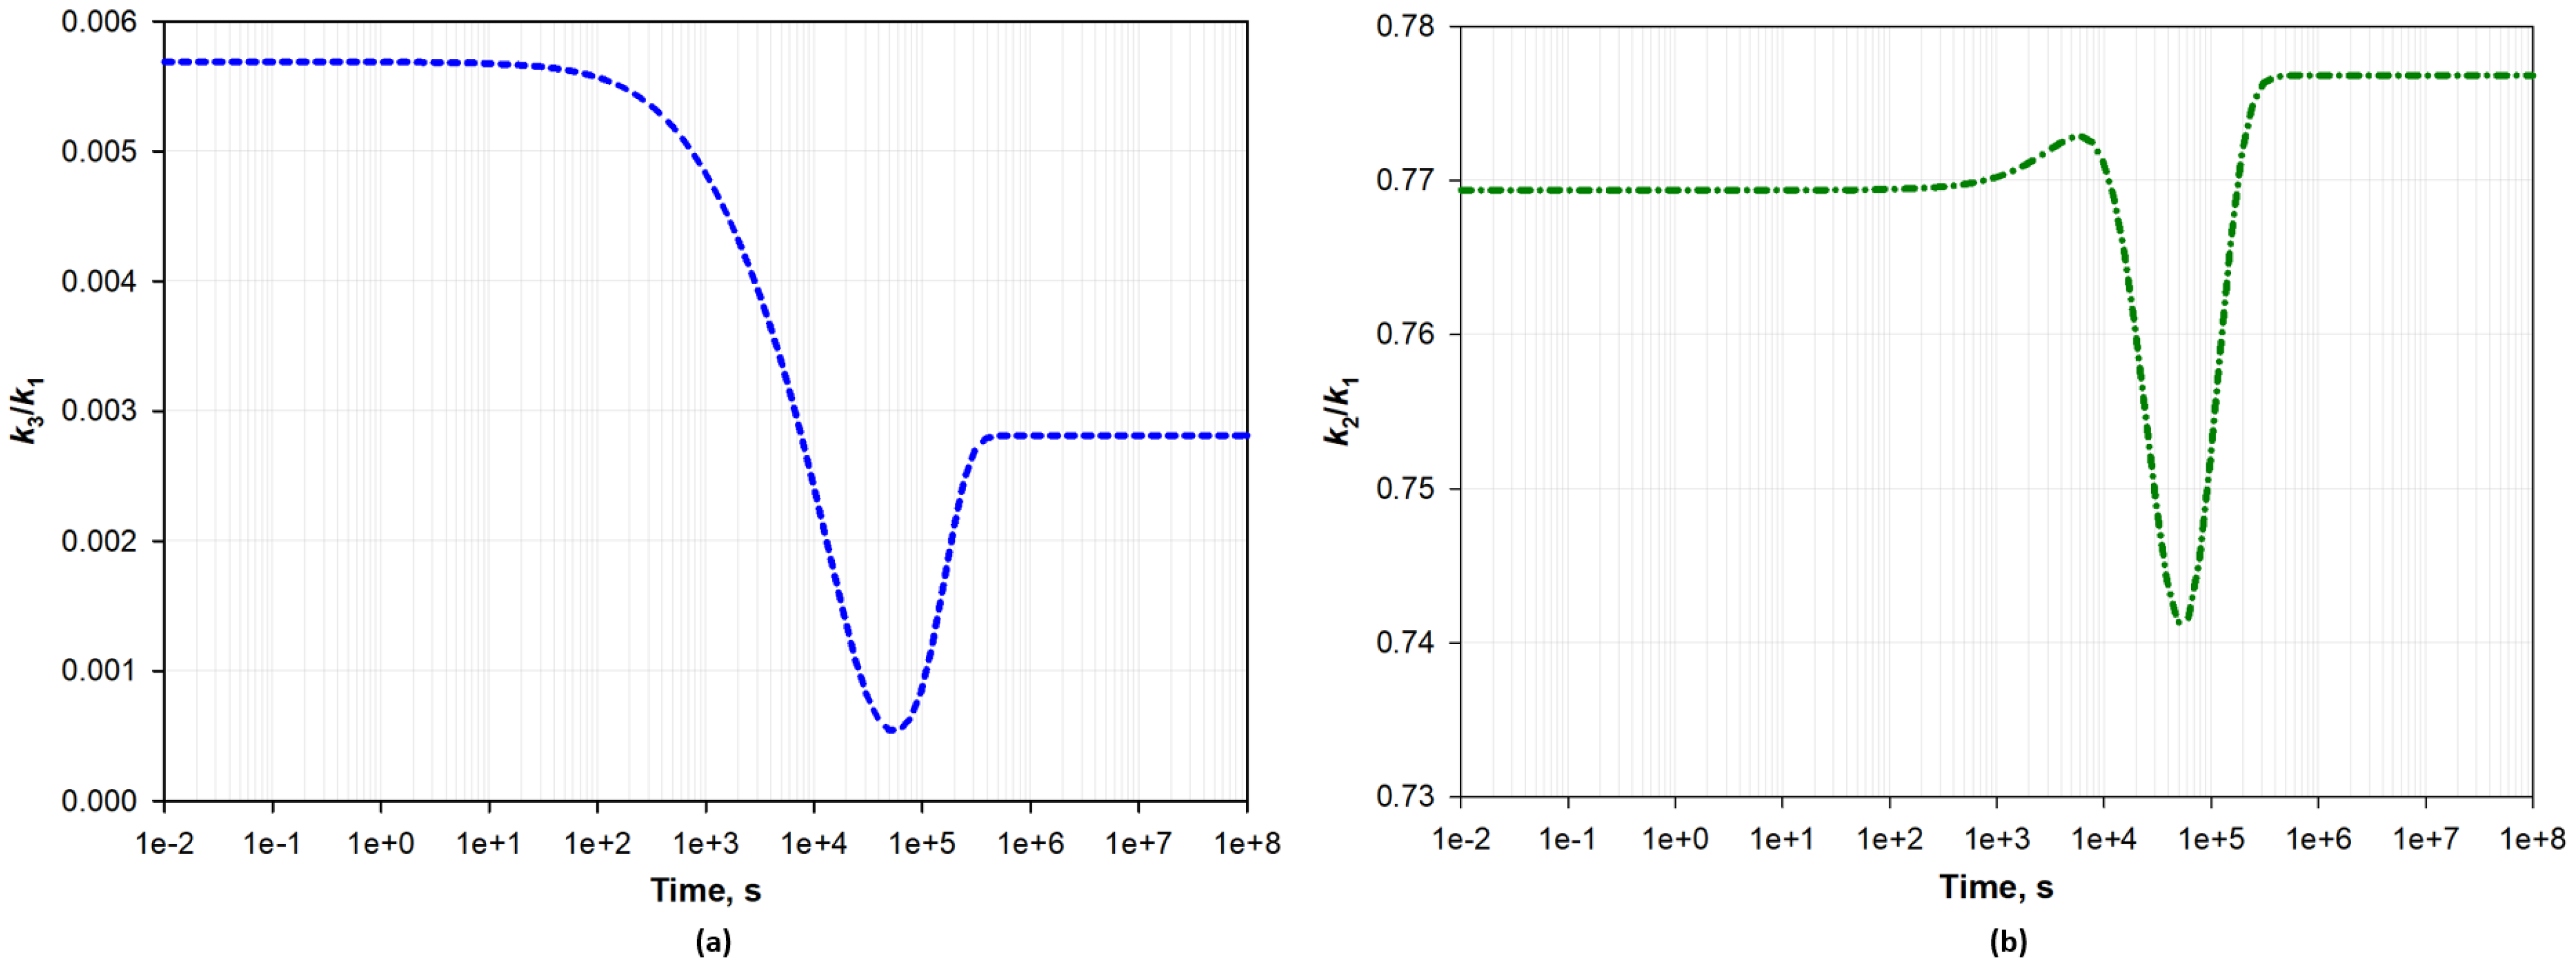
Based on the anisotropic permeability model, anisotropic permeability evolution is investigated. The initial pressure, injection pressure, and confining pressure are 1.1 MPa, 5.1 MPa, and 30 MPa. Other parameters are the same as those in Table 3. Figure 7 shows directional permeability evolution. In general, permeability evolution in each direction is reasonable compared with the isotropic coal permeability evolution of Zhang et al. [67]. The whole curve can be classified into five stages: (1) Initial stage. The permeability is almost stable with a slight increase or decrease (flow regime’s influence in micro flow channels) due to the initial pore (fracture) pressure increase. (2) Permeability increase stage. A noticeable permeability increment can be observed due to the continuous increase of pore (fracture) pressure. (3) Local swelling stage. Permeability drops as a result of pore (fracture) surface swelling (local swelling). (4) Permeability rebound stage. As the matrix swelling area expands, matrix swelling is more uniform and transforms from local swelling to global swelling, enlarging the flow channel aperture. (5) Permeability stabilization stage. The permeability becomes stable under matrix–pore (fracture) equilibrium. Under that condition, the evolution behavior is similar to Liu et al. [35]. The strain constant is an invaded/depleted area parameter. It is multiplied by an invaded volume ratio to describe total-matrix-volume-averaged effects. Permeability ratio curves in directions 1 and 2 nearly overlap each other even though the permeability values are different. However, the vertical permeability ratio curve shows lower values in stage 2 and the local swelling period. This is because the Young’s moduli in horizontal directions are larger than those in the vertical direction, and the magnitude of variation in b 1 and b 2 is smaller than b 3 . Consequently, the vertical permeability controlled by b 1 and b 2 (see Equation (49)) is less stress sensitive. Meanwhile, b 1 and b 2 are far smaller than b 3 , local swelling has a stronger influence on the reduction of b 1 and b 2 . Therefore, vertical permeability is more sensitive to local swelling. Figure 8 presents permeability ratio surfaces of the three directions. The permeability ratio surface provides a spectrum of permeability ratios under different injection pressure at different times. Figure 9 demonstrates anisotropic permeability ratios ( k 3 / k 1 and k 2 / k 1 ) at different times. It can be seen that the k 2 / k 1 curve is similar to the five-stage evolution curve. Permeability in direction 2 ranges from 74.2% to 77.7% compared to that in direction 1, while initially its permeability ratio is 76.9%. As for k 3 / k 1 , the permeability increase of k 1 is faster than that of k 3 at the beginning. Then, the permeability ratio rebounds and the final permeability ratio is lower than the initial one. These observations indicate that permeability evolution of coal and shale rocks in different directions are relatively unique and are not identical. For this model that uses average confining stress, if the effective stress in one direction increases, the permeability in all directions will decrease. The trend of the change of the anisotropic permeability ratio is complex and depends on the directional mechanical properties.

5.2. Effects of Adsorption Hysteresis on Permeability Evolution

Gas adsorption and desorption generate considerable impacts on permeability evolution of sorbing rocks [72,73]. Adsorption hysteresis is a critical mechanism for gas production in coal and shale reservoirs [47]. Here, the way that the hysteresis coefficient ζ affects permeability evolution is investigated. In this case, the hysteresis coefficient is a constant. It characterizes the ratio of available sorption areas for desorption relative to adsorption and changes from 0 to 1 [47]. The value of 1 means zero hysteresis, and 0 means maximum hysteresis. Theoretically, the Langmuir strain constant during desorption is lower than that of adsorption. For convenience, the Langmuir strain constants in Table 3 are multiplied by 0.95 for desorption in our analyses. The magnitude of the Langmuir strain constants for desorption and adsorption is consistent with those in the literature [47]. Considering gas extraction, the initial pressure is 5.1 MPa, while the final equilibrium pressure for depletion is 1.1 MPa. The confining pressure is fixed at 30 MPa. As shown in Figure 10, a complete gas–depletion permeability curve also has five stages that reflect the inverse processes of injection curves. As the hysteresis coefficient increases, the desorption-induced concave (downward) regime for local shrinkage becomes more noticeable. When the coefficient is larger than 0.75, further increments result in a marginal permeability change. Aside from this, the magnitudes of the permeability change in three directions show dramatical differences; the lower the flow channel aperture is, the more sensitive the permeability will be during local shrinkage.

5.3. Effects of Tortuosity on Permeability Evolution

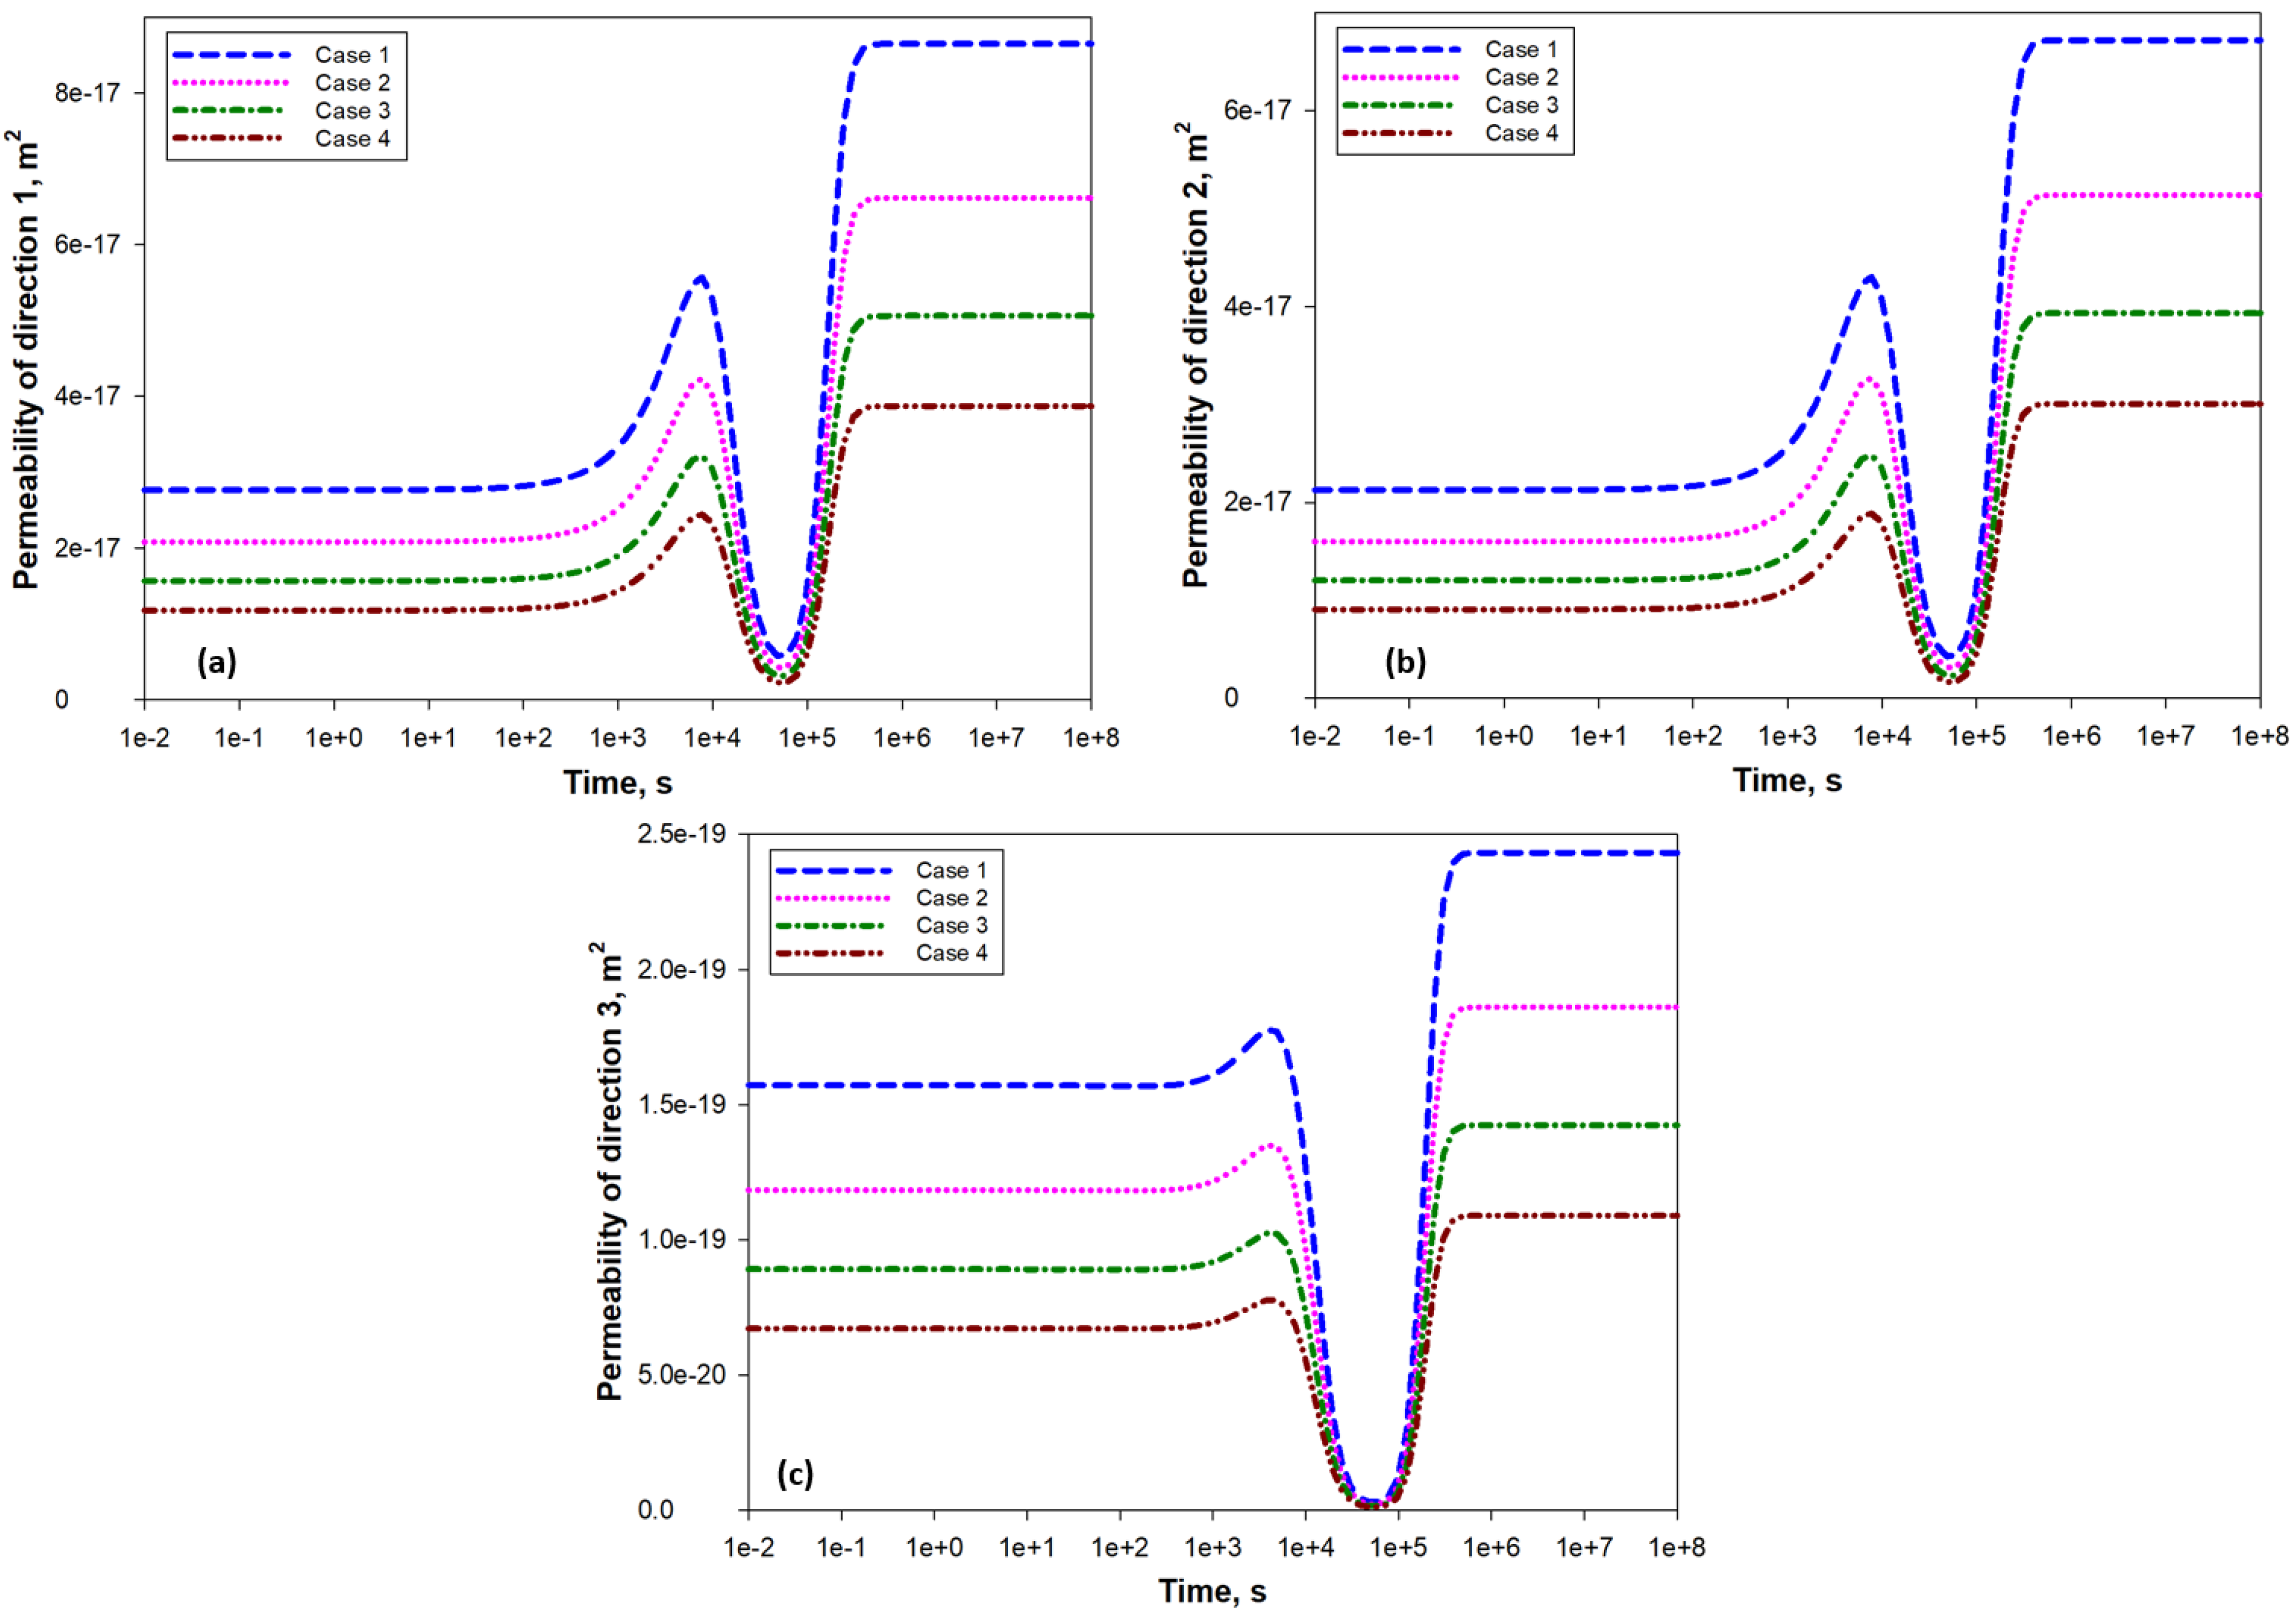
The actual pore space of sorbing rocks is chaotic, and the gas molecules travel much longer than the straight line between its initial location and the final destination [49]. Tortuosity is utilized to depict the chaotic structure and is defined as a function of porosity (Equation (20)) [48,49]. In this study, the exponential coefficients for tortuosity in different directions for the four cases are as follows: θ 1 = 0.302 , θ 2 = 0.35 , and θ 3 = 0.45 for case 1; θ 1 = 0.352 , θ 2 = 0.4 , and θ 3 = 0.5 for case 2; θ 1 = 0.402 , θ 2 = 0.45 , and θ 3 = 0.55 for case 3; and θ 1 = 0.452 , θ 2 = 0.5 , and θ 3 = 0.6 for case 4. Case 1 is the experimental-data-matched case. From cases 1 to 4, the tortuosity coefficient is increased by 0.05 in all three directions. Note that the tortuosity of effective gas flow channels (fractures) in our conceptual model is not as high as complex nano-pore networks within the matrices. Therefore, the coefficient used here ranges from 0.3 to 0.6 [48,49]. With the same initial porosity, the tortuosity turns larger with the increase of the exponential coefficient. As demonstrated in Figure 11, an increment in the tortuosity coefficient results in a reduction in permeability. The magnitude of permeability reductions is higher in stages 1, 2, and 5. However, the permeability drops become marginal during the local swelling period. One can conclude that tortuosity dominates stages 1, 2, and 5, while the U-shaped region is mainly controlled by local swelling.

5.4. Effects of Different Matrix Blocks on Permeability Evolution

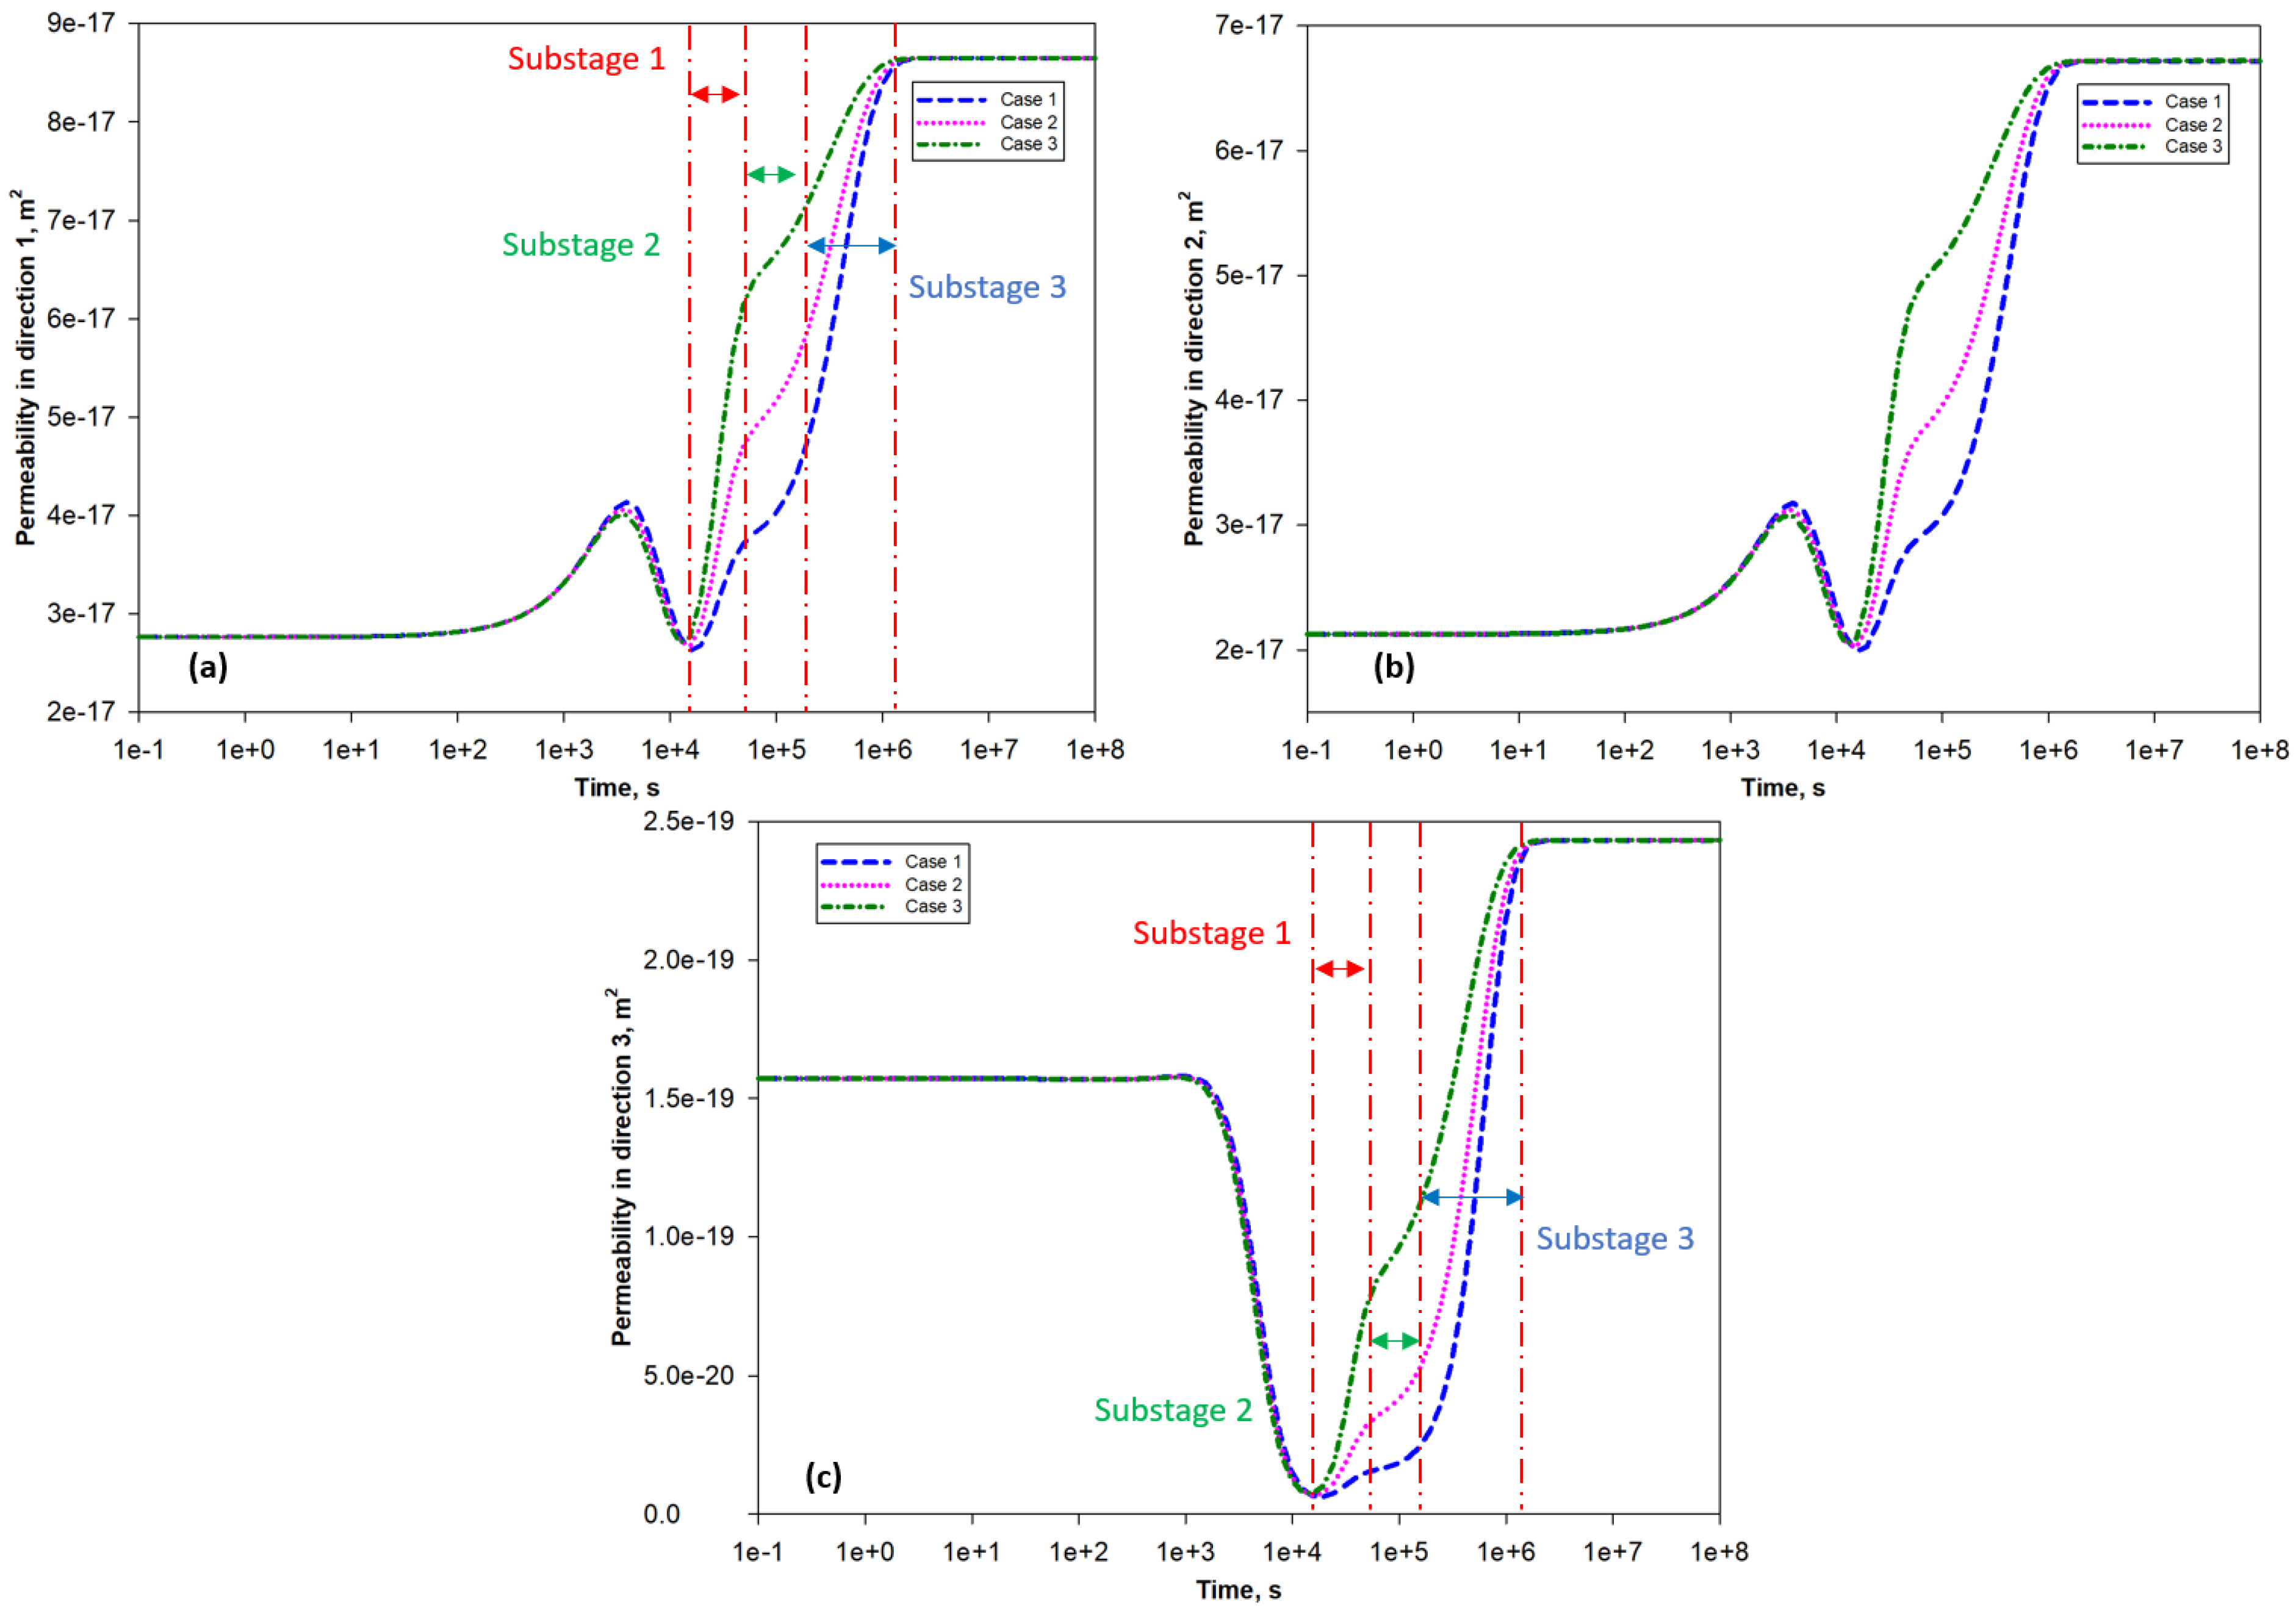
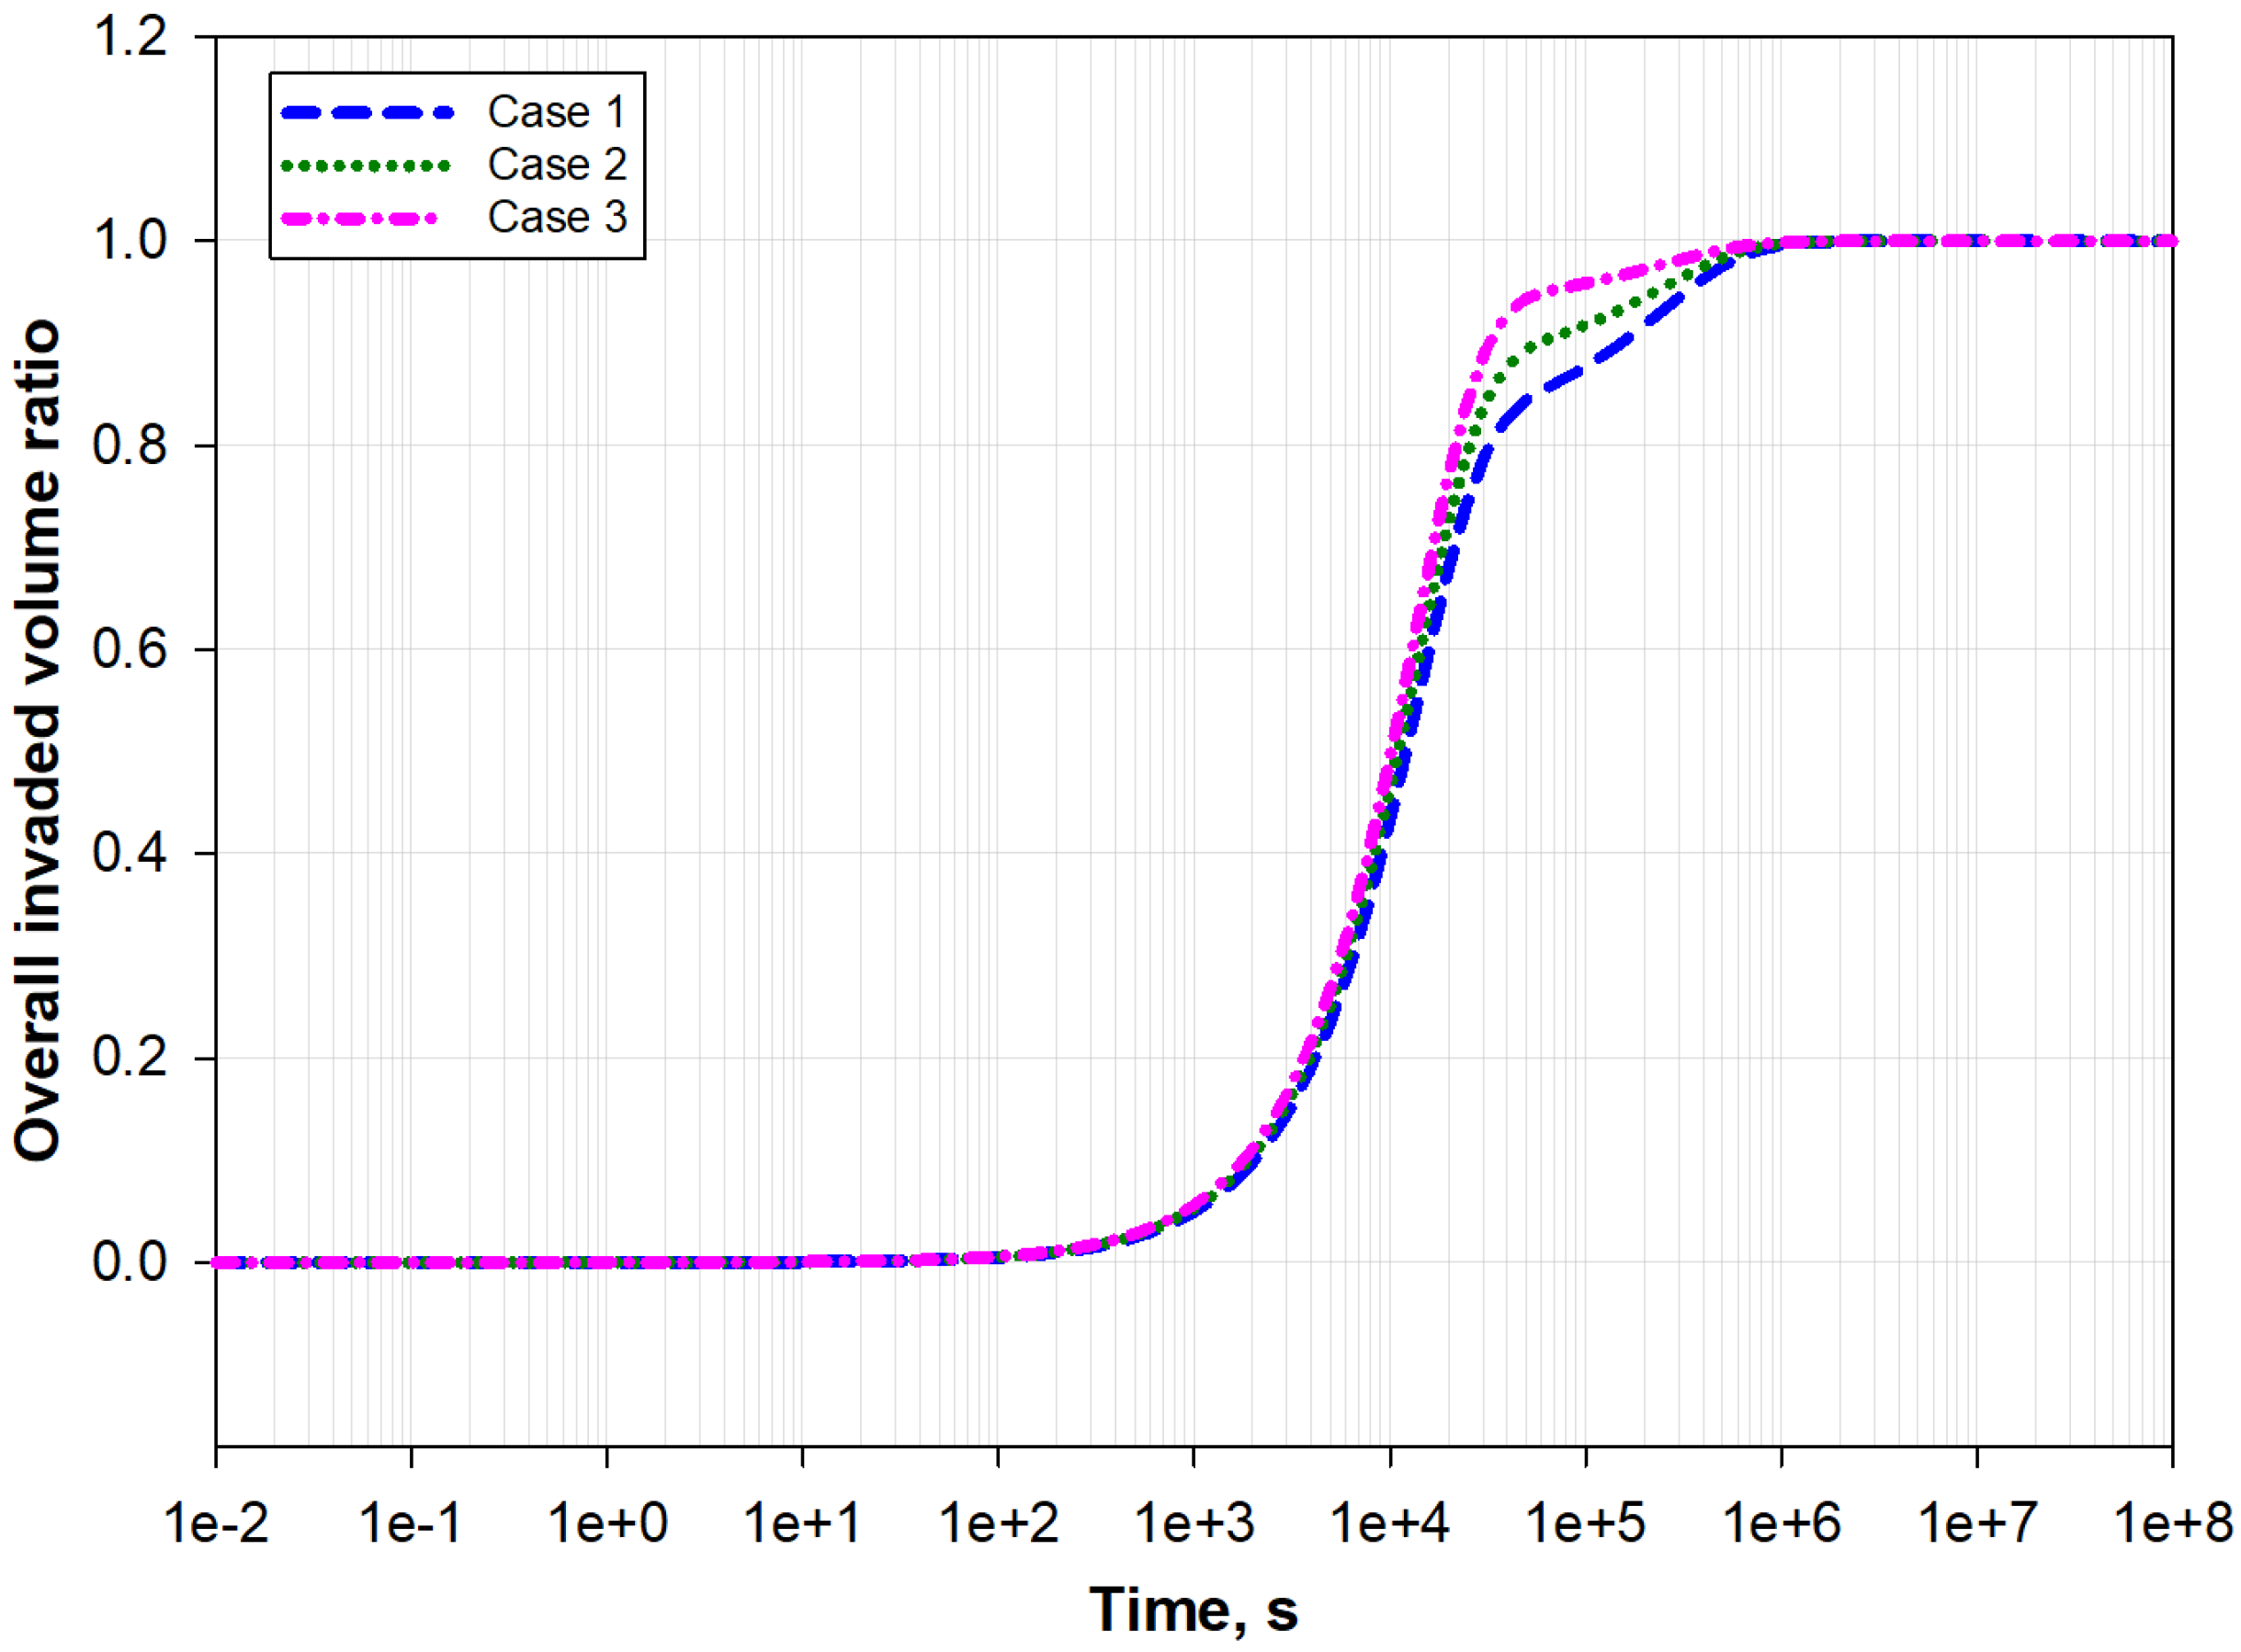
Matrix blocks of natural sorbing fissured rocks may not be identical in terms of adsorbability, gas diffusivity, and mechanical properties. When shale rocks are taken as an example, a dramatical variation of components has been observed experimentally [74]. These components mainly include pyrite, calcite, kerogen, clay minerals, silica, dolomite, and feldspar [74]. In this section, the nature of components is taken into account when analyzing directional permeability evolution. For convenience, three major matrix blocks are involved in our simulation. Type 1 (volume fraction: 18% for case 1, 12% for case 2, and 6% for case 3) is mainly composed of kerogen, type two (volume fraction: 35% for case 1, 30% for case 2, and 25% for case 3) mainly consists of chemically unstable minerals (dolomite, feldspar, and calcite), and type 3 (volume fraction: 47% for case 1, 58% for case 2, and 69% for case 3) mainly involves chemically stable minerals (silica). The types and volume fractions of matrix are based on Wu et al. [74], and pore volumes in the matrix have been included in these volume fractions. Since detailed mechanical properties of each type are not available, the mechanical properties are classified into kerogen mechanical properties (bulk modulus: 2.6 × 10 9 Pa and grain mudulus: 8 × 10 9 Pa [75]) and inorganic matrix mechanical properties (bulk modulus: 5.5 × 10 10 Pa and grain modulus: 7 × 10 10 Pa [68]). Other properties of different matrix types are selected to satisfy the overall bulk rock properties of Table 3. The adsorbability reduces in the following order: kerogen, calcite, and clay minerals [76], while the diffusivity in kerogen is smaller than that of inorganic matrices ( D m e = 6 × 10 13 m2/s for inorganic matrices and D m e = 2 × 10 14 m2/s for kerogen [70]). Swelling strain constants of the three matrix types are as follows: ε L m 1 , a d = 0.03 ,   ε L m 2 , a d = 0.032 , and ε L m 3 , a d = 0.04 for type 1; ε L m 1 , a d = 0.01 ,   ε L m 2 , a d = 0.012 , and ε L m 3 , a d = 0.018 for type 2; and ε L m 1 , a d = 0.008 ,   ε L m 2 , a d = 0.01 , and ε L m 3 , a d = 0.013 for type 3. These swelling properties are selected based on Liu and Rutqvist [71] and Peng et al. [61]. Other input parameters are shown in Table 3. Permeability evolution of three directions under 5.1 MPa injection pressure and 30 MPa confining pressure is presented in Figure 12. In general, different matrix properties mainly affect stages 2 to 4 of the permeability evolution curves, especially stage 4 (the permeability rebound stage). The directional permeability evolution laws are not identical. Stage 2 is almost masked by local swelling in direction 3 due to the less stress-sensitive nature and narrower flow channels ( b 1 and b 2 ). The permeability rebound stage can be further divided into three substages. This is because the inorganic matrices with larger diffusivity reach matrix–fracture pressure equilibrium faster, as shown in Figure 13. The pressure behavior of pores (fractures) and matrices in Figure 13 is consistent with numerical simulation results of Zhang et al. [67]. The rapid rebound substage forms during achieving inorganic matrix pressure equilibrium. The permeability increment rate of case 3 with the largest portion of inorganic matrices is the largest. The second permeability increasing stage is generated while approaching kerogen pressure equilibrium. The slope of this period in case 1 with the largest portion of kerogen is the smallest. The third substage with a larger slope is mainly caused by the effective stress reduction when the overall matrix pressure is close to fracture pressure. The peak value of the n-shaped region (stages 2 and 3) decreases in the following order: cases 1, 2, and 3. This is because local swelling effects of case 3 occur and disappear fastest among the three, which is also evidenced by invaded volume ratio evolution given in Figure 14. However, the minimal permeability during the U-shaped region (stages 3 and 4) is in case 1 with the largest portion of kerogen (largest local swelling effects).
Due to the analytical nature and simplified assumptions of this model, it still has some limitations, which will hopefully be removed in our future work. The heterogeneity of flow paths, matrix block shape, and flow path connectivity and tortuosity can be more realistically described using the fractal theory [77]. The localized impact of rock bridge deformation can be handled by adding the strain of rock bridges that connect the two adjacent matrix blocks [78]. To realize thermal-poro-elastic coupling, thermal-expansion-caused strain should be incorporated in the permeability model [79]. Other factors, such as multiphase flow, fine migrations, multi-component flow in the CO2 injection processes, mechanical property degradation, and heterogeneous matrix–fracture interaction caused by different matrix block or layers need to be further analyzed in the future work [80,81,82,83]. Moreover, this model can be inserted into fully coupled numerical simulators built in COMSOL Multiphysics where specific geological conditions should be considered [84,85].

6. Conclusions

This research presents a general anisotropic permeability model for shale and coal rocks considering anisotropic deformation and swelling, arbitrary box-shaped matrix blocks, multiple matrix types, adsorption hysteresis, and dynamic flow channel tortuosity. The proposed model can serve as a tool of knowledge extension and performs more realistic coal permeability prediction. According to the above analysis, the following conclusions are reached:
(1)
Permeability evolution in each direction shows unique features depending on the rock anisotropic structure, directional swelling, and anisotropic mechanical properties. Conventional isotropic permeability models may only accurately explain the permeability evolution in one direction.
(2)
Matrix–fracture mechanical interaction generates four-stage permeability evolution behavior under the constant confining pressure condition, including permeability increase, decline, rebound, and pressure equilibrium stages.
(3)
For each stress condition, an upper and a lower permeability can be used to demonstrate the range of permeability values during the pressure nonequilibrium period. By combining the upper and lower permeability values, the upper and lower permeability limit curves can be drawn, which envelopes all possible permeability values at different time and stress conditions. Three-dimensional permeability diagrams are proposed for different directions.
(4)
The magnitude of adsorption hysteresis mainly influences the local shrinkage period during gas extraction. The variation of this coefficient has a marginal influence on permeability when the hysteresis coefficient is larger than 0.75.
(5)
Tortuosity variation significantly affects permeability but has the smallest influence on the localized swelling period. Increments in flow channel tortuosity reduces permeability with almost the same magnitude in different regions.
(6)
Different matrix blocks achieve matrix-–fracture equilibrium asynchronously, which complicates the overall permeability evolution of certain regions.

Author Contributions

Conceptualization, J.Z. (Jie Zeng) and B.C.; Methodology, L.W., Z.L., J.Z. (Jie Zeng), J.L., H.J., W.W., J.Z. (Jinwen Zhang), Y.W. and Z.Z.; Validation, L.W., Z.L., J.Z. (Jie Zeng), B.C. and W.W.; Formal analysis, L.W., Z.L., J.Z. (Jie Zeng), B.C., J.L. and H.J.; Investigation, L.W., Z.L., B.C. and H.J.; Data curation, L.W., Z.L., J.Z. (Jie Zeng), J.L. and W.W.; Writing—original draft, L.W., Z.L., J.Z. (Jie Zeng), B.C., J.L., H.J., W.W., J.Z. (Jinwen Zhang), Y.W. and Z.Z.; Writing—review & editing, L.W., Z.L., J.Z. (Jie Zeng), B.C., J.Z. (Jinwen Zhang), Y.W. and Z.Z.; Supervision, J.Z. (Jie Zeng); Funding acquisition, J.Z. (Jie Zeng). All authors have read and agreed to the published version of the manuscript.

Funding

This research was funded by PetroChina Huabei Oilfield Company, [China Postdoctoral Science Foundation] grant number [2023M732925] and [International Postdoctoral Exchange Fellowship Program] grant number [YJ20220169].

Data Availability Statement

The original contributions presented in this study are included in the article. Further inquiries can be directed to the corresponding author.

Conflicts of Interest

Authors Lilong Wang, Zongyuan Li, Biwu Chen, Jiafeng Li, Huimin Jia, Wenhou Wang, Jinwen Zhang and Yiqun Wang were employed by the company PetroChina Huabei Oilfield Company. The remaining authors declare that the research was conducted in the absence of any commercial or financial relationships that could be construed as a potential conflict of interest.

References

  1. Jaeger, J.C.; Cook, N.G.; Zimmerman, R. Fundamentals of Rock Mechanics; John Wiley & Sons: Hoboken, NJ, USA, 2009. [Google Scholar]
  2. Amadei, B. Rock Anisotropy and the Theory of Stress Measurements; Springer Science & Business Media: New York, NY, USA, 2012; Volume 2. [Google Scholar]
  3. Hudson, J.A.; Harrison, J.P. Engineering Rock Mechanics: An Introduction to the Principles; Elsevier: Amsterdam, The Netherlands, 2000. [Google Scholar]
  4. Wong, T.F. Anisotropic Poroelasticity in a Rock with Cracks: Anisotropic Poroelasticity. J. Geophys. Res. Solid Earth. 2017, 122, 7739–7753. [Google Scholar] [CrossRef]
  5. Tan, Y.; Pan, Z.; Liu, J.; Zhou, F.; Connell, L.D.; Sun, W.; Haque, A. Experimental study of impact of anisotropy and heterogeneity on gas flow in coal. Part II: Permeability. Fuel 2018, 230, 397–409. [Google Scholar] [CrossRef]
  6. Zhang, Z.; Zhang, R.; Xie, H.; Gao, M.; Zha, E.; Jia, Z. An anisotropic coal permeability model that considers mining-induced stress evolution, microfracture propagation and gas sorption-desorption effects. J. Nat. Gas Sci. Eng. 2017, 46, 664–679. [Google Scholar] [CrossRef]
  7. Moore, R.; Palmer, I.; Higgs, N. Anisotropic Model for Permeability Change in Coalbed-Methane Wells. SPE Reserv. Eval. Eng. 2015, 18, 456–462. [Google Scholar] [CrossRef]
  8. Yue, G.; Li, M.; Wang, L.; Liang, W. Optimal layout of blasting holes in structural anisotropic coal seam. PloS ONE 2019, 14, e0218105. [Google Scholar] [CrossRef]
  9. Qi, C.; Wang, X.; Wang, W.; Liu, J.; Tuo, J.; Liu, K. Three-dimensional characterization of micro-fractures in shale reservoir rocks. Pet. Res. 2018, 3, 259–268. [Google Scholar] [CrossRef]
  10. Zhang, Z.; Li, X.; He, J. Numerical Study on the Permeability of the Hydraulic-Stimulated Fracture Network in Naturally-Fractured Shale Gas Reservoirs. Water 2016, 8, 393. [Google Scholar] [CrossRef]
  11. Liu, Y.; Li, M.; Yin, G.; Zhang, D.; Deng, B. Permeability evolution of anthracite coal considering true triaxial stress conditions and structural anisotropy. J. Nat. Gas Sci. Eng. 2018, 52, 492–506. [Google Scholar] [CrossRef]
  12. Raza, S.S.; Ge, L.; Rufford, T.E.; Chen, Z.; Rudolph, V. Anisotropic coal permeability estimation by determining cleat compressibility using mercury intrusion porosimetry and stress–strain measurements. Int. J. Coal Geol. 2019, 205, 75–86. [Google Scholar] [CrossRef]
  13. Smith, D.H.; Bromhal, G.; Sams, W.N.; Jikich, S.; Ertekin, T. Simulating Carbon Dioxide Sequestration/ECBM Production in Coal Seams: Effects of Permeability Anisotropies and the Diffusion-Time Constant. SPE Reserv. Eval. Eng. 2005, 8, 156–163. [Google Scholar] [CrossRef]
  14. Chalmers, G.R.L.; Ross, D.J.K.; Bustin, R.M. Geological controls on matrix permeability of Devonian Gas Shales in the Horn River and Liard basins, northeastern British Columbia, Canada. Int. J. Coal Geol. 2012, 103, 120–131. [Google Scholar] [CrossRef]
  15. Bhandari, A.R.; Flemings, P.B.; Polito, P.J.; Cronin, M.B.; Bryant, S.L. Anisotropy and Stress Dependence of Permeability in the Barnett Shale. Transp Porous Med. 2015, 108, 393–411. [Google Scholar] [CrossRef]
  16. Pan, Z.; Ma, Y.; Connell, L.D.; Down, D.I.; Camilleri, M. Measuring anisotropic permeability using a cubic shale sample in a triaxial cell. J. Nat. Gas Sci. Eng. 2015, 26, 336–344. [Google Scholar] [CrossRef]
  17. Ma, Y.; Pan, Z.; Zhong, N.; Connell, L.D.; Down, D.I.; Lin, W.; Zhang, Y. Experimental study of anisotropic gas permeability and its relationship with fracture structure of Longmaxi Shales, Sichuan Basin, China. Fuel 2016, 180, 106–115. [Google Scholar] [CrossRef]
  18. Wu, Y.; Liu, J.; Elsworth, D.; Miao, X.; Mao, X. Development of anisotropic permeability during coalbed methane production. J. Nat. Gas Sci. Eng. 2010, 2, 197–210. [Google Scholar] [CrossRef]
  19. Pan, Z.; Connell, L.D. Modelling of anisotropic coal swelling and its impact on permeability behaviour for primary and enhanced coalbed methane recovery. Int. J. Coal Geol. 2011, 85, 257–267. [Google Scholar] [CrossRef]
  20. Shi, J.Q.; Durucan, S. Drawdown Induced Changes in Permeability of Coalbeds: A New Interpretation of the Reservoir Response to Primary Recovery. Transp. Porous Media 2004, 56, 1–16. [Google Scholar] [CrossRef]
  21. Liu, J.; Chen, Z.; Elsworth, D.; Miao, X.; Mao, X. Linking gas-sorption induced changes in coal permeability to directional strains through a modulus reduction ratio. Int. J. Coal Geol. 2010, 83, 21–30. [Google Scholar] [CrossRef]
  22. Chen, D.; Pan, Z.; Liu, J.; Connell, L.D. Characteristic of anisotropic coal permeability and its impact on optimal design of multi-lateral well for coalbed methane production. J. Pet. Sci. Eng. 2012, 88–89, 13–28. [Google Scholar] [CrossRef]
  23. Wang, J.G.; Liu, J.; Kabir, A. Combined effects of directional compaction, non-Darcy flow and anisotropic swelling on coal seam gas extraction. Int. J. Coal Geol. 2013, 109–110, 1–14. [Google Scholar] [CrossRef]
  24. Wang, K.; Zang, J.; Wang, G.; Zhou, A. Anisotropic permeability evolution of coal with effective stress variation and gas sorption: Model development and analysis. Int. J. Coal Geol. 2014, 130, 53–65. [Google Scholar] [CrossRef]
  25. An, H.; Wei, X.R.; Wang, G.X.; Massarotto, P.; Wang, F.; Rudolph, V.; Golding, S. Modeling anisotropic permeability of coal and its effects on CO2 sequestration and enhanced coalbed methane recovery. Int. J. Coal Geol. 2015, 152, 15–24. [Google Scholar] [CrossRef]
  26. Li, J.; Li, B.; Cheng, Q.; Gao, Z. Evolution of Anisotropic Coal Permeability Under the Effect of Heterogeneous Deformation of Fractures. Nat. Resour. Res. 2021, 30, 3623–3642. [Google Scholar] [CrossRef]
  27. Qi, X.; Fu, P.; Wang, S. Numerical Investigation of an Anisotropic Permeability Model for Bedded Coal Based on the Equivalent Fracture Aperture Coefficient. Shock. Vib. 2022, 2022, 1–14. [Google Scholar] [CrossRef]
  28. Zeng, J.; Guo, J.; Liu, J.; Li, W.; Zhou, Y.; Tian, J. Anisotropic Permeability Model for Coal Considering Stress Sensitivity, Matrix Anisotropic Internal Swelling/Shrinkage, and Gas Rarefaction Effects. Energy Fuels 2023, 37, 2811–2832. [Google Scholar] [CrossRef]
  29. Zeng, J.; Guo, J.; Liu, J.; Zhang, T.; Zhao, Z.; Liu, J.; Chen, Z. A Strain-Driven Model for Anisotropic Permeability Evolution of Shale and Coal Incorporating Creep Deformation, Anisotropic Internal Swelling/Shrinkage, and Gas Rarefaction Effects. In Proceedings of the SPE Conference at Oman Petroleum & Energy Show, Muscat, Oman, 22–24 April 2024; p. D021S026R002. [Google Scholar] [CrossRef]
  30. He, L.; Mei, H.; Hu, X.; Dejam, M.; Kou, Z.; Zhang, M. Advanced Flowing Material Balance to Determine Original Gas in Place of Shale Gas Considering Adsorption Hysteresis. SPE Reserv. Eval. Eng. 2019, 22, 1282–1292. [Google Scholar] [CrossRef]
  31. Wei, M.; Liu, J.; Shi, R.; Elsworth, D.; Liu, Z. Long-Term Evolution of Coal Permeability Under Effective Stresses Gap Between Matrix and Fracture During CO2 Injection. Transp. Porous Med. 2019, 130, 969–983. [Google Scholar] [CrossRef]
  32. Zeng, J.; Liu, J.; Li, W.; Leong, Y.K.; Elsworth, D.; Guo, J. Evolution of Shale Permeability under the Influence of Gas Diffusion from the Fracture Wall into the Matrix. Energy Fuels 2020, 34, 4393–4406. [Google Scholar] [CrossRef]
  33. Reiss, L.H. The Reservoir Engineering Aspects of Fractured Formations; Editions Technip: Paris, France, 1980; Volume 3. [Google Scholar]
  34. Peng, Y.; Liu, J.; Pan, Z.; Connell, L.D.; Chen, Z.; Qu, H. Impact of coal matrix strains on the evolution of permeability. Fuel 2017, 189, 270–283. [Google Scholar] [CrossRef]
  35. Liu, J.; Wang, J.; Chen, Z.; Wang, S.; Elsworth, D.; Jiang, Y. Impact of transition from local swelling to macro swelling on the evolution of coal permeability. Int. J. Coal Geol. 2011, 88, 31–40. [Google Scholar] [CrossRef]
  36. Civan, F.; Rai, C.S.; Sondergeld, C.H. Determining Shale Permeability to Gas by Simultaneous Analysis of Various Pressure Tests. SPE J. 2012, 17, 717–726. [Google Scholar] [CrossRef]
  37. Peng, Y.; Liu, J.; Pan, Z.; Connell, L.D. A sequential model of shale gas transport under the influence of fully coupled multiple processes. J. Nat. Gas Sci. Eng. 2015, 27, 808–821. [Google Scholar] [CrossRef]
  38. Zimmerman, R.W.; Chen, G.; Bodvarsson, G.S. A Dual-Porosity Reservoir Model with an Improved Coupling Term. In Proceedings of the Seventeenth Workshop on Geothermal Reservoir Engineering, Stanford, CA, USA, 29–31 January 1992; p. 11. [Google Scholar]
  39. Zeng, J.; Li, W.; Liu, J.; Leong, Y.-K.; Elsworth, D.; Tian, J.; Guo, J.; Zeng, F. Analytical solutions for multi-stage fractured shale gas reservoirs with damaged fractures and stimulated reservoir volumes. J. Pet. Sci. Eng. 2020, 187, 106686. [Google Scholar] [CrossRef]
  40. Zeng, J.; Wang, X.; Guo, J.; Zeng, F. Composite linear flow model for multi-fractured horizontal wells in heterogeneous shale reservoir. J. Nat. Gas Sci. Eng. 2017, 38, 527–548. [Google Scholar] [CrossRef]
  41. Ren, W.; Lau, H.C. Analytical modeling and probabilistic evaluation of gas production from a hydraulically fractured shale reservoir using a quad-linear flow model. J. Pet. Sci. Eng. 2020, 184, 106516. [Google Scholar] [CrossRef]
  42. Heidari Sureshjani, M.; Behmanesh, H.; Soroush, M.; Clarkson, C.R. A direct method for property estimation from analysis of infinite acting production in shale/tight gas reservoirs. J. Pet. Sci. Eng. 2016, 143, 26–34. [Google Scholar] [CrossRef]
  43. Fuentes-Cruz, G.; Valko, P.P. Revisiting the Dual-Porosity/Dual-Permeability Modeling of Unconventional Reservoirs: The Induced-Interporosity Flow Field. SPE J. 2015, 20, 124–141. [Google Scholar] [CrossRef]
  44. Lim, K.T.; Aziz, K. Matrix-fracture transfer shape factors for dual-porosity simulators. J. Pet. Sci. Eng. 1995, 3, 169–178. [Google Scholar] [CrossRef]
  45. Donohue, M.D.; Aranovich, G.L. Adsorption Hysteresis in Porous Solids. J. Colloid Interface Sci. 1998, 205, 121–130. [Google Scholar] [CrossRef]
  46. Ren, W. Modeling Hysteretic Adsorption and Desorption of Methane on Shale. Energy Fuels 2025, 39, 16214–16222. [Google Scholar] [CrossRef]
  47. Zhang, R.; Liu, S. Experimental and theoretical characterization of methane and CO2 sorption hysteresis in coals based on Langmuir desorption. Int. J. Coal Geol. 2017, 171, 49–60. [Google Scholar] [CrossRef]
  48. Chen, L.; Zhang, L.; Kang, Q.; Viswanathan, H.S.; Yao, J.; Tao, W. Nanoscale simulation of shale transport properties using the lattice Boltzmann method: Permeability and diffusivity. Sci. Rep. 2015, 5, 8089. [Google Scholar] [CrossRef]
  49. Ghanbarian, B.; Hunt, A.G.; Ewing, R.P.; Sahimi, M. Tortuosity in porous media: A critical review. Soil Sci. Soc. Am. J. 2013, 77, 1461–1477. [Google Scholar] [CrossRef]
  50. Cui, X.; Bustin, R.M. Volumetric strain associated with methane desorption and its impact on coalbed gas production from deep coal seams. Bulletin 2005, 89, 1181–1202. [Google Scholar] [CrossRef]
  51. Berryman, J.G. Poroelastic Response of Orthotropic Fractured Porous Media. Transp. Porous Media 2012, 93, 293–307. [Google Scholar] [CrossRef]
  52. Liu, Q.; Cheng, Y.; Wang, H.; Zhou, H.; Wang, L.; Li, W.; Liu, H. Numerical assessment of the effect of equilibration time on coal permeability evolution characteristics. Fuel 2015, 140, 81–89. [Google Scholar] [CrossRef]
  53. Mian, C.; Zhida, C. Effective stress laws for multi-porosity media. Appl. Math. Mech. 1999, 20, 1207–1213. [Google Scholar] [CrossRef]
  54. Mehrabian, A.; Abousleiman, Y.N. Generalized Biot’s theory and Mandel’s problem of multiple-porosity and multiple-permeability poroelasticity: Multiple-porosity poroelasticity. J. Geophys. Res. Solid Earth 2014, 119, 2745–2763. [Google Scholar] [CrossRef]
  55. Wang, H.F. Theory of Linear Poroelasticity with Applications to Geomechanics and Hydrogeology; Princeton University Press: Princeton, NJ, USA, 2017. [Google Scholar]
  56. Mehrabian, A.; Abousleiman, Y.N. Gassmann equations and the constitutive relations for multiple-porosity and multiple-permeability poroelasticity with applications to oil and gas shale: Multiple-porosity and Multiple-permeability Poroelasticity. Int. J. Numer. Anal. Meth. Geomech. 2015, 39, 1547–1569. [Google Scholar] [CrossRef]
  57. Carroll, M.M. An effective stress law for anisotropic elastic deformation. J. Geophys. Res. 1979, 84, 7510–7512. [Google Scholar] [CrossRef]
  58. Blioumi, A. On Linear-Elastic, Cross-Anisotropic Rock; Logos Verlag Berlin GmbH: Berlin, Germany, 2014; Volume 19. [Google Scholar]
  59. Beskok, A.; Karniadakis, G.E. Report: A Model for Flows in Channels, Pipes, and Ducts at Micro and Nano Scales. Microscale Thermophys. Eng. 1999, 3, 43–77. [Google Scholar] [CrossRef]
  60. Karniadakis, G.; Beskok, A.; Aluru, N. Microflows and Nanoflows: Fundamentals and Simulation; Springer Science & Business Media: New York, NY, USA, 2006; Volume 29. [Google Scholar]
  61. Peng, Y.; Liu, J.; Pan, Z.; Qu, H.; Connell, L. Evolution of shale apparent permeability under variable boundary conditions. Fuel 2018, 215, 46–56. [Google Scholar] [CrossRef]
  62. Jing, Y.; Armstrong, R.T.; Ramandi, H.L.; Mostaghimi, P. Coal cleat reconstruction using micro-computed tomography imaging. Fuel 2016, 181, 286–299. [Google Scholar] [CrossRef]
  63. Li, C.; Liu, D.; Cai, Y.; Yao, Y. Fracture permeability evaluation of a coal reservoir using geophysical logging: A case study in the Zhengzhuang area, southern Qinshui Basin. Energy Explor. Exploit. 2016, 34, 378–399. [Google Scholar] [CrossRef]
  64. Chi, A.; Yuwei, L. The Model for Calculating Elastic Modulus and Poisson’s Ratio of Coal Body. Open Fuels Energy Sci. J. 2013, 6, 36–43. [Google Scholar] [CrossRef]
  65. Zheng, G.; Pan, Z.; Chen, Z.; Tang, S.; Connell, L.D.; Zhang, S.; Wang, B. Laboratory Study of Gas Permeability and Cleat Compressibility for CBM/ECBM in Chinese Coals. Energy Explor. Exploit. 2012, 30, 451–476. [Google Scholar] [CrossRef]
  66. Ghanizadeh, A.; Amann-Hildenbrand, A.; Gasparik, M.; Gensterblum, Y.; Krooss, B.M.; Littke, R. Experimental study of fluid transport processes in the matrix system of the European organic-rich shales: II. Posidonia Shale (Lower Toarcian, northern Germany). Int. J. Coal Geol. 2014, 123, 20–33. [Google Scholar] [CrossRef]
  67. Zhang, S.; Liu, J.; Wei, M.; Elsworth, D. Coal permeability maps under the influence of multiple coupled processes. Int. J. Coal Geol. 2018, 187, 71–82. [Google Scholar] [CrossRef]
  68. Sone, H.; Zoback, M.D. Mechanical properties of shale-gas reservoir rocks—Part 1: Static and dynamic elastic properties and anisotropy. Geophysics 2013, 78, D381–D392. [Google Scholar] [CrossRef]
  69. Tan, Y.; Pan, Z.; Feng, X.T.; Zhang, D.; Connell, L.D.; Li, S. Laboratory characterisation of fracture compressibility for coal and shale gas reservoir rocks: A review. Int. J. Coal Geol. 2019, 204, 1–17. [Google Scholar] [CrossRef]
  70. Zhang, Y.; Mostaghimi, P.; Fogden, A.; Middleton, J.; Sheppard, A.; Armstrong, R.T. Local diffusion coefficient measurements in shale using dynamic micro-computed tomography. Fuel 2017, 207, 312–322. [Google Scholar] [CrossRef]
  71. Liu, H.H.; Rutqvist, J. A New Coal-Permeability Model: Internal Swelling Stress and Fracture–Matrix Interaction. Transp. Porous Med. 2010, 82, 157–171. [Google Scholar] [CrossRef]
  72. Shi, R.; Liu, J.; Wei, M.; Elsworth, D.; Wang, X. Mechanistic analysis of coal permeability evolution data under stress-controlled conditions. Int. J. Rock Mech. Min. Sci. 2018, 110, 36–47. [Google Scholar] [CrossRef]
  73. Kumar, H.; Elsworth, D.; Mathews, J.P.; Marone, C. Permeability evolution in sorbing media: Analogies between organic-rich shale and coal. Geofluids 2016, 16, 43–55. [Google Scholar] [CrossRef]
  74. Wu, Y.; Tahmasebi, P.; Yu, H.; Lin, C.; Wu, H.; Dong, C. Pore-Scale 3D Dynamic Modeling and Characterization of Shale Samples: Considering the Effects of Thermal Maturation. J. Geophys. Res. Solid Earth 2020, 125, e2019JB018309. [Google Scholar] [CrossRef]
  75. Huang, L.; Ning, Z.; Wang, Q.; Qi, R.; Li, J.; Zeng, Y.; Ye, H.; Qin, H. Thermodynamic and Structural Characterization of Bulk Organic Matter in Chinese Silurian Shale: Experimental and Molecular Modeling Studies. Energy Fuels 2017, 31, 4851–4865. [Google Scholar] [CrossRef]
  76. Wang, S.; Feng, Q.; Zha, M.; Javadpour, F.; Hu, Q. Supercritical Methane Diffusion in Shale Nanopores: Effects of Pressure, Mineral Types, and Moisture Content. Energy Fuels 2018, 32, 169–180. [Google Scholar] [CrossRef]
  77. Tian, J.; Liu, J.; Elsworth, D.; Leong, Y.K.; Li, W. An effective stress-dependent dual-fractal permeability model for coal considering multiple flow mechanisms. Fuel 2023, 334, 126800. [Google Scholar] [CrossRef]
  78. Zeng, J.; Liu, J.; Li, W.; Guo, J. A process-based coal swelling model: Bridging the gaps between localized swelling and bulk swelling. Fuel 2021, 293, 120360. [Google Scholar] [CrossRef]
  79. Qu, H.; Liu, J.; Chen, Z.; Wang, J.; Pan, Z.; Connell, L.; Elsworth, D. Complex evolution of coal permeability during CO2 injection under variable temperatures. Int. J. Greenh. Gas Control. 2012, 9, 281–293. [Google Scholar] [CrossRef]
  80. Yin, B.; Zhai, X.; Lou, Y.; Liu, S.; Wei, K.; Cheng, W. Transport mechanism of coal particles in multiphase flow during early coalbed methane production. Phys. Fluids 2025, 37, 053327. [Google Scholar] [CrossRef]
  81. Li, Q. Reservoir Science: A Multi-Coupling Communication Platform to Promote Energy Transformation, Climate Change and Environmental Protection. Reserv. Sci. 2025, 1, 1–2. [Google Scholar] [CrossRef]
  82. Zeng, J.; Liu, J.; Li, W.; Tian, J.; Leong, Y.K.; Elsworth, D.; Guo, J. Effects of heterogeneous local swelling and multiple pore types on coal and shale permeability evolution. In Proceedings of the SPE Europec Featured at EAGE Conference and Exhibition, Virtual, 7 December 2020. [Google Scholar]
  83. Zeng, J.; Liu, J.; Li, W.; Leong, Y.K.; Elsworth, D.; Guo, J. Combined effects of laminae characteristics and matrix-fracture equilibrium hysteresis on permeability evolution of fractured sorbing rocks. In Proceedings of the SPE Asia Pacific Oil and Gas Conference and Exhibition, Virtual, 17–19 November 2020. [Google Scholar]
  84. Zou, C.; Dong, D.; Wang, S.; Li, J.; Li, X.; Wang, Y.; Li, D.; Cheng, K. Geological characteristics and resource potential of shale gas in China. Pet. Explor. Dev. 2010, 37, 641–653. [Google Scholar] [CrossRef]
  85. Li, Q.; Li, Q.; Wang, F.; Wu, J.; Wang, Y.; Jin, J. Effects of Geological and Fluid Characteristics on the Injection Filtration of Hydraulic Fracturing Fluid in the Wellbores of Shale Reservoirs: Numerical Analysis and Mechanism Determination. Processes 2025, 13, 1747. [Google Scholar] [CrossRef]
Figure 1. Anisotropic structures of the multi-scale fracture/cleat systems in coal and shale rocks [8,9,10].
Processes 13 03304 g001
Figure 2. Conceptual geometry: (a) schematic of an anisotropic rock with different box-shaped matrix types (different colors represent matrices composed of different materials) and (b) schematic of effective flow channels and cross-sectional areas for gas flow in each direction.
Processes 13 03304 g002
Figure 3. Schematic of flow paths: (a) a coal layer conceptual model and (b) the flow path along the flow channel.
Processes 13 03304 g003
Figure 4. Comparison between this model and our previous model. Two equivalent scenarios for representing matrix pressure.
Processes 13 03304 g004
Figure 5. Directional permeability measurement data matching under constant average pore pressure conditions (experimental data collected from reference [5]).
Processes 13 03304 g005
Figure 6. Two permeability maps for validation: (a) the permeability map perpendicular to bedding and (b) the permeability map parallel to bedding (experimental data collected from reference [66]).
Processes 13 03304 g006
Figure 7. Permeability evolution in three directions under 5.1 MPa injection pressure.
Processes 13 03304 g007
Figure 8. Permeability ratio surfaces of the three directions: (a) the permeability ratio surface of direction 1, (b) the permeability ratio surface of direction 2, and (c) the permeability ratio surface of direction 3.
Processes 13 03304 g008
Figure 9. Anisotropic permeability ratios under 5.1 MPa injection pressure: (a) k 3 / k 1 and (b) k 2 / k 1 .
Processes 13 03304 g009
Figure 10. Effects of adsorption hysteresis on directional permeability evolution: (a) permeability evolution of direction 1, (b) permeability evolution of direction 2, and (c) permeability evolution of direction 3.
Processes 13 03304 g010
Figure 11. Effects of tortuosity on directional permeability evolution: (a) permeability evolution of direction 1, (b) permeability evolution of direction 2, and (c) permeability evolution of direction 3.
Processes 13 03304 g011
Figure 12. Effects of different matrix blocks on permeability evolution: (a) permeability evolution in direction 1, (b) permeability evolution in direction 2, and (c) permeability evolution in direction 3.
Processes 13 03304 g012
Figure 13. Pressure of pores (fractures), kerogen, and inorganic matrices.
Processes 13 03304 g013
Figure 14. Overall invaded volume ratios of the three cases.
Processes 13 03304 g014
Table 1. Input parameters for simulating the constant average pore pressure case.
ParametersValues Data Sources
Initial flow channel spacing a 1,0 2 × 10 4 mJing et al. [62] and experimental data matching
Initial flow channel spacing a 2,0 8 × 10 4 mJing et al. [62] and experimental data matching
Initial flow channel spacing a 3,0 3.5 × 10 4 mJing et al. [62] and experimental data matching
Initial flow channel aperture b 1,0 2 × 10 6 mLi et al. [63] and experimental data matching
Initial flow channel aperture b 2,0 1 × 10 6 mLi et al. [63] and experimental data matching
Initial flow channel aperture b 3,0 1.5 × 10 6 mLi et al. [63] and experimental data matching
Tortuosity exponential coefficient θ 1 0.314Ghanbarian et al. [49], Chen et al. [48], and experimental data matching
Tortuosity exponential coefficient θ 2 0.42Ghanbarian et al. [49], Chen et al. [48], and experimental data matching
Tortuosity exponential coefficient θ 3 0.51Ghanbarian et al. [49], Chen et al. [48], and experimental data matching
Coal bulk Young’s modulus E 1 3.6 × 10 8 PaChi and Yuwei [64] and experimental data matching
Coal bulk Young’s modulus E 2 3.8 × 10 8 PaChi and Yuwei [64] and experimental data matching
Coal bulk Young’s modulus E 3 3.9 × 10 8 PaChi and Yuwei [64] and experimental data matching
Coal bulk Poisson’s ratio ν 12 0.33Cui and Bustin [50] and experimental data matching
Coal bulk Poisson’s ratio ν 32 0.28Cui and Bustin [50] and experimental data matching
Coal bulk Poisson’s ratio ν 31 0.30Cui and Bustin [50] and experimental data matching
Flow channel Young’s modulus E f 1 4.50 × 10 6 PaConverted from the cleat compressibility of Zheng et al. [65] and experimental data matching
Flow channel Young’s modulus E f 2 4.75 × 10 6 PaConverted from the cleat compressibility of Zheng et al. [65] and experimental data matching
Flow channel Young’s modulus E f 3 4.88 × 10 6 PaConverted from the cleat compressibility of Zheng et al. [65] and experimental data matching
Flow channel Poisson’s ratio ν f 12 0.33Cui and Bustin [50] and experimental data matching
Flow channel Poisson’s ratio ν f 32 0.28Cui and Bustin [50] and experimental data matching
Flow channel Poisson’s ratio ν f 31 0.30Cui and Bustin [50] and experimental data matching
Temperature 298.15 KRoom temperature
Table 2. Shale permeability data and testing conditions [67].
Sample 1: HAD, 2, Dry (Perpendicular to Bedding)
Confining pressure, MPaPore (fracture) pressure, MPaPermeability, × 10 21 m2
30.0 1.1 157 ± 8
30.02.1 92 ± 5
30.03.1 76 ± 4
30.05.1 64 ± 4
Sample 2: HAD, 2, dry (parallel to bedding)
Confining pressure, MPaPore (fracture) pressure, MPaPermeability, × 10 18 m2
30.10.4 30 ± 2
30.20.6 23 ± 2
29.80.9 20 ± 1
29.91.1 18 ± 1
30.01.6 15 ± 1
Table 3. Input parameters for simulating the constant confining pressure case.
ParametersValuesData Sources
Initial flow channel spacing a 1,0 4.33 × 10 4 mZeng et al. [32] and experimental data matching
Initial flow channel spacing a 2,0 6 × 10 4 mZeng et al. [32] and experimental data matching
Initial flow channel spacing a 3,0 2.86 × 10 4 mZeng et al. [32] and experimental data matching
Initial flow channel aperture b 1,0 1.99 × 10 7 mZeng et al. [32] and experimental data matching
Initial flow channel aperture b 2,0 1 × 10 7 mZeng et al. [32] and experimental data matching
Initial flow channel aperture b 3,0 7.95 × 10 7 mZeng et al. [32] and experimental data matching
Tortuosity exponential coefficient θ 1 0.302Ghanbarian et al. [49], Chen et al. [48], and experimental data matching
Tortuosity exponential coefficient θ 2 0.35Ghanbarian et al. [49], Chen et al. [48], and experimental data matching
Tortuosity exponential coefficient θ 3 0.45Ghanbarian et al. [49], Chen et al. [48], and experimental data matching
Shale bulk Young’s modulus E 1 2.5 × 10 10 PaSone and Zoback [68] and experimental data matching
Shale bulk Young’s modulus E 2 1.8 × 10 10 PaSone and Zoback [68] and experimental data matching
Shale bulk Young’s modulus E 3 1.5 × 10 10 PaSone and Zoback [68] and experimental data matching
Shale bulk Poisson’s ratio ν 12 0.35Sone and Zoback [68] and experimental data matching
Shale bulk Poisson’s ratio ν 32 0.3Sone and Zoback [68] and experimental data matching
Shale bulk Poisson’s ratio ν 31 0.32Sone and Zoback [68] and experimental data matching
Flow channel Young’s modulus E f 1 6 × 10 6 PaConverted from the shale fracture compressibility of Tan et al. [69] and experimental data matching
Flow channel Young’s modulus E f 2 5.3 × 10 6 PaConverted from the shale fracture compressibility of Tan et al. [69] and experimental data matching
Flow channel Young’s modulus E f 3 4.3 × 10 6 PaConverted from the shale fracture compressibility of Tan et al. [69] and experimental data matching
Flow channel Poisson’s ratio ν f 12 0.35Sone and Zoback [68] and experimental data matching
Flow channel Poisson’s ratio ν f 32 0.3Sone and Zoback [68] and experimental data matching
Flow channel Poisson’s ratio ν f 31 0.32Sone and Zoback [68] and experimental data matching
Shale matrix bulk modulus K m 5 × 10 10 PaConverted from the Young’s modulus of Sone and Zoback [68] and experimental data matching
Matrix grain bulk modulus K s 6 × 10 10 PaConverted from the Young’s modulus of Sone and Zoback [68] and experimental data matching
Characteristic time coefficient C 800 Pa/sZeng et al. [32] and experimental data matching
Equivalent matrix diffusivity D m e 10 13 m2/sZhang et al. [70] and experimental data matching
Bulk swelling strain constant ε L b 1 , a d 0.025Peng et al. [61] and experimental data matching
Bulk swelling strain constant ε L b 2 , a d 0.028Peng et al. [61] and experimental data matching
Bulk swelling strain constant ε L b 3 , a d 0.038Peng et al. [61] and experimental data matching
Bulk Langmuir pressure p L b 1 4.29 × 10 6 PaWang et al. [23] and experimental data matching
Bulk Langmuir pressure p L b 2 4 × 10 6 PaWang et al. [23] and experimental data matching
Bulk Langmuir pressure p L b 3 3.34 × 10 6 PaWang et al. [23] and experimental data matching
Matrix swelling strain constant ε L m 1 , a d 0.01Liu and Rutqvist [71] and experimental data matching
Matrix swelling strain constant ε L m 2 , a d 0.015Liu and Rutqvist [71] and experimental data matching
Matrix swelling strain constant ε L m 3 , a d 0.035Liu and Rutqvist [71] and experimental data matching
Matrix Langmuir pressure p L m 1 4 × 10 6 PaPeng et al. [34] and experimental data matching
Matrix Langmuir pressure p L m 2 3.3 × 10 6 PaPeng et al. [34] and experimental data matching
Matrix Langmuir pressure p L m 3 3 × 10 6 PaPeng et al. [34] and experimental data matching
Temperature 318.15 KGhanizadeh [66]
Disclaimer/Publisher’s Note: The statements, opinions and data contained in all publications are solely those of the individual author(s) and contributor(s) and not of MDPI and/or the editor(s). MDPI and/or the editor(s) disclaim responsibility for any injury to people or property resulting from any ideas, methods, instructions or products referred to in the content.