Article

Investigation of the Relationship Between Reservoir Sensitivity and Injectivity Impedance in Low-Permeability Reservoirs

1
State Key Laboratory of Shale Oil and Gas Enrichment Mechanisms and Effective Development, Beijing 100083, China
2
Research and Development Center for the Sustainable Development of Continental Sandstone Mature Oilfield by National Energy Administration, Daqing 163000, China
3
Petroleum Engineering School, Yangtze University, Wuhan 430100, China
4
Sinopec Petroleum Exploration and Production Research Institute, Beijing 100083, China
*
Author to whom correspondence should be addressed.
Processes 2025, 13(10), 3283; https://doi.org/10.3390/pr13103283
Submission received: 30 August 2025 / Revised: 28 September 2025 / Accepted: 10 October 2025 / Published: 14 October 2025
(This article belongs to the Special Issue Advanced Strategies in Enhanced Oil Recovery: Theory and Technology)

Abstract

In low-permeability reservoirs, studying reservoir sensitivity is crucial for optimizing water flooding, as it identifies detrimental mineral-fluid interactions that can cause formation damage and reduce injection efficiency. However, existing diagnostic methods for sensitivity-induced damage rely on post-facto pressure monitoring and lack a quantitative relationship between sensitivity factors and water injectivity impairment. Furthermore, correlating microscale interactions with macroscopic injectivity parameters remains challenging, causing current models to inadequately represent actual injection behavior. This study combines microscopic techniques (e.g., SEM, XRD, NMR) with macroscopic core flooding experiments under various sensitivity-inducing conditions to analyze the influence of reservoir mineral composition on flow capacity, evaluate formation sensitivity, and assess the dynamic impact on water injectivity. The quantitative relationship between clay minerals and injectivity impairment in low-permeability reservoirs is also investigated. The results indicate that flow capacity is predominantly governed by the type and content of sensitive minerals. In water-sensitive reservoirs, water injection induces clay swelling and migration, leading to flow path reconfiguration and water-blocking effects. In salt-sensitive formations, high-salinity water promotes salt precipitation within pore throats, reducing permeability. In velocity-sensitive formations, fine particle migration causes flow resistance to initially increase slightly and then gradually decline with continued injection. Acidizing generally enhances pore connectivity but induces pore-throat plugging in chlorite-rich reservoirs. Alkaline fluids can exacerbate heterogeneity and generate precipitates, though appropriate concentrations may improve connectivity. Under low effective stress, rock dilation increases porosity and permeability, while elevated stress causes compaction, increasing flow impedance.

1. Introduction

As conventional oil and gas resources account for a diminishing share of total hydrocarbon reserves, low-permeability reservoirs are increasingly contributing to both reserves and production volumes [1,2,3]. Consequently, the development of low-permeability resources has become a critical focus in oil and gas exploration and production. However, the inherent challenges in injection and production processes within such reservoirs introduce significant technical difficulties, directly contributing to low recovery rates and inefficient extraction.
The significant variation in surface properties among different minerals in low-permeability reservoirs leads to considerable differences in crude oil flow mechanisms. The reservoir rocks in such formations are typically composed predominantly of quartz, followed by feldspar. Quartz overgrowth, which occurs as microcrystalline quartz precipitating in interparticle pores or on grain surfaces, or as quartz extending outward along particle edges, significantly reduces reservoir permeability [4]. Feldspar minerals are highly susceptible to dissolution, which generally enhances reservoir properties. When exposed to aqueous fluids, both feldspar and quartz develop nanoscale water films on their surfaces, reducing the effective cross-sectional area of flow pathways. Chlorite coatings reduce pore-throat size and can occlude porosity, while authigenic illite and ferroan calcite, formed primarily through plagioclase alteration, occur as patchy, pore-filling minerals that significantly reduce porosity and permeability. Therefore, it is imperative to conduct systematic experiments including velocity, water, salt, alkali, and acid sensitivity assessments on core samples with varying clay mineral contents. By integrating permeability damage rates, such studies can evaluate variations in water injectivity impedance and clarify the underlying mechanisms by which clay minerals contribute to flow resistance. Quantitatively distinguishing the factors affecting injectivity impairment and establishing a dynamic, quantifiable relationship between impedance and sensitivity effects is of critical importance.
Recent advances in analyzing reservoir sensitivity and its link to injectivity impedance have increasingly focused on bridging the gap between microscopic mechanisms and macroscopic performance. Traditionally, injectivity impairment was assessed primarily through empirical correlations and post-facto well-test analysis. However, integrating real-time imaging techniques and in-situ monitoring during core flooding experiments has provided unprecedented insights into the dynamic processes of formation damage. For instance, using nuclear magnetic resonance (NMR) during flooding allows for the non-destructive tracking of fluid occupancy and pore-scale changes, revealing that damage often initiates in specific pore types (e.g., micropores) before impacting the entire flow network [5]. Similarly, studies combining micro-computed tomography (μ-CT) with computational fluid dynamics (CFD) have begun to quantify the exact contribution of a single migrated clay particle or precipitated salt crystal to the overall pressure drop [6]. In modeling, recent efforts have moved beyond static sensitivity indices toward coupled geochemical-geomechanical models that simulate the temporal evolution of damage under changing injection chemistries and stress conditions [7]. These models aim to predict not just if damage will occur, but how it will propagate spatially and intensify over time. Despite these promising developments, a significant challenge remains: integrating these diverse microscale findings into a unified, quantitative framework that can reliably predict field-scale injectivity impedance based on readily available mineralogical data. This study directly addresses this challenge by systematically correlating quantitative mineralogy from XRD with comprehensive sensitivity experiments, aiming to establish predictive relationships that are both mechanistically sound and practically applicable for optimizing water injection strategies in low-permeability reservoirs.
Guided by the industry standard [8]: Methods for Flow Test Evaluation of Reservoir Sensitivity*, this study conducted multiple sensitivity experiments. Integrating mineralogical and pore-throat characteristics, the research aimed to differentiate the factors contributing to water injectivity impedance under various conditions. Laboratory core flooding experiments were performed on cores with varying clay mineral contents (as determined by XRD) to evaluate velocity, water, salt, alkali, and acid sensitivities at different injection rates [9]. By correlating the permeability damage rate with observed injectivity impedance, the study clarifies the mechanism by which clay minerals contribute to flow resistance. Furthermore, advanced characterization techniques including scanning electron microscopy (SEM), constant-rate mercury injection (MIP), and nuclear magnetic resonance (NMR) were employed to quantitatively identify the key factors for the elevated impedance. In-situ microstructural comparisons before and after damage, using conventional thin-section microscopy and SEM, were conducted to analyze differences in sensitive minerals and pore-throat characteristics. This approach allowed for identifying damage types such as solid particle plugging, fine migration, and clay swelling across various reservoir zones [10]. Additionally, mathematical models were developed to establish a quantitative relationship between sensitivity-induced damage and injectivity resistance.

2. Methods and Procedures

2.1. Experimental Materials

Experimental Equipment: high-pressure displacement pump, manually operated confining pressure pump, high-pressure nitrogen cylinder, intermediate container, core holder, filter assembly (0.22 μm membrane filter + ceramic filter with <1 μm retention), mechanical pressure gauge, six-way valve, back-pressure regulator, graduated test tubes, electronic balance and Vernier caliper.
Experimental Reagents: 1 mol/L sodium hexametaphosphate solution, anhydrous ethanol, 1 mol/L benzene solution, deionized water, solid hydrochloric acid and 12 mol/L sodium hydroxide solution.

2.2. Determination of Clay Mineral Types and Composition

Natural core samples were numbered and subsampled. To enrich clay minerals and remove interference from detrital minerals, samples were gently crushed and placed in beakers. Deionized water and 0.05 mol/L sodium hexametaphosphate solution were added, followed by magnetic stirring for 2 h to ensure complete dispersion. The suspension was transferred to a graduated cylinder for constant-temperature sedimentation. After particle settlement, the upper suspension was carefully extracted and subjected to three cycles of high-speed centrifugation and concentration, ultimately yielding concentrated clay paste.
An appropriate amount of clay paste was uniformly coated onto quartz glass slides and air-dried at room temperature for 24 h. These slides were used to determine the initial basal spacing of clay minerals. The air-dried slides were placed on a stand within a desiccator containing sufficient ethylene glycol at the bottom. After sealing, the desiccator was maintained in a 40 °C oven for saturation over at least 12 h. XRD scans were performed with angular ranges of 2–35° and 2–70° at scanning speeds of 1°/min and 2°/min, respectively. Quantitative analysis was conducted using full-pattern fitting refinement to calculate the absolute mass of all mineral phases.

2.3. Basic Petrophysical Property Tests on Native Core Samples

2.3.1. Native Core Pre-Treatment

Cylindrical core plugs with dimensions of 2.5 cm in diameter and 5 cm in length were prepared. In accordance with the industry standard [11]: Methods for Core Analysis*, and considering the potential impact of solvents and cleaning methods on clay mineral structure, retained hydrocarbons were extracted using a mixture of alcohol and benzene (3:1 by volume) [12]. After cleaning, the cores were placed in an oven and dried at 60 °C for a minimum of 48 h. Following this initial period, the weight of each core was measured every 8 h. The drying process was considered complete when the weight difference between two consecutive measurements was less than 0.01 g.

2.3.2. Determination of Air Permeability

The dried core sample was placed into a core holder, with the inlet connected to a nitrogen cylinder and the outlet connected to a gas flow meter. The confining pressure was set to 2 MPa. Measurement was stopped when the gas flow rate at the outlet stabilized, and the outlet flow rate and pressure were recorded. Finally, the gas permeability of the core was calculated based on Darcy’s law.

2.3.3. Core Saturation and Pore Volume Measurement

The dried core samples were subjected to vacuum evacuation and subsequently saturated with synthetic formation brine. The cores were immersed in the brine for a minimum of 40 h. Following saturation, the weight of each core was measured. The effective pore volume and porosity of each sample were then calculated according to the designated formulae.
V p = m 1 m 0 ρ 1
ϕ = V p V t × 100 %

2.4. Reservoir Sensitivity Tests

In sensitivity testing experiments, the environmental conditions for core flooding were designed to replicate the actual conditions of the sampled reservoir interval as closely as possible. The displacement temperature was set at 50 °C, the initial confining pressure was selected as 2 MPa, and throughout the entire experiment, the inlet pressure was maintained 1.5–2 MPa below the confining pressure.

2.4.1. Water/Sensitivity Test

Following the procedures outlined in Section 2.3., the basic petrophysical properties of the native core samples were determined, along with the initial permeability (K0) measured under stable flow conditions after saturation with formation brine. The working fluids for water sensitivity consisted of formation brine diluted to varying ratios. Core flooding was conducted under identical conditions to the initial permeability measurement. The effective liquid permeability (K1) was measured for each fluid, and the pressure and flow rate data were recorded throughout the displacement process. The water/salinity sensitivity index (Is) was subsequently calculated using the following formula.
Diluted formation water: Reagents (NaCl, CaCl2, MgCl2·H2O) were used to prepare simulated brine solutions with different salinities.
I s = K 0 K 1 K 0 × 100 %

2.4.2. Velocity Sensitivity Test

Following the protocols in Section 2.3., representative core samples were selected, cleaned, dried, and their basic petrophysical properties were determined. The cores were then vacuum-saturated with formation brine to establish the initial liquid permeability (K0). The experiment was conducted using a constant-flow-rate method. The flow rate of the brine-saturated core was used as the base rate. A series of sequentially increasing flow rates were set, and the corresponding permeability (Kn) at each rate was measured. Pressure and flow rate data were recorded throughout the displacement process [13]. The velocity sensitivity damage rate (Dv) was calculated using the following formula.
D v n = K 0 K n K 0 × 100 %  
D v = m a x   ( D v 2 ,   D v 3 ,   D v m )
where Dv2, Dv3, …, Dvm represent the permeability damage rates corresponding to different flow velocities.

2.4.3. Acid Sensitivity Test

The basic petrophysical properties of the native core samples and their initial permeability (K0) under stable flow conditions after saturation with formation brine were determined according to the procedures outlined in Section 2.3. The acidizing fluid, comprising 15% HCl, was injected in the reverse direction for 1–1.5 pore volumes (PV). Injection was then halted, and the valves at both ends of the core holder were closed to allow the hydrochloric acid to react fully with the core for at least 30 min. After the reaction period, formation brine was injected in the forward direction to flush the core [6]. The final liquid permeability (Kacd) after acid treatment was measured. The acid sensitivity damage rate (Dac) was calculated using the following formula.
D a c = K 0 K a c d K 0 × 100 %

2.4.4. Alkali Sensitivity Test

The basic petrophysical properties of the native core samples and their initial permeability (K0), measured under stable flow conditions after saturation with formation brine, were determined following the protocols in Section 2.3. A standard NaOH solution was used as the alkaline fluid. The pH of the solution was incrementally increased from 7.0 to 13.0 in steps of 1.0 pH unit [14]. For each pH level, the prepared alkaline fluid was injected into the core sample. The core was flooded with 10–15 pore volumes (PV) of the fluid at a specific pH and then shut in for 12 h to allow sufficient reaction between the alkaline solution and the rock. After the reaction period, additional fluid at the same pH was injected, and the resulting effective liquid permeability (Ki, where i = 1, 2, …, n) was measured. The injection was performed sequentially from the lowest to the highest pH value. The alkali sensitivity damage rate was calculated using the following formula.
D a l n = K 0 K n K 0 × 100 %
D a l = max D a l 2 ,   D a l 3 ,   D a l m
where Dal2, Dal3, …, Dalm represent the permeability damage rates corresponding to different pH levels.

2.4.5. Stress Sensitivity Test

The basic petrophysical properties of the native core samples were determined following the procedures outlined in Section 2.3. The initial permeability (K0) was measured under stable flow conditions after saturating the cores with synthetic formation brine, employing a constant-pressure flooding method. The net stress applied during this initial saturation phase was designated as the baseline net stress. The stress sensitivity evaluation was then conducted through a detailed loading-unloading cycle. The net stress was systematically increased in predetermined increments. At each target net stress level, the core was maintained under constant stress for a minimum of 30 min while flooding to ensure pore pressure and deformation stabilization before permeability (Kn) measurement. After reaching the maximum net stress, the confining pressure was sequentially reduced back to the original baseline stress according to predefined intervals. During this unloading path, the core was held at each net stress level for over 1 h to adequately capture hysteresis effects and permeability recovery before measurement. All pressure data were recorded in megapascals (MPa; 1 MPa ≈ 145.038 psi). The permeability was measured at each stress state, and its change rate was recorded. The degree of stress sensitivity damage was quantified based on the maximum permeability damage rate, calculated using the following formula.
D a l n = K 0 K n K 0 × 100 %
D s t = max D s t 1 ,   D s t 2 ,   D s t n
where Dst1, Dst2, …, Dstn represent the permeability damage rates corresponding to different stress levels.

3. Results and Analysis

3.1. Impact of Mineral Composition on Flow Capacity

3.1.1. Clay Mineral Types and Mineralogical Characteristics

The clay minerals identified in the reservoir of the Ahe Formation in the ZLX area, eastern Kuqa (KC), are primarily illite, kaolinite, and chlorite, with a minor amount of illite/smectite mixed layer (I/S) observed in some samples [15]. Based on the distribution across different blocks, the clay mineral assemblages can be broadly categorized into three types: illite + kaolinite, illite + chlorite, and kaolinite + chlorite (Figure 1).
Among them, the clay mineral assemblage in the study interval of wells YX1 and YS4 is Illite + kaolinite. In well YS4, the relative content of kaolinite increases vertically, while that of illite decreases. In the well YN2 area and well TZ2, the assemblage is Illite + Chlorite. Vertically, the relative content of Illite increases in the YN2 area. Towards well MN1, the assemblage in the study interval becomes kaolinite + chlorite, with the relative content of chlorite decreasing upwards.
(1)
Kaolinite-Al4[Si4O10](OH)8
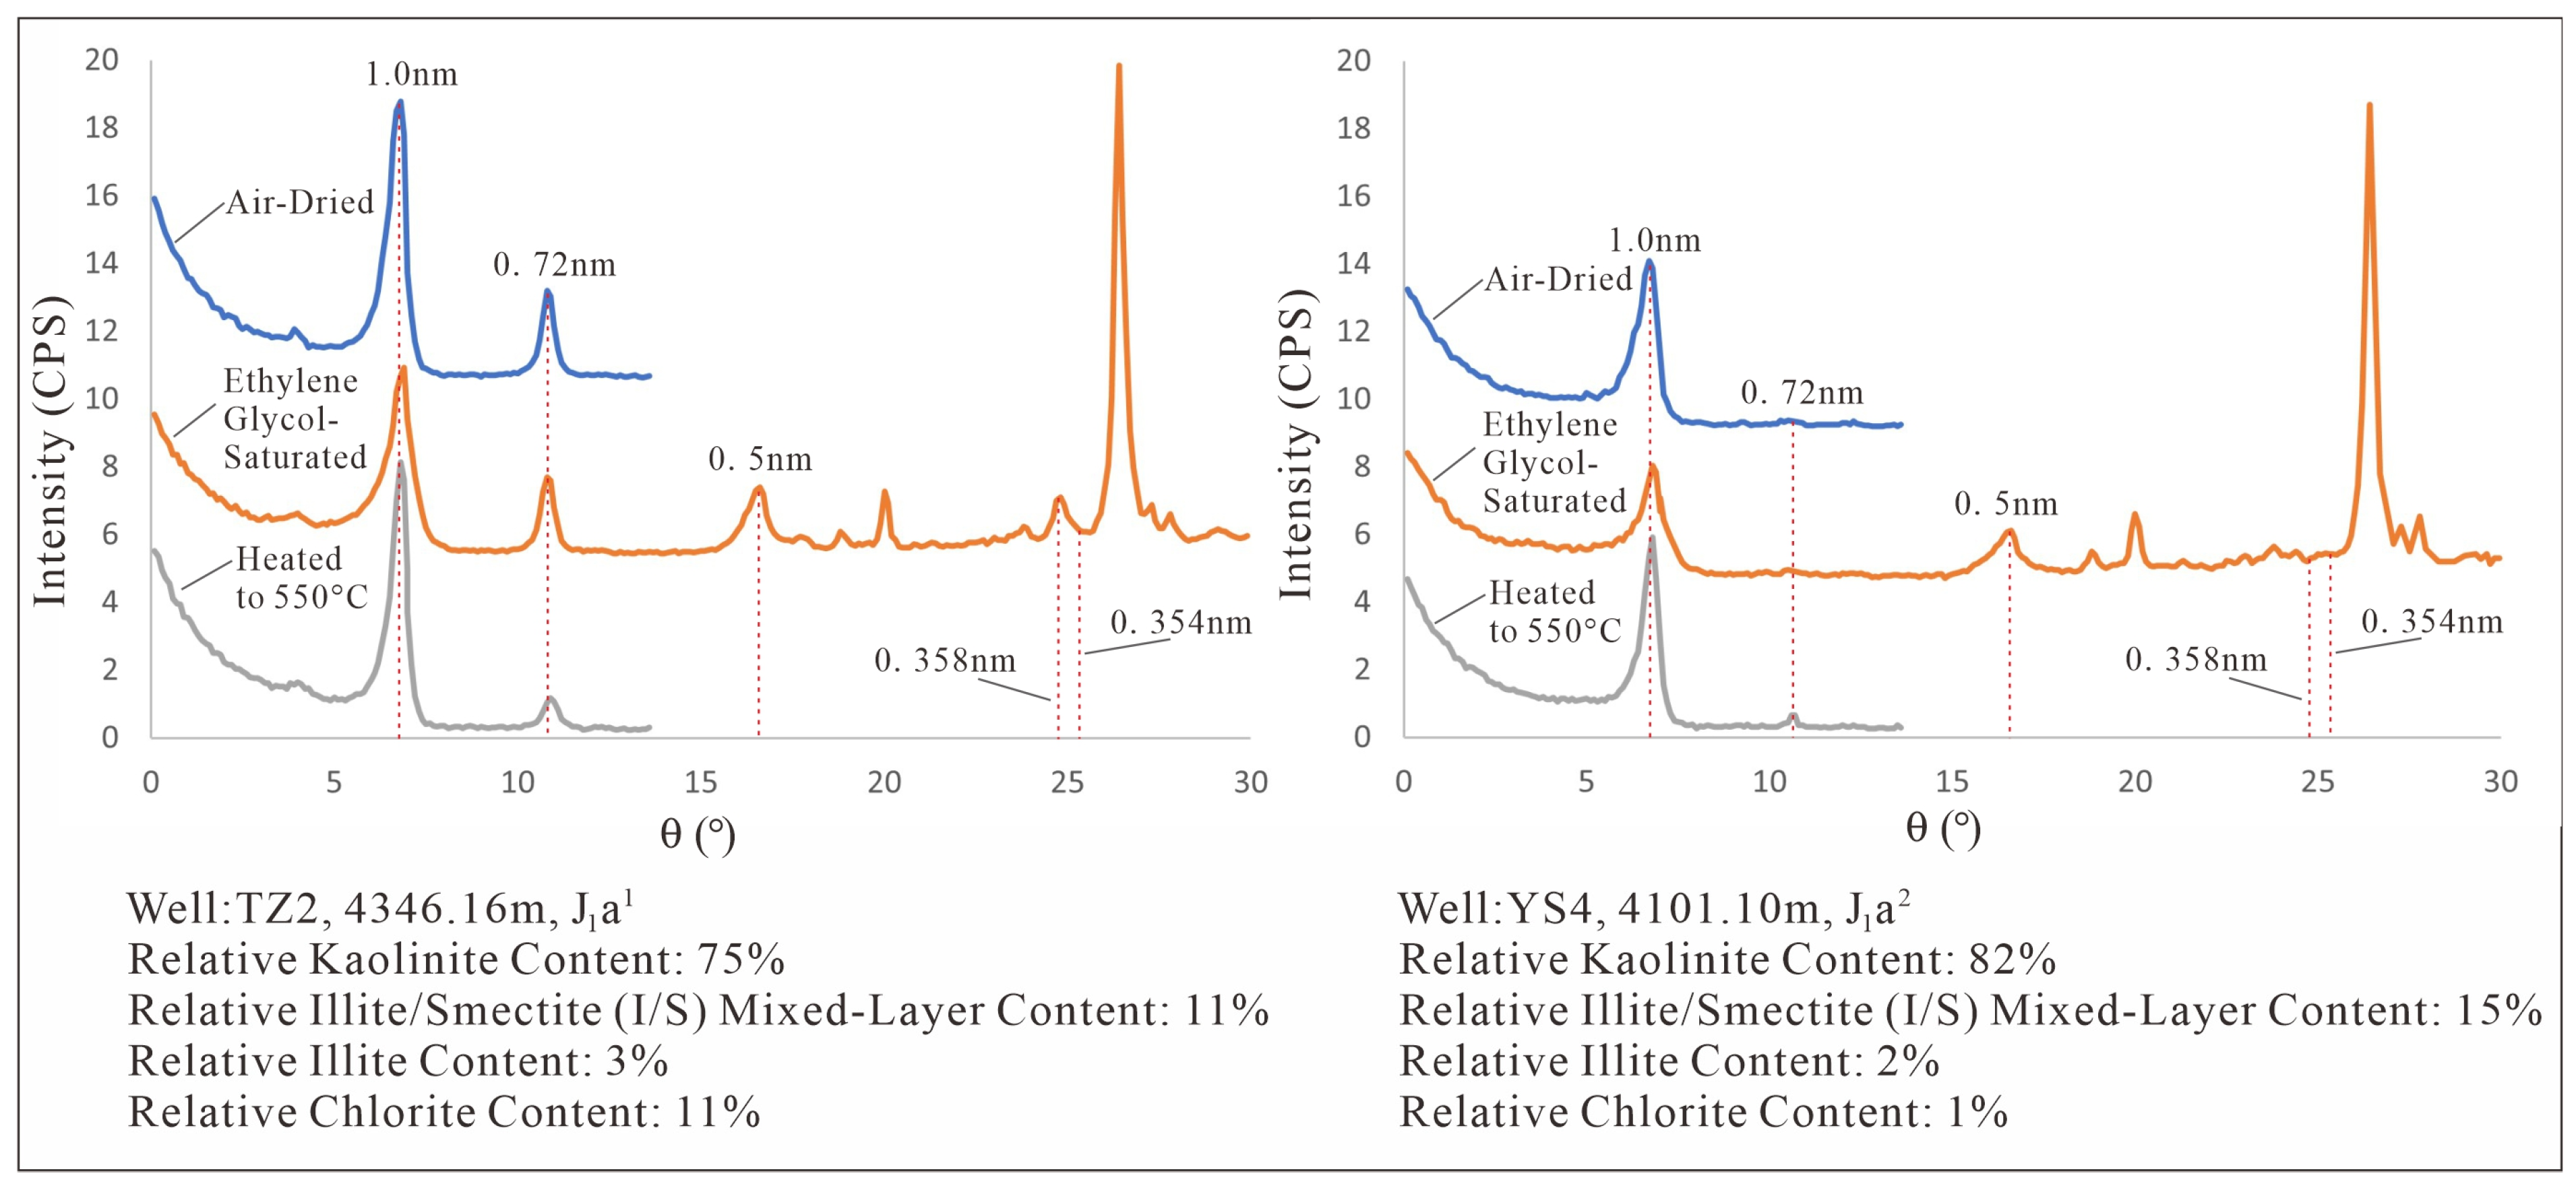
The X-ray diffraction (XRD) pattern of typical kaolinite is characterized by two distinct peaks at approximately 0.72 nm (001) and 0.358 nm (002) in the air-dried state. After saturation with ethylene glycol, the positions of these two peaks show no significant change, confirming the non-expandable nature of Kaolinite (Figure 2). The sharpness of these peaks indicates well-crystallized Kaolinite.
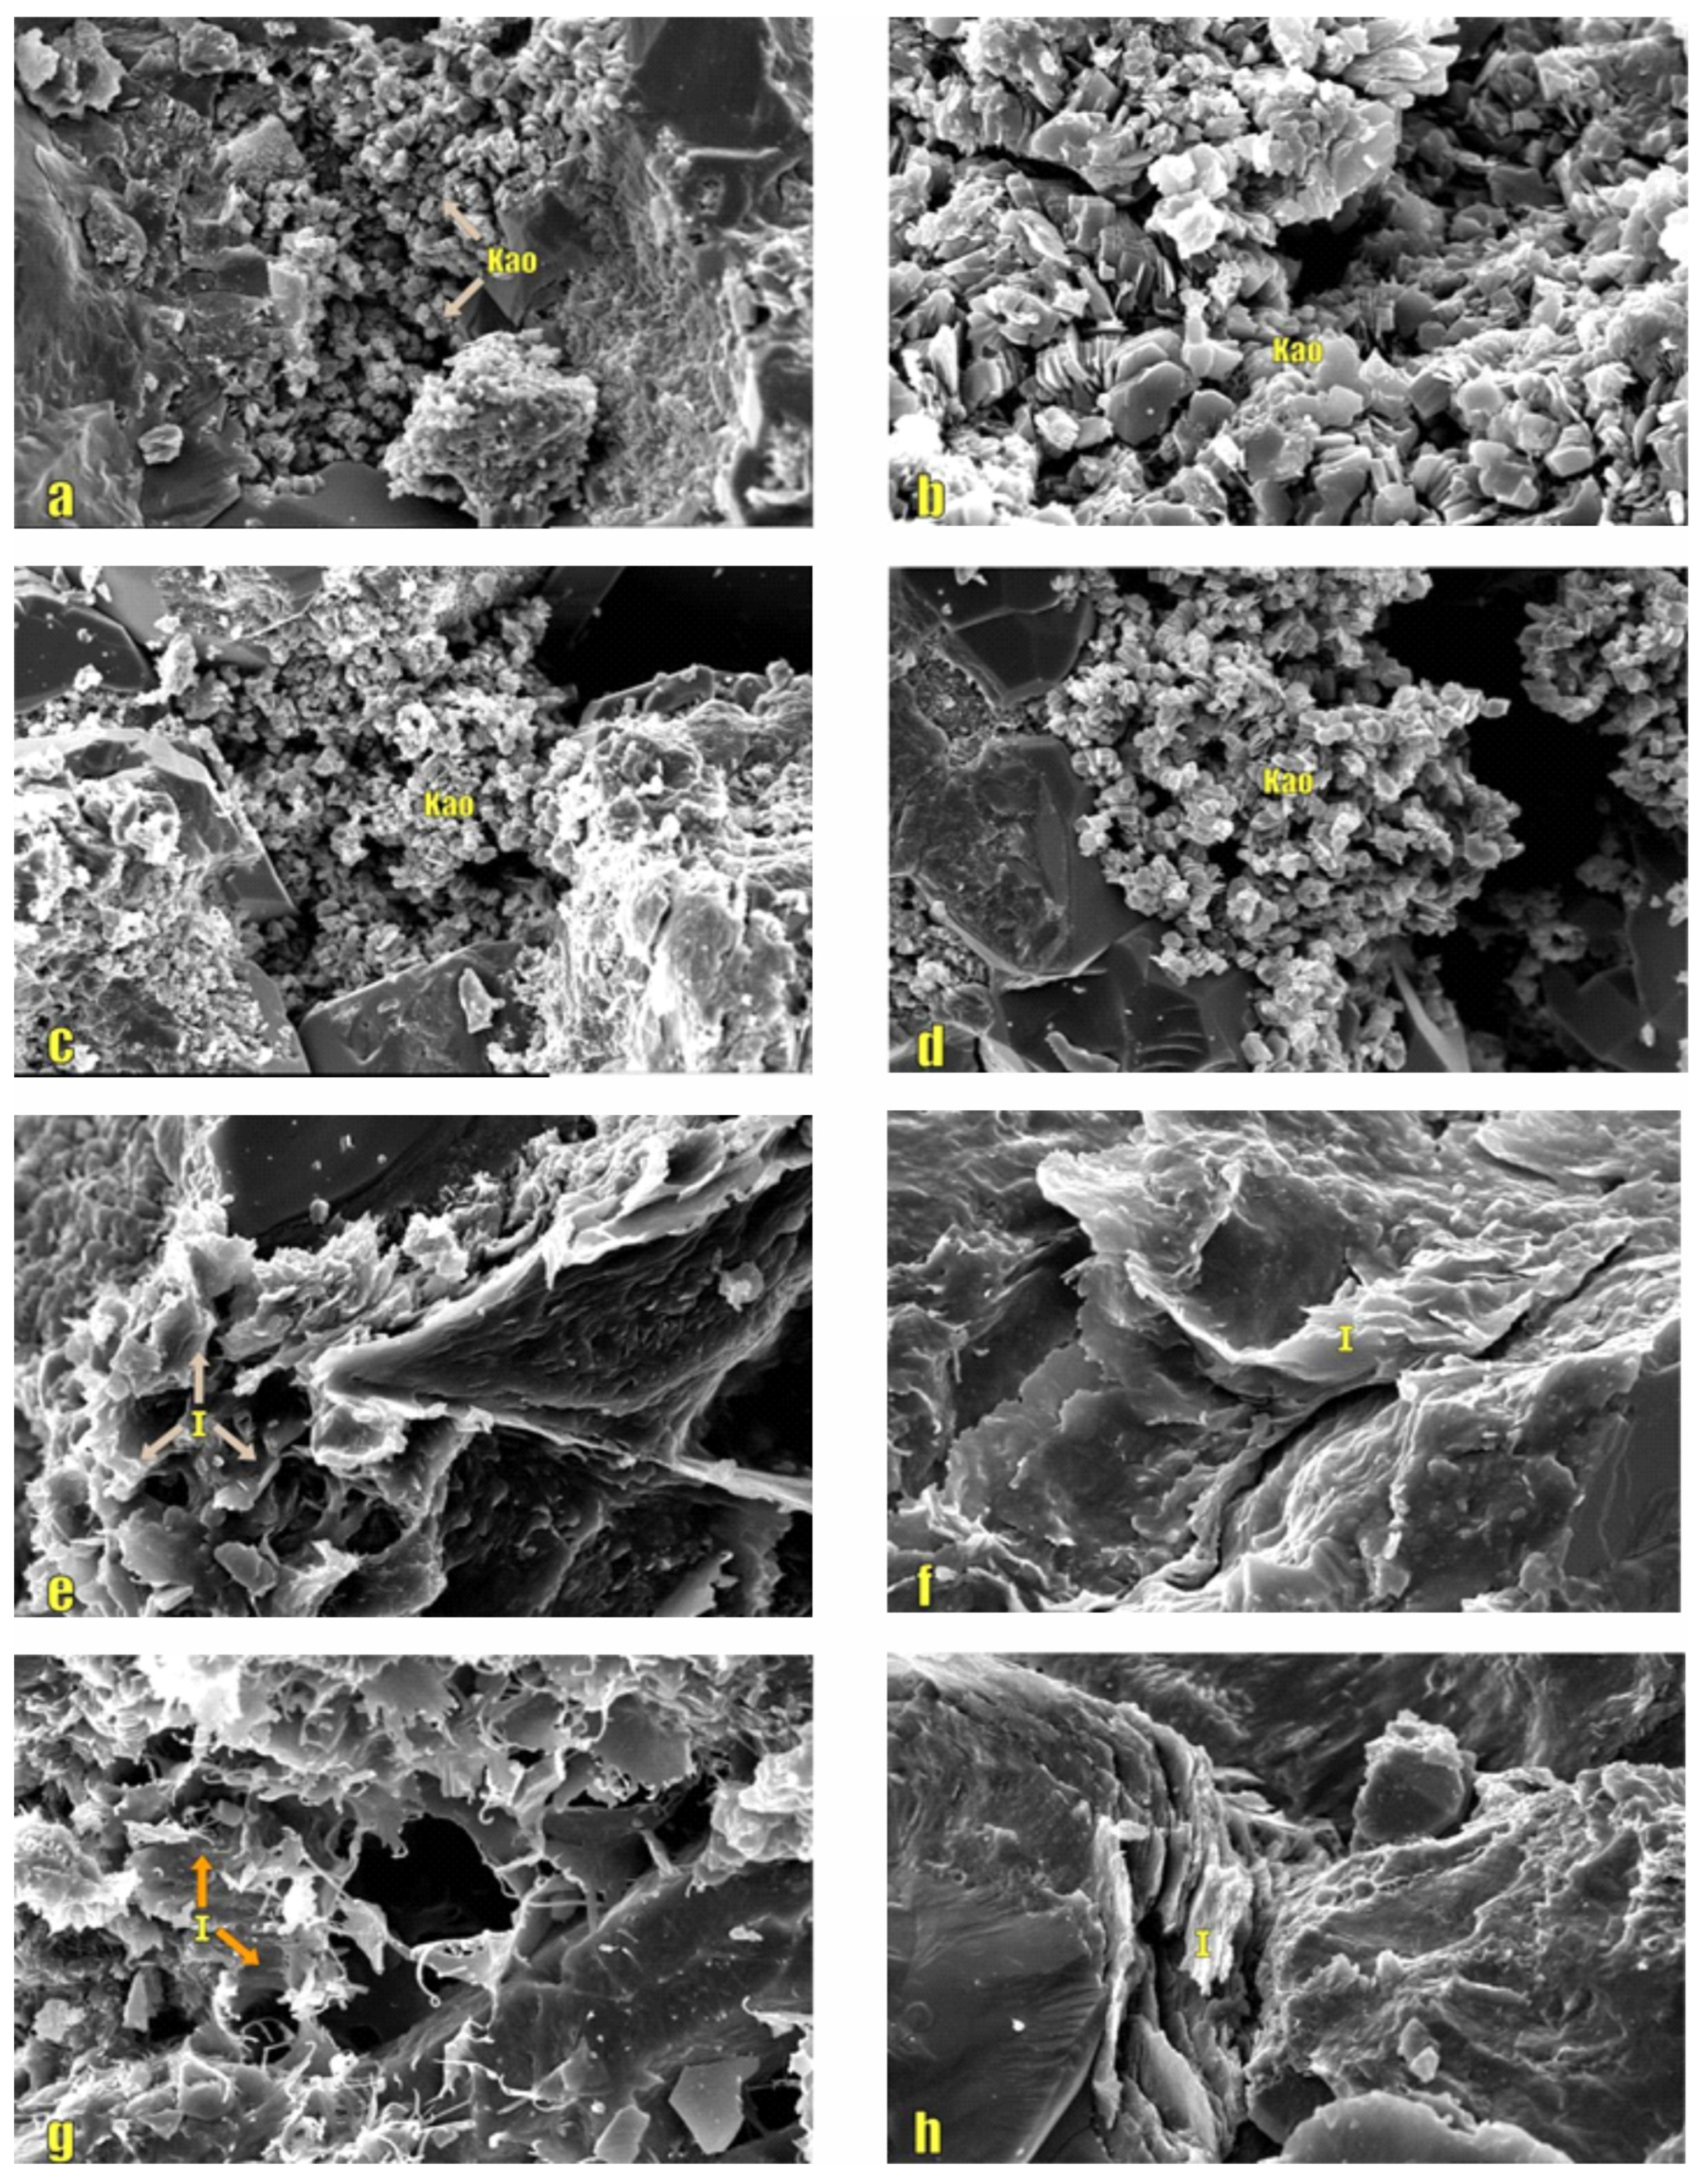
Under SEM observation, kaolinite exhibits a morphology of fine, pseudo-hexagonal crystalline platelets. Within intergranular pores, it often occurs as book-like or vermicular aggregates [16] (Figure 3a–d). In the studied interval, kaolinite primarily exists as a pore-filling and even throat-plugging cement, making it highly sensitive to changes in fluid flow velocity. This indicates that the kaolinite cement has already induced a certain degree of velocity-sensitive damage. Kaolinite is primarily formed by the dissolution of unstable components such as feldspar and matrix minerals [7]. Although it formed during burial diagenesis and is a product of cementation, it remains subject to fluid-rock interactions. Therefore, kaolinite cement is often distributed in sedimentary sand bodies that facilitate fluid flow, such as distributary channel sands.
(2)
Illite-KAl2[(Al, Si)Si3O10](OH)2
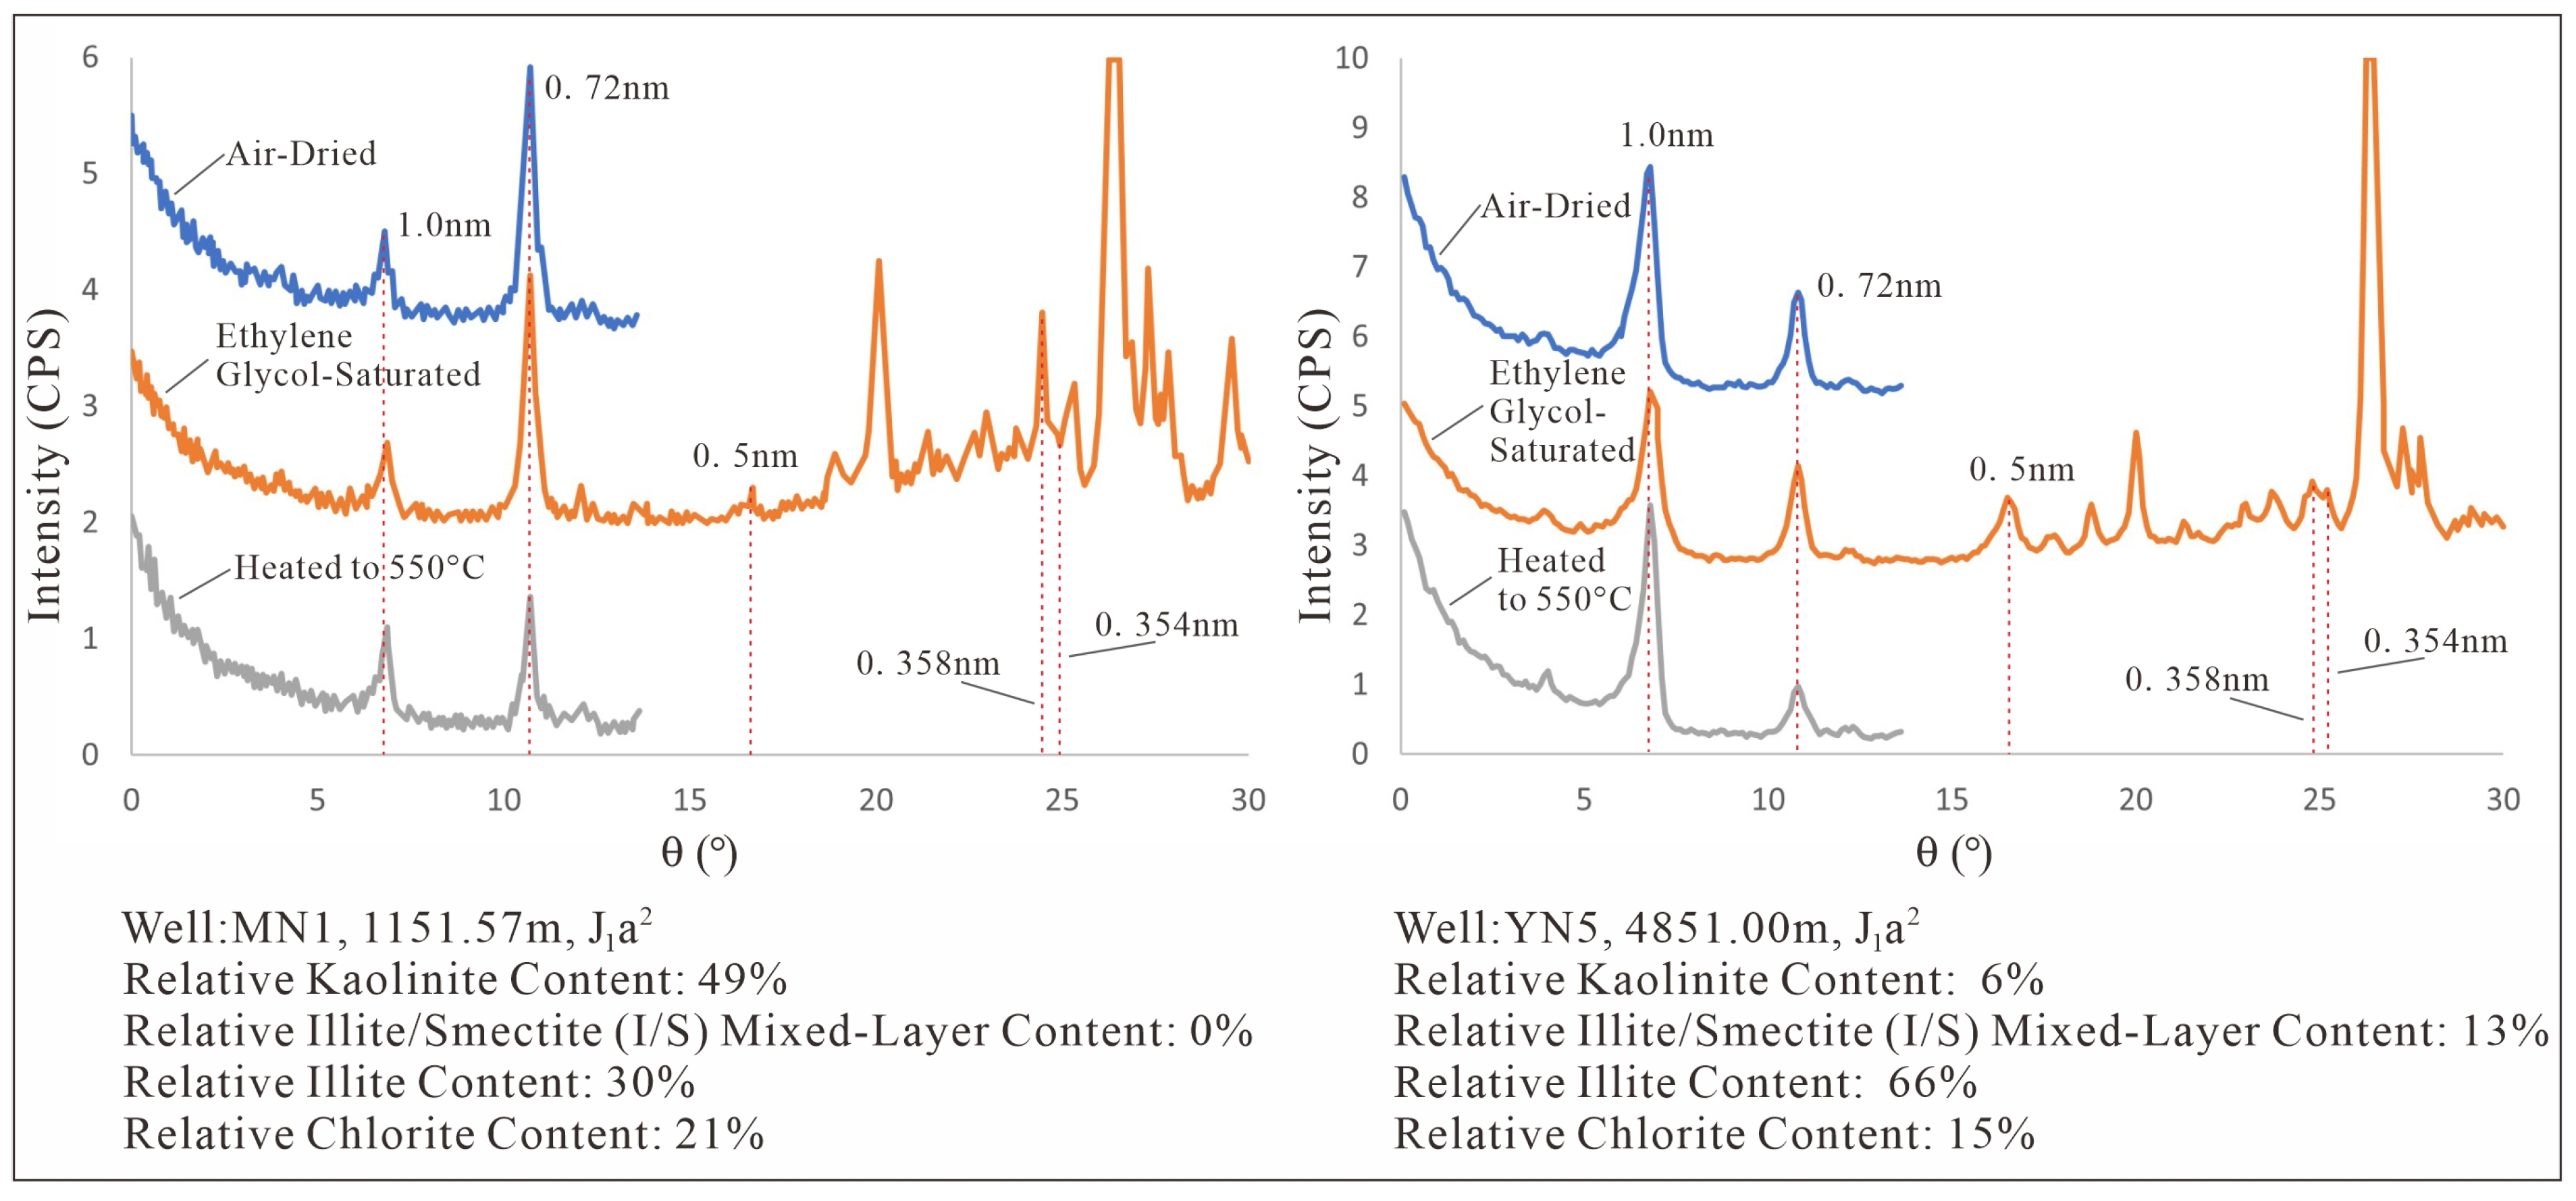
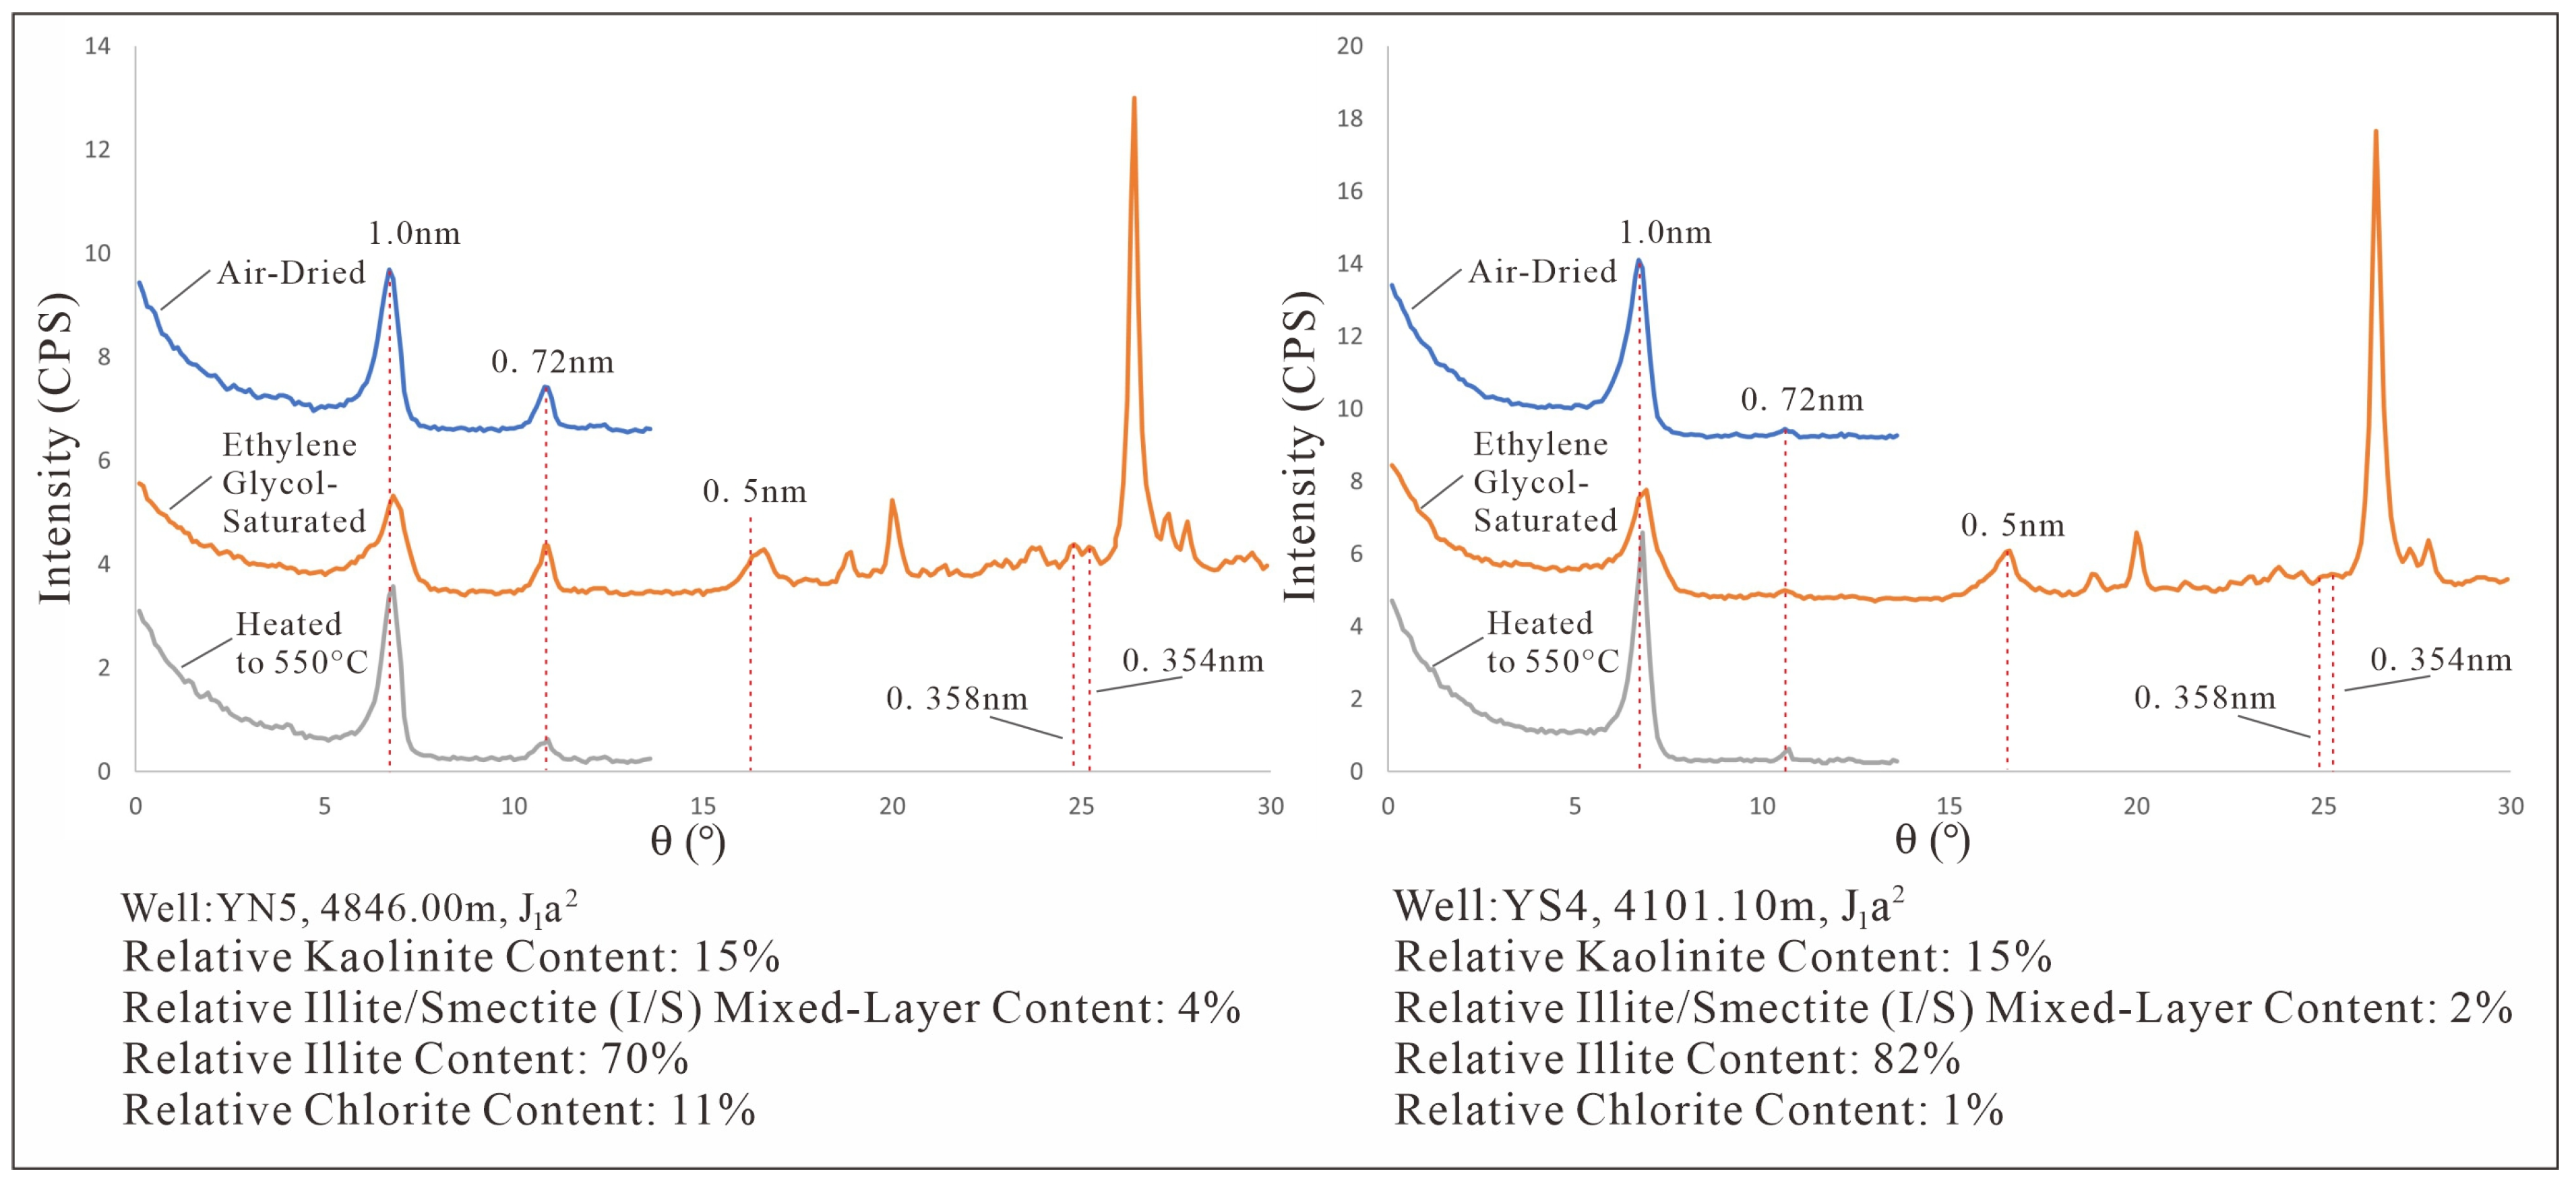
The XRD pattern of Illite shows characteristic peaks at 1.0 nm (001) and 0.5 nm (002). After ethylene glycol saturation and heating to 550 °C, the positions of these peaks remain stable (Figure 4), distinguishing it from expandable clays.
SEM observation shows that illite primarily exhibits a morphology of thin, platy crystals in a sheet-like form, with minor, scattered filamentous occurrences (Figure 3e–h). The reservoir damage caused by illite cement in the studied interval is primarily water sensitivity.
The sheet-like illite, which primarily lines pores, is predominantly detrital. Its presence indicates the co-deposition of clay-sized particles with coarser grains under conditions of waning hydrodynamic energy [17], meaning its distribution correlates with the depositional environment. The less common filamentous illite, however, is mainly a diagenetic product formed during burial.
(3)
Chlorite-Mg(Fe)2Al(SiAlO3)
Chlorite is identified by its series of basal reflections at approximately 1.4 nm (001), 0.71 nm (002), 0.47 nm (003), and 0.354 nm (004). The peaks remain unchanged after glycation but show characteristic intensity changes upon heating to 550 °C, a key diagnostic feature (Figure 5).
Under SEM observation, chlorite exhibits a morphology of finely crystallized platelets, occurring primarily as acicular to platy forms within intergranular pores (Figure 6). Given that iron and aluminum ions within chlorite cement can be readily released into the formation water during acidizing operations, they may form new iron (aluminum) compound precipitates. These precipitates can plug pores and block throats. Therefore, the reservoir damage induced by chlorite cement is predominantly characterized by acid sensitivity.
In the studied interval, chlorite occurs predominantly as intergranular fillings. This type of chlorite is mostly of matrix-derived origin, and its formation process is similar to that of illite [18]. Scattered occurrences of chlorite with an acicular morphology are also observed, which are primarily products of clay mineral transformation, likely formed from smectite under specific fluid conditions.
(4)
Illite/Smectite (I/S) Mixed layer
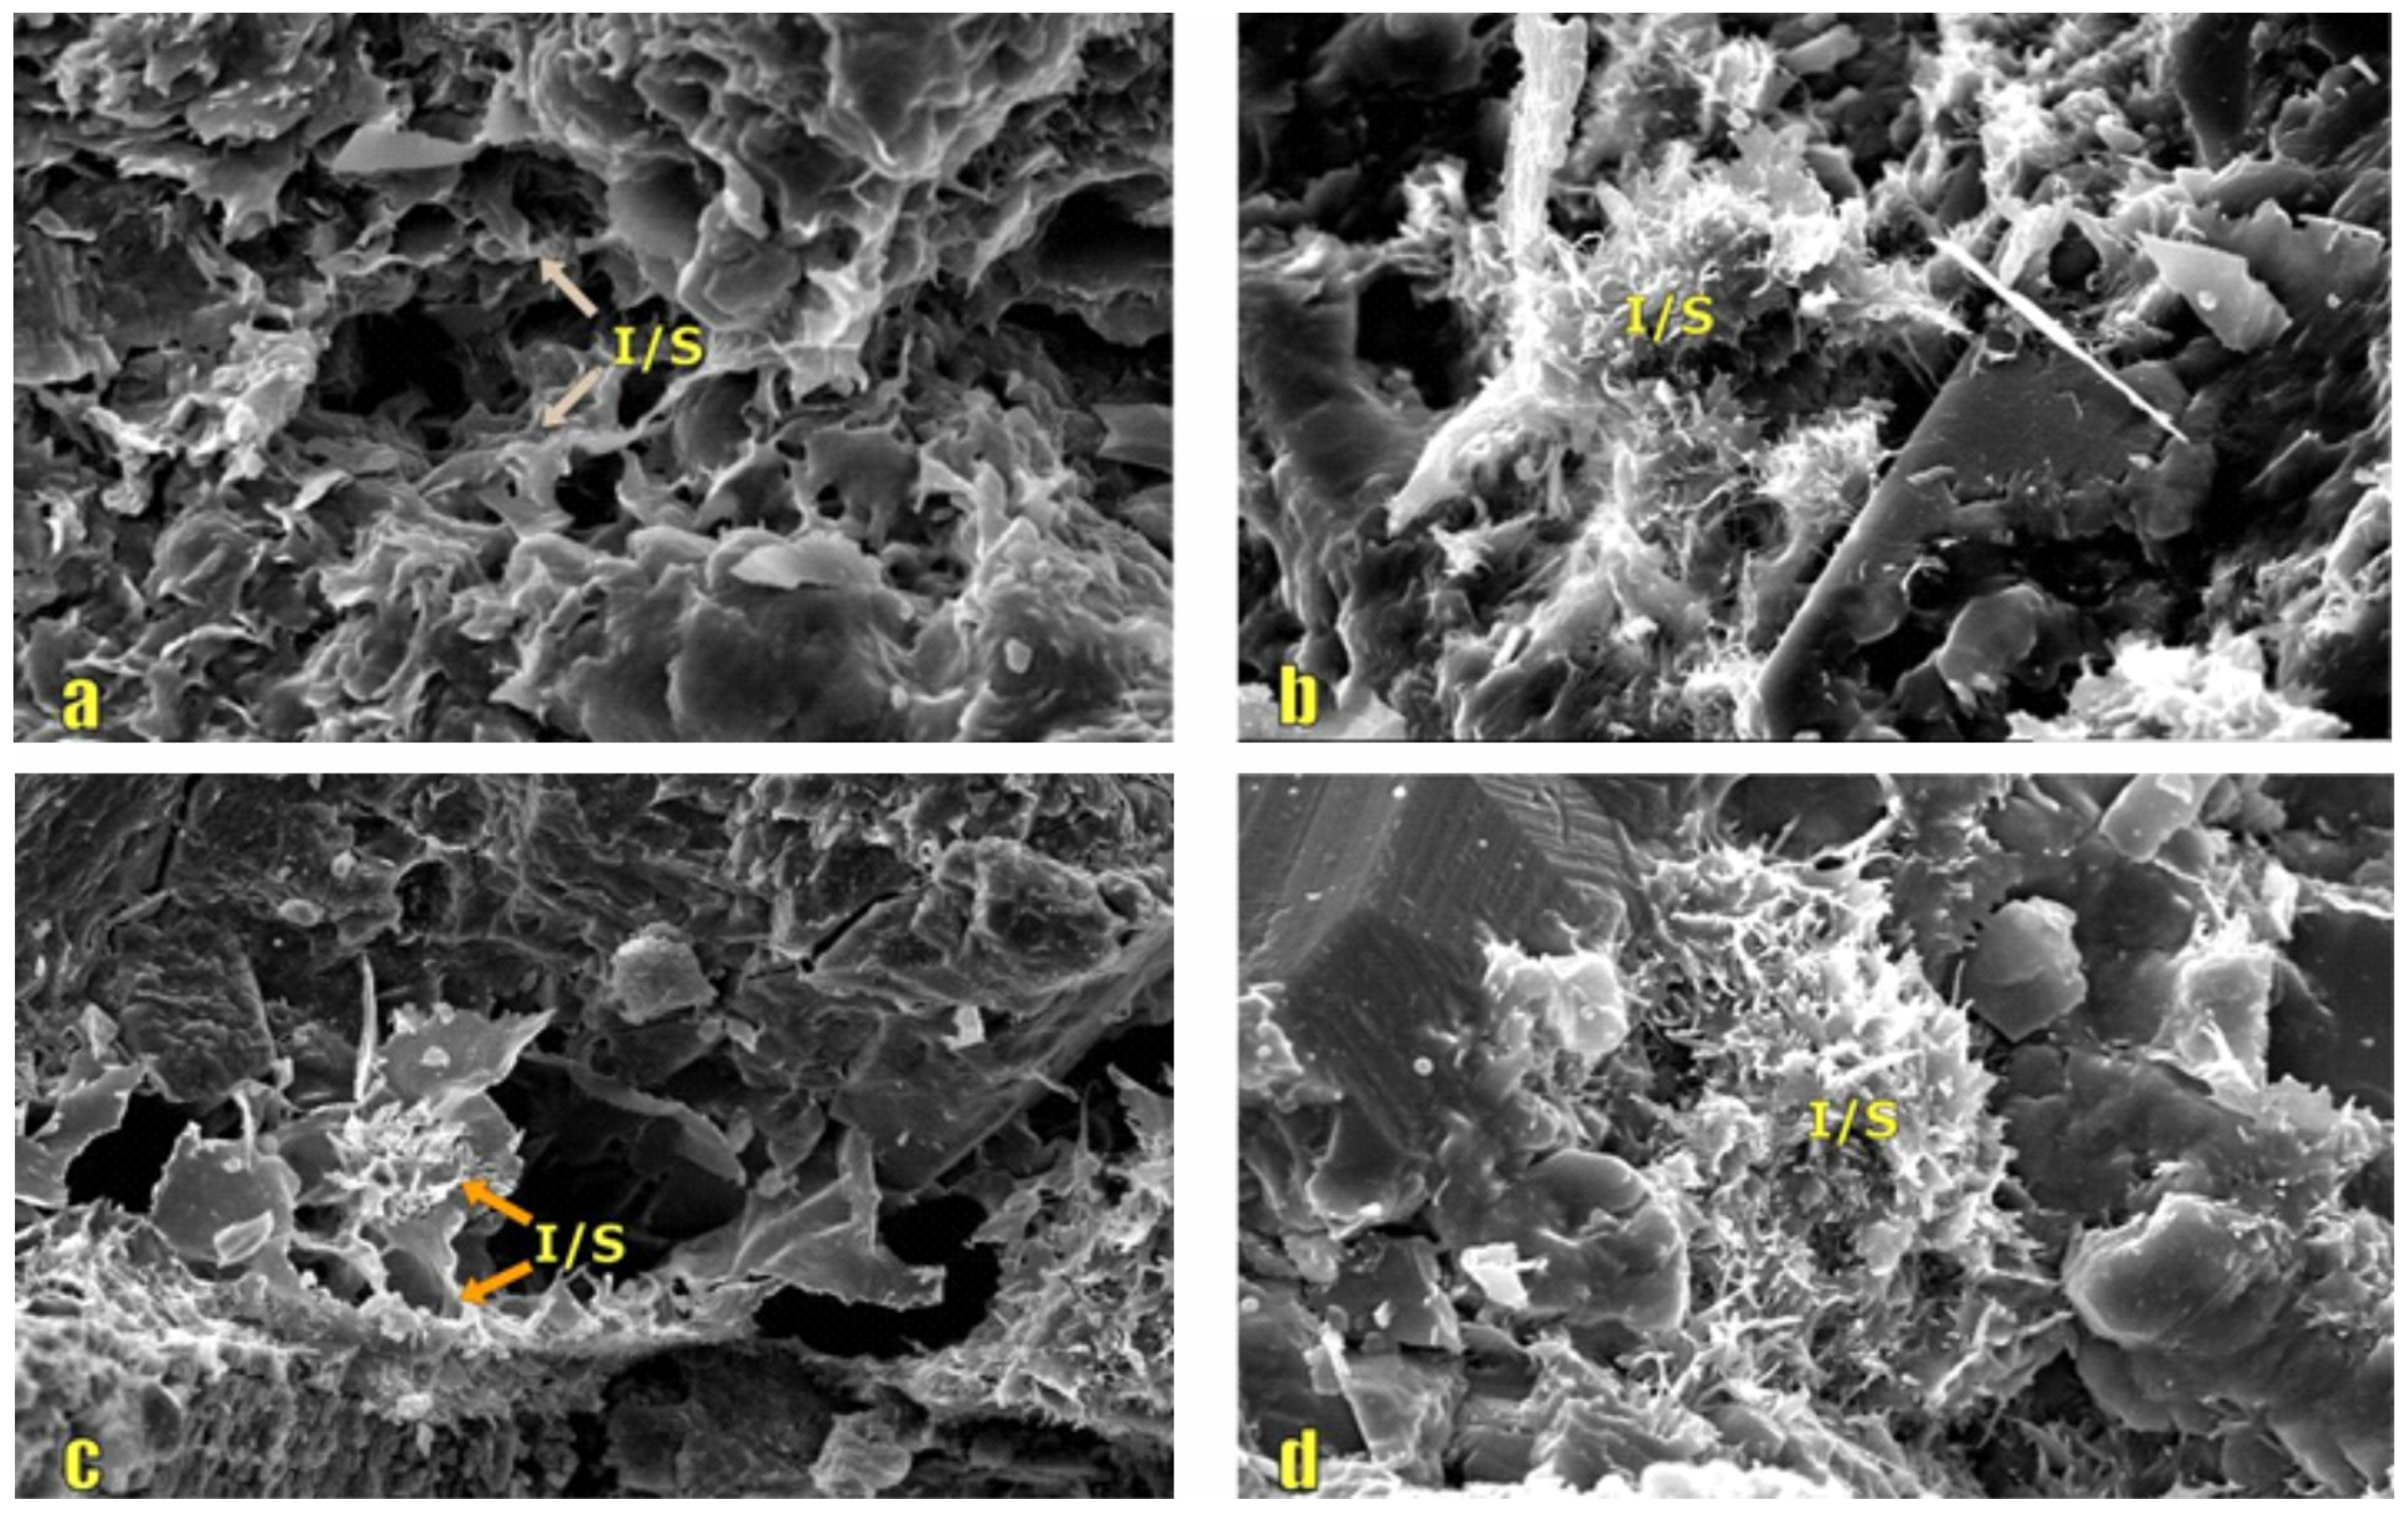
The identification of I/S mixed layer clay is critical. In the air-dried state, its (001) peak appears as a broad band between 1.0–1.2 nm. Upon saturation with ethylene glycol, this peak shifts to a lower angle, expanding to approximately 1.6–1.8 nm (Figure 7), confirming the presence of expandable smectite layers interstratified with non-expandable Illite layers. Observed under scanning electron microscopy, the particles typically display irregular morphologies that are indicative of a physical sedimentation origin, and are found within the same matrix (Figure 8). The content of I/S mixed layer is relatively low in the studied interval, but its presence significantly influences the water sensitivity behavior.
Waterflood efficiency is significantly influenced by the occurrence modes of clay minerals, which include pore-throat filling and grain-coating films. Clay minerals that develop as pore-filling and throat-occluding phases subdivide larger intergranular pores, creating numerous micropores. This can lead to water phase trapping, velocity sensitivity, and pore blockage, thereby impairing reservoir flow capacity and increasing injectivity impedance. Conversely, clay minerals occurring as grain-coating films adsorb heavy components from crude oil, forming an oil-wet or water-wet boundary layer on the grain surface. This not only reduces the available space for fluid flow but also enhances flow boundary effects, causing sensitivity damage such as water and acid sensitivity. For instance, chlorite, being an oil-wet mineral, tends to adsorb asphaltenes to form a thin oil-wet film. This increases the required water injection pressure and consequently impedes efficient oil displacement.

3.1.2. Relationship Between Clay Minerals and Reservoir Properties

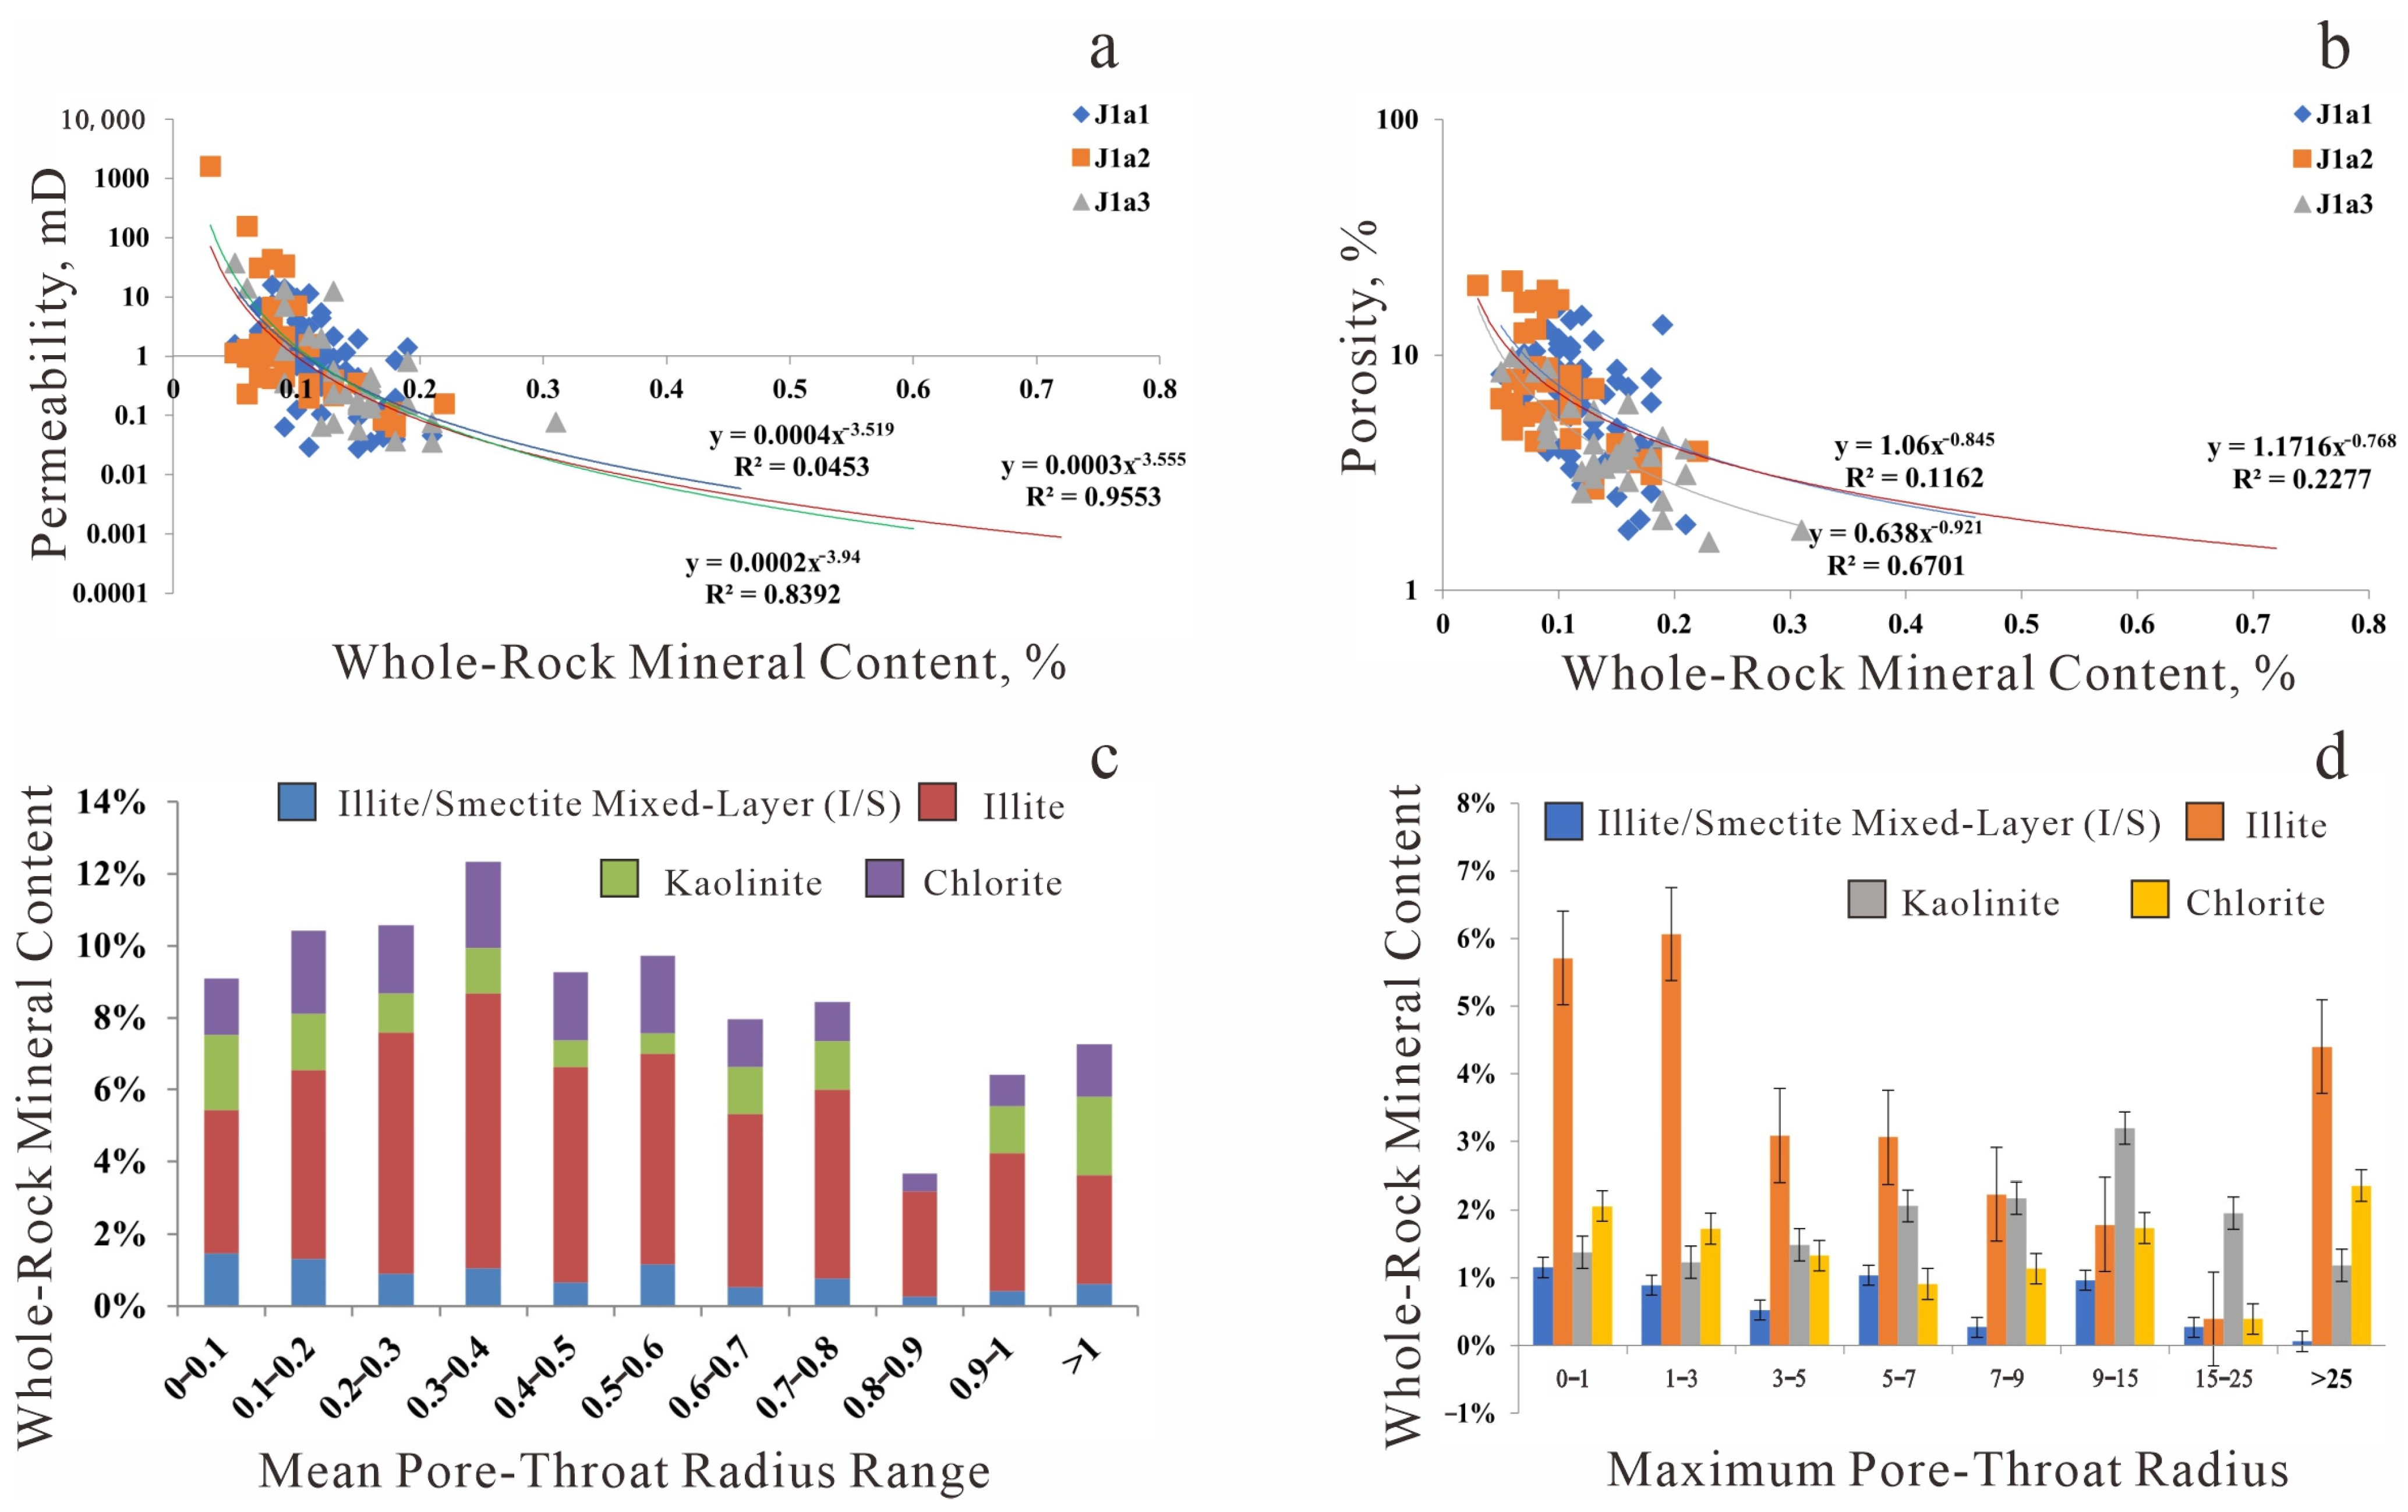
Studies indicate that a power-law relationship exists between clay mineral content and reservoir petrophysical parameters [19]. The type of clay minerals present significantly influences the reservoir properties in each interval, and the functional relationships between clay mineralogy and permeability are similar across different layers (Figure 9a,b). Illite is the primary factor controlling the variation trends in reservoir porosity and permeability, while kaolinite predominantly influences the pore-throat radius distribution (Figure 9c,d).
Clay mineral types exhibit a significant influence on porosity but a relatively minor impact on permeability. A negative correlation exists between clay mineral content and both porosity and permeability. Among these minerals, illite has the most pronounced effect on the porosity-permeability relationship and is the primary controlling factor on the pore network and flow characteristics [15] (Figure 10 and Figure 11).
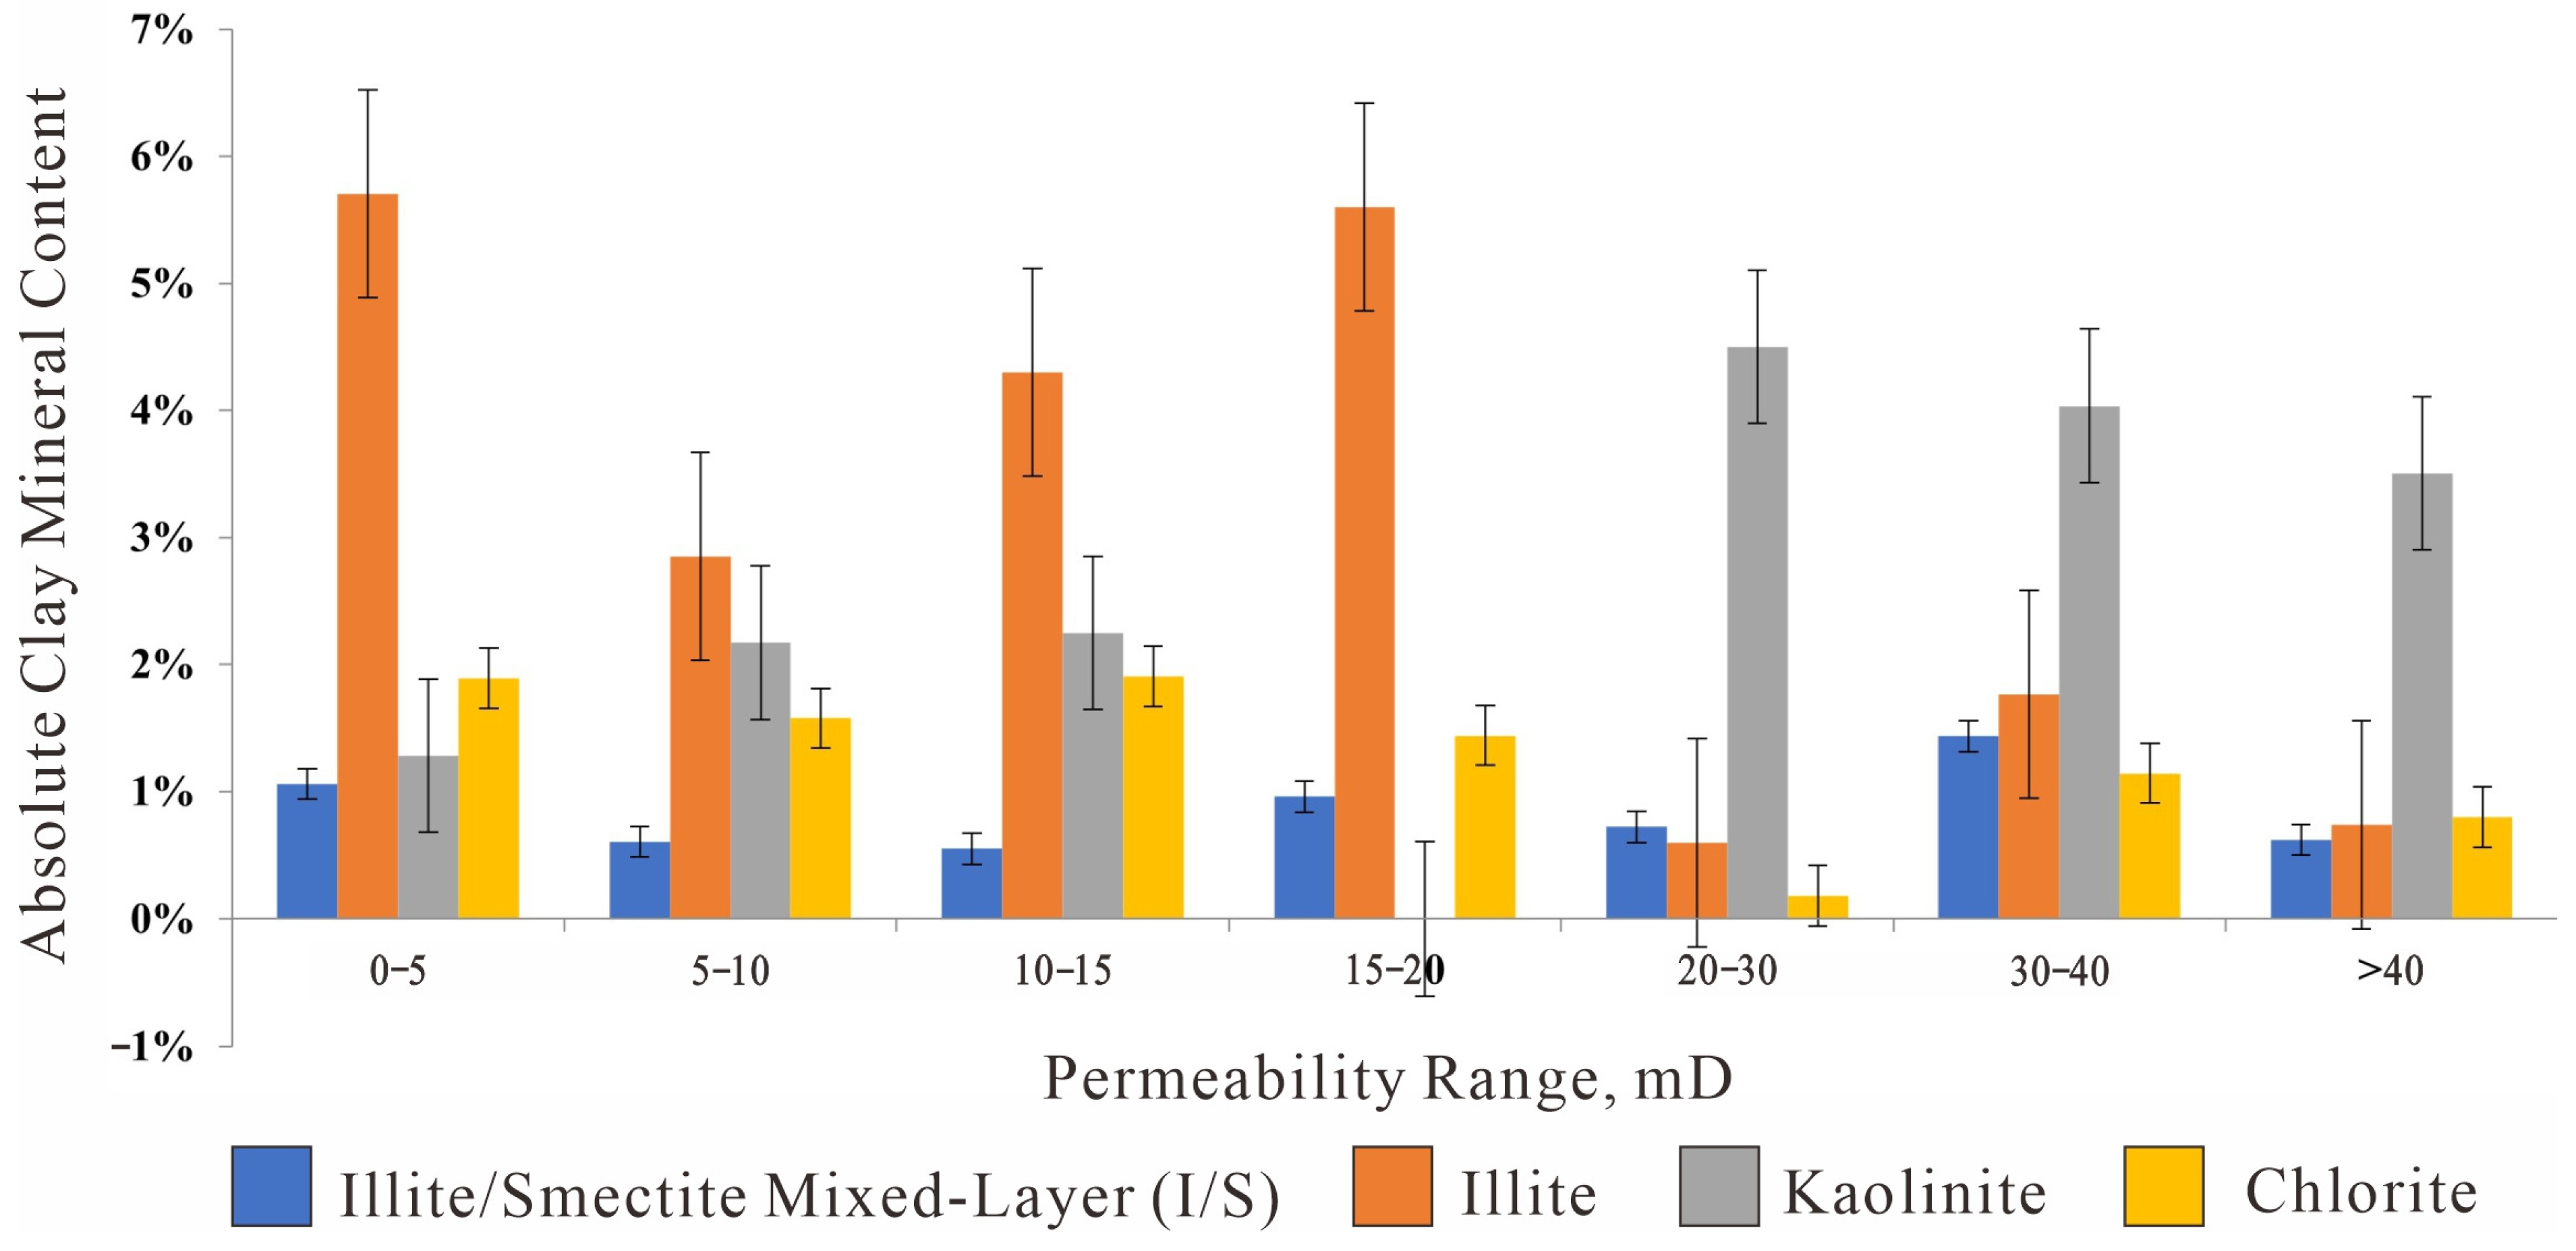
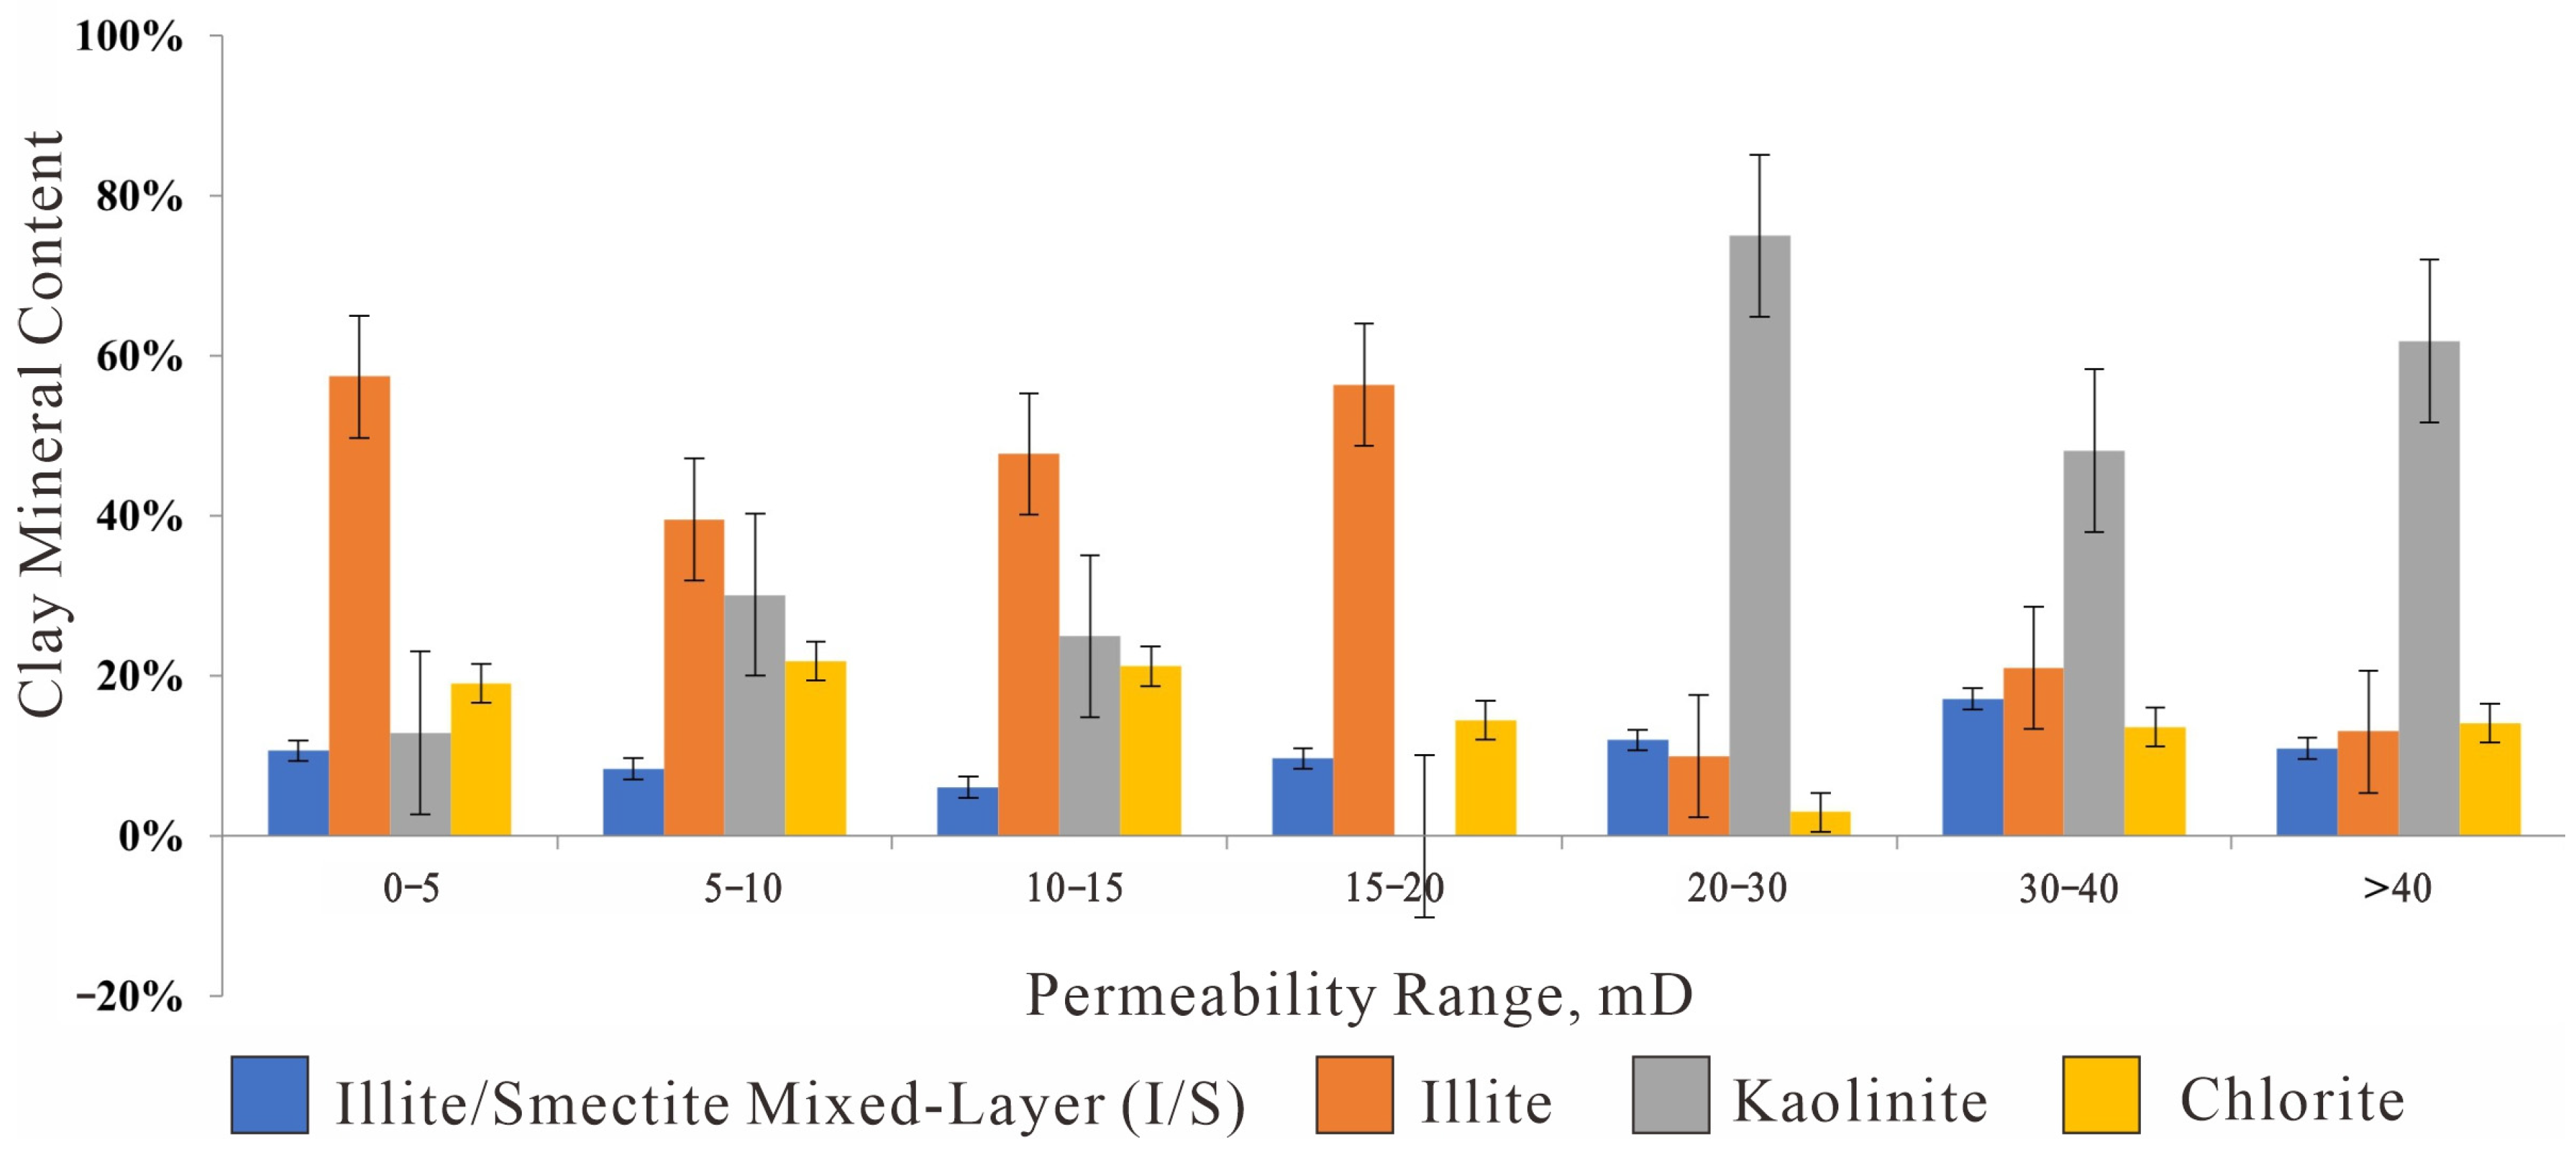
Analysis of the absolute content and relative proportion of clay minerals across different permeability ranges indicates that within the 0–20 md interval, illite is relatively well-developed, while kaolinite accounts for a smaller proportion. Conversely, in intervals with permeability >20 md, kaolinite becomes more prevalent, and the illite content decreases sharply. This distribution is consistent with the genetic classification of clay mineral occurrences (Figure 12 and Figure 13).
Analysis of the absolute content and relative proportion of clay minerals across different porosity ranges reveals the following general trend: within the 0–3% porosity range, the illite content increases; between 3% and 9%, it remains relatively stable with minimal variation; beyond 9%, the illite content decreases as porosity rises, while the kaolinite content increases (Figure 14 and Figure 15).
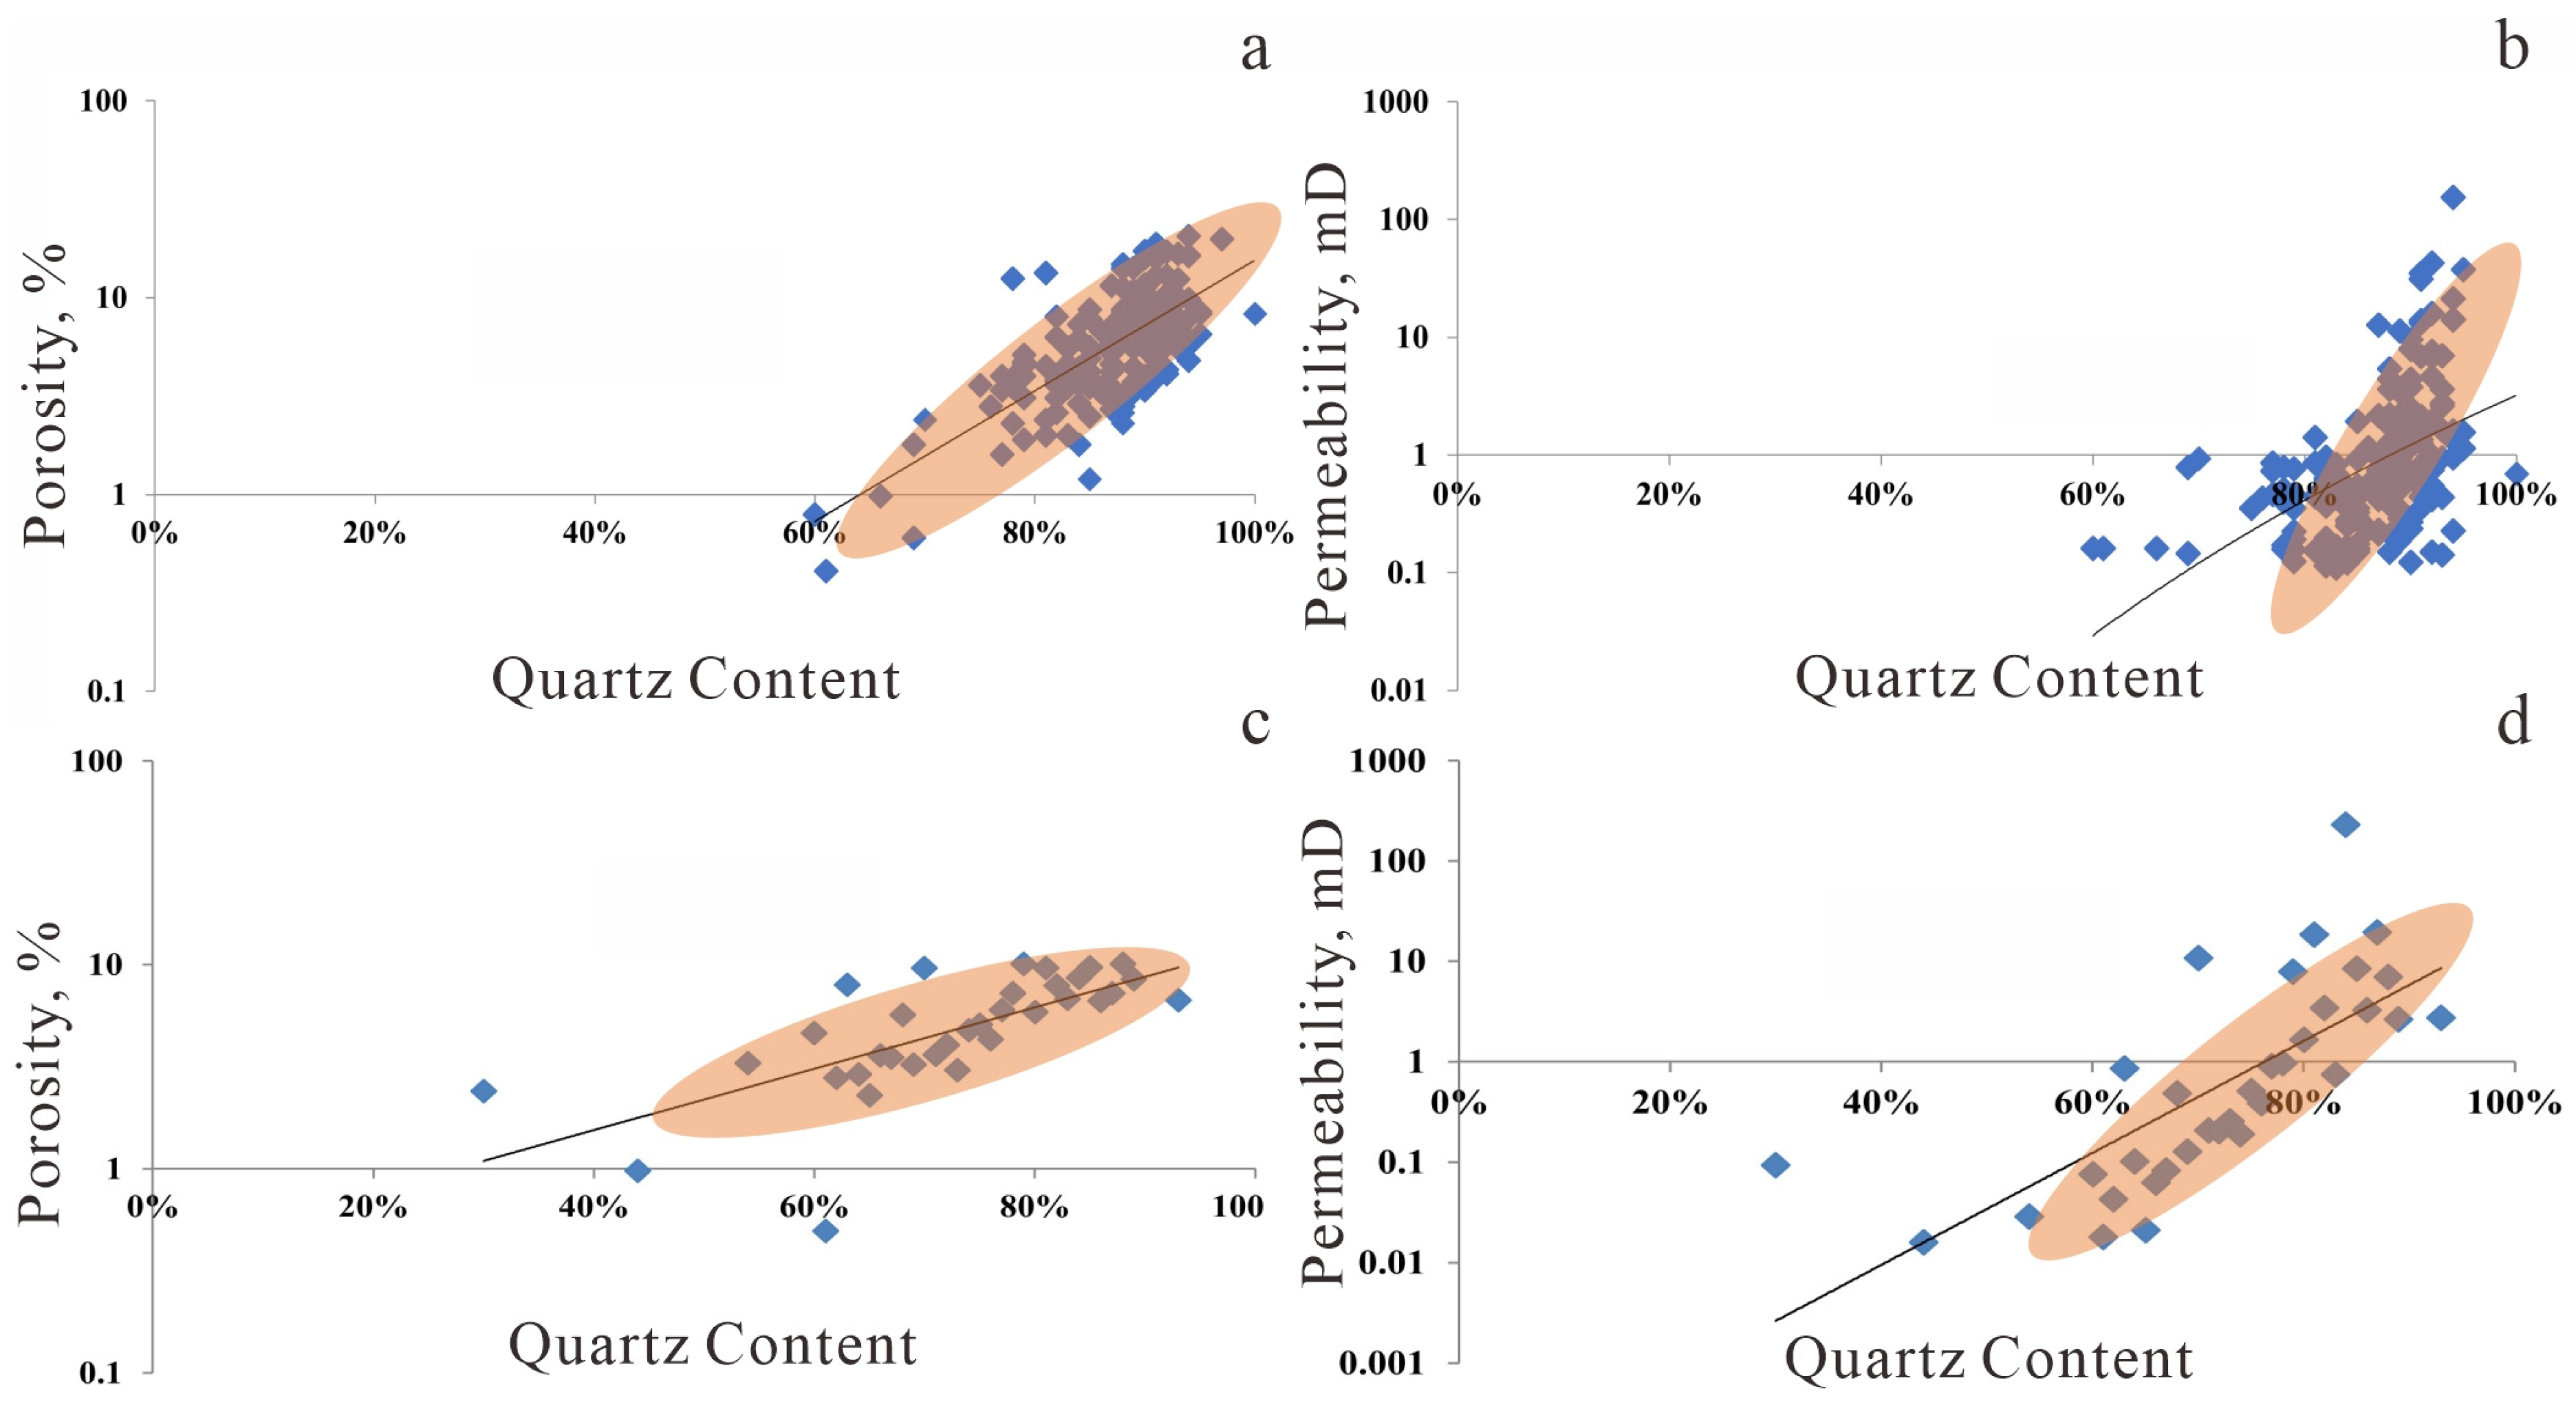
Analysis of the relationship between grain content and porosity/permeability indicates that the sandstone framework (quartz and feldspar) and the abundance of cement and matrix directly govern the reservoir’s original storage and flow properties, forming the material basis for diagenesis [15]. A higher framework content is correlated with improved petrophysical properties, specifically greater porosity and permeability, which enhances flow capacity (Figure 16).

3.2. Analysis of Reservoir Sensitivity and Injectivity Impedance Variation

3.2.1. Evaluation of Water/Salinity Sensitivity

Laboratory evaluation tests for water and salinity sensitivity were conducted on 38 core samples from 8 wells in the Ahe Formation, eastern Kuqa Depression. Selected experimental results are summarized in Table 1 and Table 2. The corresponding test response curves are presented in Figure 17 and Figure 18.
Laboratory assessments of water and salinity sensitivity were conducted on core samples from 8 wells in the Ahe Formation of the eastern Kuqa Depression. The results show a water sensitivity damage rate ranging from 32.06% to 97.20%, indicating an overall moderate to strong water sensitivity. The salinity sensitivity damage rate ranges from 31.21% to 92.94%, similarly classifying the reservoir as having an overall moderate to strong salinity sensitivity. For individual layers J1a1 and J1a2, water sensitivity is weaker in the east and stronger in the west, decreasing gradually from west to east. Conversely, the central part of the J1a4 layer exhibits stronger water sensitivity than the flanks of the block, displaying a strong to moderately strong classification (Figure 17). Vertically, taking well MN1 as an example, water sensitivity across the three layers is generally not strong and decreases gradually from top to bottom. In terms of salinity sensitivity, the J1a4 layer generally shows strong sensitivity, while the J1a1 layer also demonstrates relatively strong sensitivity (Figure 18).
The dominant clay minerals in the AHZ interval are illite, illite/smectite (I/S) mixed layer, and kaolinite. The I/S mixed layer is highly prone to hydration and swelling. Non-expansive clays like kaolinite and illite can disperse when exposed to water with low cation concentration or containing deflocculating ions, disrupting the original flocculation equilibrium. This causes clay particles to detach and migrate, resulting in permeability damage. Experimental results confirm moderate to strong water sensitivity in the study area.
Water-sensitive formations typically exhibit high porosity and permeability, facilitating aqueous phase flow but also making them highly susceptible to interactions with injected water [20]. During water flooding, significant injectivity impedance can occur as the injected water displaces in-situ hydrocarbons, creating water-trapped or isolated pore structures that increase flow resistance and hinder effective water penetration, adversely impacting injection efficiency.
In salt-sensitive formations, exposure to saline water alters the pore structure, reducing porosity and permeability and consequently increasing injectivity impedance [5]. Although saline water injection can modify formation properties to some extent, excessive injection may induce sediment alteration and precipitation, forming salt-saturated zones that further elevate flow resistance.
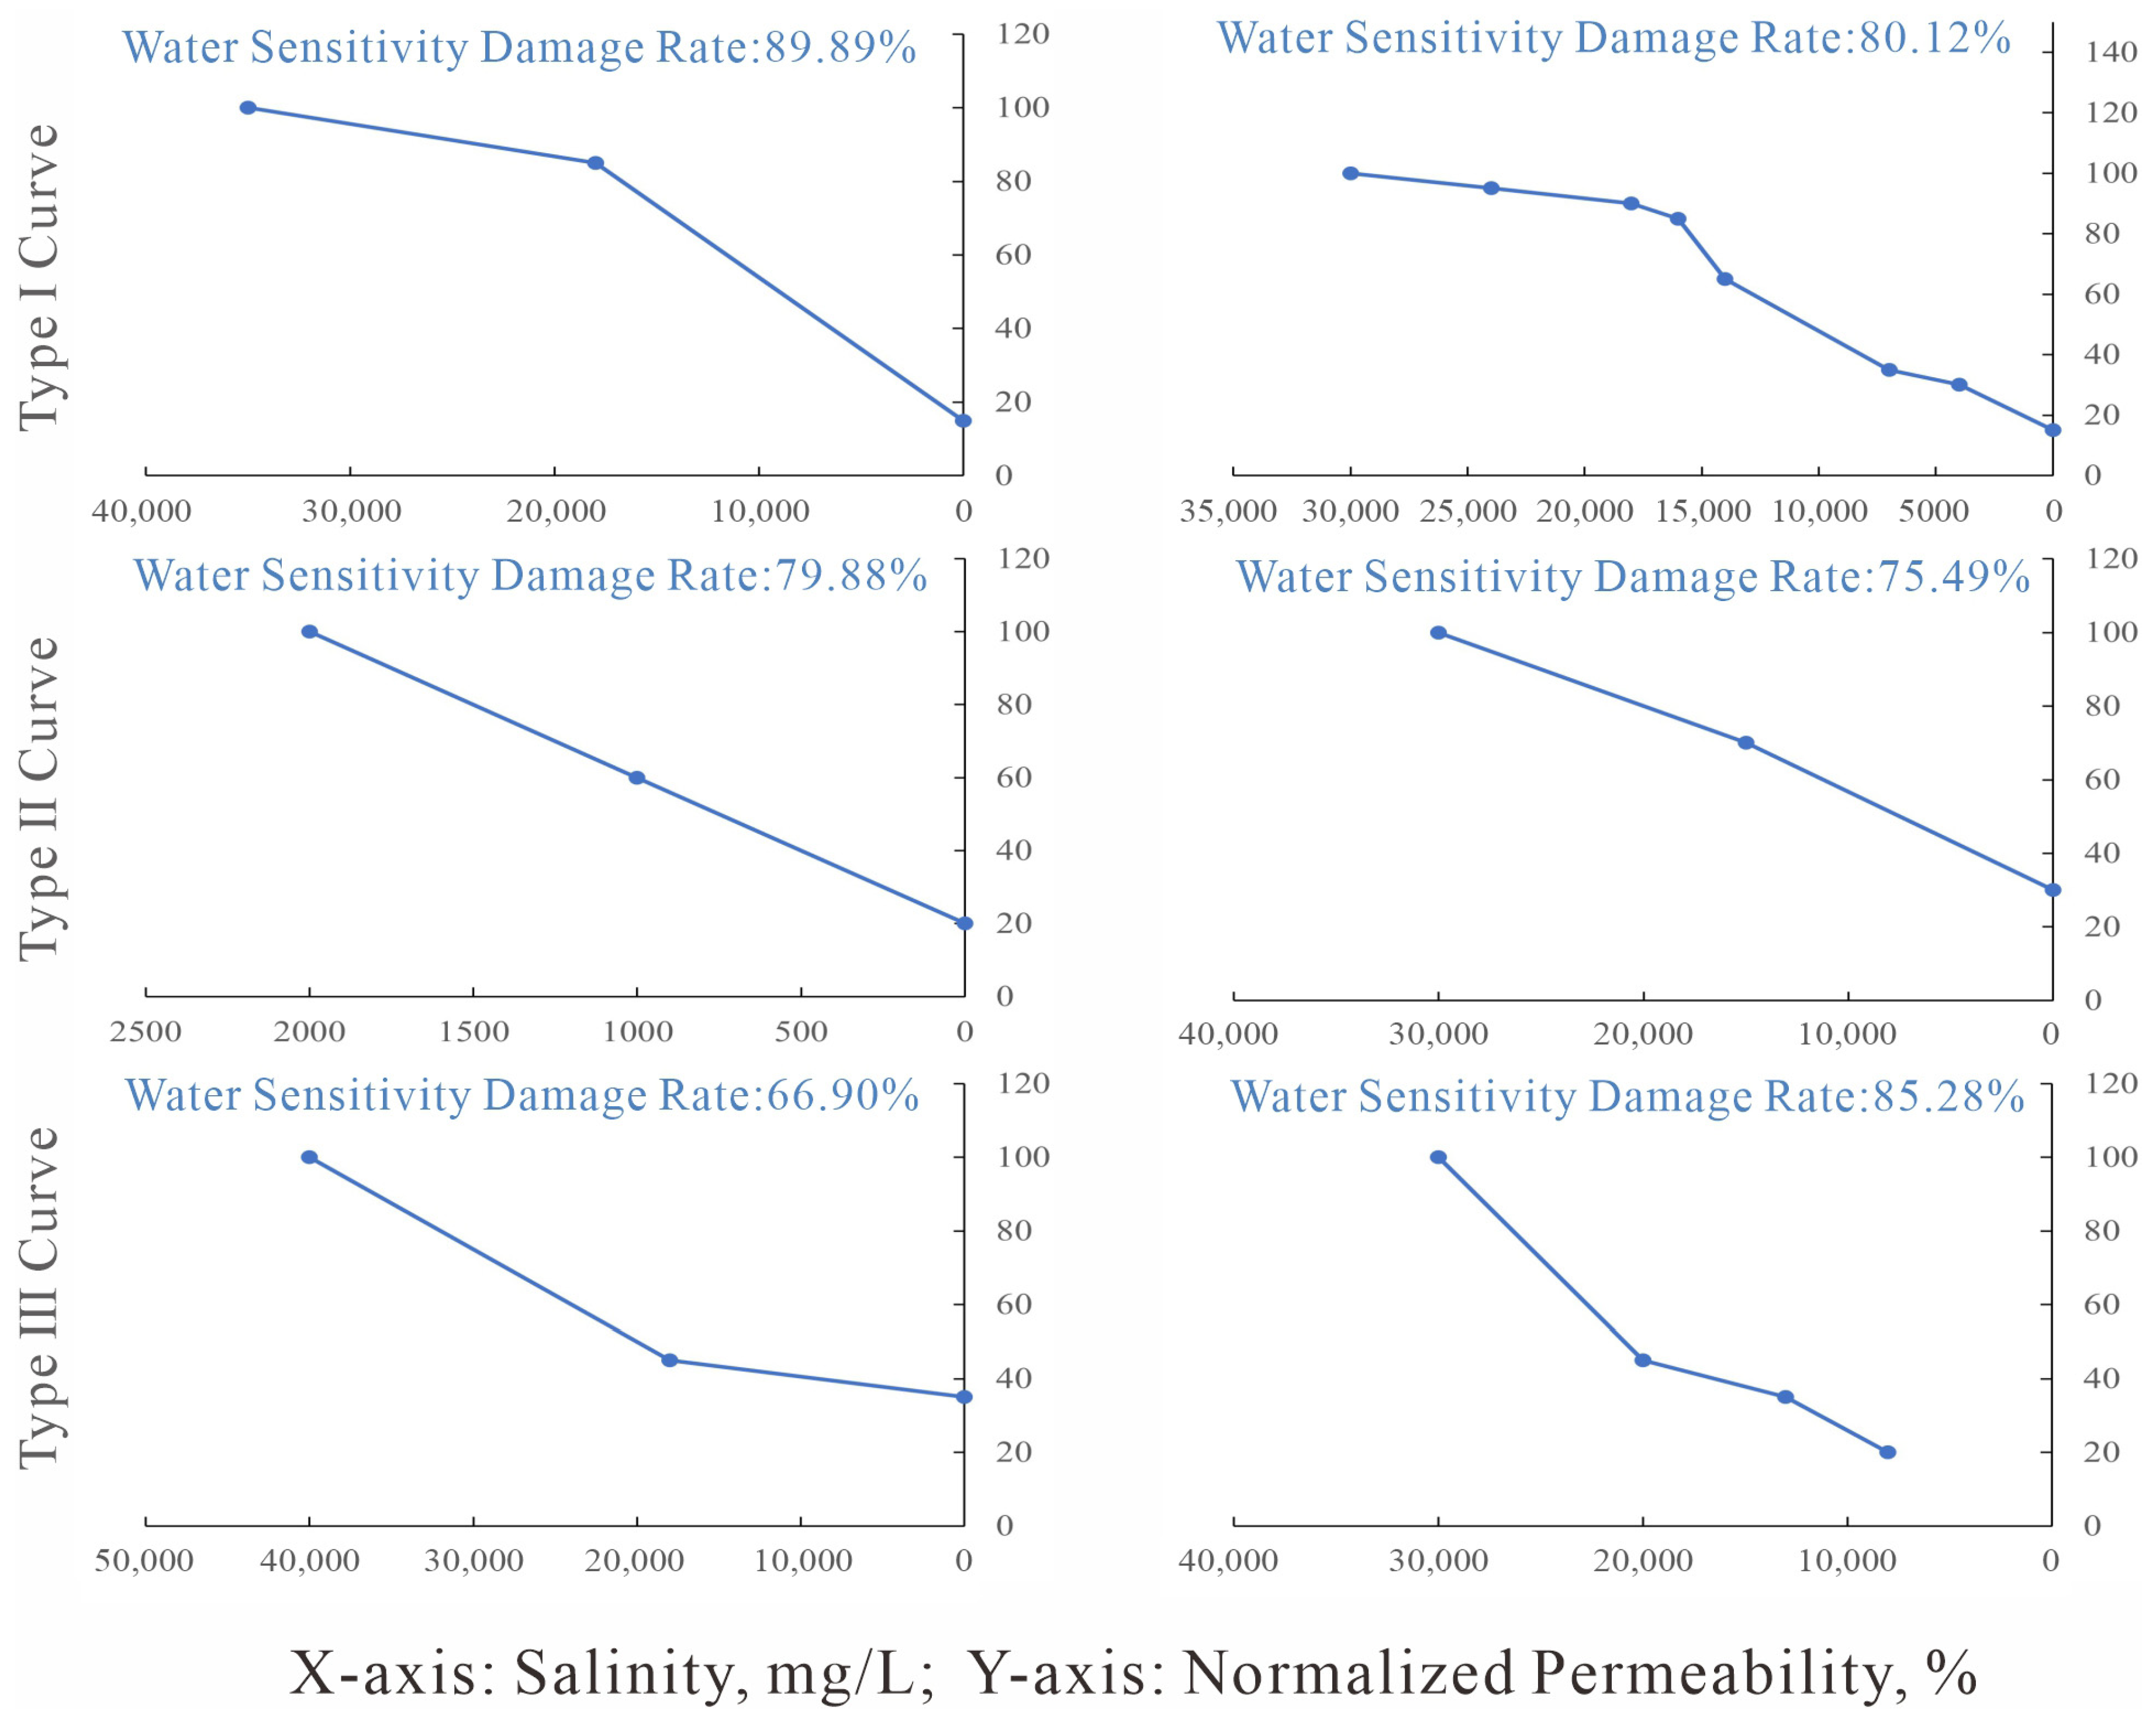
The microporosity content (M, percentage of pores <10 μm) influences the shape of water sensitivity curves [21] (Figure 19):
(1)
Type I Curve (0 < M < 30%): Permeability declines gradually at high salinity and rapidly at low salinity.
(2)
Type II Curve (30% < M < 70%): Permeability decreases steadily as salinity is reduced.
(3)
Type III Curve (M > 70%): Permeability declines rapidly at high salinity and slowly at low salinity.
Figure 19. Relationship between water sensitivity curve types and micropore content in different reservoir rocks.
Processes 13 03283 g019
Type I curves are characterized by an I/S mixed-layer content <20% and a combined illite/kaolinite content >70% (Table 3). The low I/S content results in weak swelling at high salinity, causing a gradual permeability decline. At low salinity, hydration of I/S and illite disintegrates surface films; the released fines and migrating kaolinite then plug pore throats, leading to a rapid permeability decrease (Figure 20 and Figure 21). Type II curves correspond to 20–45% I/S and 40–70% illite/kaolinite, while Type III curves are associated with >45% I/S and <40% illite/kaolinite.
CT scan in-situ comparisons reveal significant differences in water sensitivity effects among different pore types: During the injection of incompatible water, dissolution intergranular pores show no obvious signs of water sensitivity, and their porosity remains largely unchanged (Figure 22a). In contrast, micropores exhibit strong water-sensitive damage characteristics, with a significant reduction in porosity (Figure 22b).

3.2.2. Evaluation of Velocity Sensitivity

Laboratory evaluation tests for velocity sensitivity were conducted on 22 core samples from 8 wells in the Ahe Formation of the eastern Kuqa Depression. Selected experimental results are summarized in Table 4. The corresponding test response curves are presented in Figure 23.
Laboratory evaluation of velocity sensitivity was conducted on core samples from 8 wells in the Ahe Formation of the eastern Kuqa Depression. The velocity sensitivity damage rate ranges from 20.60% to 84.70%, with an average of 50.54%. The critical flow velocity ranges from a minimum of 1.020 m/d to a maximum of 10.425 m/d, averaging 3.239 m/d. Spatially, taking the J1a4 layer as an example, well YN4 exhibits relatively strong velocity sensitivity, while wells KZ1, YX1, YS4, TZ2, YN5, and MN1 show relatively weak sensitivity. The J1a2 layer demonstrates a fairly uniform distribution of weak to moderately weak velocity sensitivity from west to east. The sensitivity distribution in the J1a1 layer is also relatively balanced; however, with the exception of well YN4 which shows weaker sensitivity, other wells in this layer exhibit moderate to strong sensitivity. This anomaly at well YN4 is inferred to be due to more developed fractures and larger pore-throat radii in the J1a1 layer at this location, making it less susceptible to blockage by fine particle migration. Vertically, the degree of velocity sensitivity decreases from the J1a1 layer down to the J1a4 layer.
Taking well MN1 as an example, lower permeability corresponds to reduced flow capacity, making the grains more susceptible to migration under hydrodynamic pressure [7]. Furthermore, a relatively low increase in injection water velocity may initially cause a slight rise in permeability due to the flushing effect. However, over time and with further velocity increases, unconsolidated fine particles migrate and accumulate at pore throats, resulting in blockage and a consequent permeability decrease. As shown in Figure 23, this process is marked by an initial increase in permeability followed by a distinct decline.
In the study area, illite and kaolinite are relatively abundant. Illite occurs predominantly in a platy morphology, with minor filamentous occurrences. Under high flow velocities, these minerals are highly susceptible to fragmentation, and the resulting fine particles migrate and plug pore throats, leading to permeability reduction [22].
Kaolinite primarily occurs as book-like and vermicular aggregates within intergranular pores. Under high-velocity fluid shear, these aggregates are prone to fragmentation. The liberated particles migrate and plug pore throats, causing a significant permeability decrease, which suggests a high potential for strong velocity sensitivity in the region. Laboratory results confirm a moderate to strong degree of velocity sensitivity.
Fine migration also enhances reservoir permeability heterogeneity, which reduces sweep efficiency and increases injectivity impedance during water flooding. Typically, formations with higher velocity sensitivity are more significantly affected by water injection and exhibit faster fluid flow rates [17]. This is because they tend to have greater porosity, fewer rigid rock components, and better permeability, resulting in more effective water flooding. In contrast, formations with lower velocity sensitivity often possess smaller porosity, a higher content of rock constituents, and poorer flow capacity, which undermines water injection effectiveness and leads to higher impedance.

3.2.3. Evaluation of Acid Sensitivity

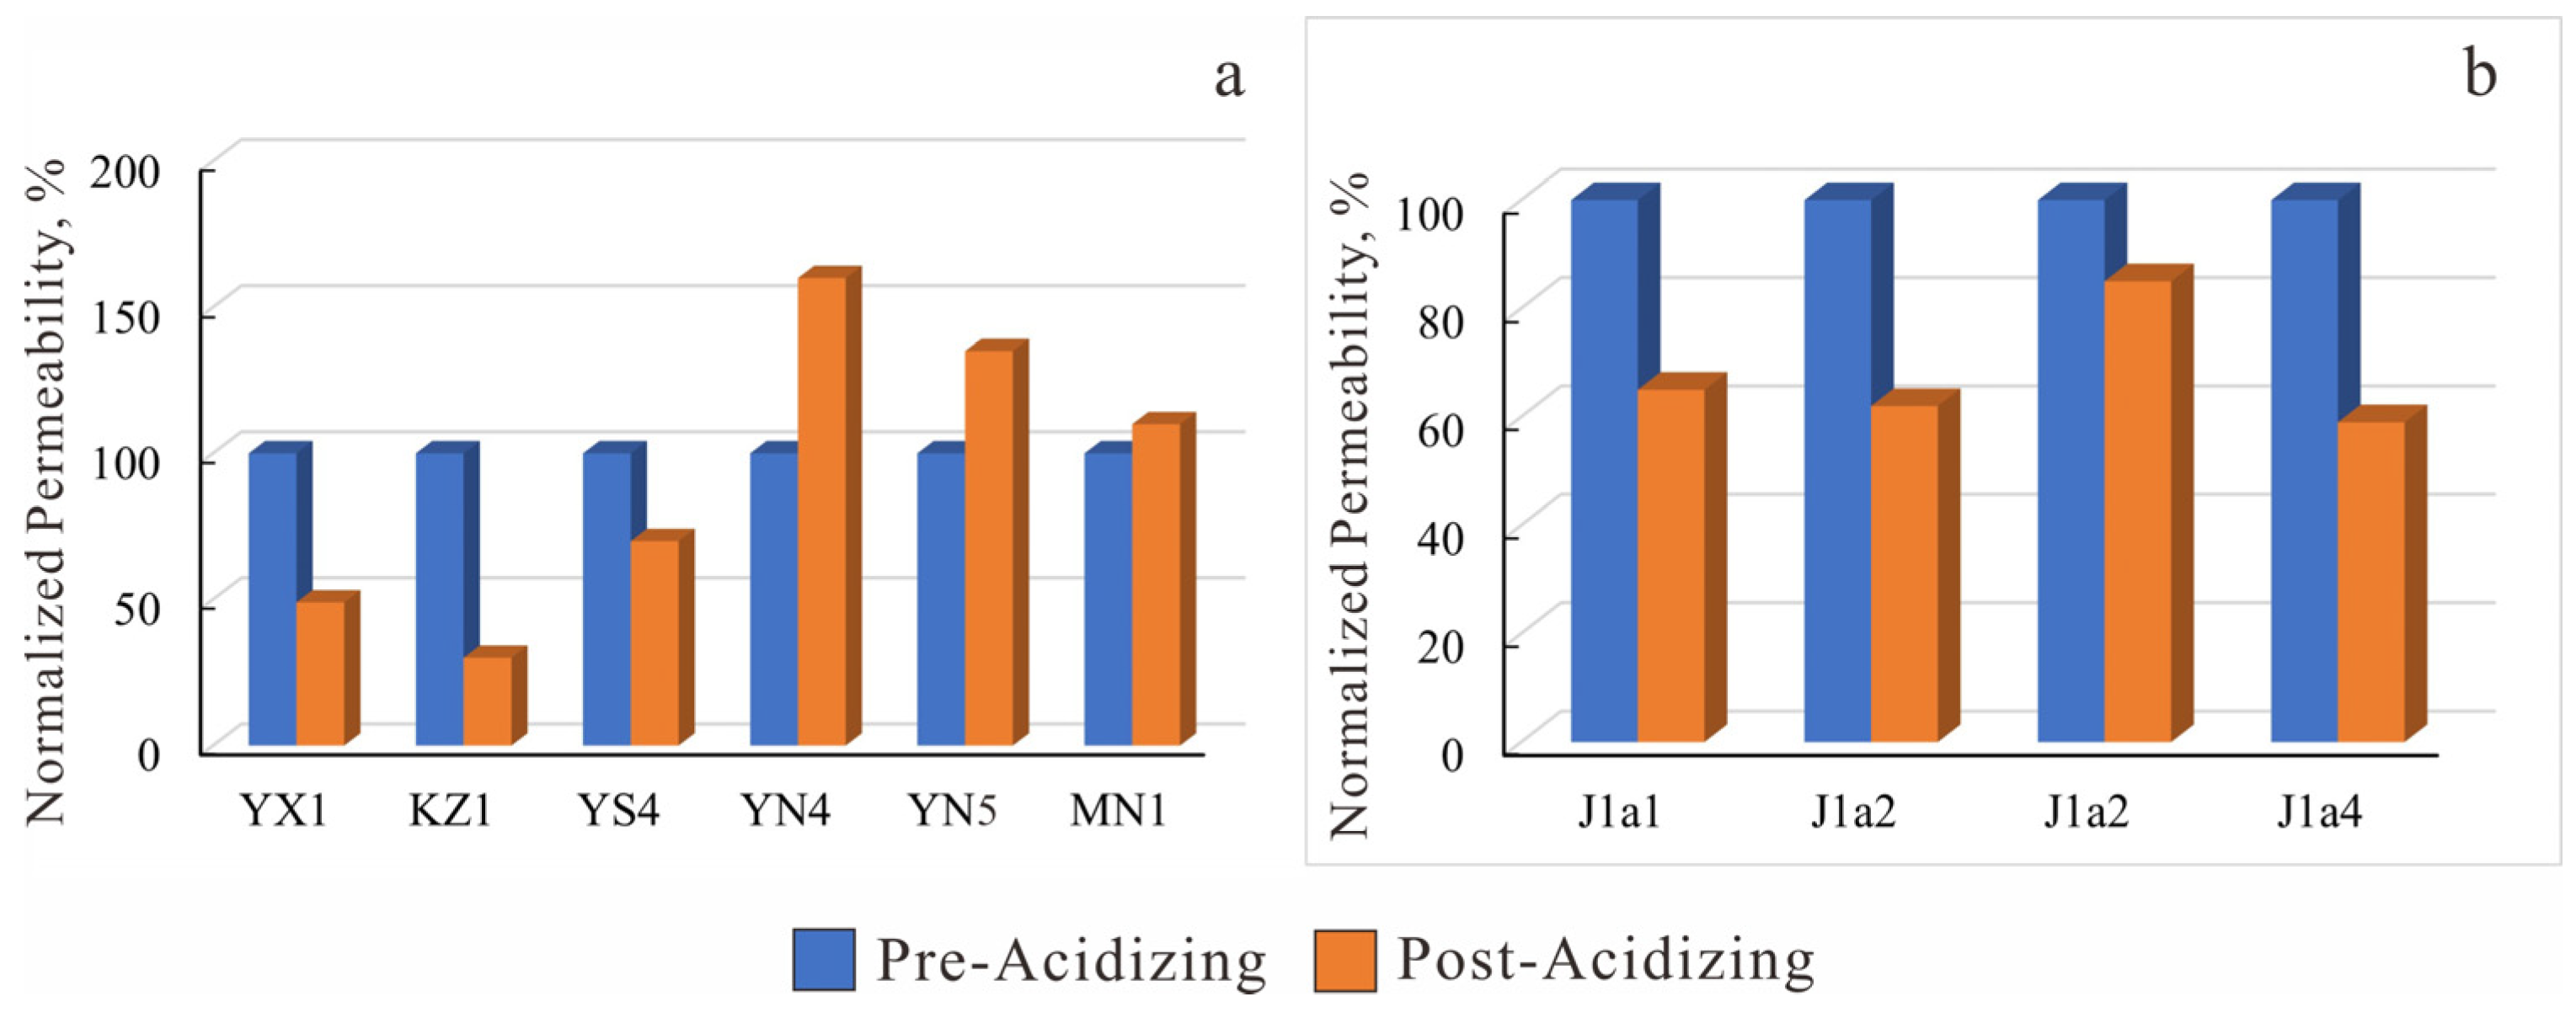
Laboratory evaluation tests for acid sensitivity were conducted on 19 core samples from 8 wells in the Ahe Formation of the eastern Kuqa Depression. Selected experimental results are summarized in Table 5. The corresponding test histogram is presented in Figure 24.
Laboratory evaluation of acid sensitivity was conducted on core samples from 8 wells in the Ahe Formation of the eastern Kuqa Depression. The acid sensitivity damage rate ranges from 9.78% to 69.10%, indicating an overall moderate to weak acid sensitivity. Spatially, a decreasing trend in acid sensitivity is observed from west to east. In the J1a4 layer, well KZ1 in the west exhibits the highest degree of acid sensitivity, while other wells show relatively weak sensitivity. The J1a1 layer also demonstrates a similar weakening trend from west to east. Vertically, well YS4 exhibits a decreasing trend in sensitivity from top to bottom. At well YN5, the acid sensitivity of the J1a1 and J1a4 layers shows little difference, both being relatively weak. In some wells, permeability increased after acid injection, likely due to effective mineral dissolution that enlarged pore throats. The limited precipitates formed were flushed out without causing blockage, thus enhancing permeability [19].
The damage mechanism involves chlorite. During acidizing, Fe2+ and Al3+ ions are released into the formation water through ion exchange. Under oxidizing conditions, Fe2+ is oxidized to Fe3+, leading to the precipitation of Fe(OH)3 and Al(OH)3, which plug pore throats and reduce permeability. As indicated in Table 5, the higher chlorite content in wells KZ1, YN4, and MN1 explains their relatively strong acid sensitivity.
During water injection, acidic fluids can enhance pore connectivity and reduce injectivity impedance by dissolving minerals and enlarging pore spaces, improving water penetration. They may also promote mineral dissolution and recrystallization, developing new pore structures. However, excessive acidification can cause adverse effects, such as increased heterogeneity, rapid dissolution leading to instability, and generation of insoluble precipitates (e.g., silica or fluorite) that plug pores and increase flow resistance.

3.2.4. Evaluation of Alkali Sensitivity

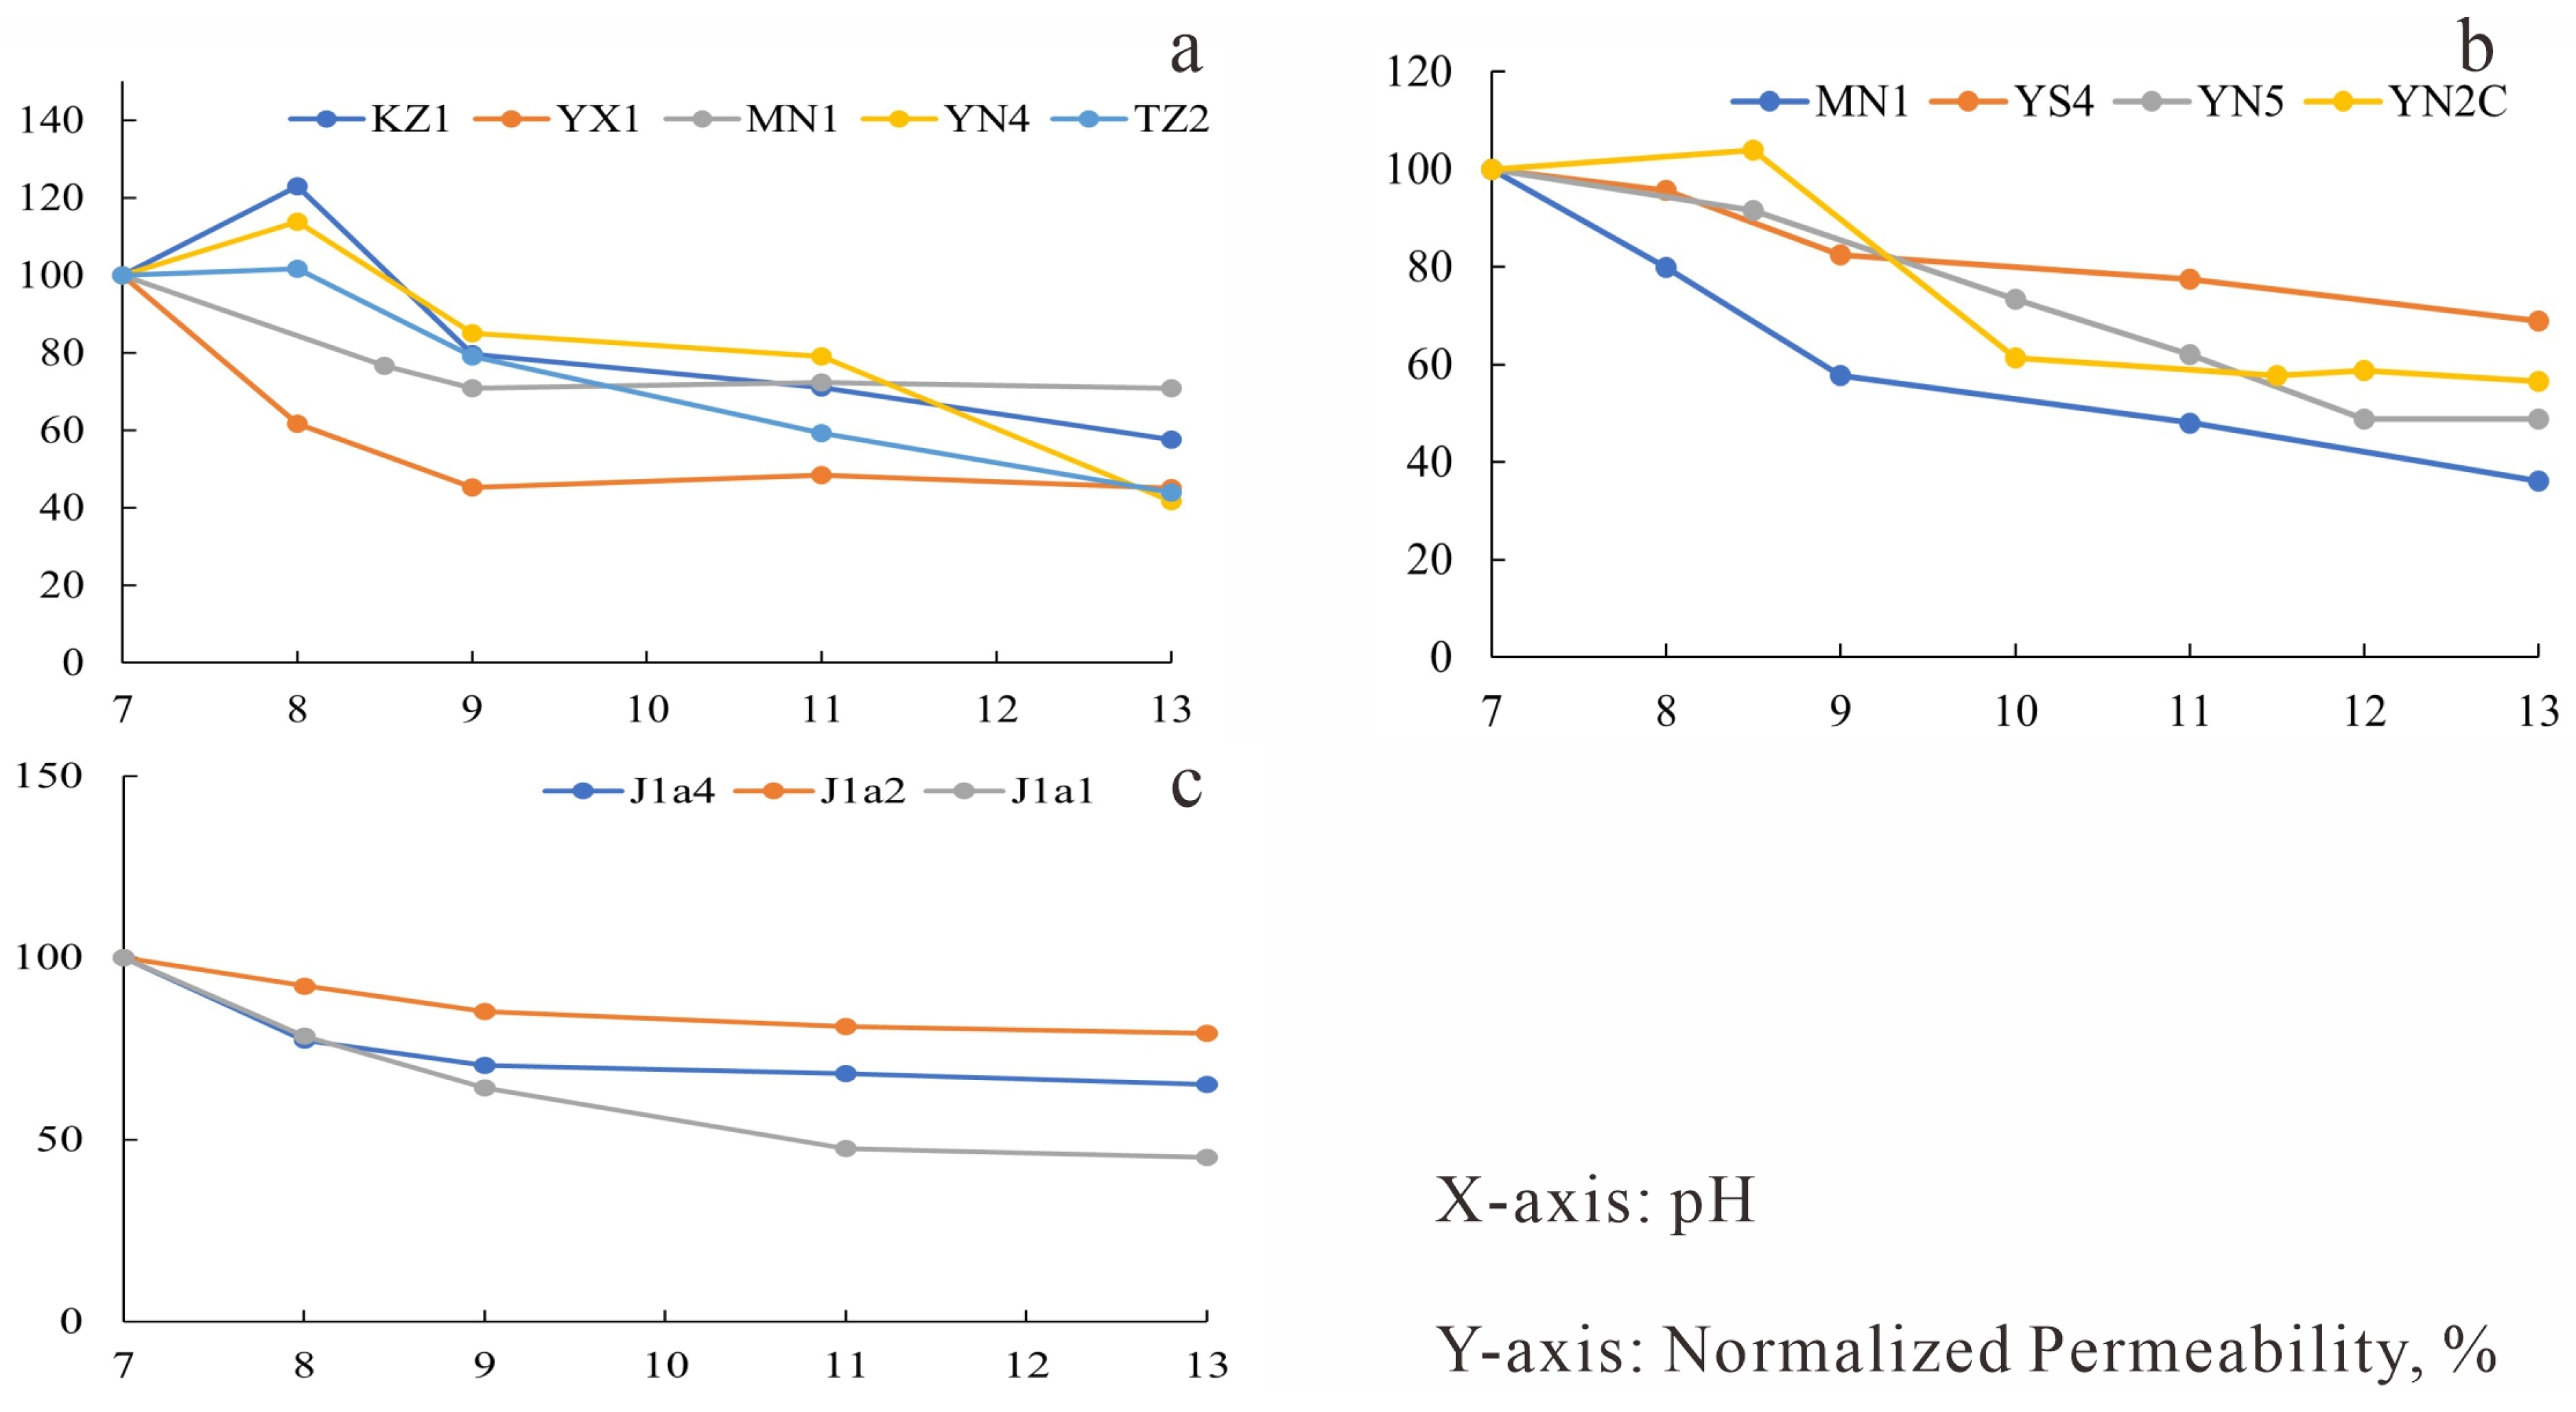
Laboratory evaluation tests for alkali sensitivity were conducted on 20 core samples from 8 wells in the Ahe Formation of the eastern Kuqa Depression. Selected experimental results are summarized in Table 6. The corresponding test curves are presented in Figure 25.
The reservoir overall exhibits moderate to strong alkali sensitivity. Spatially, taking the J1a4 layer as an example, no clear spatial trend is observed. Vertically, based on well MN1, the degree of alkali sensitivity in the J1a1 sublayer is higher than that in the underlying J1a4 sublayer. However, an anomalous increase in sensitivity is observed in the J1a2 sublayer. This anomaly is inferred to result from reactions between the alkaline fluid and minerals (e.g., dolomite), generating fine particles that migrate and accumulate in narrow pore throats, thereby affecting permeability.
The Ahe Formation contains kaolinite as a major clay mineral. Strongly alkaline fluids can dissolve certain components within kaolinite, generating colloidal or precipitated phases. In low-permeability samples, the small pore-throat radii make them highly susceptible to throat plugging by these precipitates, resulting in strong sensitivity, as observed in wells YX1 and KZ1. In contrast, samples with relatively higher permeability possess larger pore-throat radii, where limited precipitation is insufficient to cause significant blockage, leading to weaker sensitivity. For wells MN1 and YN4, although the alkaline fluid induced substantial changes in core permeability, the alterations were predominantly favorable.
During water injection, the use of alkaline agents may influence formation permeability and injectivity impedance [5]. Alkaline substances can alter the chemical properties of formation minerals, promoting dissolution and recrystallization to enhance pore connectivity, improve permeability, and reduce injectivity resistance. Particularly in carbonate-rich formations, alkaline fluids can dissolve minerals such as calcite or dolomite, enlarging pores and creating dissolution vugs, thereby facilitating deeper water penetration. On the other hand, excessive use of alkaline agents may lead to adverse effects, such as increased heterogeneity and excessively rapid mineral dissolution, consequently elevating formation instability and injectivity impedance [23]. Furthermore, alkaline substances can react with certain minerals to generate water-insoluble precipitates, which plug pore throats and increase flow resistance.

3.2.5. Evaluation of Stress Sensitivity

Laboratory evaluation tests for stress sensitivity were conducted on 11 core samples from 8 wells in the Ahe Formation of the eastern Kuqa Depression. Selected experimental results are summarized in Table 7. The corresponding test curves are presented in Figure 26.
The study area overall exhibits strong stress sensitivity. Spatially, the entire J1a1 layer demonstrates relatively high stress sensitivity. In the J1a4 sublayer, a general weakening trend is observed from east to west, although the sensitivity remains strong across most of the area except for well YN4, which shows the lowest stress sensitivity. This anomaly is attributed to two main reasons: Under stress, kaolinite breaks into fine particles that migrate and block pore throats, reducing permeability. Well YN4 contains the least kaolinite and is therefore less affected. Additionally, YN4 has fewer fracture-related pores, so throat breakage under stress produces fewer fines, resulting in a smaller impact on permeability.
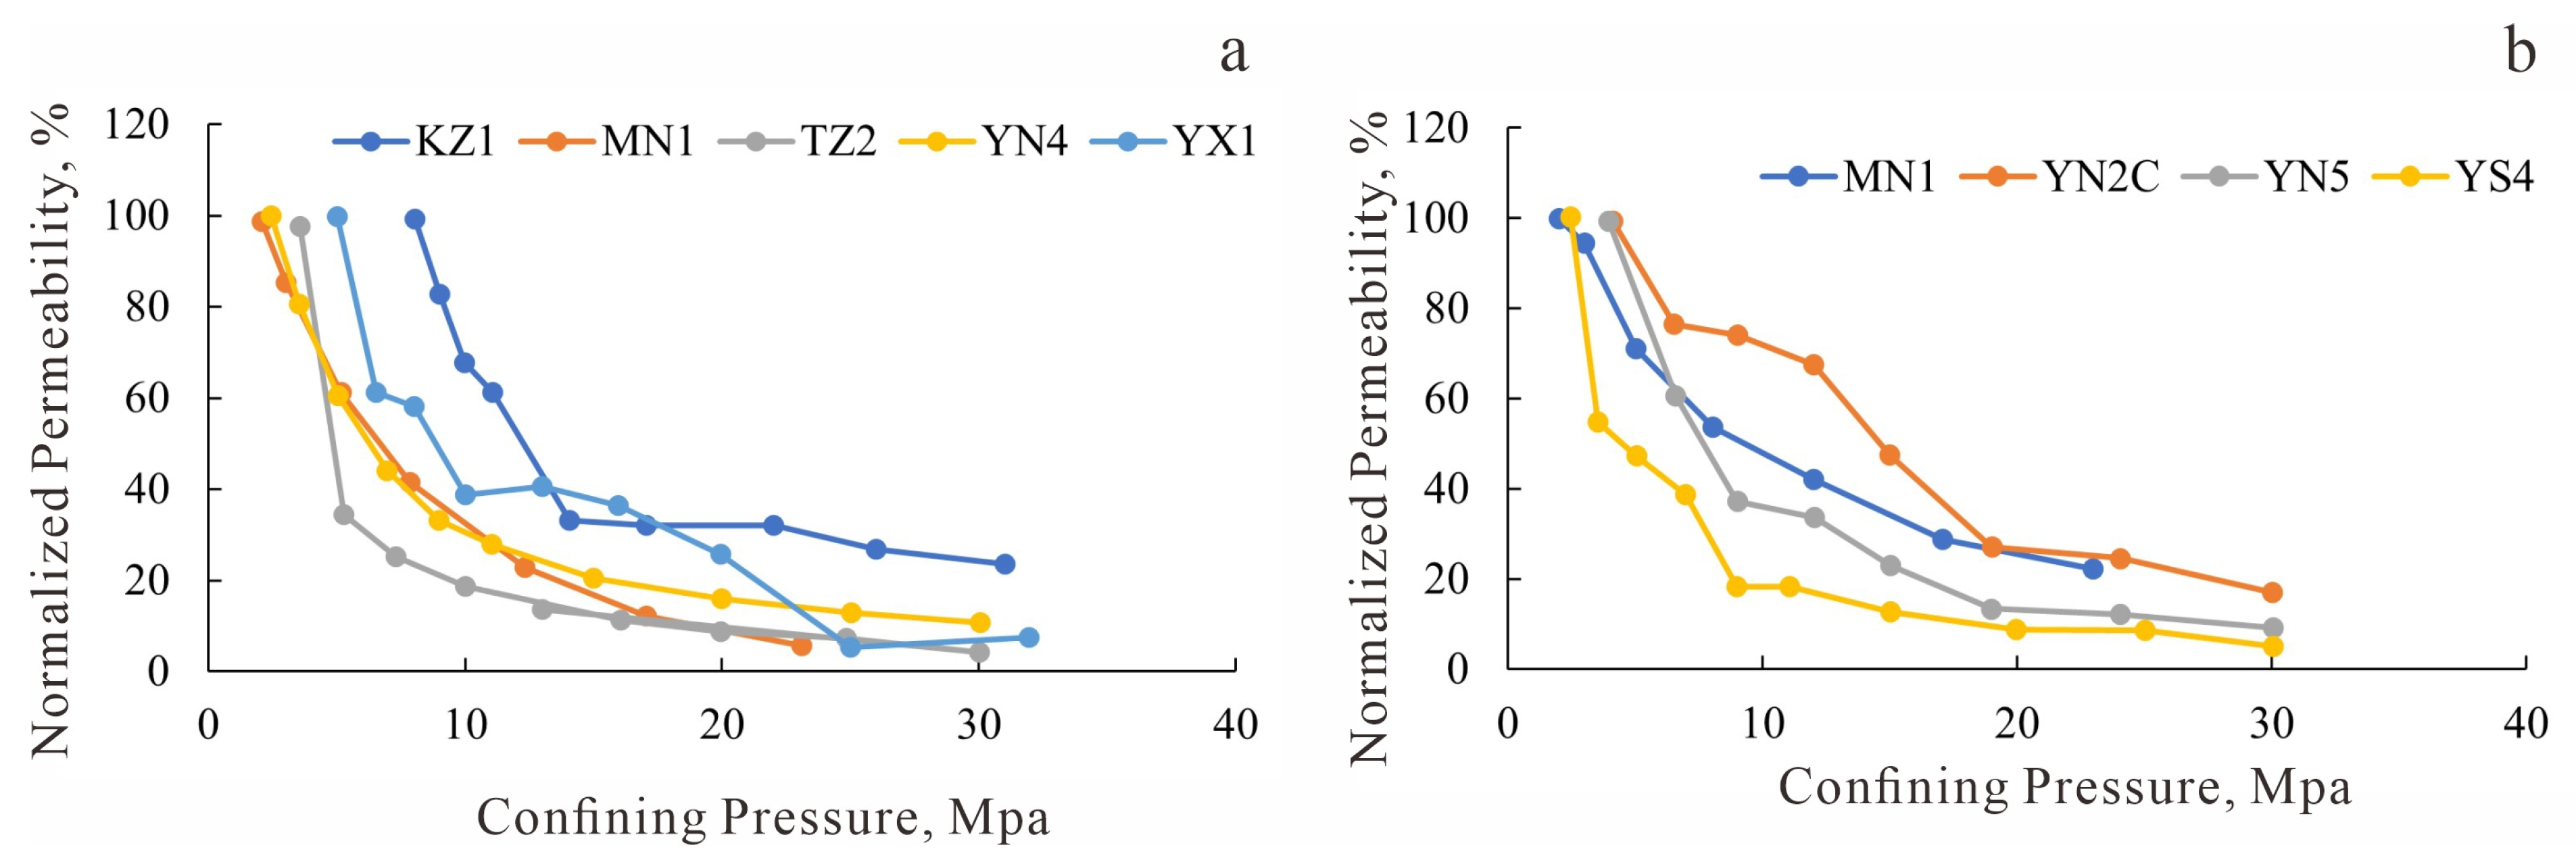
The maximum confining pressure applied was 32 MPa. The results show that as confining pressure increases, core permeability decreases, and the damage rate rises accordingly. Within the experimental range, the reservoir is characterized by low porosity and low permeability. An inverse relationship exists between initial permeability and stress sensitivity damage i.e., lower permeability cores exhibit stronger sensitivity. Therefore, the study area demonstrates strong stress-sensitive behavior.
Under high-stress conditions, formation rocks undergo compaction, reducing porosity and permeability and increasing injectivity impedance [24]. Conversely, low stress causes rock dilation, increasing porosity and permeability and reducing impedance. Thus, stress sensitivity directly influences permeability, which in turn affects injectivity impedance. Stress sensitivity also alters the formation’s physical properties: high stress can harden rocks, increasing flow resistance, while low stress may make rocks more fragile, reducing impedance. Therefore, stress sensitivity affects both the hydraulic and mechanical behavior of the rock, subsequently influencing injectivity performance.

4. Discussion

4.1. Quantitative Evaluation of Injectivity Impedance in Reservoirs with Different Sensitivity Types

The evaluation of reservoir sensitivity is typically based on a suite of parameters encompassing geological, geophysical, and rock mechanics properties, such as porosity, permeability, and in-situ stress state [22]. Critically, these parameters are influenced by the reservoir’s mineral composition. This composition fundamentally determines key petrophysical properties like pore-throat structure, porosity, permeability, and specific surface area, thereby governing the rock’s flow capacity and mechanical behavior. It follows that mineral composition ultimately controls formation permeability and injectivity impedance during water injection. The data and analytical results presented above unequivocally demonstrate that the content and type of minerals significantly impact injectivity impedance. Thus, a quantitative relationship between mineral content and displacement pressure can be established, offering a direct means to evaluate the correlation between reservoir sensitivity and injectivity impedance.

4.1.1. Single-Factor Fitting Results of Mineral Composition Content and Water Injection Resistance in Different Sensitivity Reservoirs

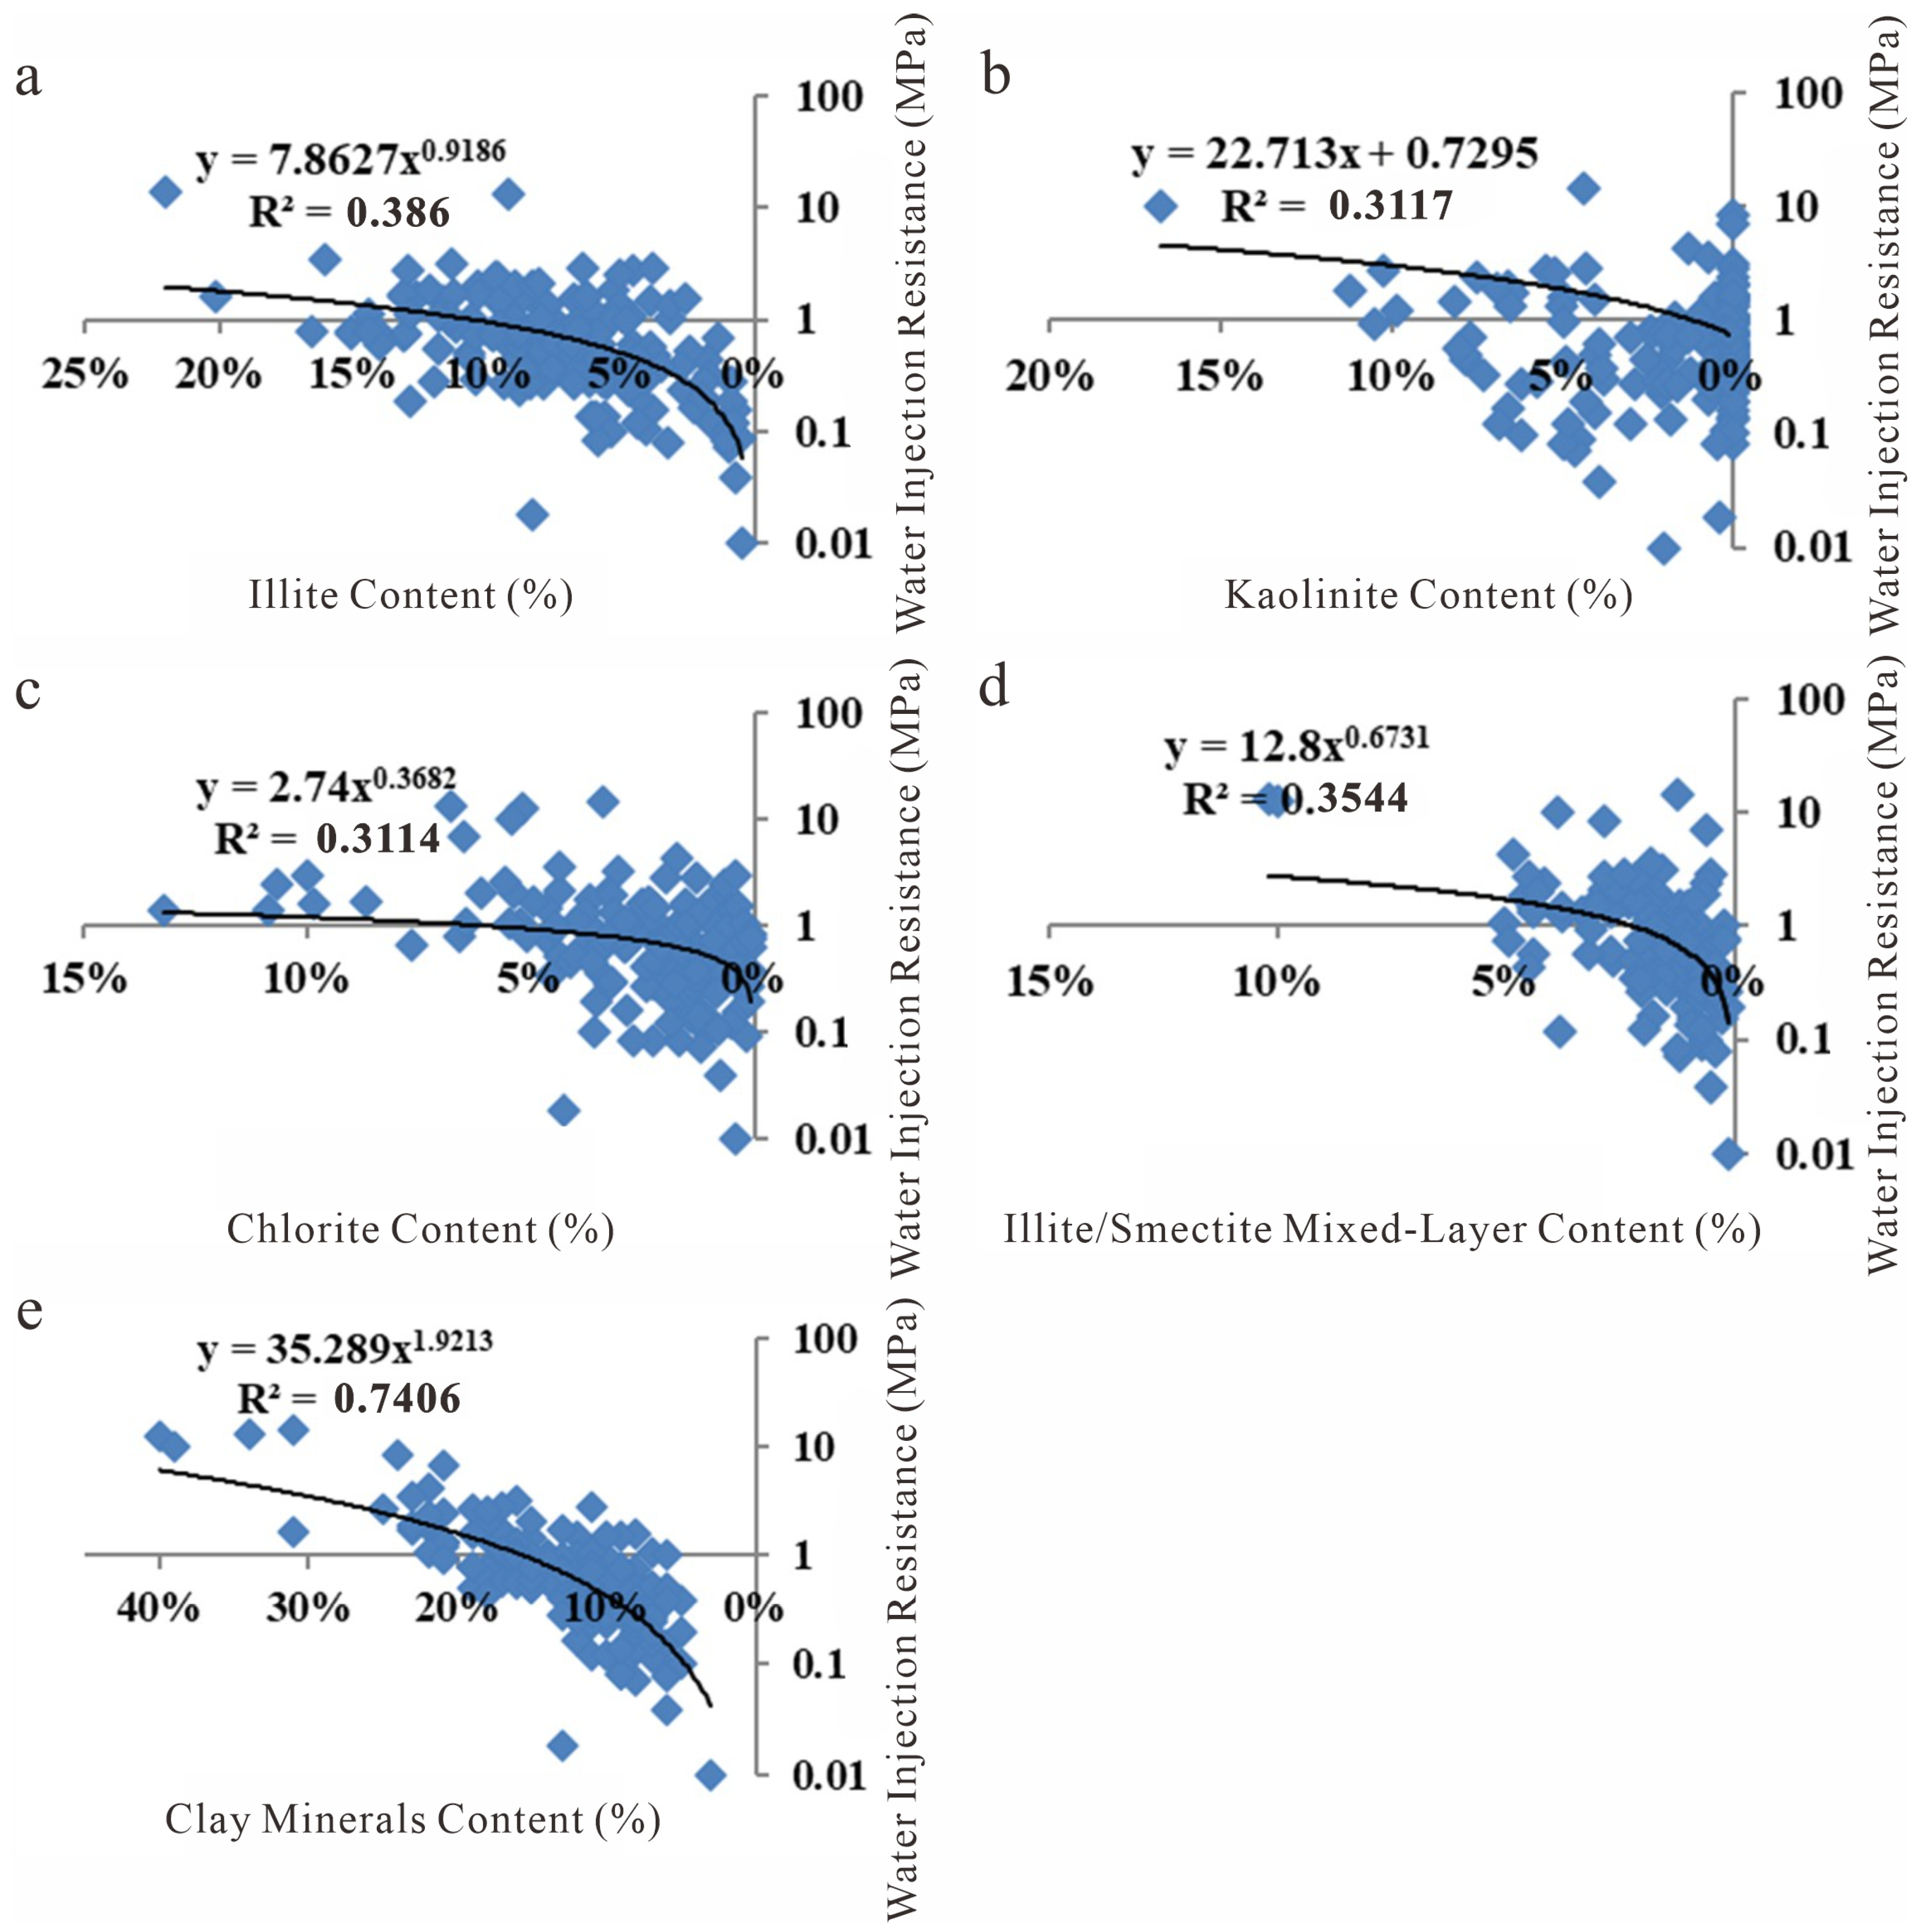
Based on the obtained data, individual analyses and fitting were performed to examine the relationships between the content of each clay mineral (as well as total clay content) and water injection resistance. The results are shown in Figure 27.
By analyzing the distribution patterns within the dataset, it was observed that the data range follows an exponential distribution. Optimal fitting was performed for each data relationship, yielding the following Equations (11)–(15):
Relationship Between Clay Mineral content and Injectivity Impedance:
P = 35.289 × ω 1.9213
Relationship Between Illite content and Injectivity Impedance:
P = 7.8627 × ω 0.9186
Relationship Between Kaolinite content and Injectivity Impedance:
P = 22.71113 × ω + 0.7295
Relationship Between Chlorite content and Injectivity Impedance:
P = 2.74 × ω 0.3682
Relationship Between Illite/Smectite (I/S) mixed-layer content and Injectivity Impedance:
P = 12.8 × ω 0.6731
Based on the established quantitative relationship between mineral content and water injection resistance, the actual mineral composition data from low-permeability reservoirs can be used to predict injection resistance, thereby optimizing waterflooding strategies, selecting appropriate development approaches, or improving reservoir physical properties. However, the correlation coefficients of the aforementioned fitting results indicate that the relationship between individual clay mineral content and injection resistance is not highly significant. Therefore, a multiple linear regression method is introduced to integrate all relevant factors, enabling the development of a high-precision mathematical model for prediction.

4.1.2. Fitting Results Between Mineral Content and Water Injection Resistance in Sensitivity-Prone Reservoirs

As shown in Table 8, the stepwise regression process demonstrates a gradual increase in both the correlation coefficient (R) and the coefficient of determination (R2), indicating a strengthening influence of the independent variables. The standard error remains relatively small. Generally, a higher R2 value reflects a greater proportion of shared variance between the dependent and independent variables, signifying an improved model fit. The R2 values in the table all exceed 0.8, indicating a high degree of consistency between the model and the data. Additionally, the Durbin–Watson statistic for the equations is approximately 2, suggesting no autocorrelation in the residuals and independence between samples. This typically implies that the model is well-fitted, as it does not omit significant variables and satisfies the underlying statistical assumptions.
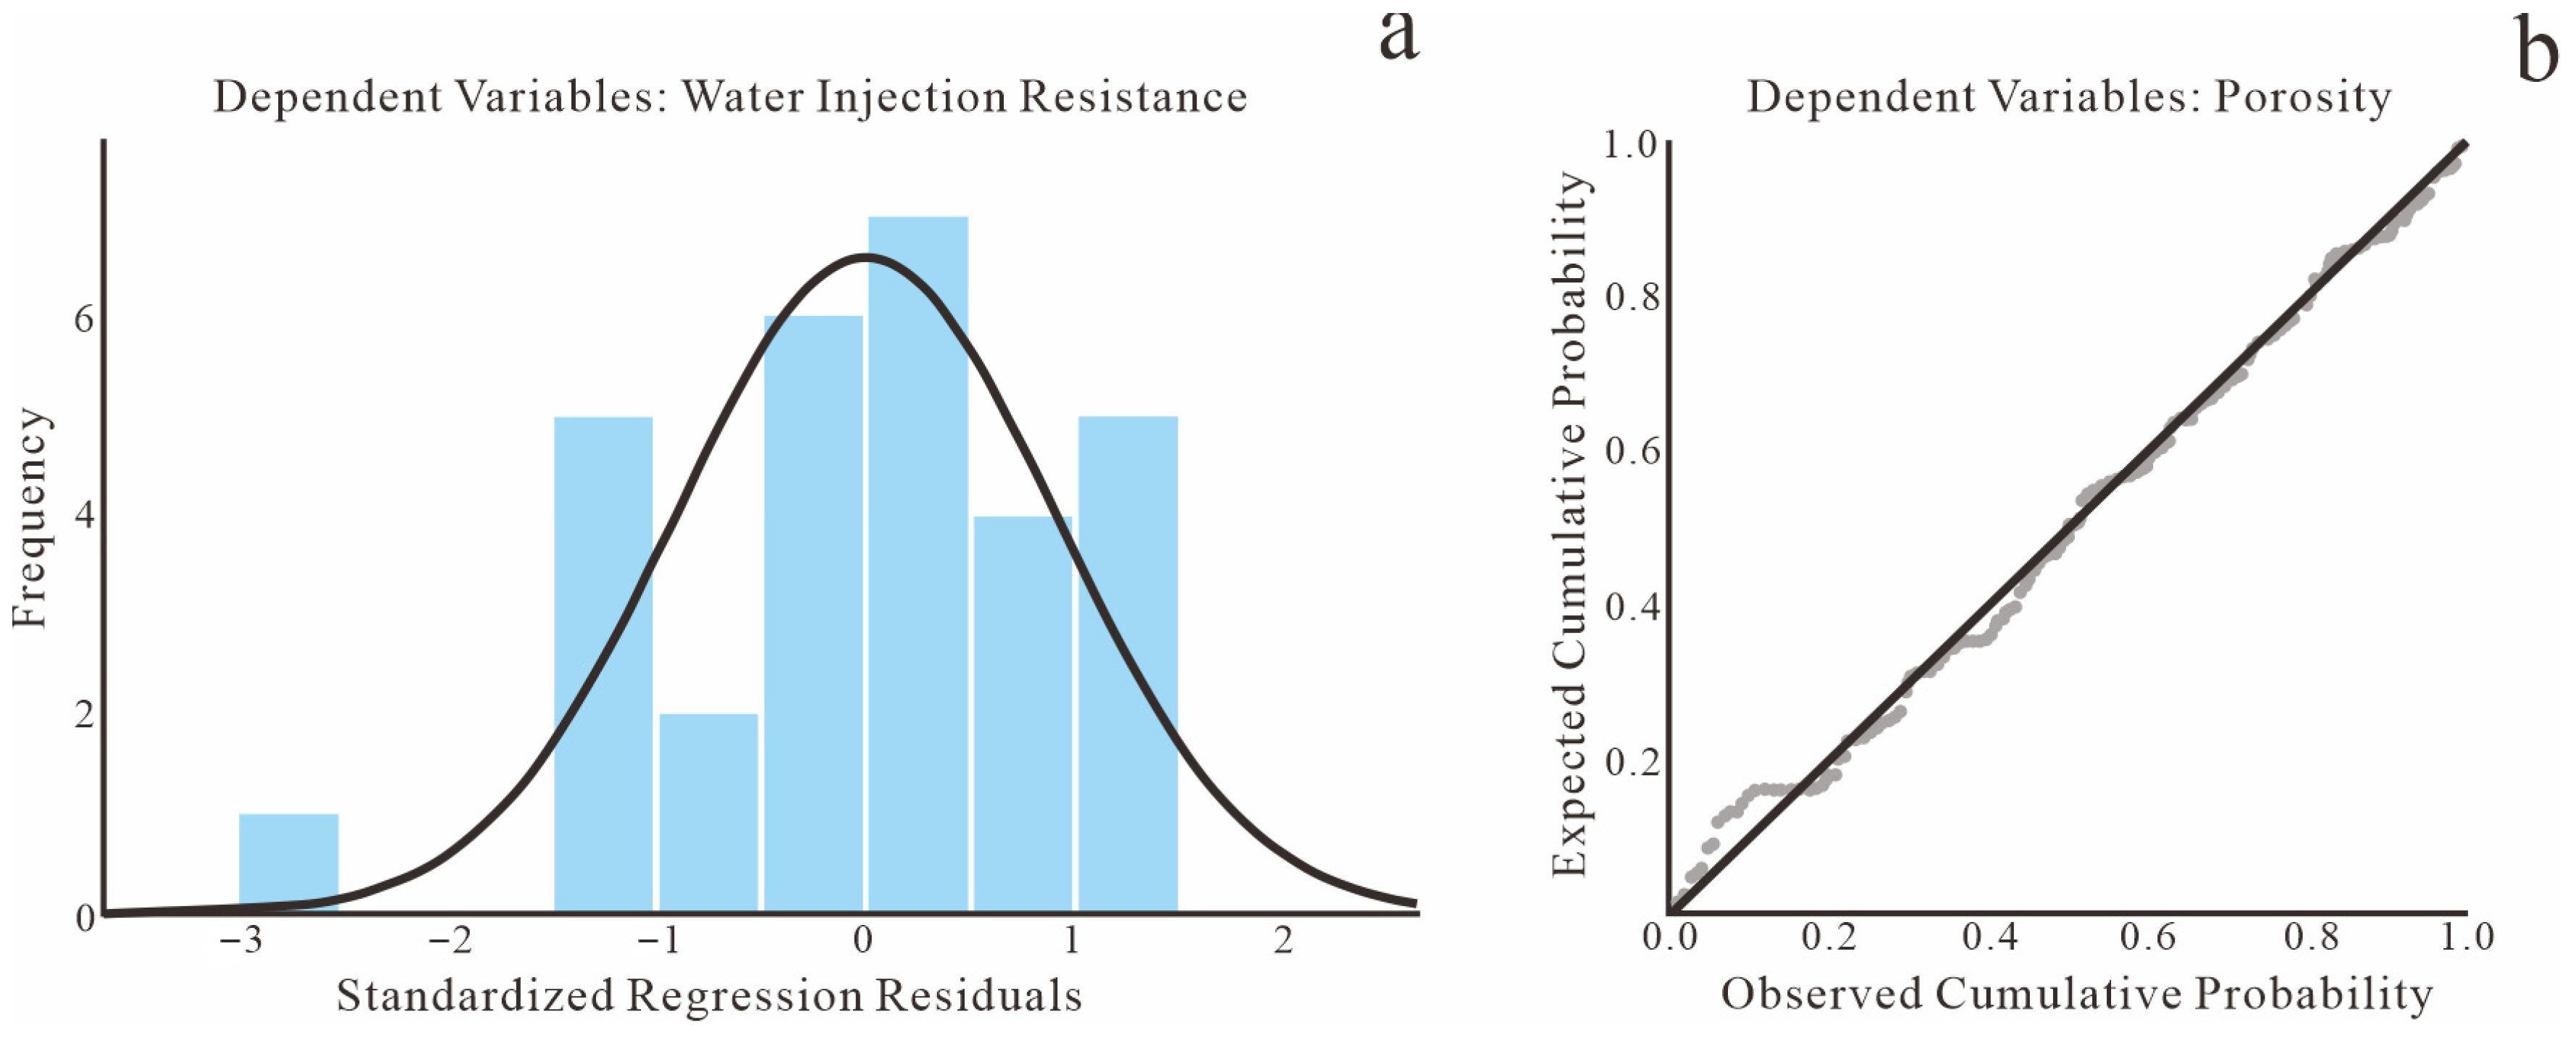
On the other hand, residuals serve as a critical criterion for assessing the reasonableness of model fitting. They represent the differences between observed values and model-predicted values. Whether residuals follow a normal distribution is a key assumption, as one of the theoretical foundations of linear regression analysis is that residuals should be randomly drawn from a normal distribution. A residual plot displays residuals fluctuating randomly around the horizontal line (predicted values) without exhibiting systematic patterns. As shown in Figure 28, the histogram of standardized residuals and the Normal P-P Plot indicate that: In subplot (b), each point represents the position of the actual observed residual value relative to the theoretically expected normal distribution residual value. The points align closely along the diagonal line and are evenly distributed on both sides. In subplot (a), the histogram clearly demonstrates a trend of normally distributed residuals. These observations collectively indicate that the residuals conform to a normal distribution. Normally distributed residuals imply that the error terms of the model are random, which helps ensure the validity and reliability of the regression model.
Table 9 and Table 10 present the final output of the multiple linear regression model, along with the results of the F-test used to validate the linear equation constructed for the variables. The tables show that the regression variance in the model is significantly greater than the residual variance. The significance level (p-value) is 0, which is far below the threshold of 0.05. This indicates that the linear relationship between the explained variable (dependent variable) and the explanatory variables (independent variables) is statistically significant, demonstrating the rationality of constructing the linear regression model.
As shown in Table 10, the regression coefficients and significance test results for the five explanatory variables are presented. The probability values (p-values) of the regression coefficient significance tests are all less than the significance level of 0.05, indicating a highly significant linear relationship with the explained variable. Therefore, it is reasonable to retain these variables in the model. Based on the output, the multiple linear regression equation for water injection resistance (P) under different clay mineral contents and compositions can be expressed as:
P = 0.015 Z R T + 0.003 Z R 1 + 0.006 Z R 2 + 0.004 Z R 3 + 0.001 Z R 4 0.494
The last two columns in Table 10 present collinearity statistics. The tolerance values (reciprocal of Variance Inflation Factor, VIF) indicate that all independent variables have tolerance values around 1, with VIF values below 5. This confirms the absence of multicollinearity among the predictors. The validation demonstrates that the selected variables have direct impacts on water injection resistance in low-permeability reservoirs, providing a theoretical basis for injection resistance analysis. The model is well-constructed and possesses practical application value for reservoir management.
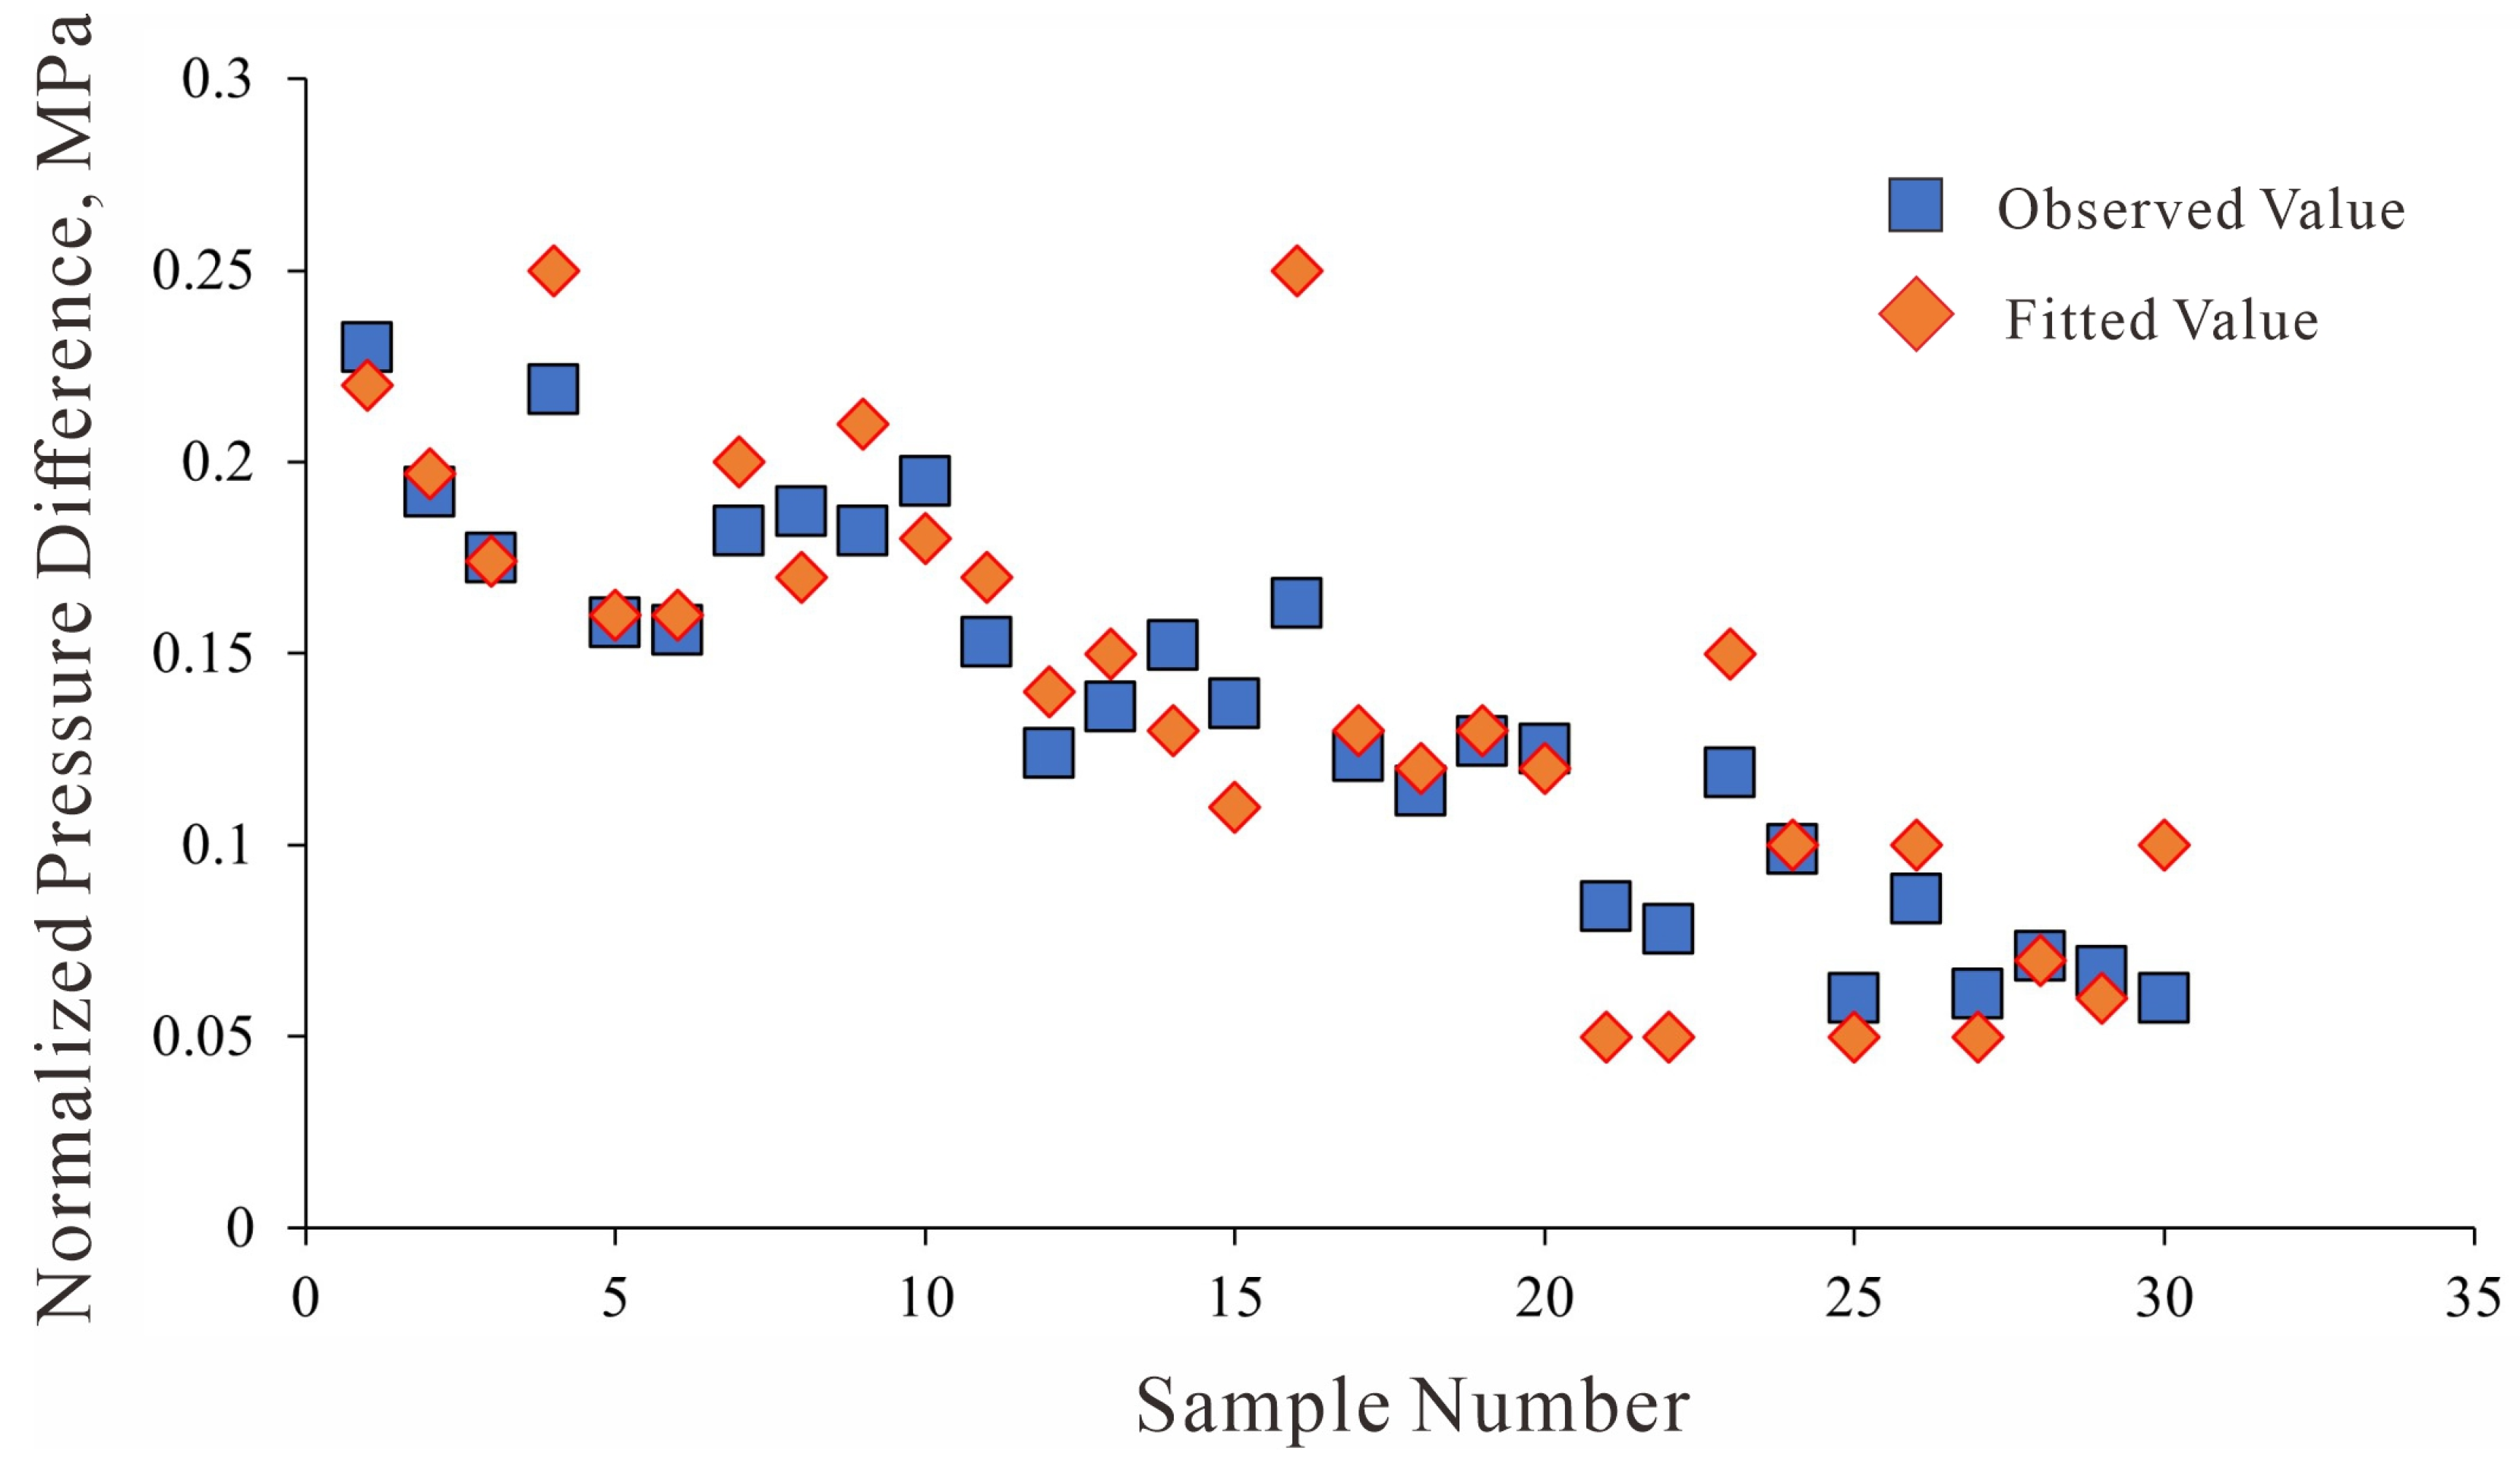
A comparison was conducted between the experimentally measured data of water injection resistance in low-permeability reservoirs (excluding the portion used for model fitting) and the predicted results generated by the established model to evaluate its accuracy. A comparative analysis based on the model-derived data is presented in Figure 29.
Figure 29 demonstrates that the trends and numerical values of the fitted and measured water injection resistance in low-permeability reservoirs are generally consistent. However, slight discrepancies exist due to the exclusion of certain positive contributors with relatively low responsiveness during the multiple linear regression process. Overall, the fitting performance is satisfactory in terms of variation amplitude. Additionally, the samples are arranged in ascending order of permeability. Consequently, as the sample number increases, the permeability gradually rises, while the corresponding water injection resistance shows a clear declining trend. This pattern not only validates the conclusions derived from physical experiments but also confirms the correctness and rationality of the fitted model.

4.2. The Dueling Roles of Illite and Kaolinite in Controlling Reservoir Flow Capacity and Sensitivity

The mineralogical composition, particularly the relative abundance and occurrence of illite and kaolinite, exerts a dominant control over both the flow capacity and sensitivity behavior of the Ahe Formation reservoirs. Our results demonstrate that illite content is the primary factor governing porosity-permeability relationships (Figure 10a and Figure 11a), whereas kaolinite significantly influences pore-throat radius distribution and velocity sensitivity.
Illite, occurring mainly as pore-lining sheets (Figure 3e–h), contributes strongly to water sensitivity due to its propensity for hydration and swelling upon exposure to low-salinity fluids. This is consistent with findings by Han et al. [15], who noted that illite-rich intervals in similar Triassic reservoirs exhibit pronounced permeability reduction under freshwater flooding. In contrast, kaolinite, typically present as book-like or vermicular aggregates filling intergranular pores (Figure 3a–d), is highly mobilizable under increased flow velocities. This leads to particle migration and throat plugging, explaining the strong velocity sensitivity observed in samples with high kaolinite content (e.g., Well YN4, Table 3). Such a dichotomy underscores the need for mineral-specific sensitivity mitigation: illite-dominated zones require salinity control, whereas kaolinite-rich intervals demand velocity management.
Notably, the inverse relationship between illite content and permeability (>20 mD) suggests that illite not only reduces porosity but also enhances tortuosity by subdividing pore networks-a finding aligned with Tao et al. [19], who highlighted the role of clay morphology in permeability impairment. Conversely, the positive correlation between kaolinite and permeability in higher-porosity intervals (>9%) indicates that its pore-filling habit may preserve larger flow pathways when not mobilized, contradicting some conventional views that equate high clay content with uniformly poor flow performance.

4.3. From Mineralogy to Injectivity Impedance: A Mechanistic Pathway

The pathway from mineral presence to injectivity impedance can be traced through specific damage mechanisms linked to each dominant clay type. For instance, chlorite-rich intervals (e.g., Wells KZ1, YN4) exhibit strong acid sensitivity due to the release of Fe2+ and Al3+ ions during acidizing, which precipitate as hydroxides and block pore throats (Table 4, Figure 20). This aligns with observations by Fang et al. [5], who noted similar precipitation-induced damage in chlorite-bearing sandstones.
Moreover, the presence of illite/smectite (I/S) mixed-layer clays though low in abundance plays a disproportionately large role in water sensitivity. Our data show that samples with I/S content >20% exhibit Type II or III water sensitivity curves (Table 3), characterized by progressive permeability decline with salinity reduction. This is mechanistically explained by the combination of swelling (I/S) and subsequent fine migration (kaolinite/illite), as illustrated in Figure 20 and Figure 21.
When compared with other low-permeability reservoirs, such as those studied by Kang [17] in the Xifeng Oilfield, our results confirm that illite and I/S are universal drivers of water sensitivity. However, the Ahe Formation shows a stronger influence of kaolinite on velocity sensitivity likely due to its deeper burial and more compact pore-throat systems, which enhance particle entrainment risk. This contrasts with the shallower, more loosely consolidated reservoirs where velocity sensitivity is often milder.
The established quantitative relationships between mineral content and injectivity impedance (Equations (11)–(15)) provide a predictive tool for tailoring injection strategies. For example, in zones with high illite content, maintaining injection salinity above critical thresholds can mitigate swelling, while in kaolinite-rich layers, flow rates should be kept below critical velocity to avoid mobilization.

4.4. Synergistic Interactions and Temporal Evolution of Damage

A key finding often overlooked is that different sensitivity types do not act in isolation but can interact, amplifying the overall damage. For example, stress sensitivity compounds chemical sensitivities. Under increasing effective stress, pore throats compress, bringing migrating fines (from velocity sensitivity) closer together and increasing the likelihood of forming stable bridges that severely block flow paths. This interaction explains why the stress sensitivity damage rate is exceptionally high (Table 6), even in samples with moderate clay content the mechanical compaction enhances the damaging effect of migrated fines.
Furthermore, laboratory tests provide a snapshot of damage, but the temporal evolution in a reservoir is dynamic. Our sequential experiments (e.g., injecting brine after acidizing) suggest that damage may evolve. Acidizing may initially open channels but, in chlorite-rich zones, later lead to precipitation that causes a time-delayed impedance increase. This implies that short-term core floods might underestimate the long-term damage. The permeability decline curve in velocity sensitivity tests (Figure 19) is itself a temporal profile, showing that damage stabilizes only after a certain pore volume is injected, a crucial insight for forecasting long-term injectivity.

4.5. Scaling Laboratory Findings to Field Applications and Limitations

The core-scale measurements represent a small, relatively homogeneous volume. In contrast, a reservoir interval contains layers with varying mineralogy and permeability, fractures, and existing damage zones.
The critical velocities and salinities determined in the lab provide essential threshold values for designing field operations. For instance, maintaining injection water salinity above the critical salinity identified in Table 2 for a given zone can prevent water sensitivity. However, the wellbore vicinity experiences the most severe and dynamic conditions, where fines mobilized by high flow rates near the wellbore may migrate deeper into the formation, causing damage that is difficult to remediate. Our findings suggest that a one-size-fits-all injection strategy is inadequate. Instead, zonation-based injection policies, tailored to the dominant clay mineral assemblage (e.g., illite-rich vs. kaolinite-rich zones) as mapped in Figure 1, are necessary to minimize impedance.
The primary limitation of this study, common to the field, is the difficulty in perfectly replicating the long-term, multi-phase flow conditions of a reservoir in the laboratory. Our experiments used brine and specific working fluids, whereas in a field, interactions with residual oil and gas and the continuous chemical evolution of the injected fluid add layers of complexity. Future work should involve long-term core floods and coupled geochemical modeling to better predict these temporal changes.

5. Conclusions

This study investigated the impact of reservoir mineral composition on flow capacity, evaluated formation sensitivity, and analyzed the dynamic impact on injectivity impedance. The influencing factors were discussed, leading to the following conclusions regarding the quantitative relationship between reservoir sensitivity and injectivity impedance.
For salt-sensitive formations, the reservoir itself exhibits small pores and low permeability under the influence of saline water. As the salinity of the injected water increases, excessive salt concentration leads to the formation of salt-saturated zones, which elevate injectivity impedance and restrict effective water percolation.
For velocity-sensitive formations, lower permeability and smaller effective pore-throat radii facilitate the migration of reservoir particles. As flow velocity increases and injection continues, permeability initially experiences a minor rise followed by a gradual decline. Combined with clay mineralogical analysis, the dominant occurrences of illite (platy) and kaolinite (vermicular) make them highly susceptible to fragmentation under high flow rates. The resulting fragments plug flow channels, consequently reducing reservoir permeability and increasing injectivity impedance.
For acid-sensitive reservoirs, acidic fluids used during water flooding generally enhance pore connectivity and reduce injectivity impedance. However, in reservoirs rich in chlorite, acidization displaces Fe2+and Al3+ ions, which—under oxidizing conditions—readily form precipitates such as iron hydroxide and aluminum hydroxide. These precipitates plug pores and throats, reduce reservoir permeability, and lead to increased injectivity impedance.
For alkali-sensitive reservoirs, high-pH alkaline fluids can increase formation heterogeneity and generate precipitates by reacting with free metal ions in the formation, thereby plugging pores and increasing injectivity impedance. Nevertheless, an appropriate concentration of alkaline agents can promote the dissolution and recrystallization of certain minerals, improving pore connectivity and reducing injectivity impedance.
Regarding stress sensitivity, under low-stress conditions, the reservoir tends to dilate, resulting in increased porosity and permeability, and a corresponding decrease in injectivity impedance. In contrast, under high-stress conditions, the reservoir undergoes compaction, leading to reduced porosity and permeability, and an increase in injectivity impedance.
Finally, based on the clay content analysis results, a multiple linear equation between clay mineral content and water injection resistance was derived.

Author Contributions

Methodology, B.L.; validation, X.L. and Y.W.; investigation, H.Y.; data curation, B.L.; writing—original draft preparation, X.L.; writing—review and editing, B.L. and L.Z.; funding acquisition, B.L. All authors have read and agreed to the published version of the manuscript.

Funding

This study was supported by Research on Experimental Analysis and Quantitative Characterization of Water Injection Resistance in Low Permeability Reservoirs (33550000-22-ZC0613-0206).

Data Availability Statement

Data will be made available on request.

Acknowledgments

We thank Baoyou Guo, Chuan Jing, and Jun Chen for their help in data analysis. Special acknowledgment is extended to the National Energy Research and Development Center for Sustainable Exploitation of Continental Sandstone Mature Oil Fields for providing the experimental facilities. Thanks are also extended to Processes Editor Hong He and all anonymous reviewers for their constructive comments. All individuals included in this section have consented to the acknowledgement.

Conflicts of Interest

Authors Youqi Wang and Hongmin Yu were employed by the Sinopec Petroleum Exploration and Production Research Institute. The remaining authors declare that the research was conducted in the absence of any commercial or financial relationships that could be construed as a potential conflict of interest.

Notations/Symbols

m0Mass of the dry core, g;
m1Mass of the core after saturation with formation water, g;
ρ1Density of the formation water, g/cm3;
VpEffective pore volume of the core, cm3;
VtTotal volume of the core, cm3;
ΦPorosity of the core, %;
PInjectivity Impedance, MPa;
ω Mineral Content, %.

References

  1. Zhang, Z.; Zheng, J. Advances in exploration and exploitation technologies of low-permeability oil and gas. Adv. Earth Sci. 2009, 24, 854. [Google Scholar]
  2. Hu, W.; Wei, Y.; Bao, J. Development of the theory and technology for low permeability reservoirs in China. Pet. Explor. Dev. 2018, 45, 685–697. [Google Scholar] [CrossRef]
  3. Ji, B.; Fang, J. An overview of efficient development practices at low permeability sandstone reservoirs in China. Energy Geosci. 2023, 4, 100179. [Google Scholar] [CrossRef]
  4. Yuan, Q.; Ding, H.; Wu, F.; Li, R.; Yang, Y. Sensitivity analysis and reservoir protection strategies for the first member of Shawan Formation in An Oilfield. J. Hebei Pet. Univ. Technol. 2025, 27, 26–30. [Google Scholar] [CrossRef]
  5. Fang, W.; Jiang, H.; Li, J.; Li, W.; Li, P.; Gu, H.; Feng, X.; Zhao, L. Investigation of salt and alkali sensitivity damage mechanisms in clay-containing reservoirs using nuclear magnetic resonance. Part. Sci. Technol. 2017, 35, 533–540. [Google Scholar] [CrossRef]
  6. Yu, K.; Zhao, K.; Ju, Y. A comparative study of the permeability enhancement in coal and clay-rich shale by hydraulic fracturing using nano-CT and SEM image analysis. Appl. Clay Sci. 2022, 218, 106430. [Google Scholar] [CrossRef]
  7. Wang, K.; Dai, J.; Zhang, H.; Zhang, D.; Zhao, L. Numerical simulation of stress sensitivity in fractured reservoirs: A case study of Keshen Gas Field, Kuqa Depression. Acta Pet. Sin. 2014, 35, 123–133. [Google Scholar]
  8. SY/T 5358-2010; Specification for Evaluation of Sandstone Reservoir. National Energy Administration: Beijing, China, 2010.
  9. Li, H.; Yu, H.; Yang, H.; Deng, T.; Li, X.; Wu, Y. Adaptive stress sensitivity in fractured heterogeneous tight reservoirs. Pet. Drill. Tech. 2022, 50, 99–105. [Google Scholar]
  10. Wu, Z.; Li, Y.; Sun, X.; Wu, P.; Zheng, J. Experimental study on the effect of methane hydrate decomposition on gas phase permeability of clayey sediments. Appl. Energy 2018, 230, 1304–1310. [Google Scholar] [CrossRef]
  11. SY/T 5336-2006; Recommended Practice for Conventional Core Analysis. National Energy Administration: Beijing, China, 2006.
  12. Zhao, G.; Yao, Y.; Wang, L.; Chen, Y.; Zhang, T.; Yu, W. Micro-scale flow characteristics and stress sensitivity analysis in shale oil reservoirs. Fault-Block Oil Gas Field 2021, 28, 247–252. [Google Scholar]
  13. Tan, Q.; Kang, Y.; You, L.; Peng, H.; Zhao, F.; Bai, J. The role of salt dissolution on the evolution of petrophysical properties in saline-lacustrine carbonate reservoirs: Pore structure, porosity-permeability, and mechanics. J. Hydrol. 2023, 618, 129257. [Google Scholar] [CrossRef]
  14. Sadeghein, A.; Abbaslu, A.; Riahi, S.; Hajipour, M. Comprehensive analysis of fine particle migration and swelling: Impacts of salinity, pH, and temperature. Geoenergy Sci. Eng. 2024, 240, 213044. [Google Scholar] [CrossRef]
  15. Han, D.; Zhang, S.; Yuan, W.; Feng, Z.; Ouyang, C.; Peng, S. Formation mechanism of reservoir velocity sensitivity and its vertical heterogeneity: A case study of Triassic reservoirs in Jilake area, Tabei uplift. Lithol. Reserv. 2015, 27, 19–24. [Google Scholar]
  16. Tan, Z.; Ouyang, C.; Wang, G.; Fu, Y.; Chen, Z.; Li, J. Formation mechanism and differential factors of velocity sensitivity in tight clastic reservoirs of the Ahe Formation, Kuqa Depression. Drill. Prod. Technol. 2020, 43, 82–85. [Google Scholar]
  17. Kang, W. Characteristics of Reservoir Sensitivity and Its Impact on Water Flooding Development in Xifeng Oilfield. Master’s Thesis, Xi’an Shiyou University, Xi’an, China, 2019. [Google Scholar]
  18. Xiao, W.; Li, T.; Li, M.; Zhao, J.; Li, L. Evaluation of the stress sensitivity in tight reservoirs. Pet. Explor. Dev. 2016, 43, 115–123. [Google Scholar] [CrossRef]
  19. Tao, S.; Gao, L.; Pan, Z. Swelling of clay minerals and its effect on coal permeability and gas production: A case study of southern Qinshui Basin, China. Energy Sci. Eng. 2019, 7, 515–528. [Google Scholar] [CrossRef]
  20. Zhang, W.; Zhang, D.; Zhao, J. Experimental investigation of water sensitivity effects on microscale mechanical behavior of shale. Int. J. Rock Mech. Min. Sci. 2021, 145, 104837. [Google Scholar] [CrossRef]
  21. Shu, C.C.; Qu, R.X.; Li, Y.; Zheng, A.Y.; Liu, T.Y.; Dong, H.; Zhao, H.; Zhang, F.; She, Y.H.; Sun, S.S. Mechanism of microorganisms to relieve reservoir water sensitivity damage. Part. Sci. Technol. 2024, 42, 3616–3629. [Google Scholar] [CrossRef]
  22. Zhuang, Y.; Liu, X.; Xiong, H.; Liang, L. Microscopic mechanism of clay minerals on reservoir damage during steam injection in unconsolidated sandstone. Energy Fuels 2018, 32, 4671–4681. [Google Scholar] [CrossRef]
  23. Moslemizadeh, A.; Dehkordi, A.F.; Barnaji, M.J.; Naseri, M.; Ravi, S.G.; Jahromi, E.K. Novel bio-based surfactant for chemical enhanced oil recovery in montmorillonite rich reservoirs: Adsorption behavior, interaction impact, and oil recovery studies. Chem. Eng. Res. Des. 2016, 109, 18–31. [Google Scholar] [CrossRef]
  24. Wang, C.; Zhang, X.; Yang, T.; Zhou, Z.; Luo, X.; Fan, J.; Gao, H. Stress sensitivity mechanism of pores in unconsolidated sandstone reservoir using NMR technology. Geoenergy Sci. Eng. 2024, 240, 212999. [Google Scholar] [CrossRef]
Figure 1. Pie Chart of clay mineral distribution in the ZLX Ahe Formation reservoir, Eastern Kuqa Depression.
Processes 13 03283 g001
Figure 2. XRD pattern of Kaolinite in the ZLX Ahe Formation reservoir, Eastern Kuqa Depression.
Processes 13 03283 g002
Figure 3. Photomicrographs of Kaolinite and Illite in the ZLX Ahe Formation reservoir, Eastern Kuqa Depression. (ad) SEM image of kaolinite; (eh) SEM image of illite. Kao: Kaolinite; I: Illite.
Processes 13 03283 g003
Figure 4. XRD pattern of Illite in the ZLX Ahe Formation reservoir, Eastern Kuqa Depression.
Processes 13 03283 g004
Figure 5. XRD pattern of Chlorite in the ZLX Ahe Formation reservoir, Eastern Kuqa Depression.
Processes 13 03283 g005
Figure 6. Photomicrograph of Chlorite in the ZLX Ahe Formation reservoir, Eastern Kuqa Depression. (a) SEM image of chlorite; (b) SEM image of chlorite. c: Chlorite.
Processes 13 03283 g006
Figure 7. XRD pattern of Illite/Smectite mixed layer in the ZLX Ahe Formation reservoir, Eastern Kuqa Depression.
Processes 13 03283 g007
Figure 8. Photomicrograph of Illite/Smectite mixed layer in the ZLX Ahe Formation reservoir, Eastern Kuqa Depression. (ad) SEM image of illite/smectite mixed layer. I/S: Illite/Smectite mixed layer.
Processes 13 03283 g008
Figure 9. Relationship between clay minerals and reservoir properties. (a) Total clay content vs. Permeability; (b) Total clay content vs. Porosity; (c) Average pore-throat radius range vs. Total clay content; (d) Maximum pore-throat radius range vs. total clay content.
Processes 13 03283 g009
Figure 10. Relationship between mineral content and Permeability (the blue square in the graph represent permeability values at different contents, while the orange area indicates the trend of the data). (a) Illite vs. Permeability; (b) Illite/Smectite mixed layer vs. Permeability; (c) Kaolinite vs. Permeability; (d) Chlorite vs. Permeability.
Processes 13 03283 g010
Figure 11. Relationship between mineral content and Porosity (the blue square in the graph represent porosity values at different contents, while the orange area indicates the trend of the data). (a) Illite vs. Porosity; (b) Illite/Smectite mixed layer vs. Porosity; (c) Kaolinite vs. Porosity; (d) Chlorite vs. Porosity.
Processes 13 03283 g011
Figure 12. Absolute content of clay minerals in different Permeability ranges (Bar Chart).
Processes 13 03283 g012
Figure 13. Relative proportion of clay Minerals in different Permeability ranges (Bar Chart).
Processes 13 03283 g013
Figure 14. Absolute content of clay minerals in different Porosity ranges (Bar Chart).
Processes 13 03283 g014
Figure 15. Relative proportion of clay minerals in different Porosity ranges (Bar Chart).
Processes 13 03283 g015
Figure 16. Relationship between rock grain content and reservoir properties (the blue square in the graph represent porosity values at different Quartz contents, while the orange area indicates the trend of the data). (a) Effect of Quartz and feldspar content on Porosity; (b) Effect of Quartz and feldspar content on Permeability; (c) Effect of Quartz content on Porosity; (d) Effect of Quartz content on Permeability.
Processes 13 03283 g016
Figure 17. Water sensitivity experimental curves. (a) J1a4 layer, Eastern Kuqa Depression; (b) J1a4 layer, Eastern Kuqa Depression; (c) J1a2 layer, Eastern Kuqa Depression; (d) J1a1 layer, Eastern Kuqa Depression; (e) Well Yishen-4, Northeastern Kuqa Depression; (f) Well Yinan-5, Eastern Kuqa Depression; (g) Well Mingnan-1, Eastern Kuqa Depression.
Processes 13 03283 g017
Figure 18. Salinity sensitivity experimental curves for the J1a4 layer in the study area.
Processes 13 03283 g018
Figure 20. Microstructural comparison of Illite/Smectite mixed-llayer before and after swelling.
Processes 13 03283 g020
Figure 21. Microstructural comparison before and after migration of Kaolinite and other particles.
Processes 13 03283 g021
Figure 22. Relationship between pore radius and pore volume before and after water sensitivity damage. (a) Dissolution intergranular pores; (b) Micropores.
Processes 13 03283 g022
Figure 23. Velocity sensitivity experimental curves (Partial core samples exhibited increased flow velocity due to fluid-induced damage to sandstone grains). (a) J1a4 layer, Eastern Kuqa Depression; (b) J1a4 layer, Eastern Kuqa Depression; (c) Well YS4, Eastern Kuqa Depression; (d) Well YN5, Eastern Kuqa Depression; (e) Well MN1, Eastern Kuqa Depression.
Processes 13 03283 g023
Figure 24. Acid sensitivity experimental histogram. (a) J1a4 layer in the study area; (b) Well YN5 in the study area.
Processes 13 03283 g024
Figure 25. Alkali sensitivity experimental curves. (a) J1a4 layer in the study area; (b) J1a1 layer in the study area; (c) Well MN1 in the study area.
Processes 13 03283 g025
Figure 26. Experimental curves of maximum damage rate for stress sensitivity. (a) J1a4 layer in the study area; (b) J1a1 layer in the study area.
Processes 13 03283 g026
Figure 27. Relationship between total clay content and water injection resistance (the blue square represent water injection resistance values at different mineral contents, and the black line indicates the trend line.). (a) Relationship between Illite content and water injection resistance; (b) Relationship between Kaolinite content and water injection resistance; (c) Relationship between Chlorite content and water injection resistance; (d) Relationship between Illite/Smectite mixed-layer content and water injection resistance; (e) Relationship between Clay Mineral content and water injection resistance.
Processes 13 03283 g027
Figure 28. Distribution characteristics of standardized regression residuals. (a) Histogram; (b) Normal P-P plot.
Processes 13 03283 g028
Figure 29. Comparison between normalized observed data and model predictions.
Processes 13 03283 g029
Table 1. Experimental results of water sensitivity damage for reservoirs in the Eastern Kuqa Depression.
No.WellDepth (m)FormationPermeability (mD)Porosity (%)Damage Rate (%)Damage Degree
1YX1412.10J1a40.0203.33363.4Moderate to Strong
3683.00J1a40.0150.91265.6Moderate to Strong
2KZ14359.00J1a40.0381.87642.6Moderate to Strong
3YS44007.80J1a10.6067.61168.4Moderate to Strong
4068.50J1a20.7049.32083.7Strong
4101.70J1a40.0274.49146.6Moderate to Weak
4YN44376.34J1a10.4959.39168.2Moderate to Strong
4478.30J1a20.1917.64867.7Moderate to Strong
4537.00J1a30.1196.71837.0Moderate to Weak
4594.80J1a40.0665.62678.1Strong
4649.00J1a40.0426.40752.1Moderate to Strong
5YN54896.00J1a20.5806.65035.7Moderate to Weak
4896.80J1a23.9508.93066.4Moderate to Strong
4936.60J1a40.4274.99051.0Moderate to Strong
5012.60J1a10.8977.86264.9Moderate to Strong
6YN2C4752.55J1a19.9007.31066.4Moderate to Strong
7TZ24405.72J1a41.0467.06958.2Moderate to Strong
8MN1952.44J1a119.78818.00749.2Moderate to Weak
968.85J1a241.76418.81597.2Strong
1028.82J1a242.8855.94748.6Moderate to Weak
1151.87J1a419.77818.00732.1Moderate to Weak
1154.67J1a44.44511.23686.4Strong
Table 2. Experimental results of salinity sensitivity damage for reservoirs in the Eastern Kuqa Depression (Critical Salinity: The critical salinity at which permeability changes abruptly).
No.WellDepth (m)FormationPermeability (mD)Porosity (%)Critical Salinity (mg/L)Damage Rate (%)Damage Degree
1YX1412.70J1a40.0163.47828,30066.8Moderate to Strong
2KZ14357.50J1a40.0862.05020,00062.2Moderate to Strong
3YS44002.70J1a10.2979.88020,00069.9Moderate to Strong
4101.70J1a40.2974.49114,15049.1Moderate to Weak
4YN44376.04J1a10.2037.03260,00052.6Moderate to Strong
4603.47J1a42.0829.43045,00067.9Moderate to Strong
5YN54894.60J1a20.0984.38220,00042.2Moderate to Weak
4936.30J1a42.0969.169700083.7Strong
4936.30J1a419.89029.1440,00075.5Strong
5012.90J1a11.5188.52250,00057.7Moderate to Strong
6YN2C4752.50J1a12.2528.290700092.9Strong
4752.86J1a10.1367.96024,00031.2Moderate to Weak
7TZ24403.42J1a40.2777.01630,00062.7Moderate to Strong
8MN1968.85J1a174.61116.59960,00060.5Moderate to Strong
968.85J1a271.24519.171200051.8Moderate to Strong
1154.67J1a44.05411.11361,60089.6Strong
Table 3. Classification of water sensitivity curve types.
No.WellDepth (m)Illite/Smectite Mixed LayerIllite and KaoliniteChloriteClay MineralsCurve Type
Relative Content (%)
1YS44069.13.380.016.7100Type I
YS44044.010.087.21.4100
YN54781.512.872.515.3100
MN11028.018.277.35.5100
YN44533.45.083.311.7100
2TD24138.732.357.511.0100Type II
TD24136.327.364.58.2100
DT12257.535.264.80.0100
3DT44204.448.024.227.8100Type III
TZ44212.556.827.915.3100
DB1025094.554.731.314.1100
Table 4. Experimental results of velocity sensitivity damage for reservoirs in the Eastern Kuqa Depression (Critical Flow Velocity: Flow rate at the critical point of rapid permeability alteration).
No.WellDepth (m)FormationPermeability (mD)Porosity (%)Critical Flow Velocity (m/d)Damage Rate (%)Damage Degree
1KZ14357.10J1a40.0333.1311.81731.5Moderate to Weak
2YX1413.10J1a40.0173.2131.77226.3Weak
3683.00J1a10.0451.09110.42542.7Moderate to Weak
3YS43998.90J1a10.9079.9125.73729.9Weak
4006.00J1a10.8748.7603.24666.9Moderate to Strong
4101.10J1a40.0176.5042.18642.9Moderate to Weak
4042.00J1a23.0678.4996.69129.0Weak
4YN44375.44J1a10.1197.6271.86324.0Moderate to Weak
4497.35J1a20.5069.0783.13284.7Strong
4573.29J1a40.4998.0182.86768.7Moderate to Strong
5YN2C4734.20J1a10.1557.1812.77220.6Weak
4740.17J1a10.3865.3205.34572.5Strong
6TZ24347.06J1a40.4858.7682.59462.6Moderate to Strong
4406.57J1a40.0315.3154.28434.1Moderate to Weak
7YN54851.20J1a20.2544.3701.95283.1Strong
4894.90J1a20.2054.4246.43331.5Moderate to Weak
4936.60J1a16.4607.7283.68069.4Moderate to Strong
4941.50J1a40.2057.5401.13141.7Moderate to Weak
5012.60J1a11.5808.6101.02079.7Strong
8MN1951.14J1a127.71517.5321.62257.6Moderate to Strong
1028.32J1a221.67114.1621.40550.7Moderate to Strong
1154.37J1a42.72811.2191.77441.2Moderate to Weak
Table 5. Experimental results of acid sensitivity damage for reservoirs in the Eastern Kuqa Depression.
No.WellDepth (m)FormationPermeability (mD)Porosity (%)Damage Rate (%)Damage Degree
1YX1412.70J1a40.0153.29648.5Moderate to Weak
2KZ14359.20J1a40.0212.62365.9Moderate to Strong
3YS43995.00J1a10.0124.71056.5Moderate to Strong
3995.00J1a20.0845.46546.0Moderate to Weak
4104.00J1a40.1443.53532.5Moderate to Weak
4YN44375.04J1a12.8346.87145.0Moderate to Weak
4465.66J1a20.0926.99833.2Moderate to Weak
4538.60J1a30.0446.26434.0Moderate to Weak
4604.97J1a42.3799.37669.1Moderate to Strong
4639.66J1a40.0137.68433.2Moderate to Weak
5YN54846.90J1a20.9475.74912.1Weak
4894.00J1a20.4034.12034.3Moderate to Weak
4936.20J1a45.2307.99037.9Moderate to Weak
5013.00J1a11.7116.80232.5Moderate to Weak
6YN2C4746.40J1a10.0766.93026.9Weak
7TZ24403.92J1a40.4056.96821.9Weak
8MN1952.74J1a17.84716.18326.7Weak
969.75J1a240.62618.68656.8Moderate to Strong
1154.37J1a42.52911.6559.8Weak
Table 6. Experimental results of alkali sensitivity damage for reservoirs in the Eastern Kuqa Depression.
No.WellDepth (m)FormationPermeability (mD)Porosity (%)pHDamage Rate (%)Damage Degree
1YX1412.70J1a40.0203.393754.7Moderate to Strong
2KZ14359.60J1a40.0142.1151143.2Moderate to Weak
3YS44003.50J1a10.0639.408932.5Moderate to Weak
4043.20J1a22.99210.140745.4Moderate to Weak
4088.90J1a22.4509.880741.2Moderate to Weak
4YN44460.75J1a22.73311.205951.3Moderate to Strong
4525.40J1a40.2804.120958.1Moderate to Strong
4606.60J1a40.3173.347836.8Moderate to Weak
5YN54896.60J1a11.0287.654959.4Moderate to Strong
4936.60J1a40.7106.2741123.1Weak
5012.60J1a10.5478.950950.8Moderate to Strong
6YN2C4739.73J1a10.1554.959944.3Moderate to Strong
4750.08J1a10.41110.530951.1Moderate to Strong
4765.20J1a10.2888.120953.9Moderate to Strong
7TZ24405.82J1a40.4786.445855.9Moderate to Strong
4450.15J1a40.6207.350847.6Moderate to Weak
8MN1956.94J1a162.82718.725763.9Moderate to Strong
1026.92J1a250.76116.066773.0Strong
1085.60J1a245.20017.850768.5Strong
1154.37J1a43.05611.549729.1Weak
Table 7. Experimental results of stress sensitivity damage for reservoirs in the Eastern Kuqa Depression.
No.WellDepth (m)FormationPermeability (mD)Porosity (%)Maximum Damage Rate (%)Damage Degree
1YX1409.80J1a40.0212.68494.2Strong
2KZ14359.00J1a40.0272.01076.1Strong
3YS44001.60J1a10.1398.97094.5Strong
4YN44607.50J1a40.3233.85688.9Strong
5YN54773.63J1a11.2896.15089.7Strong
4941.50J1a20.2796.43197.4Strong
6TZ24406.62J1a40.1745.68594.7Strong
7YN2C4758.72J1a10.0236.15081.9Strong
8MN1968.85J1a141.76418.81577.4Strong
1026.92J1a285.71815.44852.9Moderate to Strong
1154.37J1a42.45611.54293.1Strong
Table 8. Overview of model fitting results.
Modified Statistics
RR2Adjusted R2ΔR2ΔFSignificance Durbin–Watson
0.7020.8380.8240.83847.20802.038
Table 9. ANOVA (F-test).
Sum of SquaresDegrees of FreedomMean SquareFSignificance
Regression0.0550.0111.736000
Residual0.02240.001
Total0.0729
Table 10. Coefficients output (t-test).
Unstandardized CoefficientsStandardized CoefficientsTSignificanceCollinearity Statistics
BStandard ErrorBeta ToleranceVIF
(Constant)−0.4940.704 −0.7010.49
Total Clay Content0.0150.0020.7466.51300.9221.085
Chlorite0.0030.0080.1530.4080.6870.0861.594
Illite0.0060.0070.5930.8970.3790.0280.116
Kaolinite0.0040.0070.4020.5780.5690.0250.91
Illite-Smectite Mixed Layer0.0010.0080.0730.1970.8460.0891.256
Disclaimer/Publisher’s Note: The statements, opinions and data contained in all publications are solely those of the individual author(s) and contributor(s) and not of MDPI and/or the editor(s). MDPI and/or the editor(s) disclaim responsibility for any injury to people or property resulting from any ideas, methods, instructions or products referred to in the content.