Article

Hybrid Energy Storage Capacity Optimization for Power Fluctuation Mitigation in Offshore Wind–Photovoltaic Hybrid Plants Using TVF-EMD

by
Chenghuan Tian
1,2,
Qinghu Zhang
1,2,*,
Dan Mei
1,2,
Xudong Zhang
2,3,
Zhengping Li
4 and
Erqiang Chen
4
1
National Key Laboratory of Electromagnetic Energy, Naval University of Engineering, Wuhan 430030, China
2
Hubei East Lake Laboratory, Wuhan 430202, China
3
School of Electrical and Electronic Engineering, Huazhong University of Science and Technology, Wuhan 430074, China
4
State Grid Henan Electric Power Research Institute Co., Ltd., Zhengzhou 450052, China
*
Author to whom correspondence should be addressed.
Processes 2025, 13(10), 3282; https://doi.org/10.3390/pr13103282
Submission received: 23 September 2025 / Revised: 6 October 2025 / Accepted: 11 October 2025 / Published: 14 October 2025
(This article belongs to the Special Issue Modeling, Simulation and Control in Energy Systems—2nd Edition)

Abstract

The large-scale integration of coordinated offshore wind and offshore photovoltaic (PV) generation introduces pronounced power fluctuations due to the intrinsic randomness and intermittency of renewable energy sources (RESs). These fluctuations pose significant challenges to the secure, stable, and economical operation of modern power systems. To address this issue, this study proposes a hybrid energy storage system (HESS)-based optimization framework that simultaneously enhances fluctuation suppression performance, optimizes storage capacity allocation, and improves life-cycle economic efficiency. First, a K-means fuzzy clustering algorithm is employed to analyze historical RES power data, extracting representative daily fluctuation profiles to serve as accurate inputs for optimization. Second, the time-varying filter empirical mode decomposition (TVF-EMD) technique is applied to adaptively decompose the net power fluctuations. High-frequency components are allocated to a flywheel energy storage system (FESS), valued for its high power density, rapid response, and long cycle life, while low-frequency components are assigned to a battery energy storage system (BESS), characterized by high energy density and cost-effectiveness. This decomposition–allocation strategy fully exploits the complementary characteristics of different storage technologies. Simulation results for an integrated offshore wind–PV generation scenario demonstrate that the proposed method significantly reduces the fluctuation rate of RES power output while maintaining favorable economic performance. The approach achieves unified optimization of HESS sizing, fluctuation mitigation, and life-cycle cost, offering a viable reference for the planning and operation of large-scale offshore hybrid renewable plants.

1. Introduction

Driven by the “dual-carbon” targets, the establishment of a new-type power system dominated by renewable energy has become a prevailing trend for future development [1,2]. In recent years, the share of renewable generation in the power grid has been increasing steadily; however, the inherent variability and reverse-peak-regulation characteristics of renewables impose adverse impacts on power quality, peak-load regulation, and the secure and stable operation of the system [3,4].
The concept of “wind–solar co-location” aims to realize the synergistic and complementary integration of offshore wind power and offshore photovoltaics. By optimally arranging offshore wind turbines, photovoltaic arrays, and their supporting infrastructure within the same maritime area, it enables the efficient and coordinated utilization of marine space and industrial resources, thereby significantly increasing the energy yield per unit sea area. Compared with conventional stand-alone offshore wind farms or offshore photovoltaic plants, the offshore wind–solar co-location model offers distinct advantages, including enhanced stability of energy supply, substantial economic benefits, and pronounced environmental gains.
Energy storage systems (ESSs) enable the temporal and spatial shifting of electrical energy [5,6]. Integrating ESSs on the generation side of offshore wind–solar co-located systems can effectively smooth the power fluctuations inherent to renewable energy [7,8] and reduce the ramping requirements of fossil-fuel units in the grid. Based on charging and discharging characteristics, ESSs can be classified into two categories: power-oriented storage and energy-oriented storage, both of which have been widely deployed in power systems [9,10].
Power-oriented storage, represented by superconducting magnetic energy storage (SMES), supercapacitors, and flywheel energy storage systems (FESSs), features high power density, fast response speed, and long cycle life, yet exhibits relatively limited capacity. Energy-oriented storage, exemplified by battery energy storage systems (BESSs), lead-acid batteries, and sodium–sulfur (NaS) batteries, offers high energy density, lower cost, and longer charge/discharge durations, but suffers from slower response and comparatively shorter cycle life [11,12].
Using a single battery energy storage system (BESS) to mitigate wind power fluctuations presents two primary challenges [13]: first, it requires the deployment of a relatively large storage capacity, which increases capital expenditures (CAPEX); second, the frequent charge–discharge cycles and excessive depth of discharge (DOD) accelerate the degradation of cycle life, thereby reducing the reliability of the equipment [14,15].
In contrast, the adoption of a hybrid energy storage system (HESS) can fully leverage the complementary characteristics of different energy storage technologies to effectively mitigate wind power output fluctuations [16,17], thereby reducing carbon emissions from fossil-fuel units and increasing renewable energy penetration.
An optimized capacity allocation of the storage system not only directly impacts the investment cost of the HESS but also influences its operational efficacy and overall performance [9,18]. The literature has reported notable environmental gains from integrating HESSs into renewable-energy systems: for instance, Gupta, R et al. [19] found that combining batteries and flywheels in microgrids reduced greenhouse gas emissions by 7–10% and enhanced overall system efficiency from a life-cycle perspective.
At present, numerous scholars worldwide have conducted extensive research on the optimal capacity configuration of hybrid energy storage systems (HESSs), particularly focusing on methods based on the “decomposition–reconstruction” concept, achieving promising results.
Empirical mode decomposition (EMD) is an adaptive time–frequency signal processing technique especially suitable for analyzing non-stationary and nonlinear signals. The fundamental principle of EMD is to progressively decompose complex signals from high to low frequency components into a series of intrinsic mode functions (IMFs) and subsequently obtain the spectral distribution by applying the Hilbert transform, thereby deriving physically meaningful instantaneous frequencies.
EMD decomposes signals according to the inherent time-scale characteristics present in the data without requiring any predefined basis functions, which enables accurate separation of the distinct fluctuation scales genuinely present in wind power time series. Compared with wavelet-based algorithms, EMD yields fewer sub-modes after decomposition, thereby reducing the computational burden during reconstruction and enhancing engineering practicality. In the “decomposition” phase, commonly used EMD-related methods include ensemble empirical mode decomposition (EEMD), variational mode decomposition (VMD), successive variational mode decomposition (SVMD), and complete ensemble empirical mode decomposition with adaptive noise (CEEMDAN).
Empirical mode decomposition (EMD) [20] has been widely applied in wind power fluctuation mitigation and energy management of hybrid energy storage systems (HESSs). Existing studies have primarily focused on different EMD-based enhancements. For example, Yang, X. et al. [21] integrated a recursive average filter with EMD to smooth wind power and determine storage capacity allocation for maximum net benefit; nevertheless, recursive averaging showed limited suppression of high-frequency oscillations and introduced considerable filtering delay.
To address the limitations of empirical mode decomposition (EMD) in terms of mode mixing and noise resistance, several authors have proposed enhancements to methods such as ensemble empirical mode decomposition (EEMD), variational mode decomposition (VMD), successive variational mode decomposition (SVMD), and complete ensemble empirical mode decomposition with adaptive noise (CEEMDAN). These improved approaches exhibit strong robustness against noise; however, they still require manual parameter settings and, due to their fixed cutoff frequencies, lack adaptability to time-varying characteristics.
Zhang, J. et al. [22] combined EEMD with fuzzy control to optimize the charging/discharging power and state of charge (SOC) of electrochemical storage and supercapacitors, enabling shallow charge–discharge cycles that prolong HESS service life. Wang, J. et al. [23] applied VMD for intrastorage power allocation in HESSs, which effectively eliminated mode aliasing but required predefinition of the number of decomposition modes, thus limiting its adaptivity. Chen, C. et al. [24] coupled SVMD with wind power into high/low-frequency components, and QPSO-based sizing maximized HESS life-cycle net revenue by determining optimal power and energy capacities. Gao, X. et al. [25] coupled CEEMDAN with mutual information entropy to separate HESS power into high- and low-frequency components with SOC constraint management; however, mutual information entropy cannot intuitively determine whether adjacent modes suffer from aliasing. Additionally, Wu, T. et al. [26] and Jian, C. et al. [27] proposed HESS energy management strategies based on optimization algorithms, but the iterative process suffered from unstable convergence, reducing computational efficiency and impairing the search for a global optimum [26,28].
Power output from renewable energy plants exhibits significant non-stationary behavior and multi-scale fluctuation characteristics. High-frequency variations (on the order of seconds to minutes) are mainly influenced by complex offshore environmental conditions—such as frequent changes in wind direction, rapid fluctuations in solar irradiance, array interference wake effects, and mechanical characteristics of wind turbines. Low-frequency variations (on the order of hours to days) are affected by meteorological changes, climatic trends, and wind farm dispatch strategies. EMD, EEMD, VMD, and CEEMDAN have been widely applied to the decomposition of such nonlinear, non-stationary sequences; however, these methods have certain limitations, including stringent frequency-division requirements, insufficient adaptability to time-varying characteristics, performance degradation at low sampling rates, and dependence on manual experience for parameter tuning. In practical renewable output decomposition, conventional VMD and CEEMDAN require pre-setting a cutoff frequency or a fixed number of modes. When the spectral characteristics of renewable generation vary dynamically, such fixed parameters may cause low-frequency components to be mixed into high-frequency IMFs or high-frequency power to be incorrectly allocated to low-frequency components. This misallocation increases ineffective charge–discharge cycles, reduces the accuracy of energy storage capacity sizing, and ultimately raises the investment cost of the storage system [10].
Wavelet transform, due to its strong dependence on basis function selection, lack of adaptability, and fixed time–frequency resolution, is limited in effectively handling the non-stationary characteristics of wind–solar power signals [29]. Although empirical wavelet transform (EWT) offers a certain degree of adaptive partitioning capability, its global decomposition mechanism based on the Fourier spectrum is inherently incompatible with the locally time-varying features of wind–solar signals; furthermore, the subjectivity in defining spectral boundaries can lead to invalid modal decompositions, making it unsuitable for non-stationary signal analysis in this context. Multivariate empirical mode decomposition (MEMD), in turn, is specifically designed for multichannel signals; its high-dimensional extrema search mechanism introduces computational redundancy for single-variable signals, and its core advantage of frequency alignment cannot be realized in single-channel scenarios.
The time-varying filter empirical mode decomposition (TVF-EMD) method, proposed by Li et al. in 2017 [30], is an improved approach built upon the conventional empirical mode decomposition (EMD). By introducing a time-varying filter, the method adaptively adjusts the local cutoff frequency φ b i s t to ensure that, even under complex weather conditions, the time-varying characteristics of the signal are preserved. This enables the signal to be decomposed into intrinsic mode functions (IMFs) with distinct frequency properties, allowing accurate separation of rapid disturbances from slow-varying trends and effectively mitigating the mode-mixing problem.
In the coordinated and complementary operation scenario of offshore wind and offshore photovoltaic systems, this study employs K-means fuzzy clustering to extract statistically representative typical-day power profiles from historical wind power data. The time-varying filter empirical mode decomposition (TVF-EMD) method is then applied to achieve precise separation of high-frequency and low-frequency power components. On this basis, the operational constraints—including charge–discharge power and state of charge (SOC)—and economic costs of both the battery energy storage system (BESS) and the flywheel energy storage system (FESS) are comprehensively considered. The optimization objective is defined as minimizing the total life-cycle cost of the hybrid energy storage system, incorporating initial investment cost, equipment replacement cost, operation and maintenance cost, equipment disposal cost, and residual value. This yields a capacity configuration scheme that is optimal in terms of both technical performance and economic efficiency. Although the case study adopts fluctuation limits from Chinese grid codes, the proposed optimization framework is generic and can be adapted to other countries by replacing the fluctuation constraints, updating cost parameters, and applying local typical-day profiles derived from regional renewable output data. The method can provide scientifically grounded and quantitatively precise capacity-configuration schemes for grid-planning authorities and power-generation enterprises when investing in and constructing hybrid energy storage projects.
The main novelties of this study are as follows: applying the TVF-EMD technique to adaptive high-/low-frequency separation of offshore wind–PV hybrid power output, thereby avoiding manual parameter tuning and enhancing high-frequency separation accuracy; integrating K-means fuzzy clustering with a cumulative fluctuation median approach to ensure statistical representativeness of typical-day profiles and mitigate the influence of extreme values; and developing a unified techno-economic optimization model for a flywheel–battery hybrid energy storage system, which simultaneously achieves effective suppression of grid-connected power fluctuations and minimization of total life-cycle cost, providing an engineering-ready planning strategy for large-scale offshore hybrid renewable power plants.

2. Offshore Wind–Photovoltaic–Hybrid Energy Storage Model

2.1. Topology of the Offshore Wind–Solar–Storage System

In a renewable energy generation system composed of wind farms and photovoltaic (PV) plants, when the output power fails to meet the grid-connection standards, a hybrid energy storage system (HESS) can be incorporated to form a wind–solar–storage integrated generation system, as illustrated in Figure 1. By optimally configuring the capacity of the energy storage system, the severe fluctuations in renewable power output can be effectively mitigated, thereby enabling smooth grid integration and enhancing both the stability and economic efficiency of the overall system.
In Figure 1, Ppv(t) denotes the output power of the PV station, Pw(t) is the wind farm output power, Phess(t) is the reference power of the HESS, and Po(t) is the target grid-connected power. Based on the topological structure, the following relationships hold:
P o ( t ) = P pv ( t ) + P w ( t ) P hess ( t )
P   hess ( t ) = P b ( t ) + P sc ( t )
From Equations (1) and (2), it can be observed that the control of the reference power for the hybrid energy storage system (HESS) directly affects the target grid-connected power. By effectively regulating the compensation power of the battery energy storage system (BESS) and the flywheel energy storage system (FESS), the energy losses within the storage system can be reduced, thereby enabling the total output of the renewable power plant to more closely track the target grid-connected power.

2.2. Assessment Requirements for Renewable Power Grid-Integration Fluctuation Rate

There are notable differences among major global electricity markets in the way grid-integration fluctuation limits are defined.
China primarily follows national-level technical standards. The Wind Farm Connection to the Power System (GB/T 19963-2011) [31] specifies active-power fluctuation limits based on the installed capacity of the wind farm (see Table 1). For photovoltaic plants, the Technical Rules for Photovoltaic Power Power Station Grid Connection (Q/GDW 1617-2015) [32] stipulates that the maximum active-power change within one minute shall not exceed 10% of the installed capacity.
The United States adopts the IEEE Standard for Interconnection and Interoperability of Distributed Energy Resources with Associated Electric Power Systems Interfaces (IEEE Std 1547-2018) [33] as the baseline, with detailed provisions established by individual state ISO/RTOs. The core requirement is that renewable generating units must be equipped with adjustable ramp-rate control capabilities, with a typical adjustable range of 0.5–5% of rated power per second; the final limit is determined within the interconnection agreement. For example, CAISO and ERCOT commonly apply limits of ±10% of installed capacity per minute for large-scale wind and PV projects.
Europe is governed by the ENTSO-E Requirements for Generators (RfG) network code [34], supplemented by national standards such as Germany’s VDE-AR-N 4120 and the UK Grid Code. Typical active-power ramp-rate limits for renewable plants range from ±10% to ±20% of rated capacity per minute, with stricter thresholds applied in weak-grid or islanded systems. Compared with the U.S., European standards tend to embed fluctuation limits within a broader framework of system stability and ancillary service obligations.
This study analyzes actual 2024 operational data from a 150 MW offshore “co-located wind–PV” installation in China. Given that the grid dispatch system collects data at five-minute intervals, and to adopt a more stringent constraint, this section selects a standard in which the five-minute fluctuation magnitude must not exceed 10% of the installed capacity.
The fluctuation rate is defined as
δ ( t ) = P ( t ) P ( t Δ t ) P ( t ) × 100 %
where δ(t) is the PV power fluctuation rate and Δt is the sampling interval (5 min in this study).

2.3. Mathematical Model of the Flywheel–Battery Hybrid Energy Storage System

The operational state of an energy storage system is typically described by the state of charge (SOC), defined as the ratio of the remaining stored energy to its rated capacity: SOC = 1 denotes a fully charged system (no further charging), and SOC = 0 denotes complete discharge (no further discharging). To prevent overcharging and overdischarging, thereby reducing losses and extending system lifespan, the initial SOC value is set to SOCbeg = 0.5, with operational limits defined as [SOCmin, SOCmax]. The SOC dynamic calculation is expressed as
S o c ( t ) = S o c ( t 1 ) η c v η c h 0 φ Δ T P e ( t ) d t E h r ,   P e ( t ) 0 S o c ( t 1 ) η c v 0 φ Δ T P e ( t ) d t E h r η dis ,   P e ( t ) > 0
Here, Pe(t) represents the charging/discharging power, Ehr represents the rated capacity, ηcv represents the conversion efficiency of the energy storage converter, ηch and ηdis represent the charging and discharging efficiencies, ΔT represents the charge/discharge interval, and φ represents the total sampling time.

3. Research Methods

Based on the hybrid energy storage (HESS) energy management strategy proposed in this study, this section develops a flywheel–battery hybrid energy storage capacity allocation model that simultaneously considers economic efficiency and the mitigation of renewable power fluctuations.

3.1. Typical Day Extraction Using K-Means Fuzzy Clustering

To extract representative output scenarios from large-scale historical renewable power data, this study applies the fuzzy K-means clustering method to perform cluster analysis on the power curves of a wind–solar integrated system in 2024, thereby obtaining different types of typical output scenarios along with their occurrence probabilities.
In conventional K-means clustering, the presence of extreme output data tends to cause the cluster centers to shift, thereby reducing the representativeness of the typical day [35]. To address this issue, this study introduces the median cumulative fluctuation method, in which the cumulative fluctuation of all days in each cluster is calculated, the results are sorted in descending order, and the date corresponding to the median value is selected as the typical day for that cluster. This method is insensitive to extreme values and more accurately captures daily fluctuation characteristics, thereby offering higher statistical representativeness.
Classical K-means belongs to hard clustering, in which each sample can be assigned to only one cluster. In contrast, fuzzy K-means clustering introduces a fuzzy membership matrix Y, allowing each sample to belong to multiple clusters in a probabilistic manner (soft clustering). This approach demonstrates superior performance in datasets where cluster boundaries are ambiguous or inter-cluster overlap exists [36].
In the algorithm, Y denotes the membership matrix, where yij ∈ [0, 1] represents the membership of the i sample to the j class. The input data X ∈ RN×d, where N is the number of samples and d is the sample dimension. The objective function for fuzzy K-means clustering is presented as Equation (5).
min Y , U i = 1 N l = 1 K y i l r x i u l 2 2 s . t . Y 1 = 1 , Y 0
Here, Y ∈ RN×K, where K represents the number of classes, and r is a parameter that regulates the level of fuzziness, typically with r > 1. A higher value of r indicates a greater degree of fuzziness.
By using the Lagrangian multiplier method, the optimal solution expression for determining variables Y and U is as follows:
y i l = x i u l 2 2 r 1 j = 1 K x i u j 2 2 r 1
u l = i = 1 N u i l r X i i = 1 N u i l r
The objective function (5) in fuzzy K-means clustering aims to minimize the total squared weighted distances between all samples and the centroids of their respective classes. To optimize this function, an initial class center must be chosen, followed by iterative optimization of the membership matrix Y and class center U in an alternating manner until convergence. The stopping criterion is reached when
max y i l ( t ) y i l ( t 1 ) < ε
where ε is a small positive number and t is the number of iterations.
The Lloyd algorithm [37] is a widely used and straightforward strategy for minimizing the objective function outlined in the formula. In this study, the Lloyd iteration scheme was selected for its proven stable convergence on time-series renewable-power datasets, high computational efficiency in repeated clustering runs, and smooth compatibility with the fuzzy-membership weighting applied in our scenario-selection process. Its specific steps are as follows:
  • Initialization: Select K initial data points randomly from the dataset to serve as the cluster centers.
  • Assignment: Compute the distance, typically using the ℓ2-norm distance, between each data point and every cluster center. Assign each data point to the cluster with the closest center.
  • Recalculation of cluster centers: Recompute the center of each cluster by calculating the mean of all data points assigned to that cluster. This new mean becomes the updated center position.
  • Convergence check: Check if there is a significant change in the cluster centers. If the change is negligible or the maximum number of iterations is reached, the algorithm is deemed to have converged. Otherwise, return to Step 2.
  • Output results: Once convergence is achieved, present the final cluster centers and the clustering outcomes.
Lloyd’s algorithm optimizes the cluster center positions iteratively and adjusts the data point assignments to clusters until the convergence criteria are satisfied.
Building upon the conventional fuzzy K-means clustering method, this study introduces a cumulative fluctuation median approach to determine the typical day for each clustering scenario. For each cluster, the cumulative fluctuation Fcum(d) is calculated for all days:
F cum ( d ) = t P ( t + Δ t ) P ( t )
The values of Fcum(d) are then sorted in descending order, and the date corresponding to the median value is selected as the typical day for that cluster.
This method can effectively mitigate the influence of extremely high-fluctuation or low-fluctuation days on the representativeness of the typical day set, thereby providing more robust data inputs for subsequent power decomposition. The obtained set of typical daily power curves will serve as the input for the TVF-EMD decomposition method in Section 3.2, and their fluctuation characteristics will directly affect the intrinsic mode function (IMF) component allocation as well as the optimization of the energy storage system design.

3.2. TVF-EMD Decomposition Method for Power Analysis

The computational procedure of the TVF-EMD method involves the following steps:
(1)
Derivation of the instantaneous amplitude A(t) and instantaneous frequency φ t of the energy output PH(t) through the Hilbert transform.
A ( t ) = P w t 2 + P ^ w t 2
φ ( t ) = d arctan P ^ w t / P w t / d t
In these equations, P ^ w ( t ) denotes the Hilbert transform of the renewable energy output Pw (t).
(2)
Determine the sequences of local maxima and minima of the instantaneous amplitude A(t), denoted as A t m a x and A t m i n .
(3)
Conduct interpolation on A t m a x to derive β 1 ( t ) , and similarly interpolate A t m i n to obtain β 2 ( t ) . Subsequently, compute the instantaneous mean α 1 ( t ) and the instantaneous envelope α 2 ( t ) :
a 1 ( t ) = β 1 ( t ) + β 2 ( t ) 2
a 2 ( t ) = β 1 ( t ) β 2 ( t ) 2
(4)
Interpolate matrices A 2 t m i n φ t m i n and A 2 t m a x φ t m a x to derive matrices η 1 ( t ) and η 2 ( t ) , and determine the instantaneous frequency components φ 1 t and φ 2 t :
φ 1 ( t ) = η 1 ( t ) 2 a 1 2 ( t ) 2 a 1 ( t ) a 2 ( t ) + η 2 ( t ) 2 a 1 2 ( t ) + 2 a 1 ( t ) a 2 ( t )
φ 2 ( t ) = η 1 ( t ) 2 a 2 2 ( t ) 2 a 1 ( t ) a 2 ( t ) + η 2 ( t ) 2 a 2 2 ( t ) + 2 a 1 ( t ) a 2 ( t )
(5)
Compute the local cutoff frequency φ b i s t .
φ h i s = φ 1 ( t ) + φ 2 ( t ) 2
(6)
Adjust the local cutoff frequency φ b i s t to address the intermittency issue.
(7)
Compute signal h ( t ) = c o s [ φ b i s ( t )   d t ] and utilize the extremal points of h(t) as nodes for constructing a time-varying filter. Approximate the renewable energy output PH(t) using B-spline interpolation.
(8)
Evaluate the stopping criterion θ(t): if θ(t) ≤ ξ(ξ = 0.2), then PH(t) is an intrinsic mode function (IMF); otherwise, set PH 1(t) = PH fm(t) and iterate steps (1)–(8).
θ ( t ) = B L o u g h l i n ( t ) φ a v g ( t )
BLoughin(t) represents the Loughlin instantaneous bandwidth of the two-component signal; φavg(t) denotes the weighted average of the instantaneous frequency of a single component; m(t) signifies the local mean of the instantaneous envelope.
The sum of all modal components Pwi(t) obtained post-decomposition equals the renewable energy output value PH(t).
Table 2 presents the performance comparison between the proposed method and WT, EWT, EMD, VMD, SVMD, CEEMDAN, and MEMD. The TVF-EMD method demonstrates significant advantages in terms of decomposition accuracy, time-delay control, anti-mode-mixing capability, time-varying adaptability, and multi-constraint economic optimization.

3.3. Hybrid Energy Storage Power Allocation Strategy

In Section 3.2, the TVF-EMD method is applied to decompose the original renewable power output Pw(t) into intrinsic mode functions (IMFs) with different frequency characteristics. Conventional energy storage power allocation methods typically use a fixed frequency threshold to separate Pw(t) into low-frequency and high-frequency components, where the low-frequency component is directly fed into the grid to achieve output smoothing and meet scheduling requirements, and the high-frequency component is simultaneously mitigated by both power-type energy storage systems (PESSs) and energy-type energy storage systems (EESSs). However, this fixed-frequency separation method suffers from several inherent limitations, including uncontrollable mitigation capability due to the manually predefined cutoff frequency, lack of adaptability to varying fluctuation characteristics, risk of non-compliance with grid-connection standards, and restricted output stability that may fail to satisfy renewable power fluctuation rate constraints.
In this work, the renewable power output Pw(t) is decomposed via the TVF-EMD method into low-frequency and high-frequency components. The high-frequency power, after low-pass filtering, is handled by the power-type energy storage system (PESS) to rapidly compensate for short-term fluctuations, while the low-frequency power is managed by the energy-type energy storage system (EESS) to mitigate long-term trend variations, as described in Equation (18). This enables the renewable energy plant to achieve a smooth power output that satisfies grid-integration standards, while simultaneously determining the optimal configuration of the energy storage system.
P b ( t ) = k = 1 i   u k ( t ) P s c ( t ) = k = i + 1 K   u k ( t ) i 1 , 2 , , n  

3.4. Capacity Configuration Optimization Model for HESS

3.4.1. Multi-Objective Function

To balance the reliability and life-cycle economic performance of a wind–solar–storage integrated power generation system, this study develops a life-cycle cost-based optimization framework for hybrid energy storage system (HESS) sizing. The objective is to minimize the annual comprehensive cost of the HESS.
min C 1 = min C in + C pre + C om + C rec + C sv
(1)
Initial investment cost
C in = k pi P HN + k ei E HN
In Equation (20), Kpi represents the initial investment cost per unit power, Kei denotes the initial investment cost per unit capacity, PHN stands for the rated power of the hybrid energy storage system, and EHN refers to the rated capacity of the hybrid energy storage system.
(2)
Equipment renewal cost
  C pre = k = 1 n k pp P HN + k ep E HN ( 1 + r ) k T n + 1
In Equation (21), Kpp represents the replacement cost per unit of power, Kep denotes the replacement cost per unit of capacity, r stands for the reference discount rate, T signifies the service life of the energy storage system, and n indicates the number of device updates during the service life of the energy storage system.
This study employs an advanced composite flywheel incorporating magnetic suspension bearing and vacuum chamber technology. Unlike conventional bearings that rely on mechanical contact and are subject to wear, magnetic suspension bearings permit completely contact-free rotation, while the vacuum environment effectively eliminates aerodynamic drag losses. The system is capable of performing up to one million charge–discharge cycles over its full life cycle, with a depth of discharge substantially higher than that of battery energy storage systems. Its operational lifetime significantly exceeds the overall lifetime of offshore wind–PV–storage projects; therefore, the flywheel energy storage is considered maintenance-free and replacement-free throughout the project’s entire life cycle. Accordingly, the lifetime modeling in this paper focuses solely on the electrochemical energy storage component.
BESS lifetime is primarily determined by the depth of discharge (DoD) and the number of cycles. An Nth-order fitted function describes the relationship:
N = 3278 D 4 5 D 3 + 12823 D 2 14122 D + 5112
Equivalent cycle life of the battery energy storage system
N i = D 0 D i
In Equation (22), Ni represents the cycle depth for battery energy storage system cycles of i, where D0 signifies the cycle life of the battery under full charge and discharge conditions, and Di denotes the cycle life at any given charge and discharge depth.
The average daily depreciation factor of the battery energy storage system is
k d e m l = i = 1 n D i D 0
The assessment of battery energy storage system lifespan is conducted utilizing the rainflow counting method.
The service life, SBESS, of the battery energy storage system is expressed as
S BESS = j = 1 m N BESS ( x j ) 365
In Equation (25), m represents the daily discharge count of the battery energy storage system, while NBESS(xj) denotes the cycle count of the battery energy storage system at a depth of discharge xj.
The relationship between the number n of energy storage device renewals and the battery life SBESS can be expressed as
n = T S BESS
(3)
Equipment operation and maintenance cost
C om = k po P HN ( 1 + r ) T 1 r ( 1 + r ) T + t = 1 T k e o E HN ( 1 + r ) t
In Equation (23), kpo is the operation and maintenance cost per unit power, and keo is the operation and maintenance cost per unit capacity.
(4)
Equipment disposal costs
C rec = k pr P HN + k er E HN n + 1 ( 1 + r ) T
In Equation (28), kpr is the disposal cost per unit power and ker is the disposal cost per unit capacity.
(5)
Residual value of equipment
C sv = σ res C in + C pre ( 1 + r ) T
In Equation (29), σres is the residual rate.

3.4.2. Model Constraints

During the optimal capacity configuration of the hybrid energy storage system (HESS), both charge–discharge power constraints and state-of-charge (SOC) constraints must be satisfied at all times to ensure safe and reliable operation.
(1)
Charge and discharge power constraints of the energy storage system
Under normal operation of the wind–solar–storage integrated system, the rated power of the HESS is determined by the actual charging and discharging requirements of its storage subsystems, which can be expressed as
P HN = P BN + P F N
In Equation (30), PHN denotes the rated power of the HESS, PBN denotes the rated power of the BESS, and PFN denotes the rated power of the FESS.
To account for efficiency losses during charging and discharging, the output power of the HESS is adjusted as follows:
P H t = P NL ( t ) / η d P NL ( t ) < 0 P N L ( t ) η c P NL ( t ) 0
In Equation (31), ηd and ηe represent the charging and discharging efficiencies, respectively. When PNL(t) < 0, the ESS operates in discharging mode, whereas PNL(t) > 0 indicates charging mode.
The rated powers PHN, PBN, and PFN must satisfy the discharge power constraint defined in (32)
P HN = max P H t P BN = max P B t P CN = max P C t
(2)
SOC and capacity constraints of energy storage systems
To ensure safe operation, the SOC of both the BESS and FESS should be maintained within specified lower and upper bounds, given by
S O C min S O C H S O C max
In Equation (33), SOCH represents the state of charge of the HESS, SOCmin is the lower SOC limit, and SOCmax is the upper SOC limit.
Once the charging and discharging power profiles are determined from (30) to (32), the residual capacity of the storage system at each sampling instance can be computed. Given an initial capacity EH0, the capacity at time t is
E H t = E H 0 + t = 1 k P H t Δ t
In Equation (34), EH0(t) denotes the accumulated energy of the HESS at time t, EH0 is its initial energy capacity, and Δt is the sampling interval.
By considering the SOC range specified in Equation (33), the rated capacity EHN of the HESS can be determined as
E HN = E BN + E CN
While
E HN = max E H t min E H t S O C m a x S O C m i n E BN = max E B t min E B t S O C m a x S O C m i n E F N = max E C t m i n E C t S O C max S O C min  
In Equation (36), EBN and EFN represent the rated capacities of the BESS and FESS, respectively. EB(t) and EF(t)denote the capacities of the BESS and FESS at time t.

4. Case Study

4.1. Fundamental Parameters

The total installed capacity of conventional generation units (thermal and hydropower) and renewable generation units (wind and photovoltaic) in a coastal city in China is 6000 MW, of which renewable generation (wind and photovoltaic) accounts for 3500 MW. Within the same offshore area, a “wind–PV co-located” plant has an installed capacity of 150 MW—including 100 MW from the offshore wind farm and 50 MW from the offshore photovoltaic farm. In this study, the actual operating power output in 2024 from the 150 MW offshore “wind–PV co-located” plant is analyzed, with a hybrid energy storage system configured by combining electrochemical energy storage and flywheel energy storage. The capacities and relevant technical parameters of the electrochemical and flywheel energy storage systems are listed in Table 3. The economic parameters adopted in this study are based on comprehensive research of China’s energy storage market. The battery energy storage costs were integrated from large-scale project bidding prices and reference data from design institutes, while the flywheel energy storage costs were derived from quotations for megawatt-scale solutions provided by domestic suppliers.
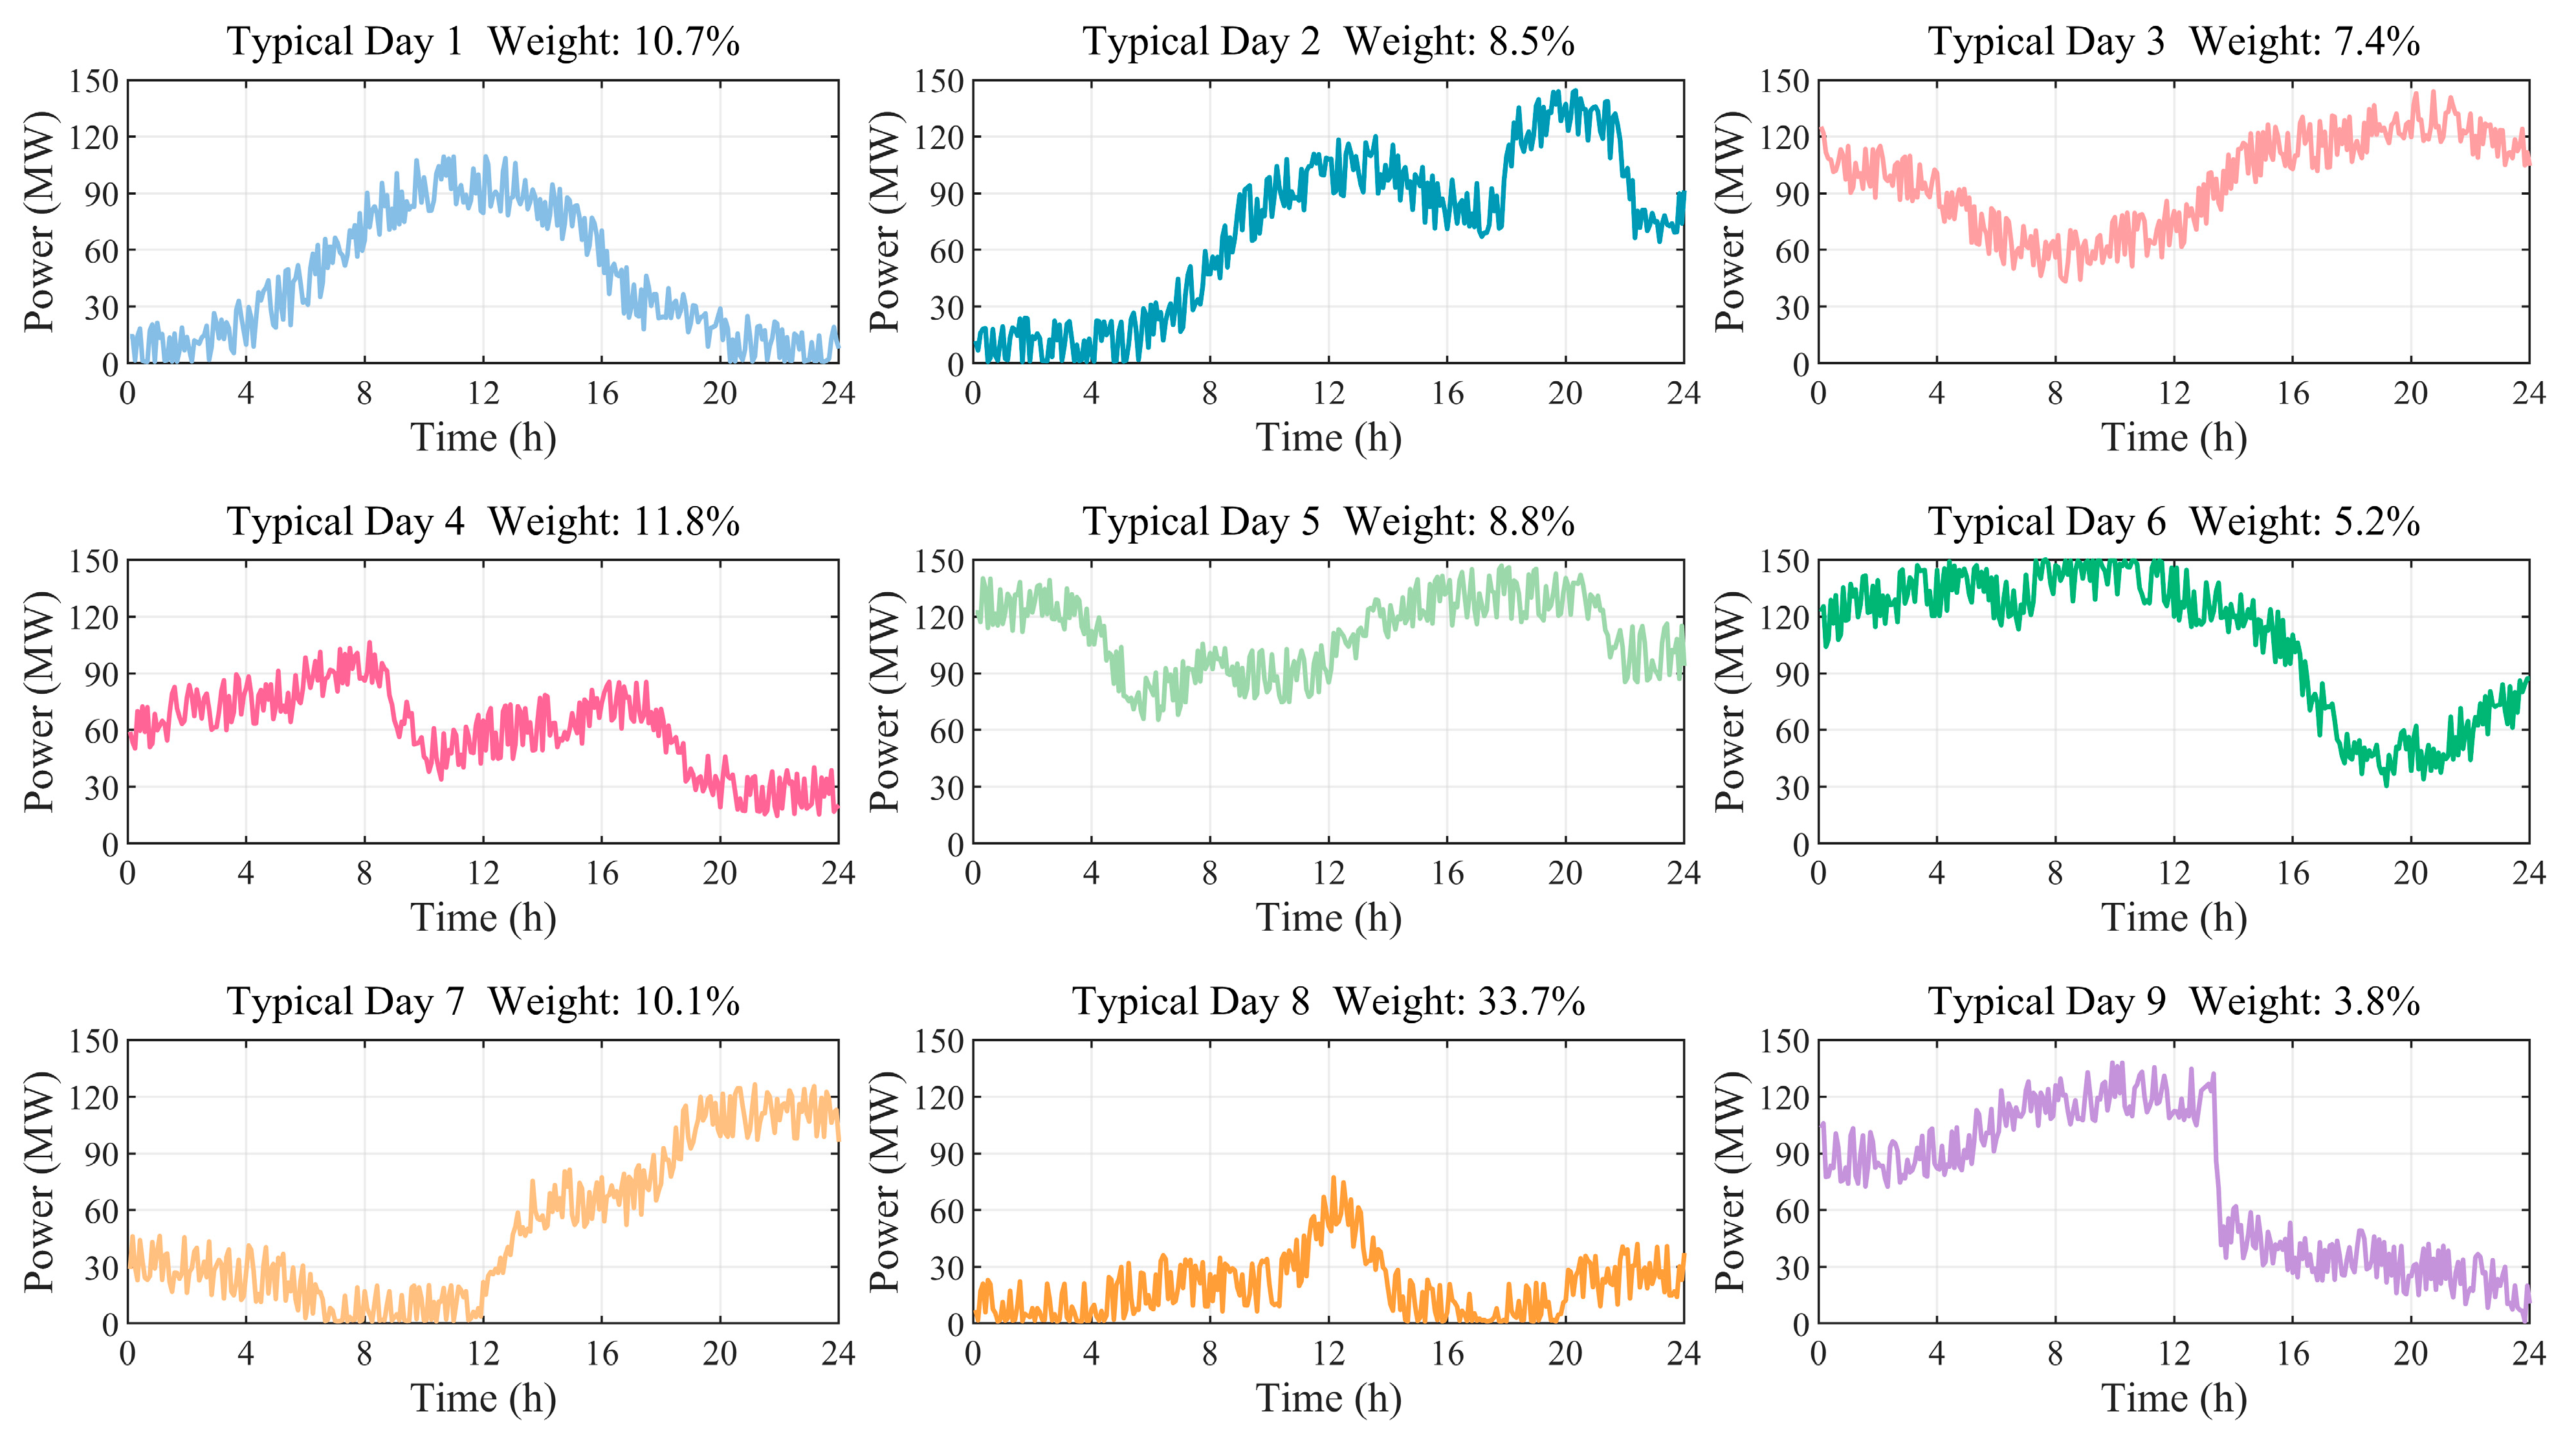
In this study, the K-means fuzzy clustering algorithm is first applied to the actual power output data in 2024 from a 150 MW offshore wind–PV co-located plant in the target region. The annual dataset is clustered into nine renewable power output scenarios, with the number of days and probability corresponding to each scenario determined accordingly to Table 4, Figure 2 and Figure 3.
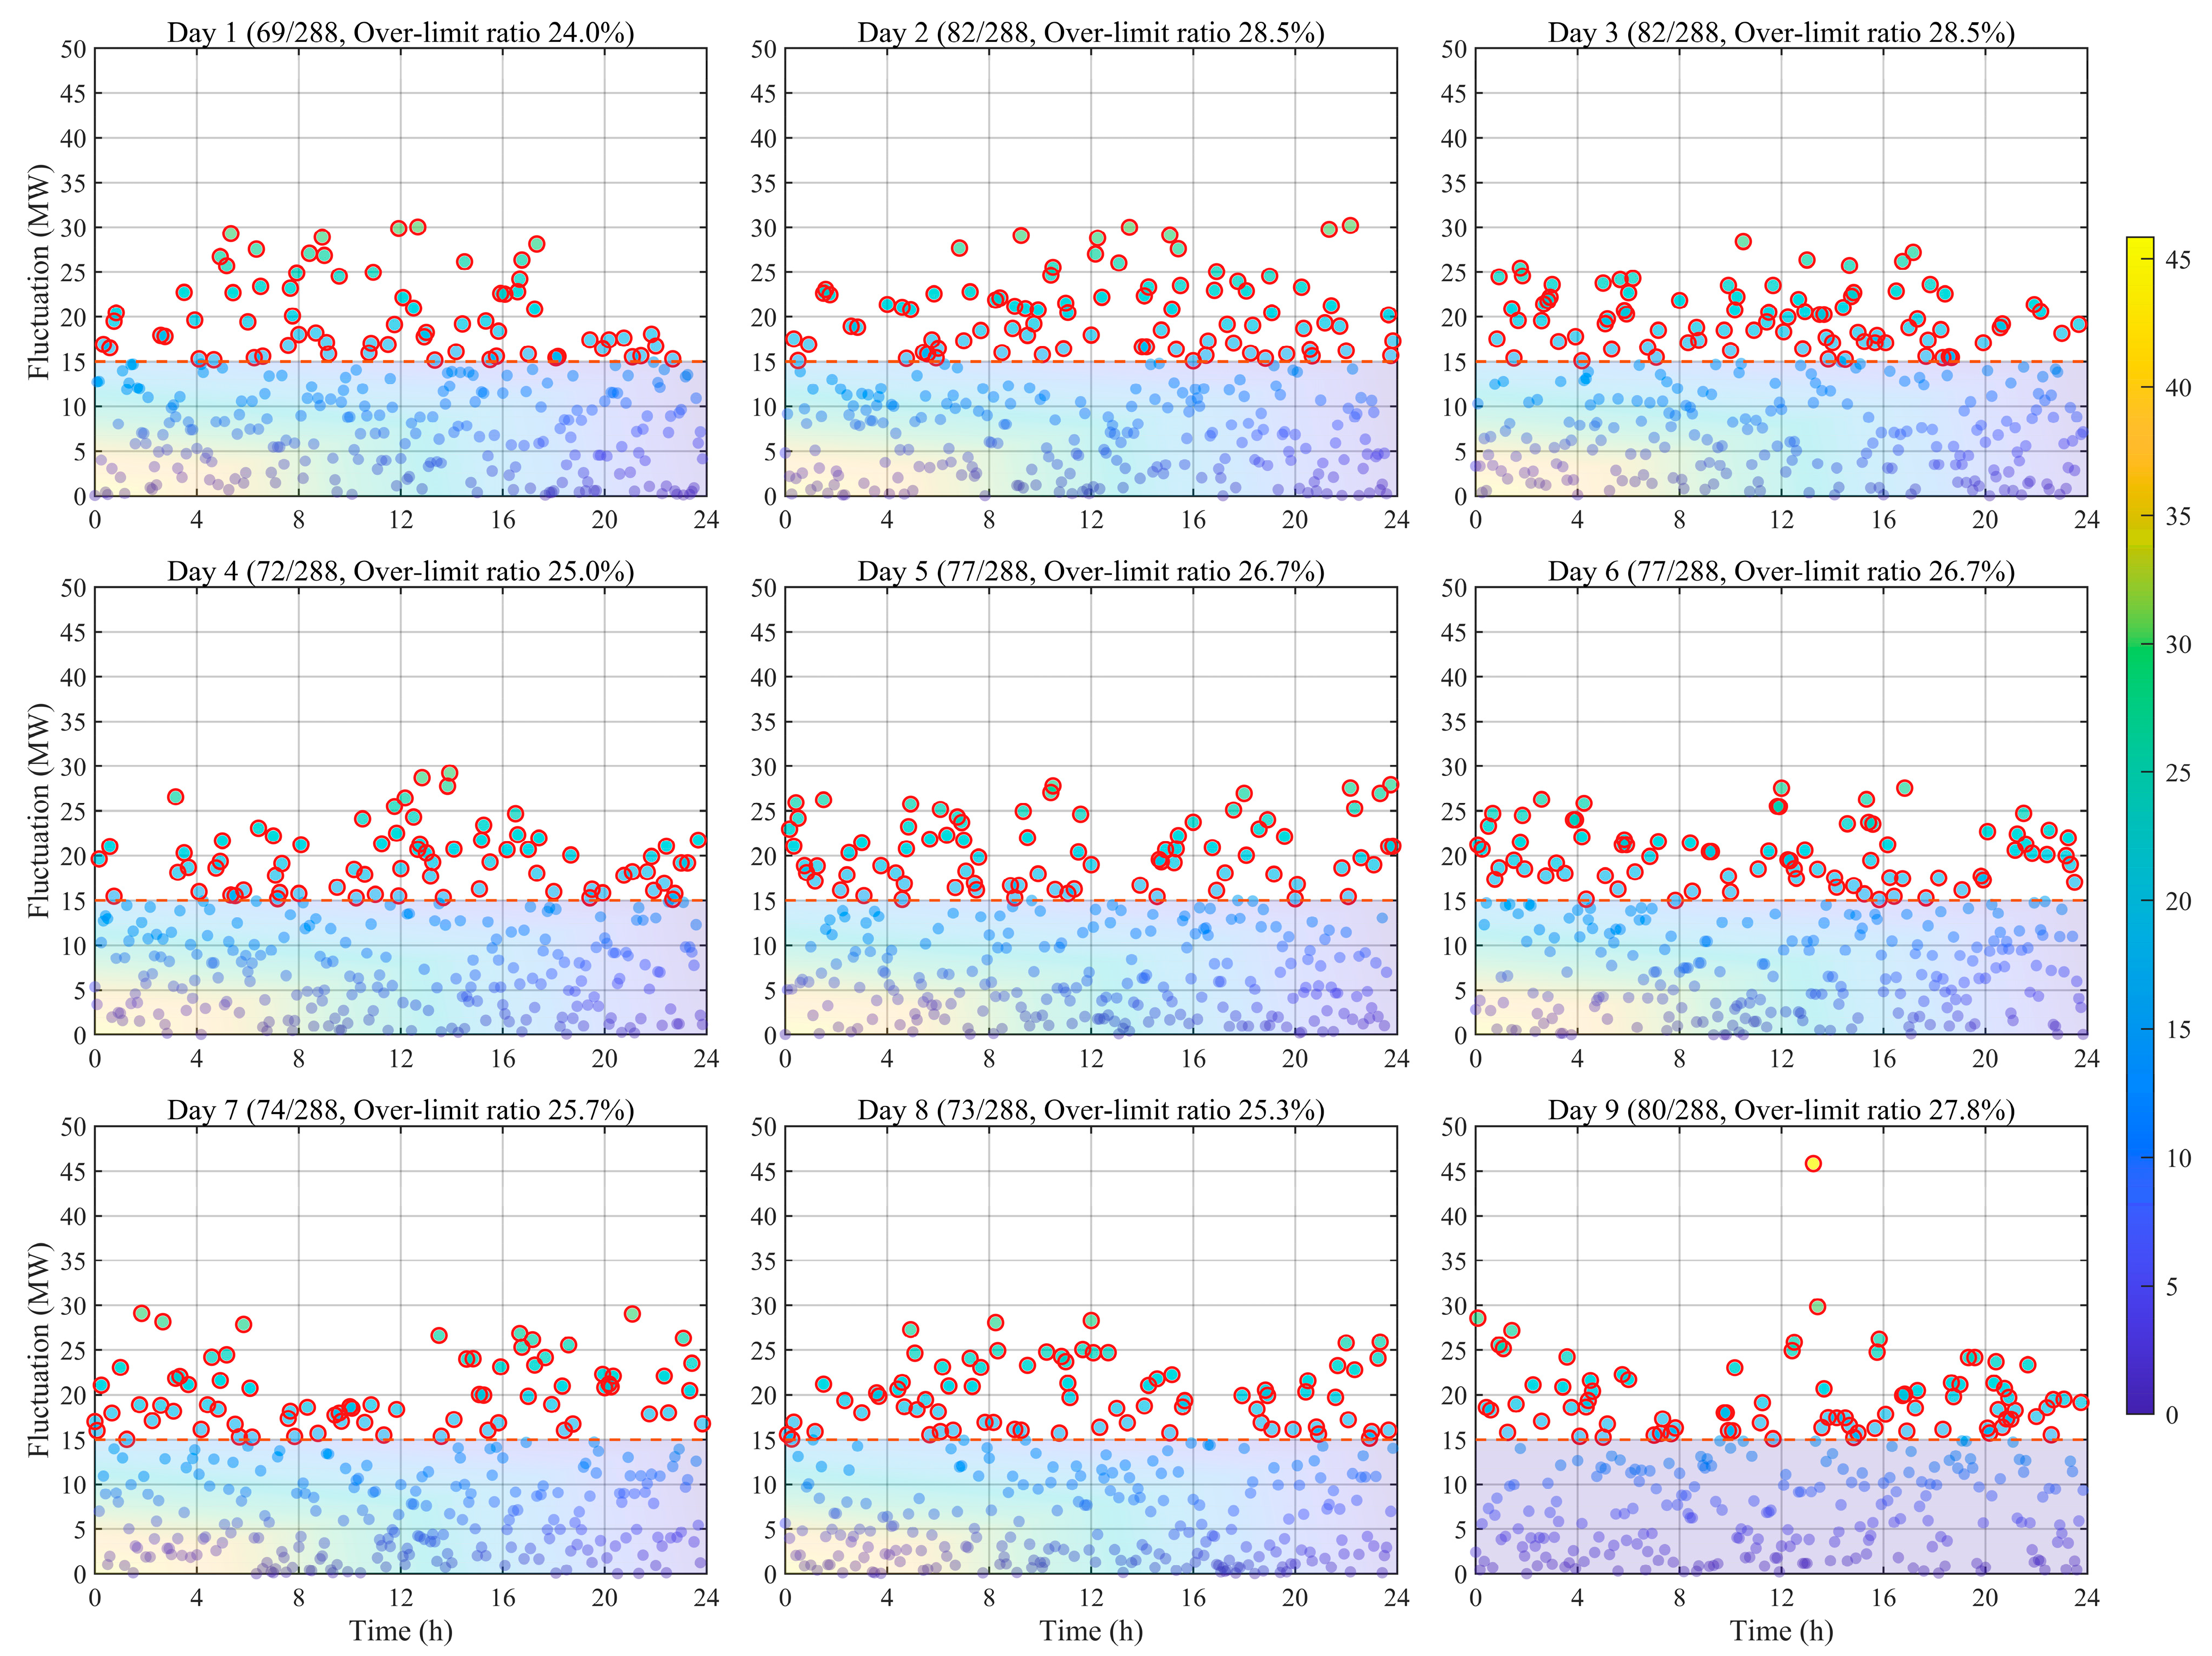
Figure 4 illustrates the power fluctuation amplitude and the over-limit rate for each typical day. The fluctuation limit for grid-connected power is set to 15 MW (indicated by the red dashed line in the figure), determined as 10% of the installed capacity. For clarity, the fluctuation points exceeding this limit are highlighted with red circles.
Table 4 and Figure 2, Figure 3 and Figure 4 present the statistical results of nine typical-day scenarios obtained through K-means fuzzy clustering.
In the clustered results, Scenario 1 occurred on 39 days, accounting for 10.7% of the year, with 69 limit-exceeding data points and an exceedance rate of 24.0%. Scenario 2 occurred on 31 days (8.5%), with 82 exceedance points and an exceedance rate of 28.5%. Scenario 3 occurred on 27 days (7.4%), with 82 exceedance points and an exceedance rate of 28.5%. Scenario 4 occurred on 43 days (11.8%), with 72 exceedance points and an exceedance rate of 25.0%. Scenario 5 occurred on 32 days (8.8%), with 77 exceedance points and an exceedance rate of 26.7%. Scenario 6 occurred on 19 days (5.2%), with 77 exceedance points and an exceedance rate of 26.7%. Scenario 7 occurred on 37 days (10.1%), with 74 exceedance points and an exceedance rate of 25.7%. Scenario 8 occurred on 123 days (33.7%), with 73 exceedance points and an exceedance rate of 25.3%. Scenario 9 occurred on 14 days (3.8%), with 80 exceedance points and an exceedance rate of 27.8%.
In terms of scenario distribution, the results exhibit pronounced non-uniformity. Scenario 8 represents the most typical annual output pattern, occurring on as many as 123 days with a probability of 33.7%. Scenario 4 and Scenario 1 account for 11.8% and 10.7%, respectively, also occupying significant shares. In contrast, Scenario 9 is a low-probability extreme case, with an annual occurrence rate of only 3.8%.
In terms of fluctuation characteristics, noticeable differences are observed among scenarios. Scenarios 2 and 3 exhibit the most pronounced fluctuations, each with an exceedance rate of 28.5%. Scenarios 5, 6, and 9 also have exceedance rates exceeding 26%, classifying them as high-fluctuation types. By contrast, Scenario 1 shows the most stable output, with the lowest exceedance rate (24.0%). The most frequently occurring scenario, Scenario 8, features a moderate fluctuation level (25.3%), indicating that the system most often operates under moderately fluctuating conditions. Overall, the clustering results effectively summarize the diversity of year-round operational data, providing comprehensive and statistically representative input scenarios for hybrid energy-storage system capacity optimization.

4.2. Power Allocation and Renewable Output Smoothing in Different Scenarios

Given the significant advantages of the time-varying filter empirical mode decomposition (TVF-EMD) method in wind power decomposition and energy storage capacity allocation, this study performs simulation experiments based on the actual 2024 offshore wind–PV co-located plant power data. The optimization performance of the hybrid energy storage system is evaluated in terms of fluctuation suppression effectiveness, capacity allocation rationality, and economic efficiency.
For each typical day, the fluctuation limit of grid-connected power is set to 15 MW, which serves as the threshold for distinguishing between low- and high-frequency components. Using the adaptive time-varying filter empirical mode decomposition (TVF-EMD) method, the original power curve is decomposed into low-frequency (LF) and high-frequency (HF) components, effectively avoiding mode mixing.
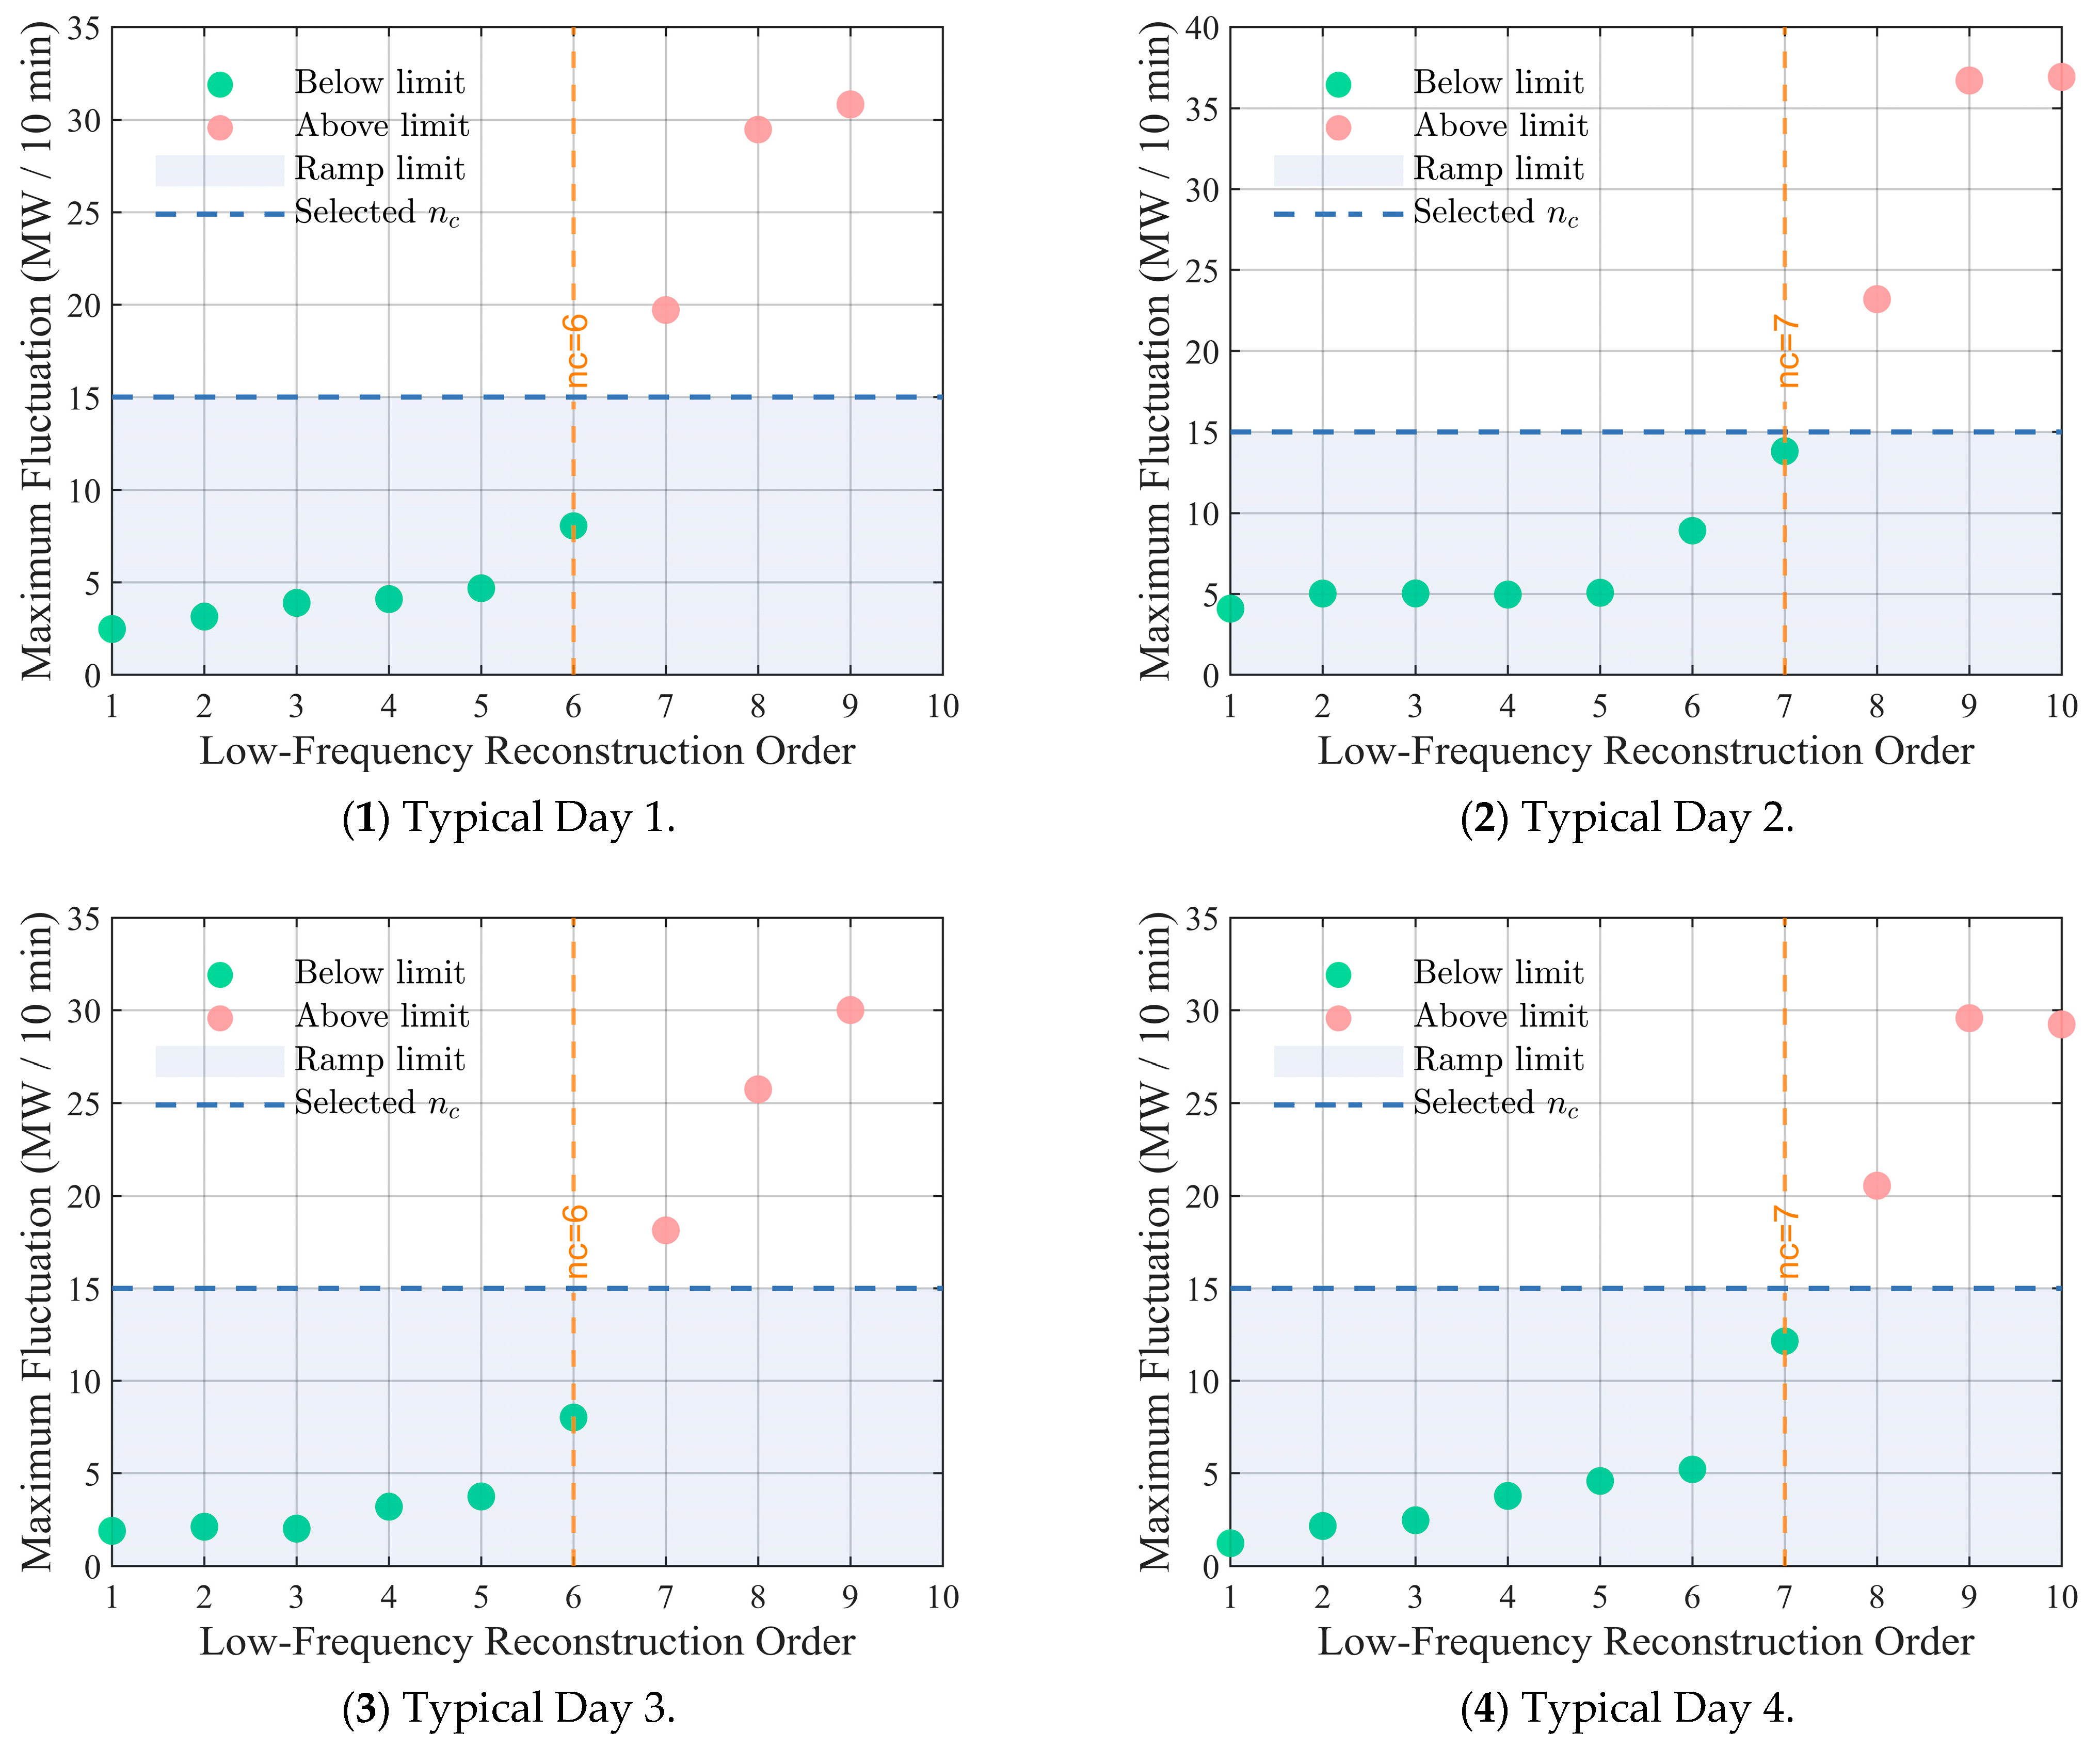
As illustrated in Figure 5, taking Typical Days 2 and 4 as examples, the cumulative LF component up to c2f(8) exhibits a fluctuation amplitude exceeding the threshold (see Figure 6). Therefore, c2f(7)—comprising the original residual term and IMF7 through IMF1—is defined as the LF component and is smoothed by the battery energy storage system (BESS). The HF component, consisting of IMF10 + IMF9 + IMF8, is regulated in real time by the flywheel energy storage system (FESS).
Similarly, for Typical Days 1 and 3, the cumulative LF component up to c2f(6) exhibits a fluctuation amplitude exceeding the threshold (see Figure 6). Thus, c2f(6)—comprising the original residual term and IMF6 through IMF1—is taken as the LF component for smoothing by the BESS, while the HF component, consisting of IMF10 + IMF9 + IMF8 + IMF7, is rapidly compensated by the FESS. The original power curves and their corresponding HF and LF components for all typical days are shown in Figure 7.
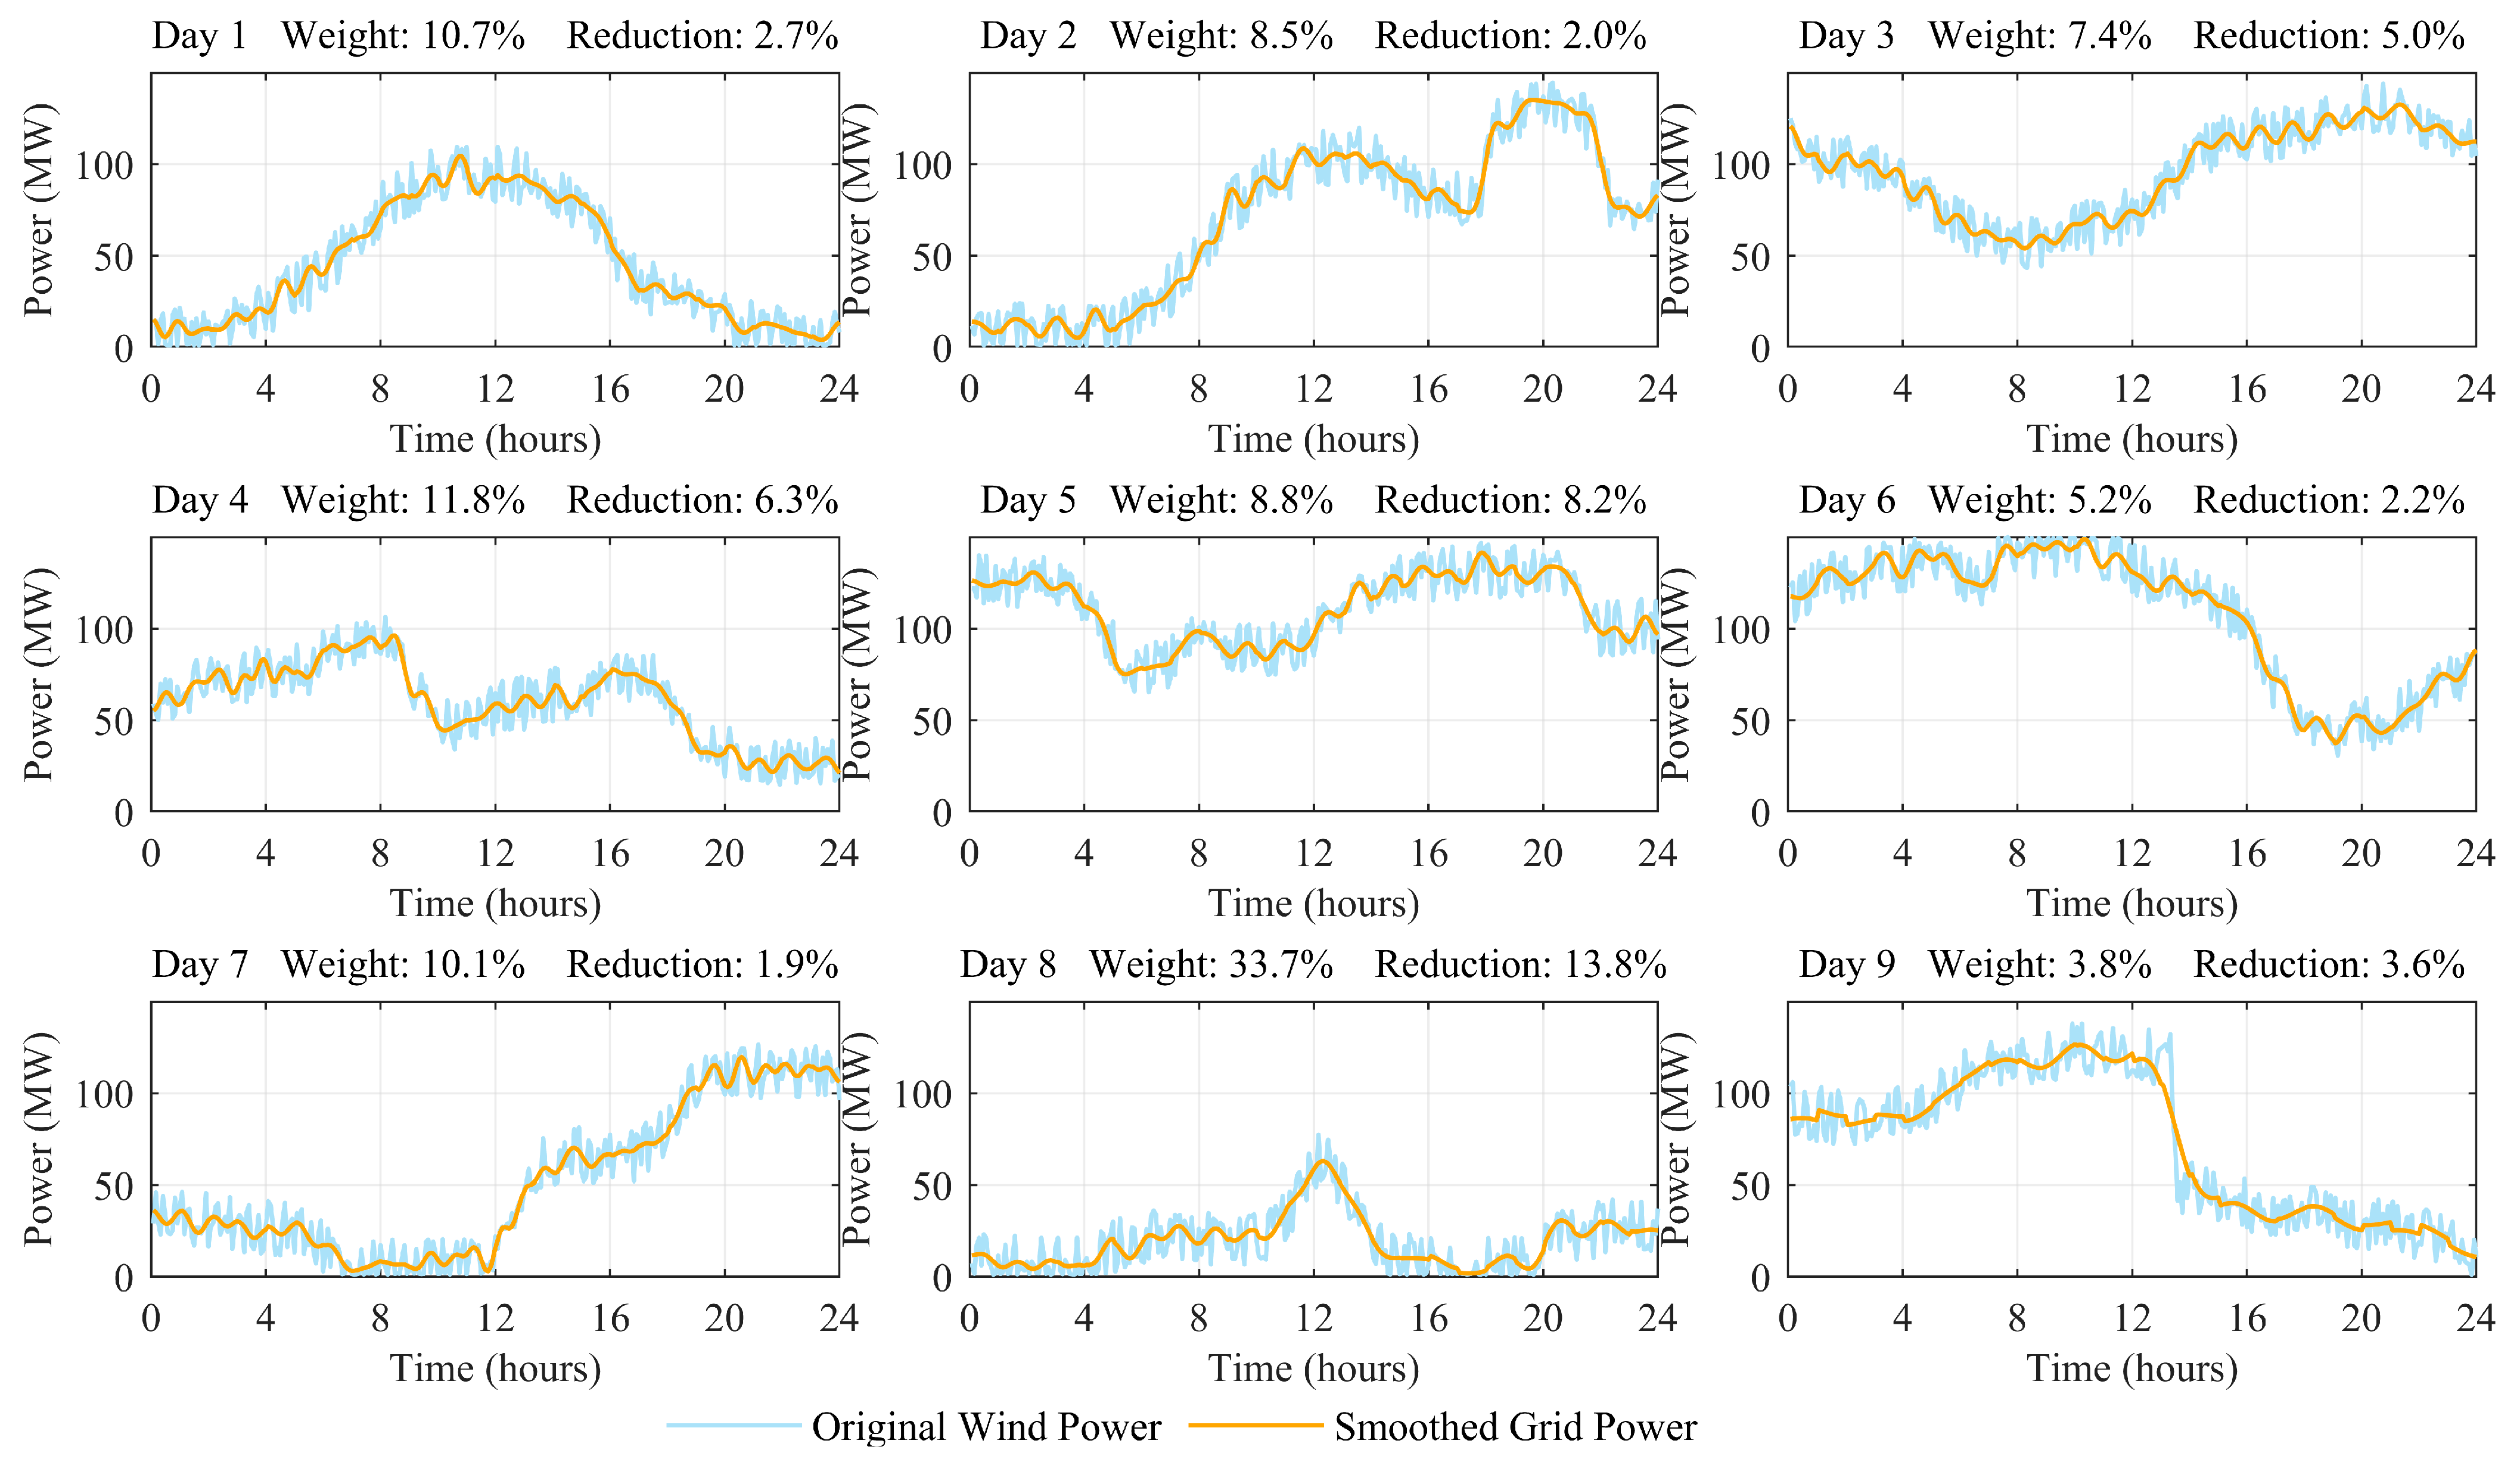
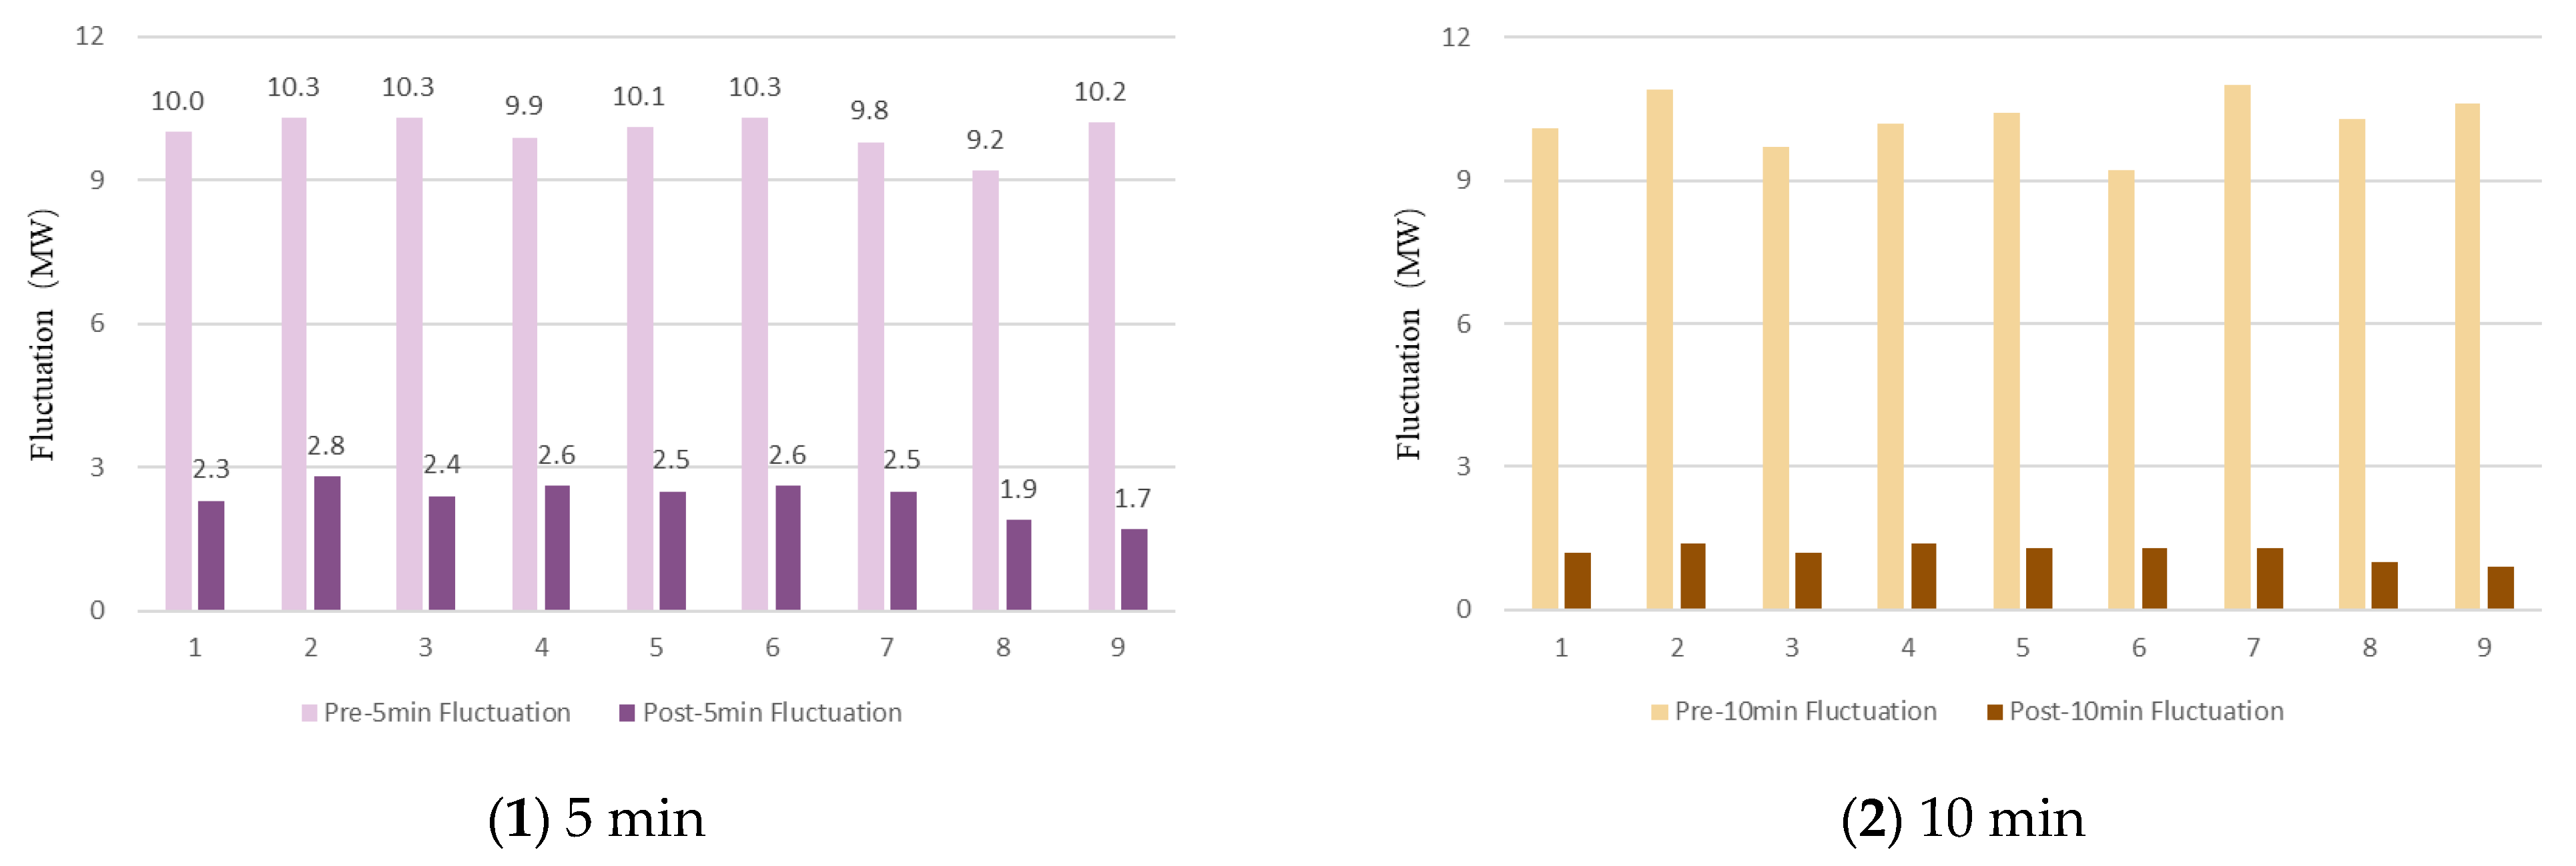
Based on the proposed power allocation strategy, the HF components are mitigated by the FESS, while the LF components are smoothed by the BESS. The power curves before and after smoothing, together with the fluctuation suppression results for each typical day, are presented in Figure 8 and Figure 9, and Table 5.
Typical Day 1 occurred with a weight of 10.7% over the 365 days of the year. After smoothing, the average fluctuation reduction ratio decreased by 2.7%, and the maximum single-point fluctuation decreased by 7.2%. The pre-smoothing 5 min average fluctuation value was 10.0 MW, while the post-smoothing value was 2.3 MW, representing a reduction of 7.7 MW. The pre-smoothing 10 min average fluctuation value was 10.1 MW, and the post-smoothing value was 1.2 MW, representing a reduction of 8.9 MW.
Typical Day 2 occurred with a weight of 8.5%. After smoothing, the average fluctuation reduction ratio decreased by 2.0%, and the maximum single-point fluctuation decreased by 9.4%. The pre-smoothing 5 min average fluctuation was 10.3 MW, and the post-smoothing value was 2.8 MW, representing a reduction of 7.5 MW. The pre-smoothing 10 min average fluctuation was 10.9 MW, and the post-smoothing value was 1.4 MW, representing a reduction of 9.5 MW.
Typical Day 3 occurred with a weight of 7.4%. After smoothing, the average fluctuation reduction ratio decreased by 5.0%, and the maximum single-point fluctuation decreased by 21.9%. The pre-smoothing 5 min average fluctuation was 10.3 MW, and the post-smoothing value was 2.4 MW, representing a reduction of 7.9 MW. The pre-smoothing 10 min average fluctuation was 9.7 MW, and the post-smoothing value was 1.2 MW, representing a reduction of 8.5 MW.
Typical Day 4 occurred with a weight of 11.8%. After smoothing, the average fluctuation reduction ratio decreased by 6.3%, and the maximum single-point fluctuation decreased by 18.0%. The pre-smoothing 5 min average fluctuation was 9.9 MW, and the post-smoothing value was 2.6 MW, representing a reduction of 7.3 MW. The pre-smoothing 10 min average fluctuation was 10.2 MW, and the post-smoothing value was 1.4 MW, representing a reduction of 8.8 MW.
Typical Day 5 occurred with a weight of 8.8%. After smoothing, the average fluctuation reduction ratio decreased by 8.2%, and the maximum single-point fluctuation decreased by 18.5%. The pre-smoothing 5 min average fluctuation was 10.1 MW, and the post-smoothing value was 2.5 MW, representing a reduction of 7.6 MW. The pre-smoothing 10 min average fluctuation was 10.4 MW, and the post-smoothing value was 1.3 MW, representing a reduction of 9.1 MW.
Typical Day 6 occurred with a weight of 5.2%. After smoothing, the average fluctuation reduction ratio decreased by 2.2%, and the maximum single-point fluctuation decreased by 6.5%. The pre-smoothing 5 min average fluctuation was 10.3 MW, and the post-smoothing value was 2.6 MW, representing a reduction of 7.7 MW. The pre-smoothing 10 min average fluctuation was 9.2 MW, and the post-smoothing value was 1.3 MW, representing a reduction of 7.9 MW.
Typical Day 7 occurred with a weight of 10.1%. After smoothing, the average fluctuation reduction ratio decreased by 1.9%, and the maximum single-point fluctuation decreased by 6.9%. The pre-smoothing 5 min average fluctuation was 9.8 MW, and the post-smoothing value was 2.5 MW, representing a reduction of 7.3 MW. The pre-smoothing 10 min average fluctuation was 11.0 MW, and the post-smoothing value was 1.3 MW, representing a reduction of 9.7 MW.
Typical Day 8 occurred with a weight of 33.7%. After smoothing, the average fluctuation reduction ratio decreased by 13.8%, and the maximum single-point fluctuation decreased by 19.9%. The pre-smoothing 5 min average fluctuation was 9.2 MW, and the post-smoothing value was 1.9 MW, representing a reduction of 7.3 MW. The pre-smoothing 10 min average fluctuation was 10.3 MW, and the post-smoothing value was 1.0 MW, representing a reduction of 9.3 MW.
Typical Day 9 occurred with a weight of 3.8%. After smoothing, the average fluctuation reduction ratio decreased by 3.6%, and the maximum single-point fluctuation decreased by 15.5%. The pre-smoothing 5 min average fluctuation was 10.2 MW, and the post-smoothing value was 1.7 MW, representing a reduction of 8.5 MW. The pre-smoothing 10 min average fluctuation was 10.6 MW, and the post-smoothing value was 0.9 MW, representing a reduction of 9.7 MW.
Across all typical days, the renewable power delivered to the grid remained within the fluctuation limit at all time scales after smoothing by the hybrid energy storage system. This result confirms both the effectiveness and practicality of the proposed power allocation strategy in suppressing renewable output variability.

4.3. Results of Optimal Sizing for Hybrid Energy Storage Systems

To verify the effectiveness of the proposed TVF-EMD-based power allocation method in hybrid energy storage optimization, both the conventional EMD algorithm and the TVF-EMD algorithm were applied to decompose and reconstruct the system output power of a 150 MW offshore wind–PV co-located plant. Based on the technical characteristics of the battery energy storage system (BESS) and the flywheel energy storage system (FESS), two hybrid BESS–FESS configurations were designed, with the parameters of BESS–FESS listed in Table 3, which are considered reasonable and of high engineering applicability. The optimized storage capacities for the two configurations are presented in Table 6. The results demonstrate that the proposed TVF-EMD-based configuration scheme requires significantly lower rated power, energy capacity, and total cost compared to the configuration based on the traditional EMD algorithm.

5. Conclusions

To address the impact of large-scale renewable power fluctuations on the secure and stable operation of the grid in the coordinated operation of offshore wind and offshore photovoltaic (PV) systems, this study proposes a renewable power smoothing method based on a hybrid energy storage system (HESS). First, the K-means fuzzy clustering algorithm is applied to extract typical daily power curves. Subsequently, the time-varying filter empirical mode decomposition (TVF-EMD) method is employed to optimize the power allocation within the HESS, assigning high-frequency power components to the flywheel energy storage system (FESS) for rapid fluctuation suppression and low-frequency power components to the battery energy storage system (BESS) for steady regulation. Simulation analysis under an offshore wind–solar co-location coordinated-operation scenario demonstrates that the proposed strategy not only significantly reduces the fluctuation amplitude of grid-connected renewable power but also effectively leverages the technical complementarity between the BESS and FESS, achieving unified optimization of energy storage capacity allocation and economic performance. The proposed method can achieve simultaneous improvements in capacity optimization and operational cost-effectiveness across hybrid power plants of different scales. By adjusting configuration parameters such as the number of clusters, decomposition settings, and cost models, it can be adapted to various system sizes and application scenarios, thereby fully leveraging the technical and economic advantages of hybrid energy storage systems while also delivering positive environmental effects. Future research will enhance the current framework from three dimensions: first, by developing a multi-objective optimization model that integrates environmental impact data with artificial intelligence algorithms to enable precise quantification of the comprehensive value of energy storage systems; next, by conducting systematic assessments of the method’s temporal and spatial adaptability through multi-year datasets and cross-climate zone validation; and finally, by performing sensitivity analyses on the prices of key components and electricity tariff policies to strengthen the practical applicability and engineering guidance value of the results.

Author Contributions

Conceptualization—C.T. and Q.Z.; methodology—C.T., Q.Z., and D.M.; validation—C.T. and Z.L.; investigation—C.T., D.M., Z.L., and X.Z.; data curation—C.T. and D.M.; writing—C.T., Z.L., and E.C.; writing—review and editing—Q.Z. and E.C.; supervision—C.T. and Q.Z.; project administration—Q.Z. and X.Z. All authors have read and agreed to the published version of the manuscript.

Funding

This research was funded by the following grant: State Grid Corporation of China project, “Research on Application and Design of Flywheel-Based Synchronous Condensers for Transient Control in Modern Power Systems” (Project No. 5500-202399516A-3-2-ZN).

Data Availability Statement

The original contributions presented in this study are included in the article. Further inquiries can be directed to the corresponding author.

Conflicts of Interest

Authors Zhengping Li and Erqiang Chen were employed by the company State Grid Henan Electric Power Research Institute Co., Ltd. The remaining authors declare that the research was conducted in the absence of any commercial or financial relationships that could be construed as a potential conflict of interest.

References

  1. Vallarta-Serrano, S.I.; Santoyo-Castelazo, E.; Santoyo, E.; García-Mandujano, E.O.; V’azquez-Sa’nchez, H. Integrated sustainability assessment framework of industry 4.0 from an energy systems thinking perspective: Bibliometric analysis and systematic literature review. Energies 2023, 16, 5440. [Google Scholar] [CrossRef]
  2. Kabeyi, M.J.B.; Olanrewaju, O.A. Sustainable energy transition for renewable and low carbon grid electricity generation and supply. Front. Energy Res. 2022, 9, 743114. [Google Scholar] [CrossRef]
  3. Calero, F.; Canizares, C.; Bhattacharya, K. Dynamic Modelling of Battery Energy Storage and Applications in Transmission Systems. IEEE Trans. Smart Grid 2021, 12, 589–598. [Google Scholar] [CrossRef]
  4. Rouholamini, M.; Wang, C.; Nehrir, H.; Hu, X.; Hu, Z.; Aki, H.; Zhao, B.; Miao, X.; Strunz, K. A Review of Modelling Management and Applications of Grid Connected Li-ion Battery Storage Systems. IEEE Trans. Smart Grid 2022, 13, 4505–4524. [Google Scholar] [CrossRef]
  5. Emrani, A.; Berrada, A. A Comprehensive Review on Techno-economic Assessment of Hybrid Energy Storage Systems Integrated with Renewable Energy. Energy Storage 2024, 84, 111010. [Google Scholar] [CrossRef]
  6. Kandari, R.; Neeraj, N.; Micallef, A. Review on Recent Strategies for Integrating Energy Storage Systems in Microgrids. Energies 2023, 16, 317. [Google Scholar] [CrossRef]
  7. Raveendhra, D.; Poojitha, R.; Narasimharaju, B.L.; Dreglea, A.; Liu, F.; Panasetsky, D.; Pathak, M.; Sidorov, D. Part-I: State-of-theArt Technologies of Solar Powered DC Microgrid with Hybrid Energy Storage Systems-Architecture Topologies. Energies 2023, 16, 923. [Google Scholar] [CrossRef]
  8. Yim, J.; You, S.; Blaabjerg, F.; Lee, Y.; Gui, Y.; Kim, W. Energy Management Systems for Forecasted Demand Error Compensation using Hybrid Energy Storage System in Nanogrid. Renew. Energy 2024, 221, 119744. [Google Scholar] [CrossRef]
  9. Tooryan, F.; HassanzadehFard, H.; Collins, E.R.; Jin, S.; Ramezani, B. Smart integration of renewable energy resources, electrical, and thermal energy storage in microgrid applications. Energy 2020, 212, 118716. [Google Scholar] [CrossRef]
  10. Wen, S.; Gong, Y.; Mu, X.; Zhao, S.; Wang, C. Optimal Configuration of Flywheel–Battery Hybrid Energy Storage System for Smoothing Wind–Solar Power Generating Fluctuation. Energies 2025, 18, 2055. [Google Scholar] [CrossRef]
  11. Elalfy, D.A.; Gouda, E.; Kotb, M.F.; Bureš, V.; Sedhom, B.E. Comprehensive Review of Energy Storage Systems Technologies, Objectives, Challenges, and Future Trends. Energy Strategy Rev. 2024, 54, 101482. [Google Scholar] [CrossRef]
  12. Papageorgiou, P.G.; Oureilidis, K.O.; Christoforidis, G.C. A Systematic Review of Hybrid Superconducting Magnetic/battery energy storage systems: Applications, Control Strategies, Benefits, Limitations and Future Prospects. Renew. Sustain. Energy Rev. 2023, 183, 113436. [Google Scholar] [CrossRef]
  13. Etim, N.-B.B.; Giaouris, D. Probabilistic adaptive power pinch analysis for islanded hybrid energy storage systems. Energy Storage 2022, 54, 105224. [Google Scholar] [CrossRef]
  14. Wang, Y.; Zhang, Y.; Xue, L.; Liu, C.; Song, F.; Sun, Y.; Liu, Y.; Che, B. Research on planning optimization of integrated energy system based on the differential features of hybrid energy storage system. Energy Storage 2022, 55, 105368. [Google Scholar] [CrossRef]
  15. Dong, H.; Fu, Y.; Jia, Q.; Wen, X. Optimal dispatch of integrated energy microgrid considering hybrid structured electric-thermal energy storage. Renew. Energy 2022, 199, 628–639. [Google Scholar] [CrossRef]
  16. Zhu, F.; Zhou, X.; Zhang, Y.; Xu, D.; Fu, J. A load frequency control strategy based on disturbance reconstruction for multi-area interconnected power system with hybrid energy storage system. Energy Rep. 2021, 7, 8849–8857. [Google Scholar] [CrossRef]
  17. Sutikno, T.; Arsadiando, W.; Wangsupphaphol, A.; Yudhana, A.; Facta, M. A Review of Recent Advances on Hybrid Energy Storage System for Solar Photovoltaics Power Generation. IEEE Access 2022, 10, 42346–42364. [Google Scholar] [CrossRef]
  18. Babu, T.S.; Vasudevan, K.R.; Ramachandaramurthy, V.K.; Sani, S.B.; Chemud, S.; Lajim, R.M. A Comprehensive Review of Hybrid Energy Storage Systems: Converter Topologies, Control Strategies and Future Prospects. IEEE Access 2020, 8, 148702–148721. [Google Scholar] [CrossRef]
  19. Gupta, R.; Singh, A.; Singh, R. Environmental benefits of battery and flywheel hybrid storage in renewable microgrids. Energy 2021, 236, 121497. [Google Scholar] [CrossRef]
  20. Huang, N.E.; Shen, Z.; Long, S.R.; Wu, M.C.; Shih, H.H.; Zheng, Q.; Yen, N.-C.; Tung, C.C.; Liu, H.H. The empirical mode decomposition and the Hilbert spectrum for nonlinear and non-stationary time series analysis. Proc. R. Soc. Lond. A 1998, 454, 903–995. [Google Scholar] [CrossRef]
  21. Yang, X.; Ye, X.; Li, Z.; Wang, X.; Song, X.; Liao, M.; Liu, X.; Guo, Q. Hybrid energy storage configuration method for wind power microgrid based on EMD decomposition and two-stage robust approach. Sci. Rep. 2024, 14, 2733. [Google Scholar] [CrossRef]
  22. Zhang, J.; Hu, Y. Optimization Strategy for Hybrid Energy Storage Power Distribution Based on Fuzzy Control. J. Phys. Conf. Ser. 2020, 1549, 052115. [Google Scholar] [CrossRef]
  23. Wang, J.; Wang, X.; Chen, H.; Gao, Y.; Chen, H.; Liu, W.; Sun, Y.; Zhang, L. Capacity configuration of a hybrid energy storage system for the fluctuation mitigation and frequency regulation of wind power based on Aquila Optimizer and Variational Mode Decomposition. Energy 2025, 330, 136894. [Google Scholar] [CrossRef]
  24. Chen, C.; Tang, W.; Xia, Y.; Chen, C. Hybrid-Energy Storage Optimization Based on Successive Variational Mode Decomposition and Wind Power Frequency Modulation Power Fluctuation. Energies 2024, 17, 4391. [Google Scholar] [CrossRef]
  25. Gao, X.; Wang, L.; Sun, H.; Tian, J.; Wang, Z.; Jiang, J.; Guo, W. Research on optimal configuration of hybrid energy storage system based on improved CEEMDAN. Energy Rep. 2021, 7, 1308–1318. [Google Scholar] [CrossRef]
  26. Wu, T.; Shi, X.; Liao, L.; Zhou, C.; Zhou, H.; Su, Y. A capacity configuration control strategy to alleviate power fluctuation of hybrid energy storage system based on improved particle swarm optimization. Energies 2019, 12, 3498. [Google Scholar] [CrossRef]
  27. Chen, J.; Li, J.; Zhang, Y.; Bao, G.; Ge, X.; Li, P. A hierarchical optimal operation strategy of hybrid energy storage system in distribution networks with high photovoltaic penetration. Energies 2018, 11, 2637. [Google Scholar] [CrossRef]
  28. Akter, A.; Zafir, E.I.; Dana, N.H.; Joysoyal, R.; Sarker, S.K.; Li, L.; Muyeen, S.M.; Das, S.K.; Kamwa, I. A review on microgrid optimization with meta-heuristic techniques: Scopes, trends and recommendation. Energy Strategy Rev. 2024, 51, 101298. [Google Scholar] [CrossRef]
  29. Wang, Y.L.; Song, F.H.; Ma, Y.Z.; Zhang, Y.; Yang, J.; Liu, Y.; Zhang, F.; Zhu, J. Research on capacity planning and optimization of regional integrated energy system based on hybrid energy storage system. Appl. Therm. Eng. 2020, 180, 115834. [Google Scholar] [CrossRef]
  30. Li, H.; Li, Z.; Mo, W. A time-varying filter approach for empirical mode decomposition. Signal Process. 2017, 138, 146–158. [Google Scholar] [CrossRef]
  31. GB/T 19963-2011; Technical Rule for Connecting Wind Farm to Power System—Part 1: Onshore Wind. National Standardization Management Committee: Beijing, China, 2011.
  32. Q/GDW 1617-2015; Technical Rule for Connecting Photovoltaic Power Station to Power Grid. State Grid Corporation of China: Beijing, China, 2015.
  33. IEEE Std 1547-2018; IEEE Standard for Interconnection and Interoperability of Distributed Energy Resources with Associated Electric Power Systems Interfaces. IEEE: Piscataway, NJ, USA, 2018.
  34. ENTSO-E Requirements for Generators; European Network of Transmission System Operators for Electricity: Brussels, Belgium, 2016.
  35. Huang, S. Capacity Optimization Configuration of Hybrid Energy Storage Systems for Wind Farms Based on Improved k-means and Two-Stage Decomposition. Energies 2025, 18, 795. [Google Scholar] [CrossRef]
  36. Nie, F.; Xue, J.; Wu, D.; Wang, R.; Li, H.; Li, X. Coordinate descent method for k-means. IEEE Trans. Pattern Anal. Mach. Intell. 2022, 44, 2371–2385. [Google Scholar] [CrossRef] [PubMed]
  37. Lloyd, S.P. Least squares quantization in PCM. IEEE Trans. Inf. Theory 1982, 28, 129–136. [Google Scholar] [CrossRef]
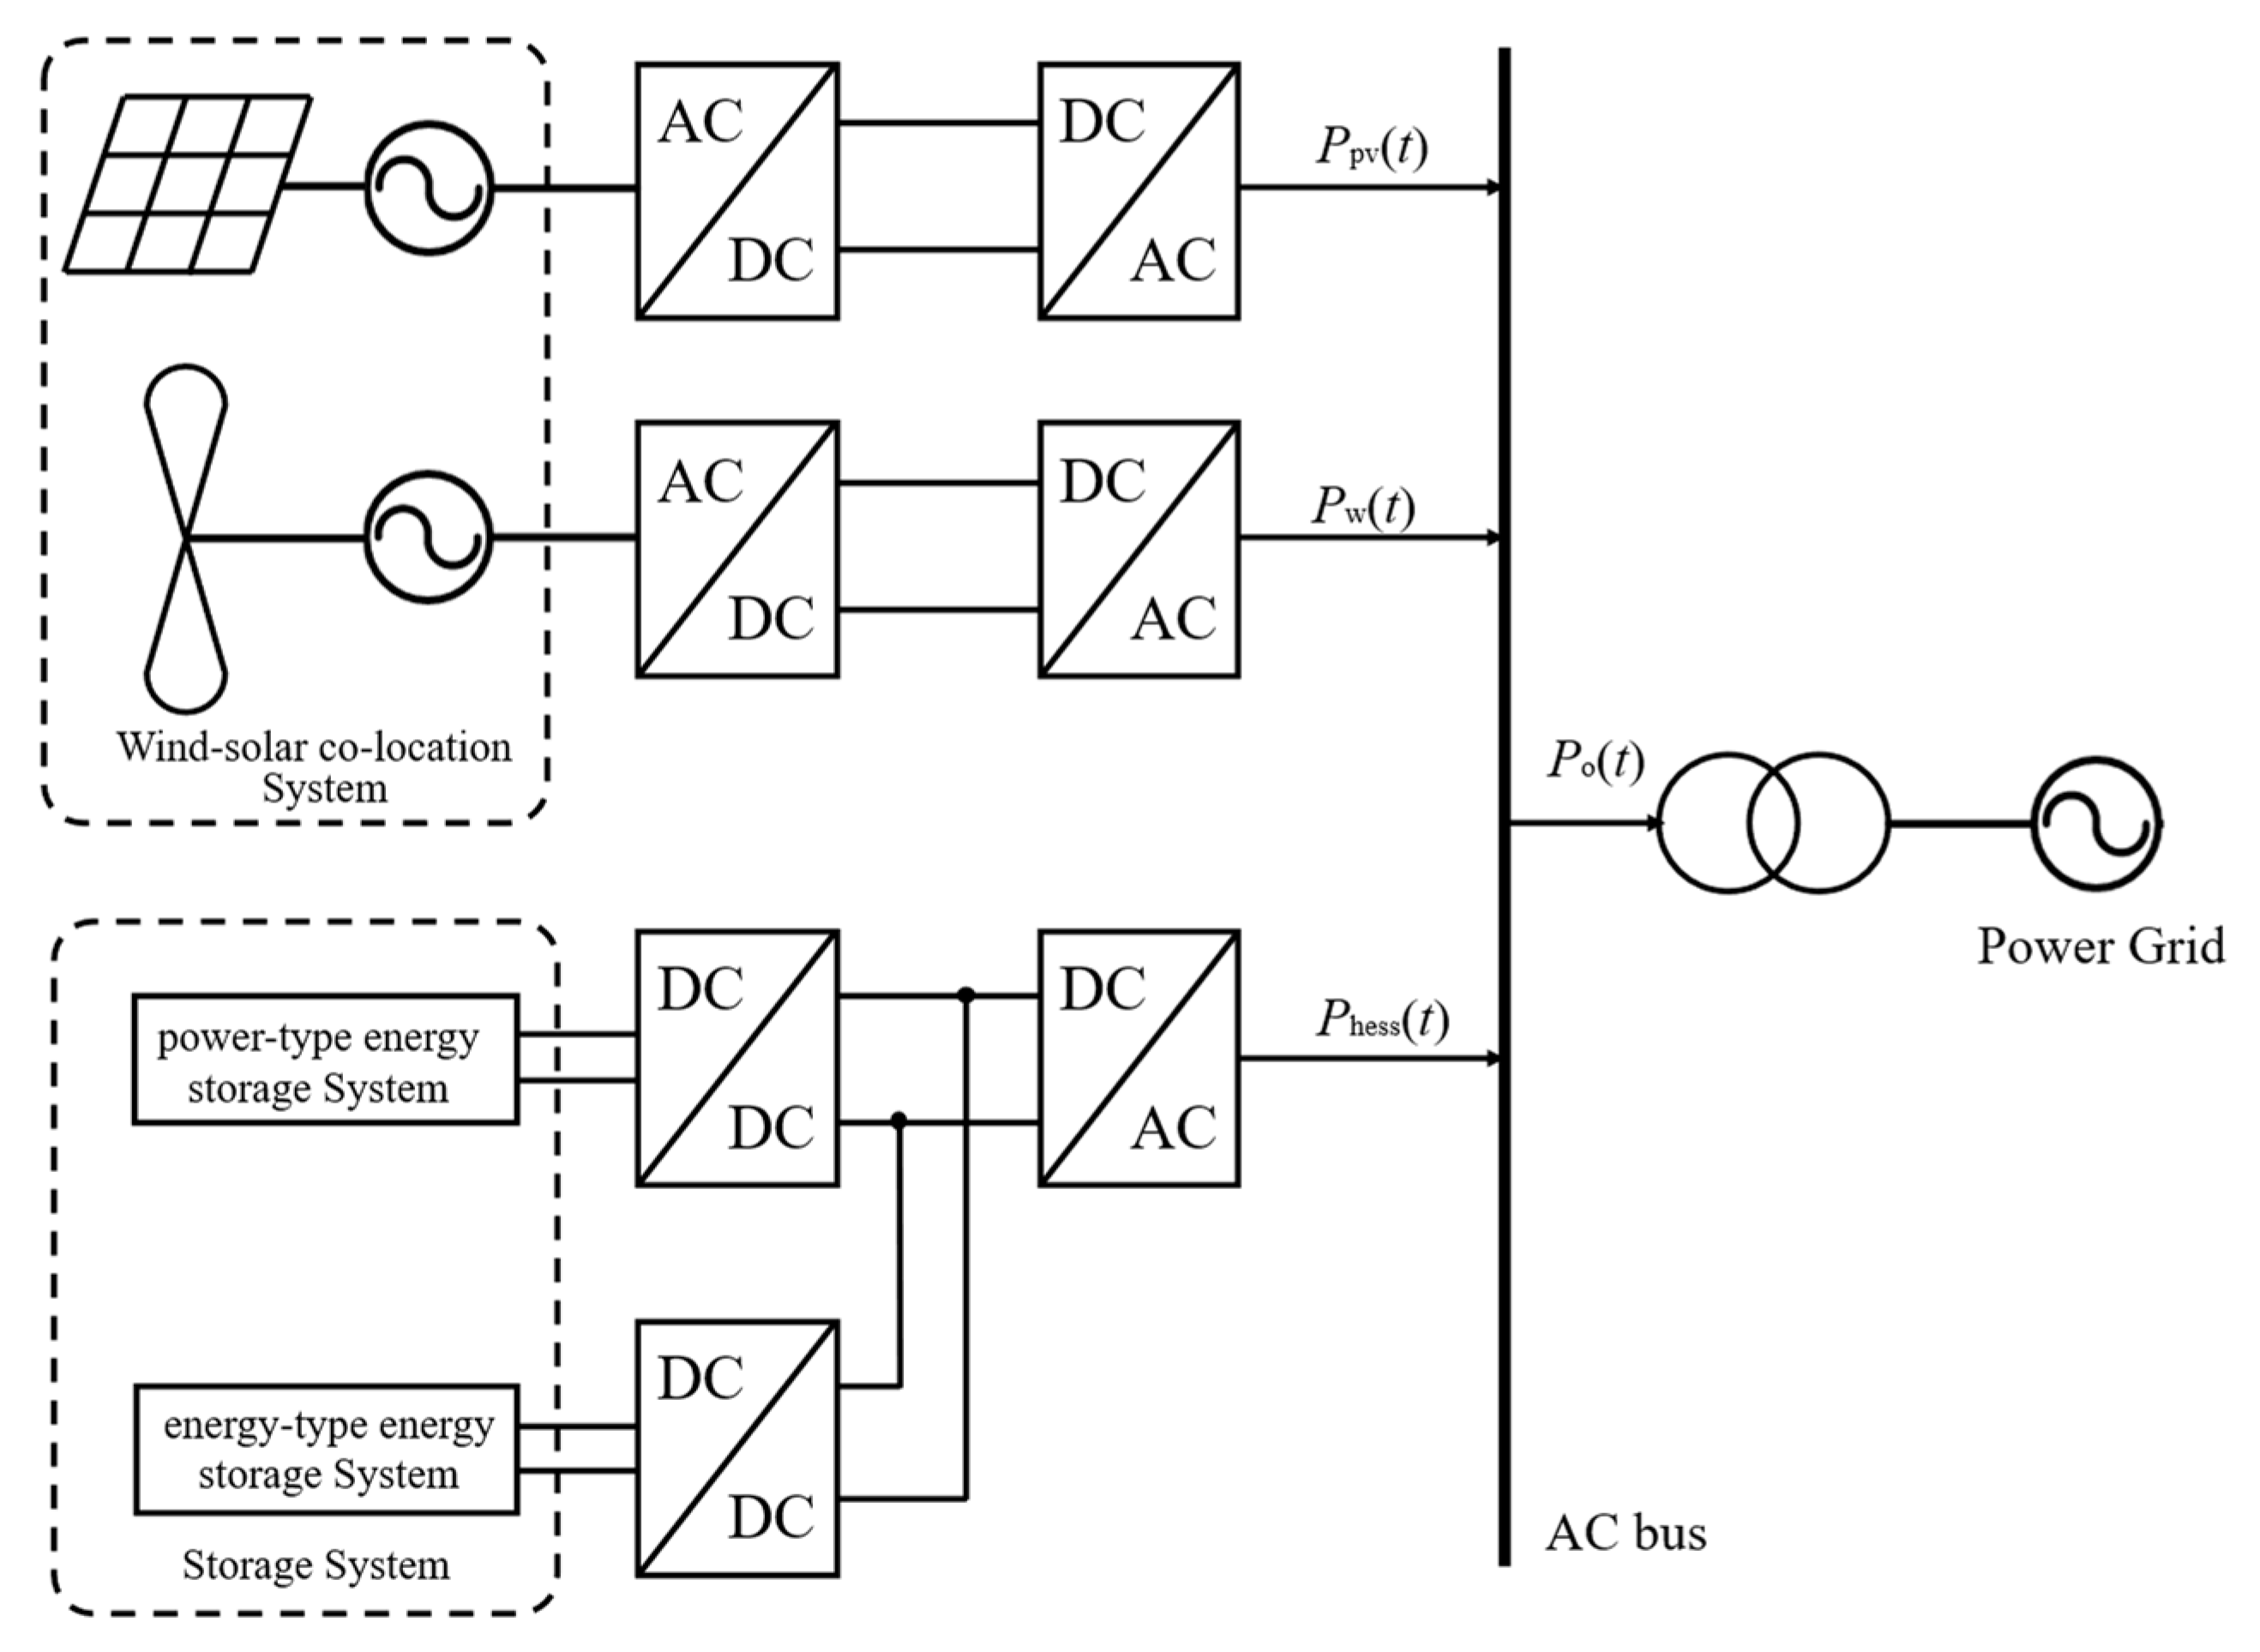
Figure 1. Structure of wind–PV–energy storage power generation system.
Processes 13 03282 g001
Figure 2. K-means fuzzy clustering scenario of new energy power in a certain area in 2024.
Processes 13 03282 g002
Figure 3. Typical-day scenarios of new-energy power obtained by K-means fuzzy clustering in a certain area in 2024.
Processes 13 03282 g003
Figure 4. The power fluctuation situation and the exceedance rate for each typical day.
Processes 13 03282 g004
Figure 5. TVF-EMD decomposition results for typical days.
Processes 13 03282 g005
Figure 6. Low-frequency component selection for typical days.
Processes 13 03282 g006
Figure 7. Original power curve, HF component, and LF component for typical days.
Processes 13 03282 g007aProcesses 13 03282 g007b
Figure 8. Power comparison before and after smoothing for each typical day.
Processes 13 03282 g008
Figure 9. Comparison of 5 min and 10 min fluctuations before and after smoothing.
Processes 13 03282 g009
Table 1. Active power variation requirements for wind farms.
Rated Capacity of Wind Farm/MWMaximum Active Power Variation Within 10 minMaximum Active Power Variation Within 1 min
<3010 MW3 MW
30–150Rated Capacity/3Rated Capacity/10
>15050 MW15 MW
Table 2. Performance comparison between the proposed TVF-EMD method and other decomposition algorithms.
Performance MetricWTEWTEMDVMDSVMDCEEMDANMEMDTVF-EMD
Decomposition AccuracyModerate (basis-dependent)Moderate–High (boundary-dependent)ModerateModerateHighHighHigh (multi-channel)High
Time DelayLowLowLowLowLowLowHighVery low
Anti-Mode AliasingWeakModerateWeakStrongStrongStrongStrongVery strong
Time-Varying AdaptabilityWeak (fixed resolution)Weak (global Fourier segmentation)NoneWeak (fixed mode number)Weak (fixed mode number)None (fixed cutoff freq.)Strong (multi-channel adaptability)Strong
Computational ComplexityMediumMediumMediumHigh (parameter-dependent)High (parameter-dependent)High (parameter-dependent)Very highMedium
Table 3. Economical parameters of electrochemical and flywheel energy storage systems.
ParameterBESSFESS
Unit Power Cost (CNY/kW)26001000
Unit Energy Capacity Cost (CNY/kWh)6305000
Power Replacement Cost (CNY/kW)2000800
Energy Capacity Replacement Cost (CNY/kWh)6004000
Power O&M Cost (CNY/kW)00
Energy O&M Cost (CNY/kWh)0.020.01
Power Disposal Cost (CNY/kW)20840
Energy Disposal Cost (CNY/kWh)50200
Charge/Discharge Efficiency (%)8095
SOC Operating Range0.2–0.80.1–0.9
Residual Value Ratio (%)1010
Table 4. Probability of different K-means fuzzy clustering scenarios and corresponding days.
Scenario123456789
Days3931274332193712314
Probability (%)10.78.57.411.88.85.210.133.73.8
Exceedance Points698282727777747380
Exceedance Rate (%)24.028.528.525.026.726.725.725.327.8
Table 5. Fluctuation quantities and suppression ratios before and after smoothing.
Typical Day123456789
Weight (%)10.78.57.411.88.85.210.133.73.8
Fluctuation Reduction (%)2.72.05.06.38.22.21.913.83.6
Max Fluctuation Reduction (%)7.29.421.91818.56.56.919.915.5
Pre-5 min Fluctuation10.010.310.39.910.110.39.89.210.2
Post-5 min Fluctuation2.32.82.42.62.52.62.51.91.7
Pre-10 min Fluctuation10.110.99.710.210.49.211.010.310.6
Post-10 min Fluctuation1.21.41.21.41.31.31.31.00.9
Table 6. Optimal sizing results for HESS under different decomposition algorithms.
Configuration MetricsHybrid Storage Using TVF-EMDHybrid Storage Using EMD
BESS power demand (MW)30.638.58
FESS power demand (MW)6.07.74
BESS energy capacity (MWh)9.658.89
FESS energy capacity (MWh)0.190.67
Total cost present value (CNY million)690980
Disclaimer/Publisher’s Note: The statements, opinions and data contained in all publications are solely those of the individual author(s) and contributor(s) and not of MDPI and/or the editor(s). MDPI and/or the editor(s) disclaim responsibility for any injury to people or property resulting from any ideas, methods, instructions or products referred to in the content.