Article

Hybrid Supervised–Unsupervised Fusion Clustering for Intelligent Classification of Horizontal Gas Wells Leveraging Integrated Dynamic–Static Parameters

1
Oil Recovery Technology Research Institute, Xinjiang Oilfield Branch, Karamay 834000, China
2
School of Petroleum Engineering, Guangdong University of Petrochemical Technology, Maoming 525000, China
3
School of Petroleum Engineering, Yangtze University, Wuhan 430100, China
*
Authors to whom correspondence should be addressed.
Processes 2025, 13(10), 3278; https://doi.org/10.3390/pr13103278
Submission received: 4 September 2025 / Revised: 9 October 2025 / Accepted: 13 October 2025 / Published: 14 October 2025

Abstract

To address the decision-making requirements for drainage gas recovery in horizontal gas wells within low-permeability tight reservoirs, this study proposes an intelligent classification approach that integrates supervised and unsupervised learning techniques. Initially, the static and dynamic performance characteristics of gas wells are characterized across multiple dimensions, including static performance, liquid production intensity, liquid drainage capacity, and liquid carrying efficiency. These features are then quantitatively categorized using Linear Discriminant Analysis (LDA). Subsequently, a hybrid classification framework is developed by integrating LDA with the K-means clustering algorithm. The effectiveness of this supervised–unsupervised fusion method is validated through comparative analysis against direct K-means clustering, demonstrating enhanced classification accuracy and interpretability. Key findings are summarized as follows: (1) Classification based on individual dynamic or static parameters exhibits low consistency, indicating that single-parameter approaches are insufficient to fully capture the complexity of actual production conditions. (2) By incorporating both dynamic and static parameters and applying a strategy combining LDA-based dimensionality reduction with K-means clustering, gas wells are precisely classified into five distinct categories. (3) Tailored optimization strategies are proposed for each well type, including production allocation optimization, continuous production (without the need for drainage gas production measures), mandatory drainage measures, foam-assisted drainage, and optimal tubing or plunger lift systems. The methodologies and findings of this study offer theoretical insights and technical guidance applicable to the classification and management of horizontal gas wells in other unconventional reservoirs, such as shale gas formations.

1. Introduction

Tight gas and shale gas, as pivotal domains of contemporary unconventional natural gas exploration and development, characteristically manifest marked heterogeneity, suboptimal physical properties, diminished single-well productivity, and constrained stable production capacity. Although horizontal wells have become the predominant well type for developing such reservoirs, significant variations in production dynamics and development performance are often observed among different horizontal wells within the same development area [1]. Furthermore, as production time progresses, dynamic factors such as wellbore liquid loading and adjustments in development strategies cause continuous evolution of development indicators across different production stages, thereby substantially increasing the complexity of dynamic analysis and refined management [2,3]. Consequently, conducting systematic, accurate, and efficient classification studies on horizontal gas wells is critically important for enhancing understanding of production behavior, enabling science-based formulation of development control strategies [4], and effectively reducing overall reservoir development costs.
Gas well classification methods can be categorized into three broad types: the static parameter method, the dynamic parameter method, and the integrated method combining both static and dynamic parameters (see Table 1). The static parameter method is generally implemented during the nascent stages of gas field development when dynamic production data are scarce. This approach is predicated on comprehensive parameters that represent the static characteristics of the reservoir. It is widely acknowledged that static parameters are of paramount importance in the field of reservoir engineering. The energy storage coefficient (R) is a prime example of such a parameter, as it is instrumental in determining the well-controlled reserves. Similarly, the formation coefficient (Kh) is of significant interest as it serves to reflect the productivity potential of a gas well. For instance, Jia et al. [5] applied an orthogonal matrix-based approach incorporating both the energy storage coefficient and the formation coefficient to classify gas wells in the Zizhou Gas Field into four distinct categories. Conversely, the dynamic parameter method is more appropriate for scenarios where substantial production data is available. The common dynamic parameters that are employed in such analyses include, but are not limited to, open flow rate, average daily gas production, gas–liquid ratio, gas production index, tubing pressure, and casing pressure. Li et al. [6] employed cluster analysis using three key parameters (gas production per unit casing pressure drop, casing pressure drop rate, and open flow rate) to classify horizontal gas wells into three categories: high-yield and stable production, medium-yield with slow decline, and low-yield with rapid decline. Dong et al. [7] proposed a classification system for gas wells that categorized them into four primary groups based on average daily gas and liquid production. The classification system was further subdivided into three subcategories according to variations in cumulative water–gas ratio. This approach was undertaken to enable the proposal of tailored management strategies for each type of well. Zhu et al. [8] applied Linear Discriminant Analysis (LDA) using dynamic parameters, including remaining pressure, gas production, supplementary gas volume after well shut-in, water production, and standard deviation of the water–gas ratio to classify horizontal gas wells into six types based on liquid drainage capacity and liquid production intensity. It is important to note that the static classification method, due to its exclusion of dynamic parameters, may not adequately reflect actual production performance. Conversely, while the dynamic classification method captures current production behavior, it may fail to fully account for the production potential constrained by geological conditions.
In light of the inherent limitations of single static or dynamic parameter methods, the integration of static and dynamic parameters has emerged as a critical approach for enhancing the reliability and accuracy of gas well classification. In recent times, researchers have developed more comprehensive classification models by incorporating both static and dynamic data. Chi et al. [9] conducted a multi-factor analysis of production capacity. This analysis was based on an initial classification derived from dynamic and static data. The gray relational analysis method was used in this process. The classification criteria were established using actual production data in their study. Shang et al. [1] investigated the correlation between nine dynamic and static parameters and production capacity. They then constructed an integrated classification model using the XGBoost machine learning algorithm, thereby enhancing both the efficiency and objectivity of classification. Zhao et al. [10] implemented a two-stage parameter screening process. Firstly, they employed variance filtering and XGBoost, followed by spectral clustering for type labeling. The employment of a convolutional neural network (CNN) was instrumental in establishing a mapping between selected features and gas well types, thereby enabling rapid and accurate prediction of well categories. In summary, gas well classification, serving as a core element of full life cycle management, is undergoing significant methodological evolution. This evolution can be summarized as follows: a transition from reliance on isolated static or dynamic indicators to the integration of multiple parameters; a shift from qualitative descriptions to data-driven quantitative models; an evolution from conventional threshold-based methods to intelligent algorithms such as machine learning [11,12]; and an expansion of its focus from mere production capacity evaluation to a more holistic assessment of drainage and gas recovery potential.
Table 1. Summary of common classification methods for gas wells.
AuthorsClassification
Methods
Static ParametersDynamic ParametersIdentification Method
Jia et al. [5]StaticEnergy storage coefficient, formation coefficient-Arthogonal matrix-based approach
Li et al. [6]Dynamic-Gas production per unit casing pressure drop, casing pressure drop rate, open flow rateCluster analysis
Dong et al. [7]Dynamic-Average daily gas and liquid production, cumulative water–gas ratioThreshold-based method
Zhu et al. [8]Dynamic-Remaining pressure, gas production, supplementary gas volume after well shut-in, water production, standard deviation of the water–gas ratioLinear Discriminant Analysis
Yuan et al. [13]Static and dynamicDynamic reserves, water saturationCurrent gas production, cumulative gas production, cumulative water production, gas production per unit casing pressure dropGray relational analysis
Chi et al. [9]Static and dynamicEnergy storage coefficient, skin factor, permeability, dynamic reserves, formation pressureWater–gas ratio, open flow rateGray relational analysis
Shang et al. [1]Static and dynamicEffective thickness, porosity, matrix permeability, gas saturation, original formation pressureOpen flow rate, production allocation, tubing pressure before production, casing pressure before productionXGBoost algorithm
Zhao et al. [10]Static and dynamicEffective porosity, gas relative density, casing depth, original formation temperature, initial gas saturation, skin factor, formation water salinity, permeability, perforation thickness, initial formation pressureEffective fracture half-length, total fracturing sand volume, fracturing fluid flowback rate, open flow rateCNN algorithm
Dong et al. [14]Static and dynamicNumber of combined sand bodies, effective sand body thickness, porosity, permeability, gas saturationCumulative production contribution rateEntropy weight—ideal point method
The objective of this study is to address the decision-making requirements for drainage gas recovery in horizontal gas wells located in low-permeability tight reservoirs. This will be achieved by comprehensively characterizing both the dynamic and static performance of gas wells from multiple dimensions. The introduction of LDA resulted in the establishment of a quantitative classification framework for the dynamic and static performance of horizontal gas wells. The K-means clustering algorithm was integrated further to develop a hybrid intelligent classification method that combines supervised and unsupervised learning techniques. The performance of this integrated classification approach was evaluated through comparative analysis against direct K-means clustering results. Finally, production and drainage strategies that are tailored to distinct categories of gas wells were proposed.

2. Materials and Methods

2.1. Description of the Study Area

The K gas field, situated within the Junggar Basin in Xinjiang, China, is the focus of this study. The reservoir lithology is predominantly composed of volcanic rocks and sandstones, with the reservoir type primarily characterized as medium-low porosity and low-permeability to tight fractured-pore type. The average porosity of the rock has been determined to be 9.8%, with an average permeability of 0.334 mD. The gas reservoir is classified as a condensate gas reservoir controlled by edge and bottom water and mainly developed through depletion methods. It is evident that, due to the inherently low natural productivity levels, the implementation of hydraulic fracturing and reservoir stimulation is typically a prerequisite for the commencement of production.
Statistical data indicate that the gas–liquid ratio (GLR) of horizontal wells in the target block ranges from 0 to 13,000, with liquid production (QL) varying between 0 and 140 m3/d. It is noteworthy that the majority of wells exhibit GLR values within the range of 0 to 8000 and QL between 0 and 40 m3/d. The analysis of liquid production levels indicates that 32.65% of horizontal wells exhibit a production capacity ranging from 0 to 5 m3/d, 44.90% demonstrate a capacity between 5 and 15 m3/d, 16.33% display a capacity between 15 and 40 m3/d, and 6.12% exceed 40 m3/d (Figure 1).
During the development process, a continuous decline in formation pressure combined with increasing water production has led to increasingly severe liquid loading issues in horizontal gas wells. The production dynamic characteristics of the typical horizontal gas wells in the study area are demonstrated in Figure 2. In the initial phase of production, the tubing pressure (Pt) and casing pressure (Pc) exhibited elevated levels, while the gas (Qg) and liquid production rates of the gas well demonstrated stability, enabling sustained output at a high rate. As the process of liquid loading takes place, there is a gradual decline in various production indicators on an annual basis. In the context of the intermittent production system, there is a gradual reduction in the well opening period, accompanied by a substantial decline in the pressure recovery value following well shutdown. This phenomenon poses a significant challenge to the stability of production. In order to ensure stable gas well production, it is essential to implement an integrated water management strategy based on the principle of ‘classification-based treatment and combined control and drainage’. Consequently, a refined classification of gas wells according to varying drainage and production requirements is of critical importance.

2.2. Static Parameter Classification Methods

The energy storage coefficient (R) is a critical parameter used to characterize the degree of hydrocarbon enrichment within a reservoir. By integrating key reservoir parameters such as effective thickness, porosity, and gas saturation, this coefficient enables a quantitative assessment of the reservoir’s static enrichment capacity. Studies have demonstrated that the energy storage coefficient holds significant applicability in the evaluation of various unconventional gas reservoirs, including tight sandstone gas, shale gas, and carbonate gas reservoirs [15,16,17]. Another essential parameter in reservoir evaluation is the formation coefficient (Kh), defined as the product of the reservoir’s effective thickness and effective permeability. This parameter reflects the reservoir’s static seepage capacity and serves as a key indicator for predicting gas well productivity [16]. Both theoretical analysis and field production data indicate that gas wells tend to exhibit superior production performance when both the energy storage coefficient and the formation coefficient maintain high values. This is typically manifested in the form of higher initial production rates and extended periods of stable production. Generally, the parameters R and Kh can be formally defined as follows:
R = h · ϕ · S g i
K h = k · h
where h represents the effective thickness of the reservoir encountered by the gas well, m; ϕ denotes the porosity of the reservoir, %; Sgi indicates the original gas saturation of the reservoir, %; and k refers to the effective permeability of the reservoir, mD.
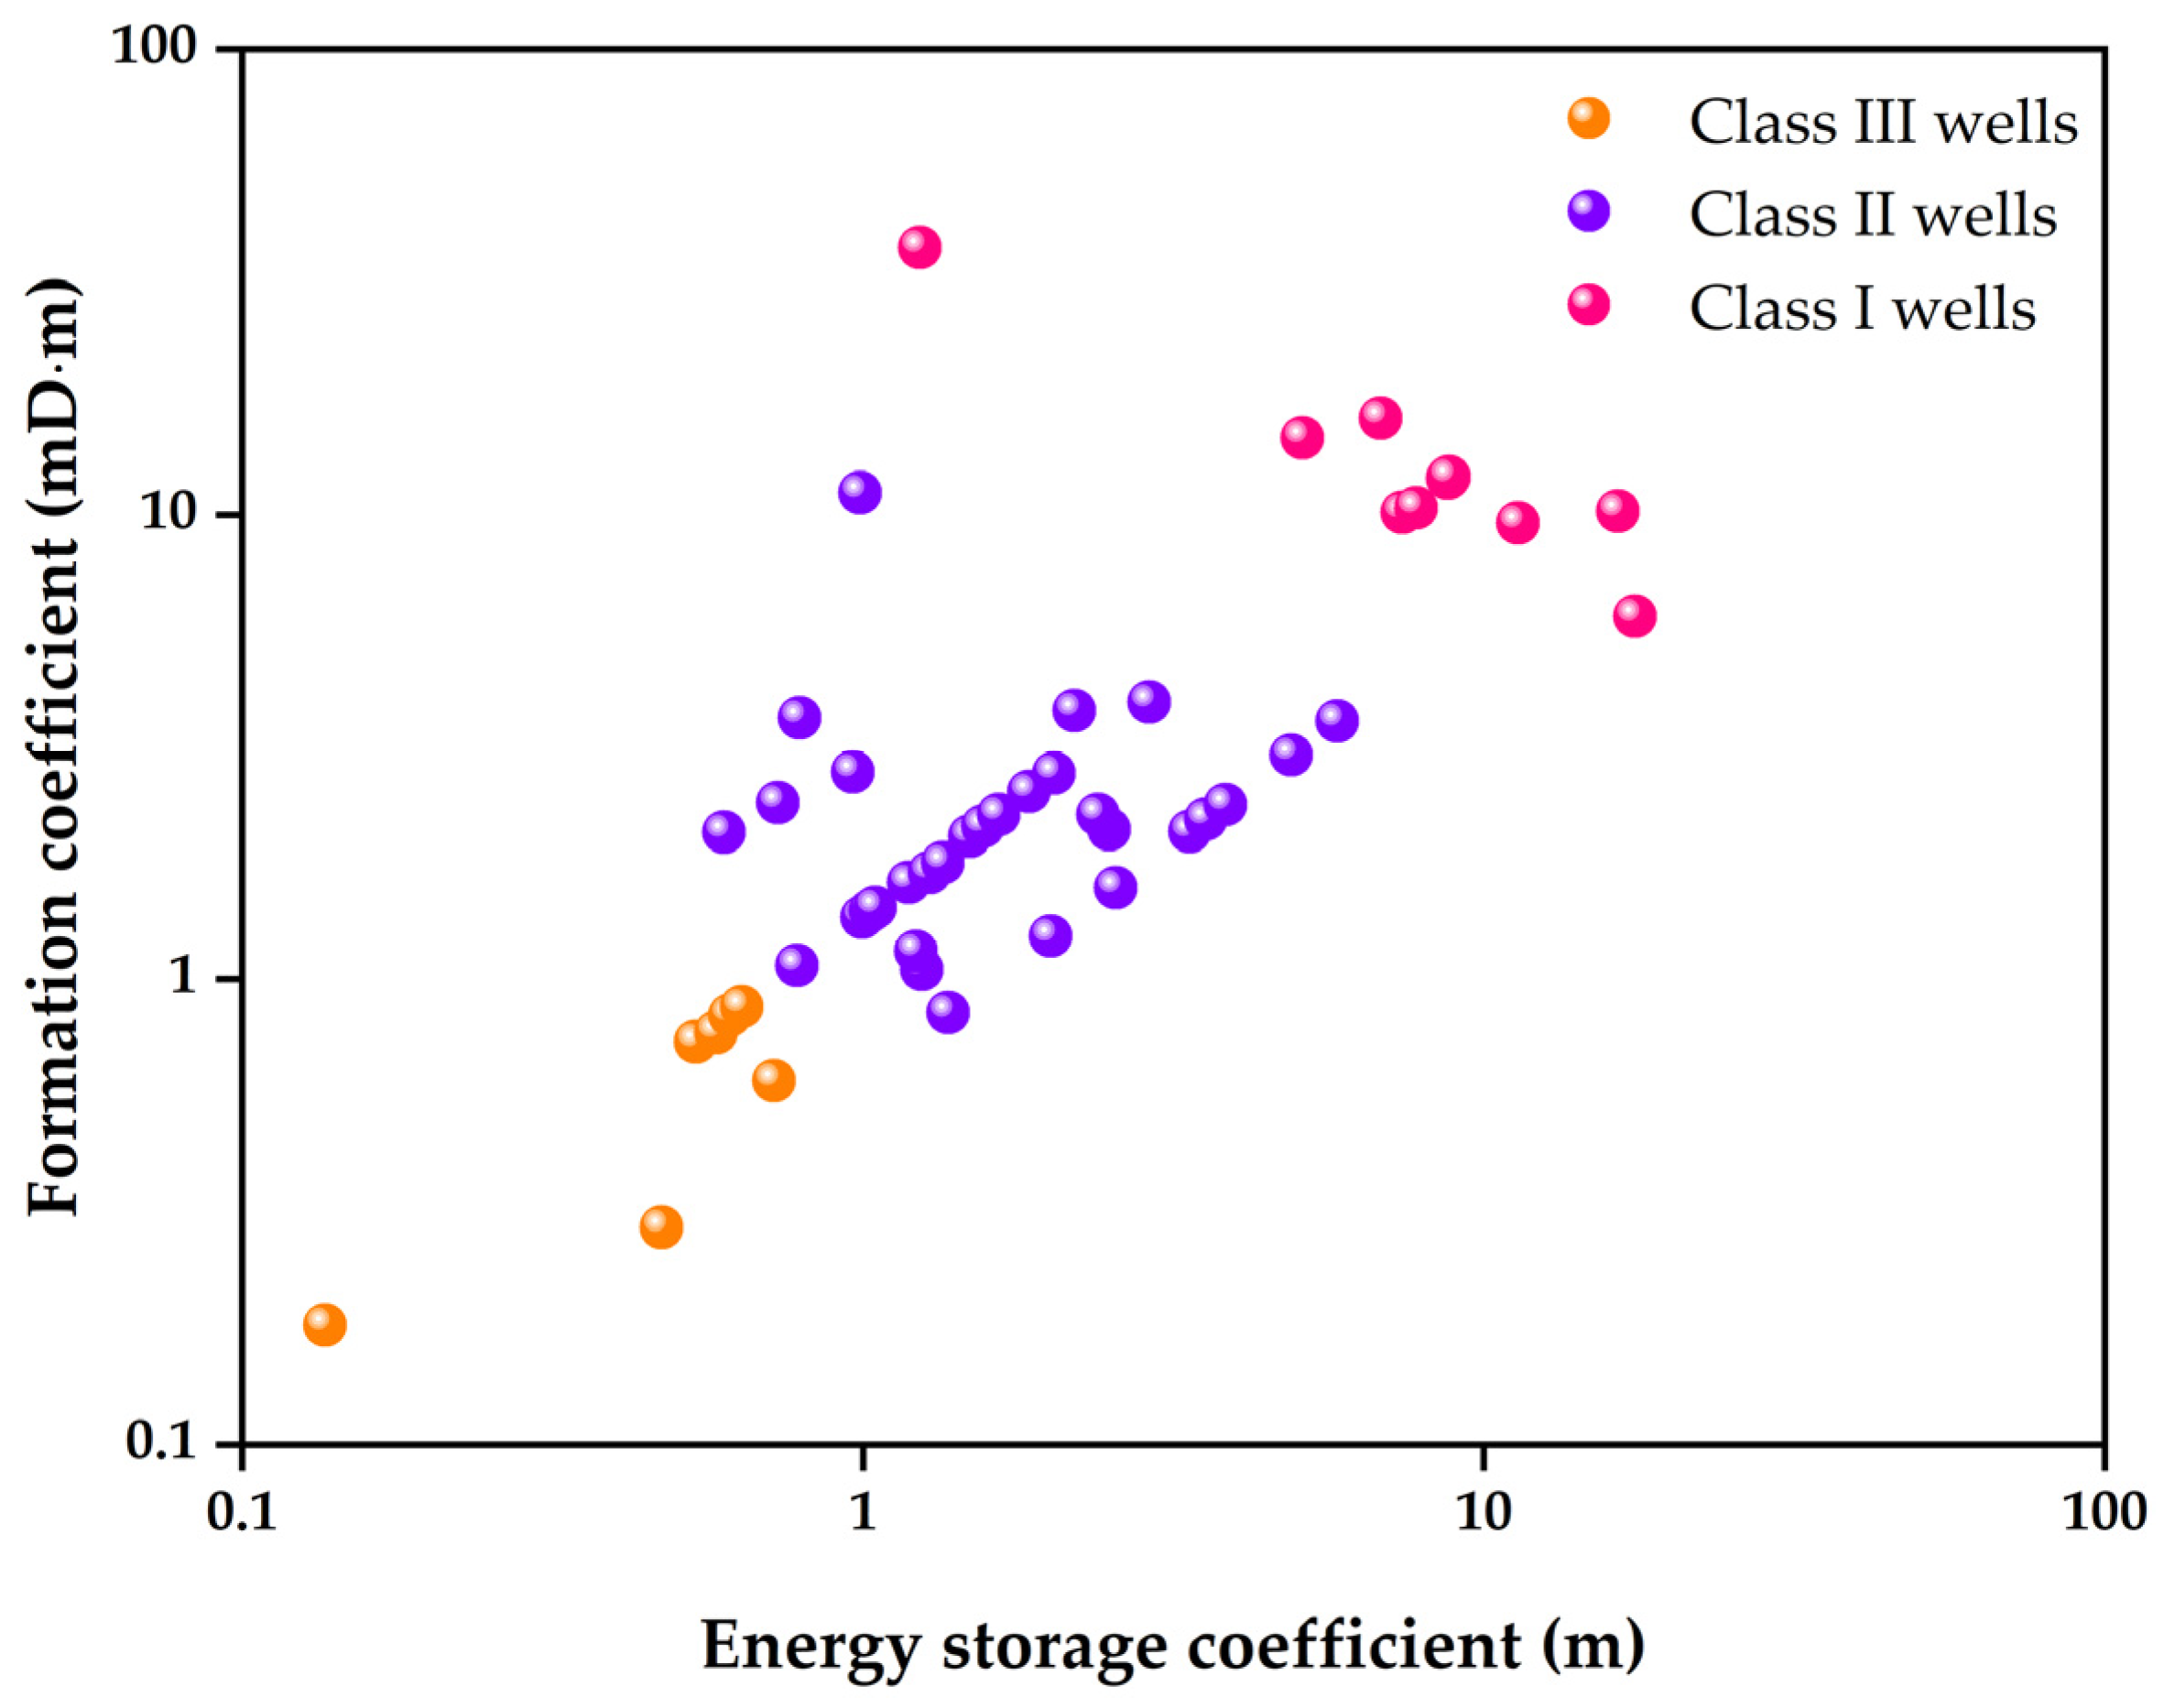
Figure 3 presents the distribution characteristics of the energy storage coefficient and formation factor across 48 horizontal gas wells in the study area. Based on the parameter values of R and Kh, these wells, which exhibit distinct static performance (SP), can be effectively classified into three categories. The classification results indicate that Class I, characterized by the highest quality, encompasses 10 wells (20.8%); Class II, with medium quality, comprises 31 wells (64.6%); and Class III, characterized by the lowest quality, includes 7 wells (14.6%).

2.3. Dynamic Parameter Classification Methods

Classifying gas wells according to their drainage and production requirements is essential for developing appropriate production strategies in subsequent stages. This study assesses the dynamic performance of gas wells based on three key indicators: liquid production intensity (LPI), liquid drainage capacity (LDC), and liquid carrying efficiency (LCE).

2.3.1. Liquid Production Intensity

As suggested by Zhu et al. [8], LPI is quantified using two parameters: current water production (Qw) and the standard deviation of the water-to-gas ratio (Sdrwg). Qw serves as a direct indicator of drainage demand. Wells with high water production exhibit a greater liquid phase load and require enhanced drainage intensity to maintain liquid-carrying production, resulting in higher liquid production intensity. Conversely, wells with low water production have a lower liquid phase load and can sustain liquid-carrying production through natural energy or minimal auxiliary support, leading to lower liquid production intensity.
Sdrwg reflects the variability of water production during the production process and indicates trends in water production changes. A high standard deviation suggests unstable water production, a higher risk of increasing water production, and consequently greater drainage demand, resulting in higher liquid production intensity. In contrast, a low standard deviation indicates stable water production, a lower risk of increase, and more consistent drainage requirements, resulting in relatively lower liquid production intensity. Sdrwg can be calculated using the following equation:
S d r w g = R w g 0 R w g a 2 + R w g R w g a 2 2
where Rwg0 denotes the initial water-to-gas ratio, Rwg represents the current water-to-gas ratio, and Rwga refers to the average water-to-gas ratio over the entire production period, m3/104 m3.

2.3.2. Liquid Drainage Capacity

Gas well productivity and formation pressure are critical factors influencing LDC. Given the inability to monitor formation pressure in real time, this study adopts the current gas production rate and tubing pressure as dynamic characterization parameters for assessing LDC.

2.3.3. Liquid Carrying Efficiency

The LCE of gas wells reflects the energy utilization efficiency of gas during the liquid transport process, which is closely associated with the gas–liquid two-phase flow regime and pressure gradient. The critical liquid-carrying flow rate (Qc) exerts a significant influence on the gas–liquid flow regime. When the actual gas production exceeds the critical liquid-carrying flow rate, continuous liquid transport can be achieved, and the two-phase flow is predominantly in the form of annular-mist flow, with no liquid loading occurring in the wellbore. In contrast, if the actual gas production falls below the critical flow rate, continuous liquid transport cannot be sustained, and the flow regime typically transitions to churn or slug flow, leading to liquid loading within the wellbore [18]. Based on field practices in the study area, the critical liquid-carrying flow rate for gas wells can be determined using the following formula:
Q c = 1.96 × 10 8 D 2 p v c Z T
v c = 3.2 × ρ w ρ g σ ρ g 2 0.25
where vc denotes the critical liquid-carrying velocity, m/s; ρl and ρg represent the densities of the liquid and gas phases, respectively, kg/m3; σ refers to the surface tension, N/m; p indicates the pressure, MPa; T is the temperature, K; Z is the gas compressibility factor, dimensionless; and D represents the tubing inner diameter, m.
The flowing pressure gradient (Gp) in horizontal gas wells during gas–liquid flow is computed using the Mukherjee-Brill model [19]. According to the field pressure data from horizontal gas wells, Wang et al. [20] demonstrated that the Mukherjee-Brill model provides higher accuracy in pressure drop prediction compared to the classical Beggs-Brill model [21]. Ultimately, the gas flow ratio (Gfr), defined as the ratio of actual gas production to the critical liquid-carrying flow rate, and the pressure gradient predicted by the Mukherjee-Brill model were identified as two key characteristic parameters for characterizing liquid-carrying efficiency.
Figure 4 depicts the distribution of dynamic characteristics across the aforementioned three dimensions of horizontal gas wells in the study area. As illustrated, the liquid production intensity, liquid drainage capacity, and liquid carrying efficiency exhibit distinct stratification. Specifically, both the liquid production intensity and liquid drainage capacity can be categorized into three levels—high, medium, and low—whereas the liquid carrying efficiency can be classified into two levels—high and low.

2.4. Comparative Analysis of Static and Dynamic Classification Approaches Based on LDA

2.4.1. LDA-Based Dimensionality Reduction in Indicators

To assess the consistency between static and dynamic classification outcomes, Linear Discriminant Analysis was employed to perform dimensionality reduction on the performance indicators of horizontal gas wells. LDA is a well-established supervised learning technique that integrates dimensionality reduction with classification [22]. Its fundamental principle involves projecting the original dataset into a lower-dimensional space by maximizing the ratio of between-class scatter to within-class scatter. This approach identifies the optimal projection direction through the solution of a generalized eigenvalue problem, thereby ensuring compact intra-class clustering and effective inter-class separation, which ultimately enhances classification accuracy. Following LDA-based dimensionality reduction, four representative low-dimensional features were extracted, corresponding to static performance, liquid production intensity, liquid drainage capacity, and liquid carrying efficiency. Their spatial distribution within the projected subspace is illustrated in Figure 5. As shown, with the exception of liquid production intensity, the various categories exhibit greater separation along the LDA axis.

2.4.2. Comparison of Static and Dynamic Classification

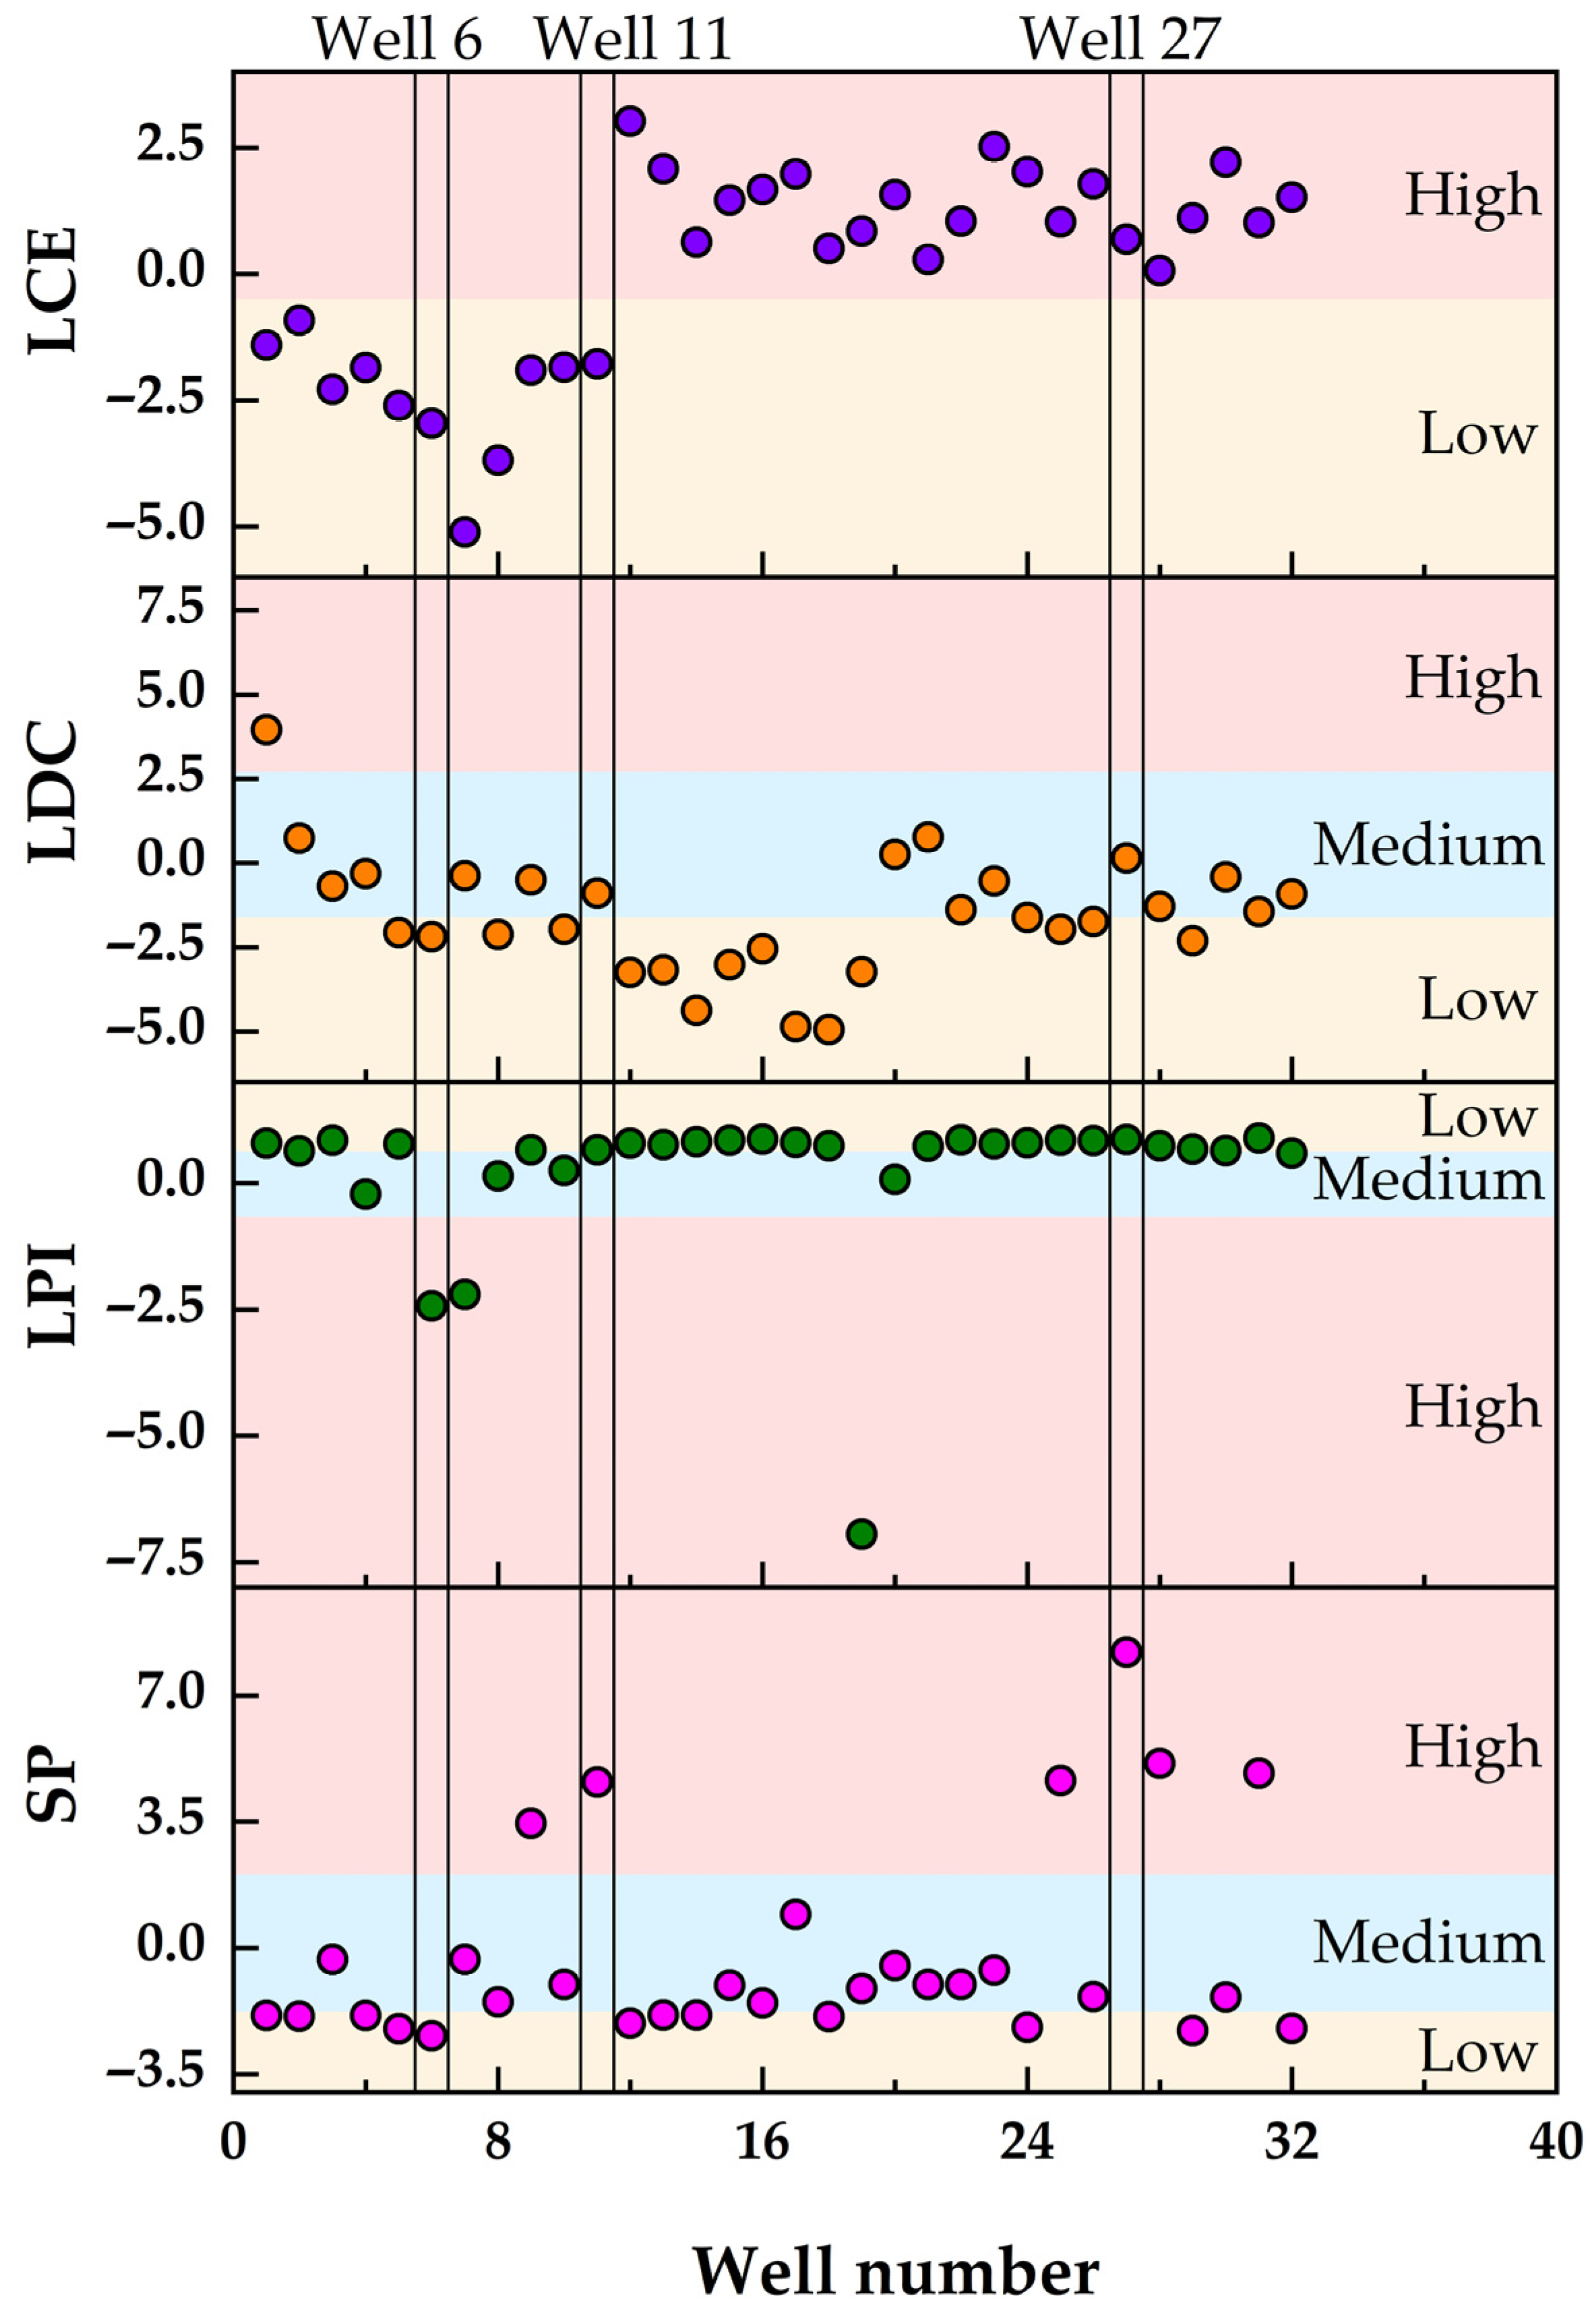
Figure 6 illustrates the distribution characteristics of static performance, liquid production intensity, liquid drainage capacity, and liquid carrying efficiency for 32 horizontal gas wells with complete static and dynamic data, following dimensionality reduction in the feature space. The analysis reveals that there is no strict correlation between static and dynamic performance. Well-6, characterized by poor static performance but high liquid production intensity, exhibits low liquid drainage capacity and low liquid carrying efficiency. Well-27, with superior static performance and low liquid production intensity, demonstrates moderate liquid drainage capacity and high liquid carrying efficiency, which aligns with conventional expectations. In contrast, Well-11, also exhibiting favorable static performance and low liquid production intensity, displays moderate liquid drainage capacity but low liquid carrying efficiency, deviating from conventional understanding. These findings indicate that classification based solely on static or dynamic parameters is insufficient to accurately reflect the actual conditions of gas wells. Therefore, an integrated approach incorporating both static and dynamic parameters is essential for precise classification.

3. Hybrid Supervised–Unsupervised Fusion Clustering Method Based on Integrated Dynamic and Static Parameters

3.1. K-Means Algorithm

The K-means algorithm [23] is a widely adopted unsupervised learning method in the domain of cluster analysis. Its primary objective is to partition a dataset into K distinct clusters, wherein data points within the same cluster exhibit a high degree of similarity, whereas data points across different clusters demonstrate notable dissimilarities. This algorithm has achieved great success in the identification of hydraulic flow units [24], classification of electrofacies [25], and geological fracture analysis [26]. The fundamental principle of the algorithm can be summarized as follows: first, K initial centroids (commonly referred to as cluster centers) are randomly initialized. Subsequently, an iterative optimization process is employed to refine these centroids progressively, aiming to maximize the intra-cluster similarity. The algorithm’s objective function can be mathematically formulated as [27]:
J = k = 1 K x i C k x i μ k 2
where J denotes the objective function, representing the total within-cluster squared error. Ck corresponds to the set of data points belonging to the kth cluster, μk signifies the centroid of the kth cluster, which is calculated as the arithmetic mean of all data points within that cluster. xi signifies each individual data point within cluster Ck. Additionally, x i μ k 2 represents the squared Euclidean distance between the data point xi and the cluster centroid μk.
During each iteration, the cluster centroid μk is recalculated as the arithmetic mean of all data points belonging to the corresponding cluster Ck, mathematically expressed as:
μ k = 1 C k x i C k x i
where C k denotes the total number of data points in cluster Ck.
To determine an appropriate value of K, a widely utilized technique is the elbow method [28]. This approach entails computing the Within-Cluster Sum of Squares (WCSS) for a range of K values and identifying the K corresponding to the point where the rate of error reduction starts to decline markedly. When K = 1, WCSS attains its maximum, as all data points are assigned to a single cluster. As K increases, WCSS progressively decreases due to the more refined partitioning of data into distinct clusters. However, beyond the true number of clusters, the marginal decrease in WCSS becomes increasingly small, leading to the emergence of an ‘elbow’-shaped inflection point in the plotted curve. The value of K at this inflection point reflects the optimal balance between cluster cohesion and computational cost. Beyond this threshold, further increments in K result in only minimal enhancements in clustering effectiveness. This inflection point is conventionally interpreted as indicating the ideal number of clusters.
In this study, the K-means clustering algorithm was applied to perform cluster analysis on both dynamic and static parameters, evaluated in both the original high-dimensional space and the reduced-dimensional space.

3.2. Fusion Clustering Method Integrating LDA and K-Means Algorithm

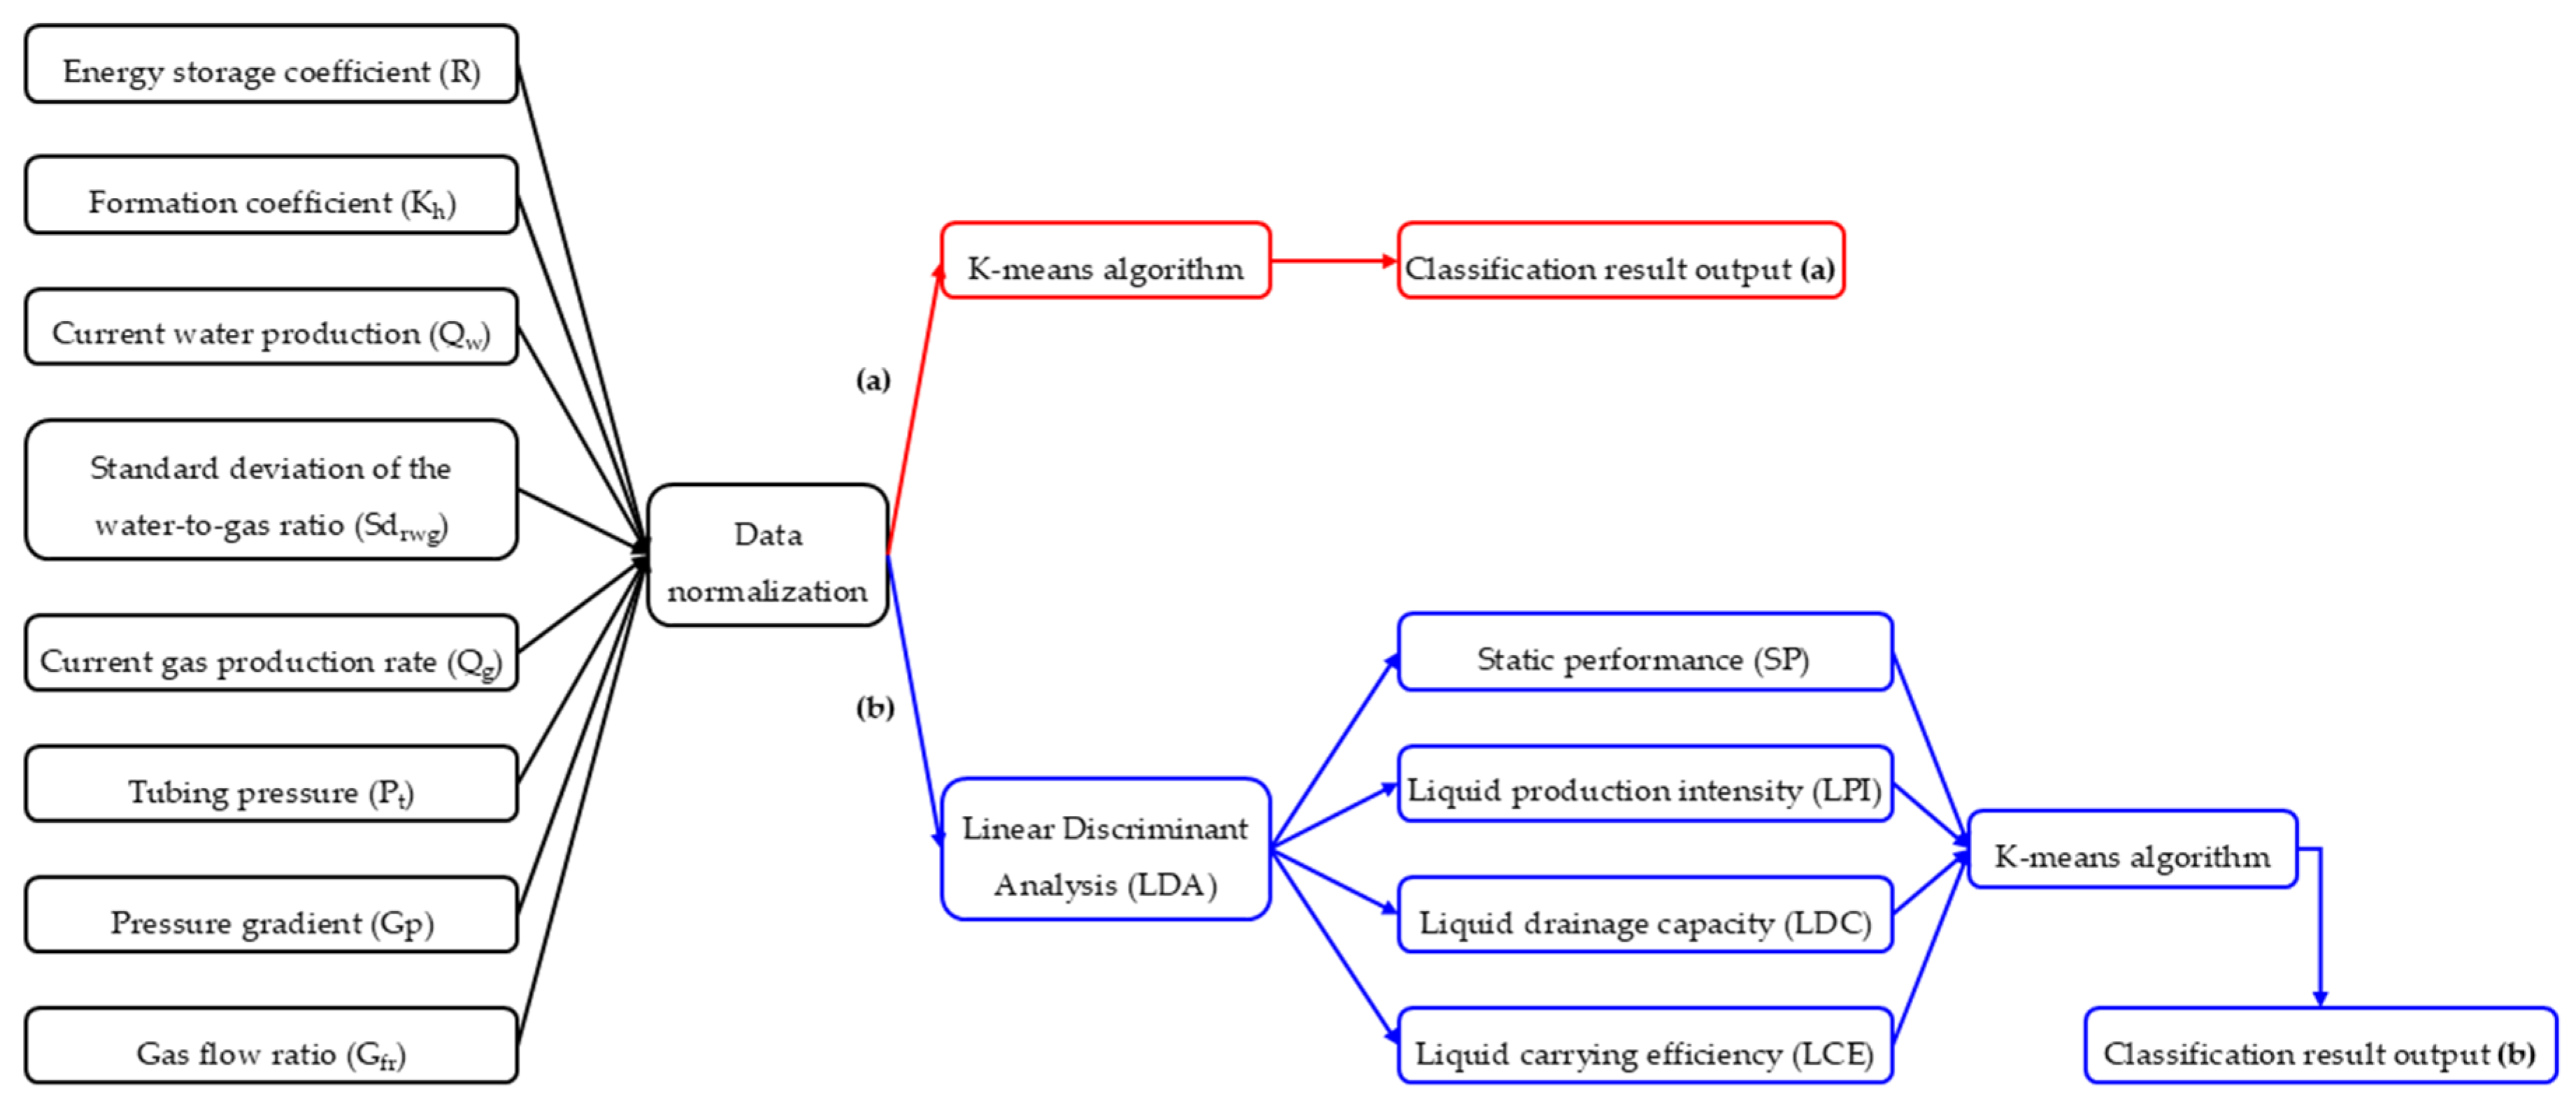
Based on the aforementioned analysis, this study proposes two clustering strategies to enable accurate classification of horizontal gas wells through the integration of dynamic and static parameters. The first strategy (scheme 1) involves directly applying the K-means algorithm to cluster the original dataset comprising eight dynamic and static features, referred to as the direct clustering method (Figure 7a). The second strategy (scheme 2) consists of two stages: first, employing LDA to reduce the dimensionality of the dynamic and static parameters, followed by applying the K-means algorithm to cluster the resulting low-dimensional features. This combined approach is termed the LDA-Kmeans fusion clustering method (Figure 7b).
In order to obtain a sample dataset with sufficient scale and comprehensive characteristics, this study selected 32 horizontal gas wells in the target area that had detailed dynamic and static data records as the benchmark wells. For each gas well, a sampling point is established at two-year intervals from the well’s initial operation. The dynamic and static characteristics at each sampling point are obtained, including R, Kh, Qw, Sdrwg, Qg, Pt, Gp, and Gfr. The sampling period encompasses the entire stage of the gas well, from its early stable production to its later liquid loading and intermittent production. Following the processing of missing values and outliers in the collected raw data, 166 qualified samples were obtained. The statistical characteristics of these samples are shown in Table 2.
Given the substantial variations in the numerical scales of the original sample features, dataset normalization is essential to ensure consistency and improve model performance. The normalization approach employed is as follows [29]:
a n e w = a a min a max a min
where a represents the original data of a specific sample feature, anew denotes the standardized value of that feature, amax indicates the maximum value observed in the feature, and amin refers to the minimum value observed in the feature.

4. Results and Discussions

4.1. Classification of Horizontal Gas Wells via Direct K-Means Clustering

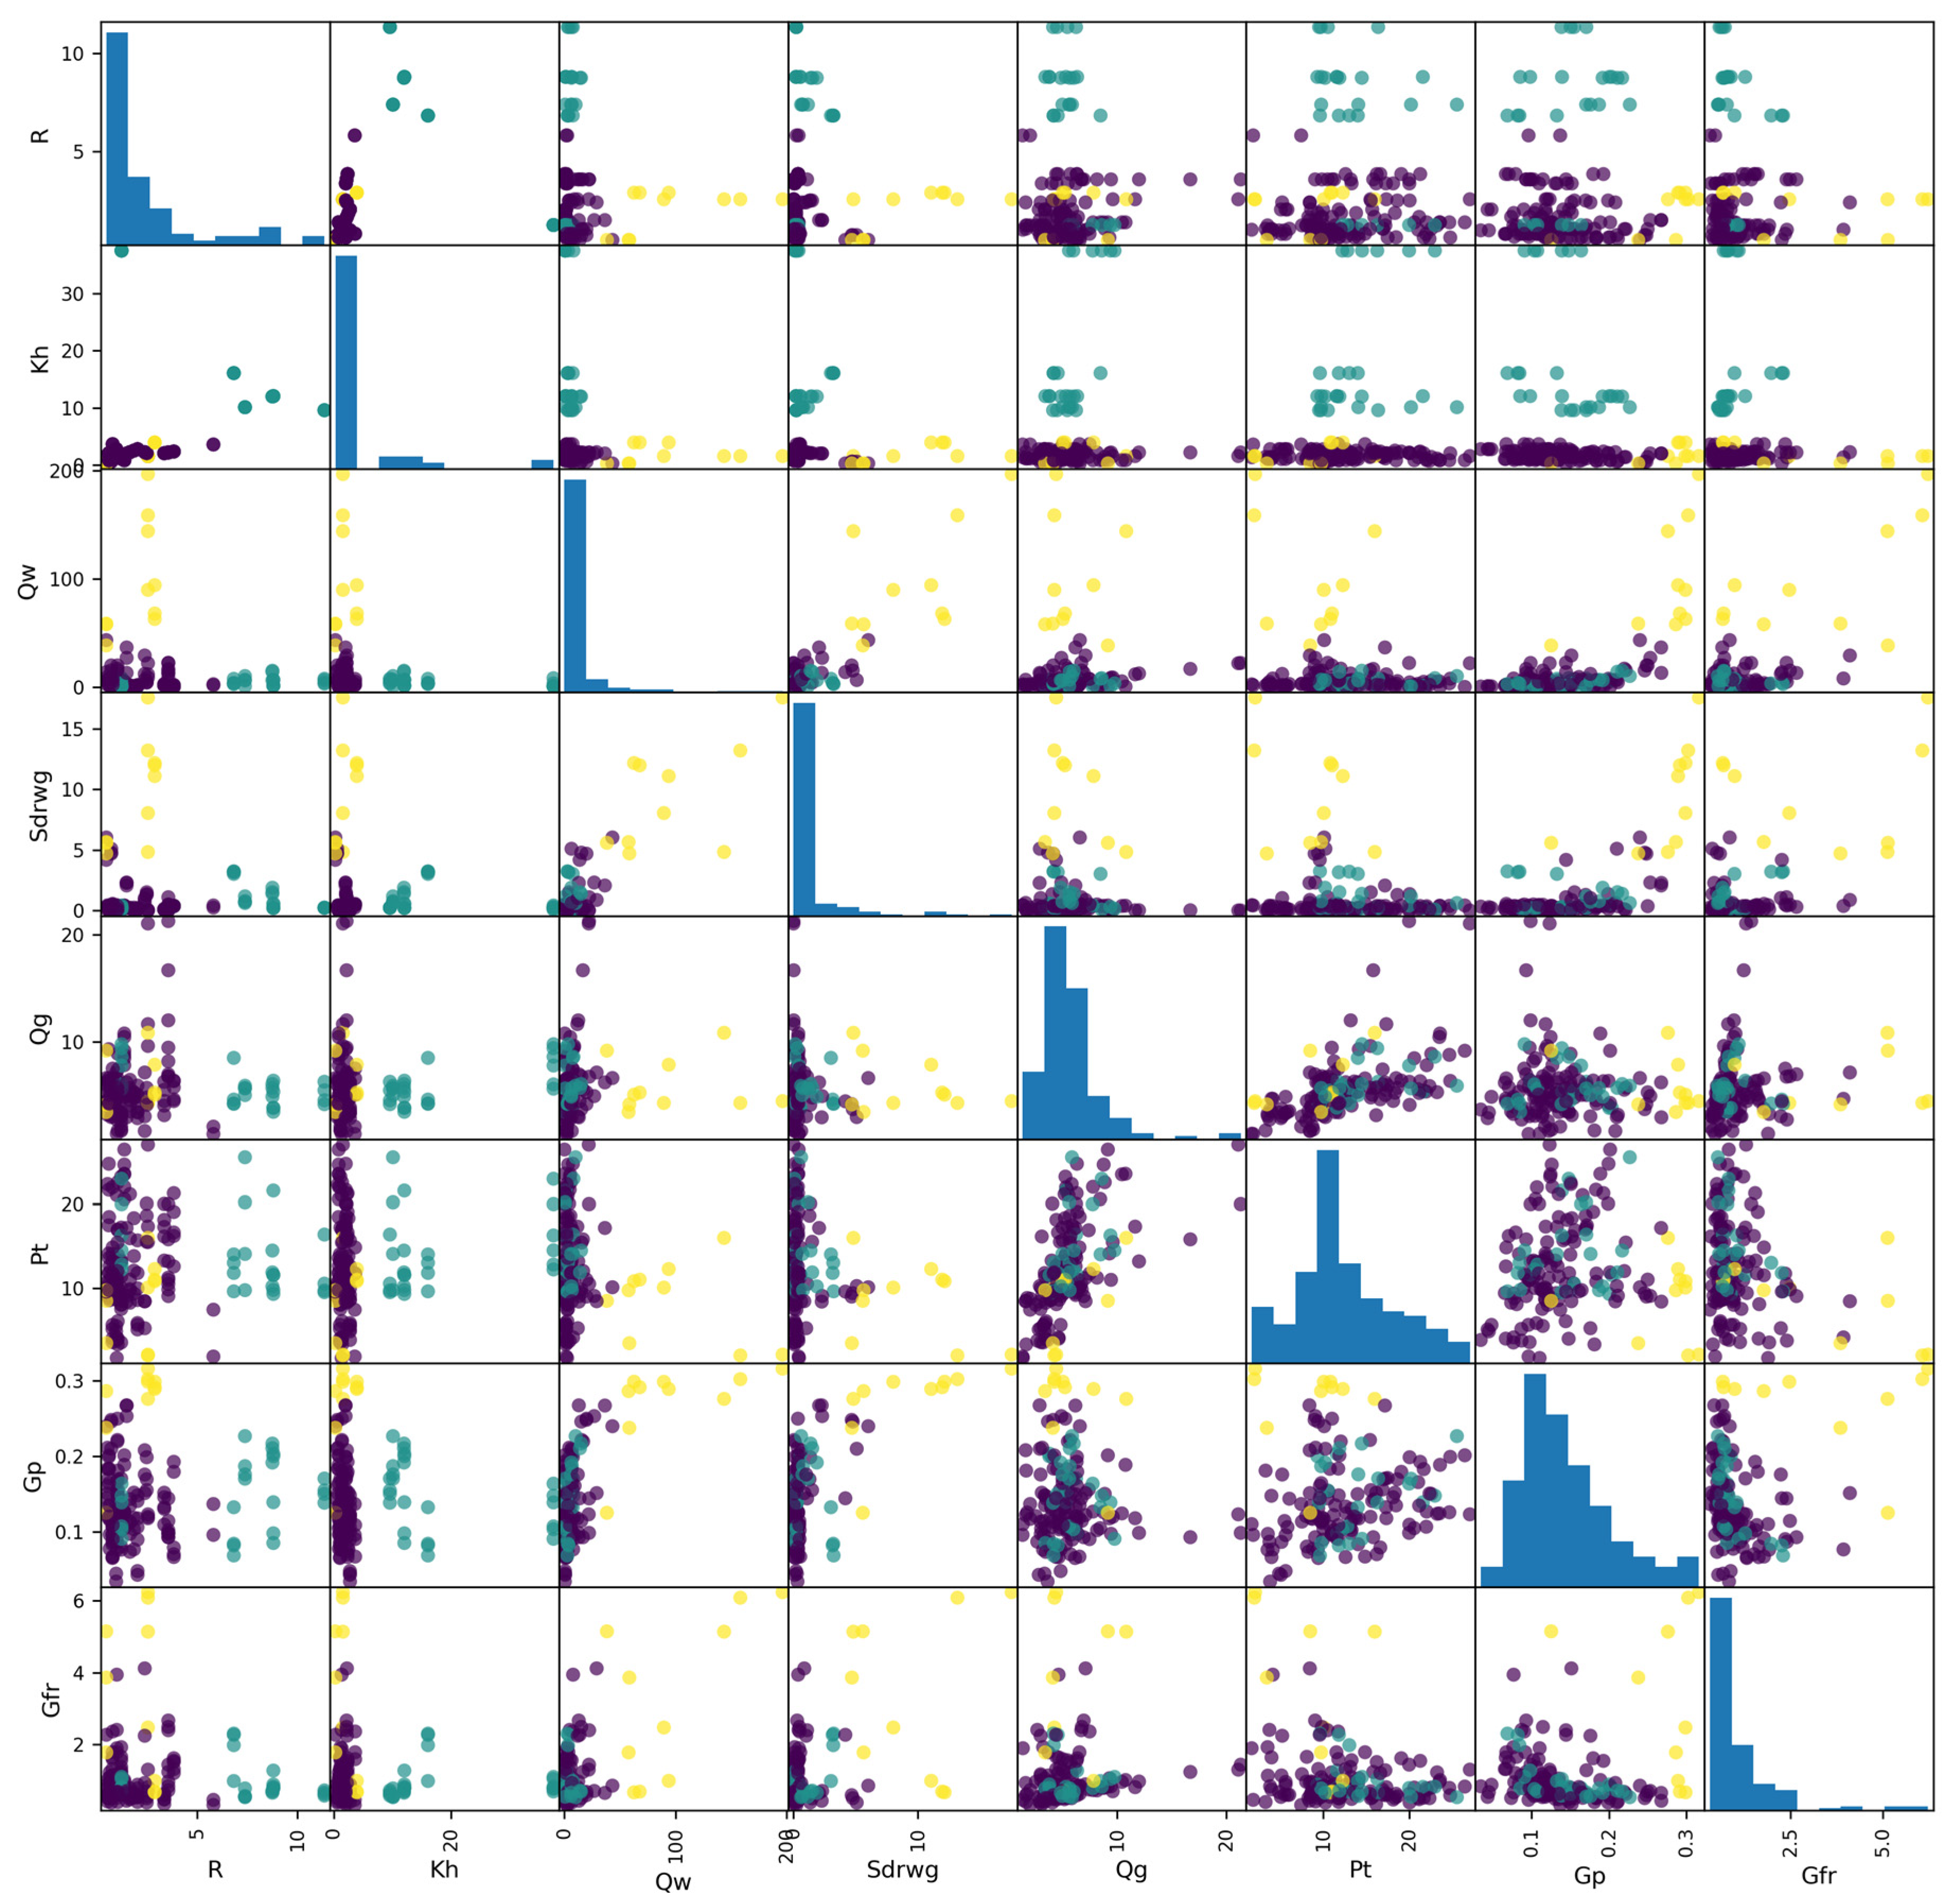
When constructing a model based on the direct clustering scheme illustrated in Figure 7a, it is essential to first determine the optimal number of clusters, denoted as K. In this study, a multi-criteria evaluation system was implemented, encompassing WCSS, silhouette score, and Davies–Bouldin index. A 5-fold cross-validation process was utilized to ensure a comprehensive evaluation. As shown in Figure 8, the optimum number of clusters as determined by the elbow method is 3. At this point, it has the highest silhouette score and the smallest Davies–Bouldin index. Consequently, the sample dataset was partitioned into three distinct categories. Figure 9 presents the scatterplot matrix of the input features for each cluster, with histograms along the diagonal illustrating the distribution of individual features. The off-diagonal plots depict pairwise feature relationships, revealing a strong correlation among current gas production, tubing pressure, and pressure gradient.
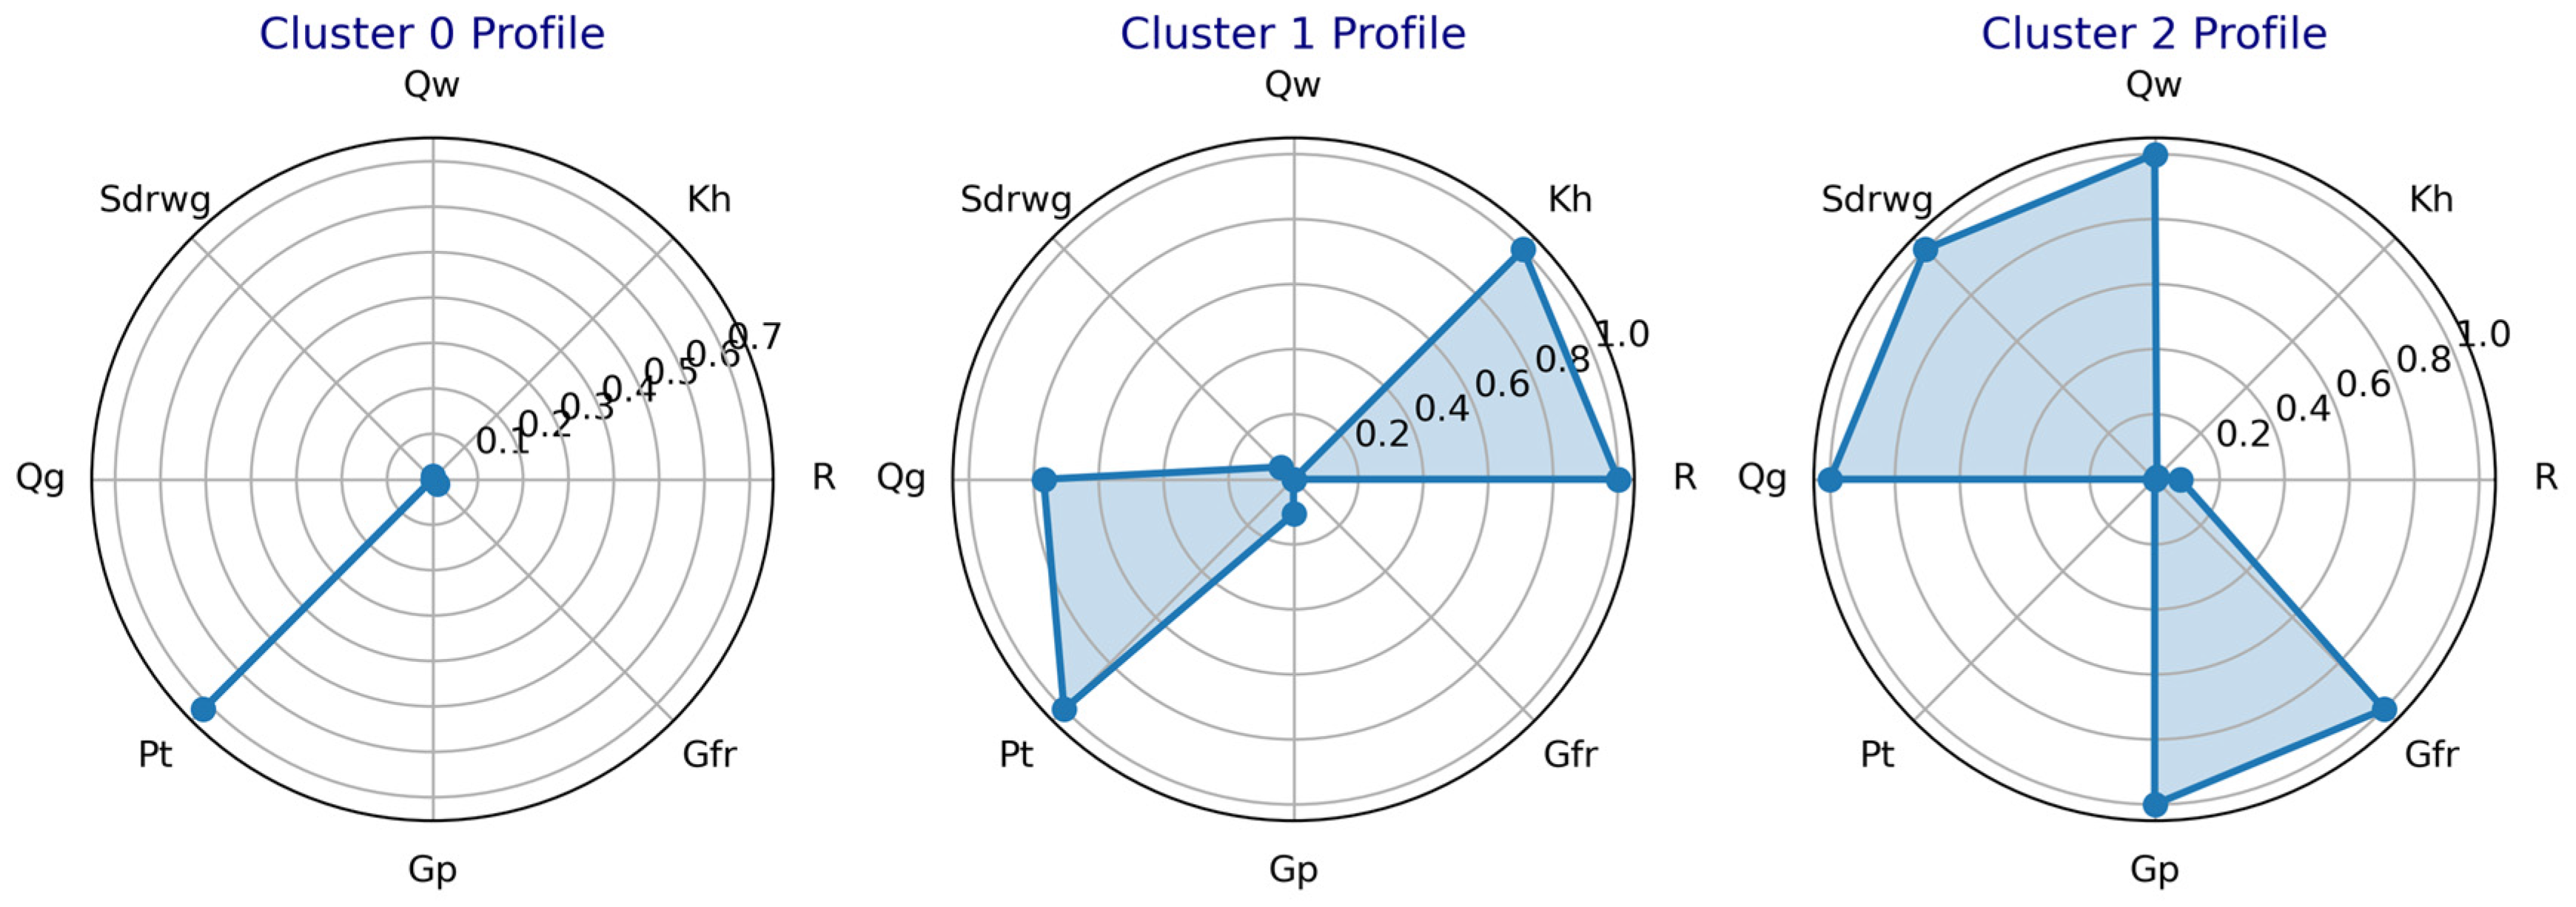
To visually illustrate the characteristic distribution of different gas well types, a radar chart (Figure 10) was constructed. Based on the analysis of Figure 10, the following observations can be made:
(1)
Cluster 0: The Pt index value is moderately high (approximately 0.7), whereas the values of other indicators are relatively low (close to 0). This suggests that the current tubing pressure of this gas well type is acceptable, but the overall production capacity is relatively low.
(2)
Cluster 1: The R, Kh, Pt, and Qg indices exhibit high values (approaching 1), while other indicators remain low. This type of gas well demonstrates favorable static reservoir performance, characterized by high tubing pressure and gas production capacity. Additionally, it possesses the ability to continuously carry liquid naturally, indicating no requirement for additional drainage or production enhancement measures.
(3)
Cluster 2: The Qg, Qw, Sdrwg, Gp, and Gfr indices are significantly elevated (approaching 1), with other indicators at low levels. This gas well type exhibits high liquid production intensity and presents a substantial demand for effective liquid drainage strategies.
As previously discussed, the distinctions among the three clusters are relatively ambiguous, particularly regarding their utility in guiding decisions related to production and drainage strategies. For example, the production characteristics associated with cluster 0 lack clarity, and the appropriate production enhancement measures to apply remain undefined.

4.2. LDA and K-Means Fusion Clustering

The hybrid clustering approach integrating LDA and K-means, as illustrated in Figure 7b, represents a fusion of supervised and unsupervised learning techniques. Figure 11 presents the variation in the evaluation indicators with respect to the increasing number of clusters. According to the elbow method, the optimal clustering configuration for the sample data under this approach is determined to be five clusters, which has the highest silhouette score and the smallest Davies–Bouldin index. As shown in Table 3, in comparison with the direct K-means clustering approach, the hybrid clustering method accomplishes a substantial decrease in the WCSS, from 778.376 to 163.382. Concurrently, the silhouette score exhibited an increase from 0.537 to 0.559, while the Davies–Bouldin index demonstrated a decrease from 0.758 to 0.576. The results demonstrate the superiority of the hybrid clustering method over direct K-means clustering with regard to its effectiveness in achieving optimal clustering outcomes.
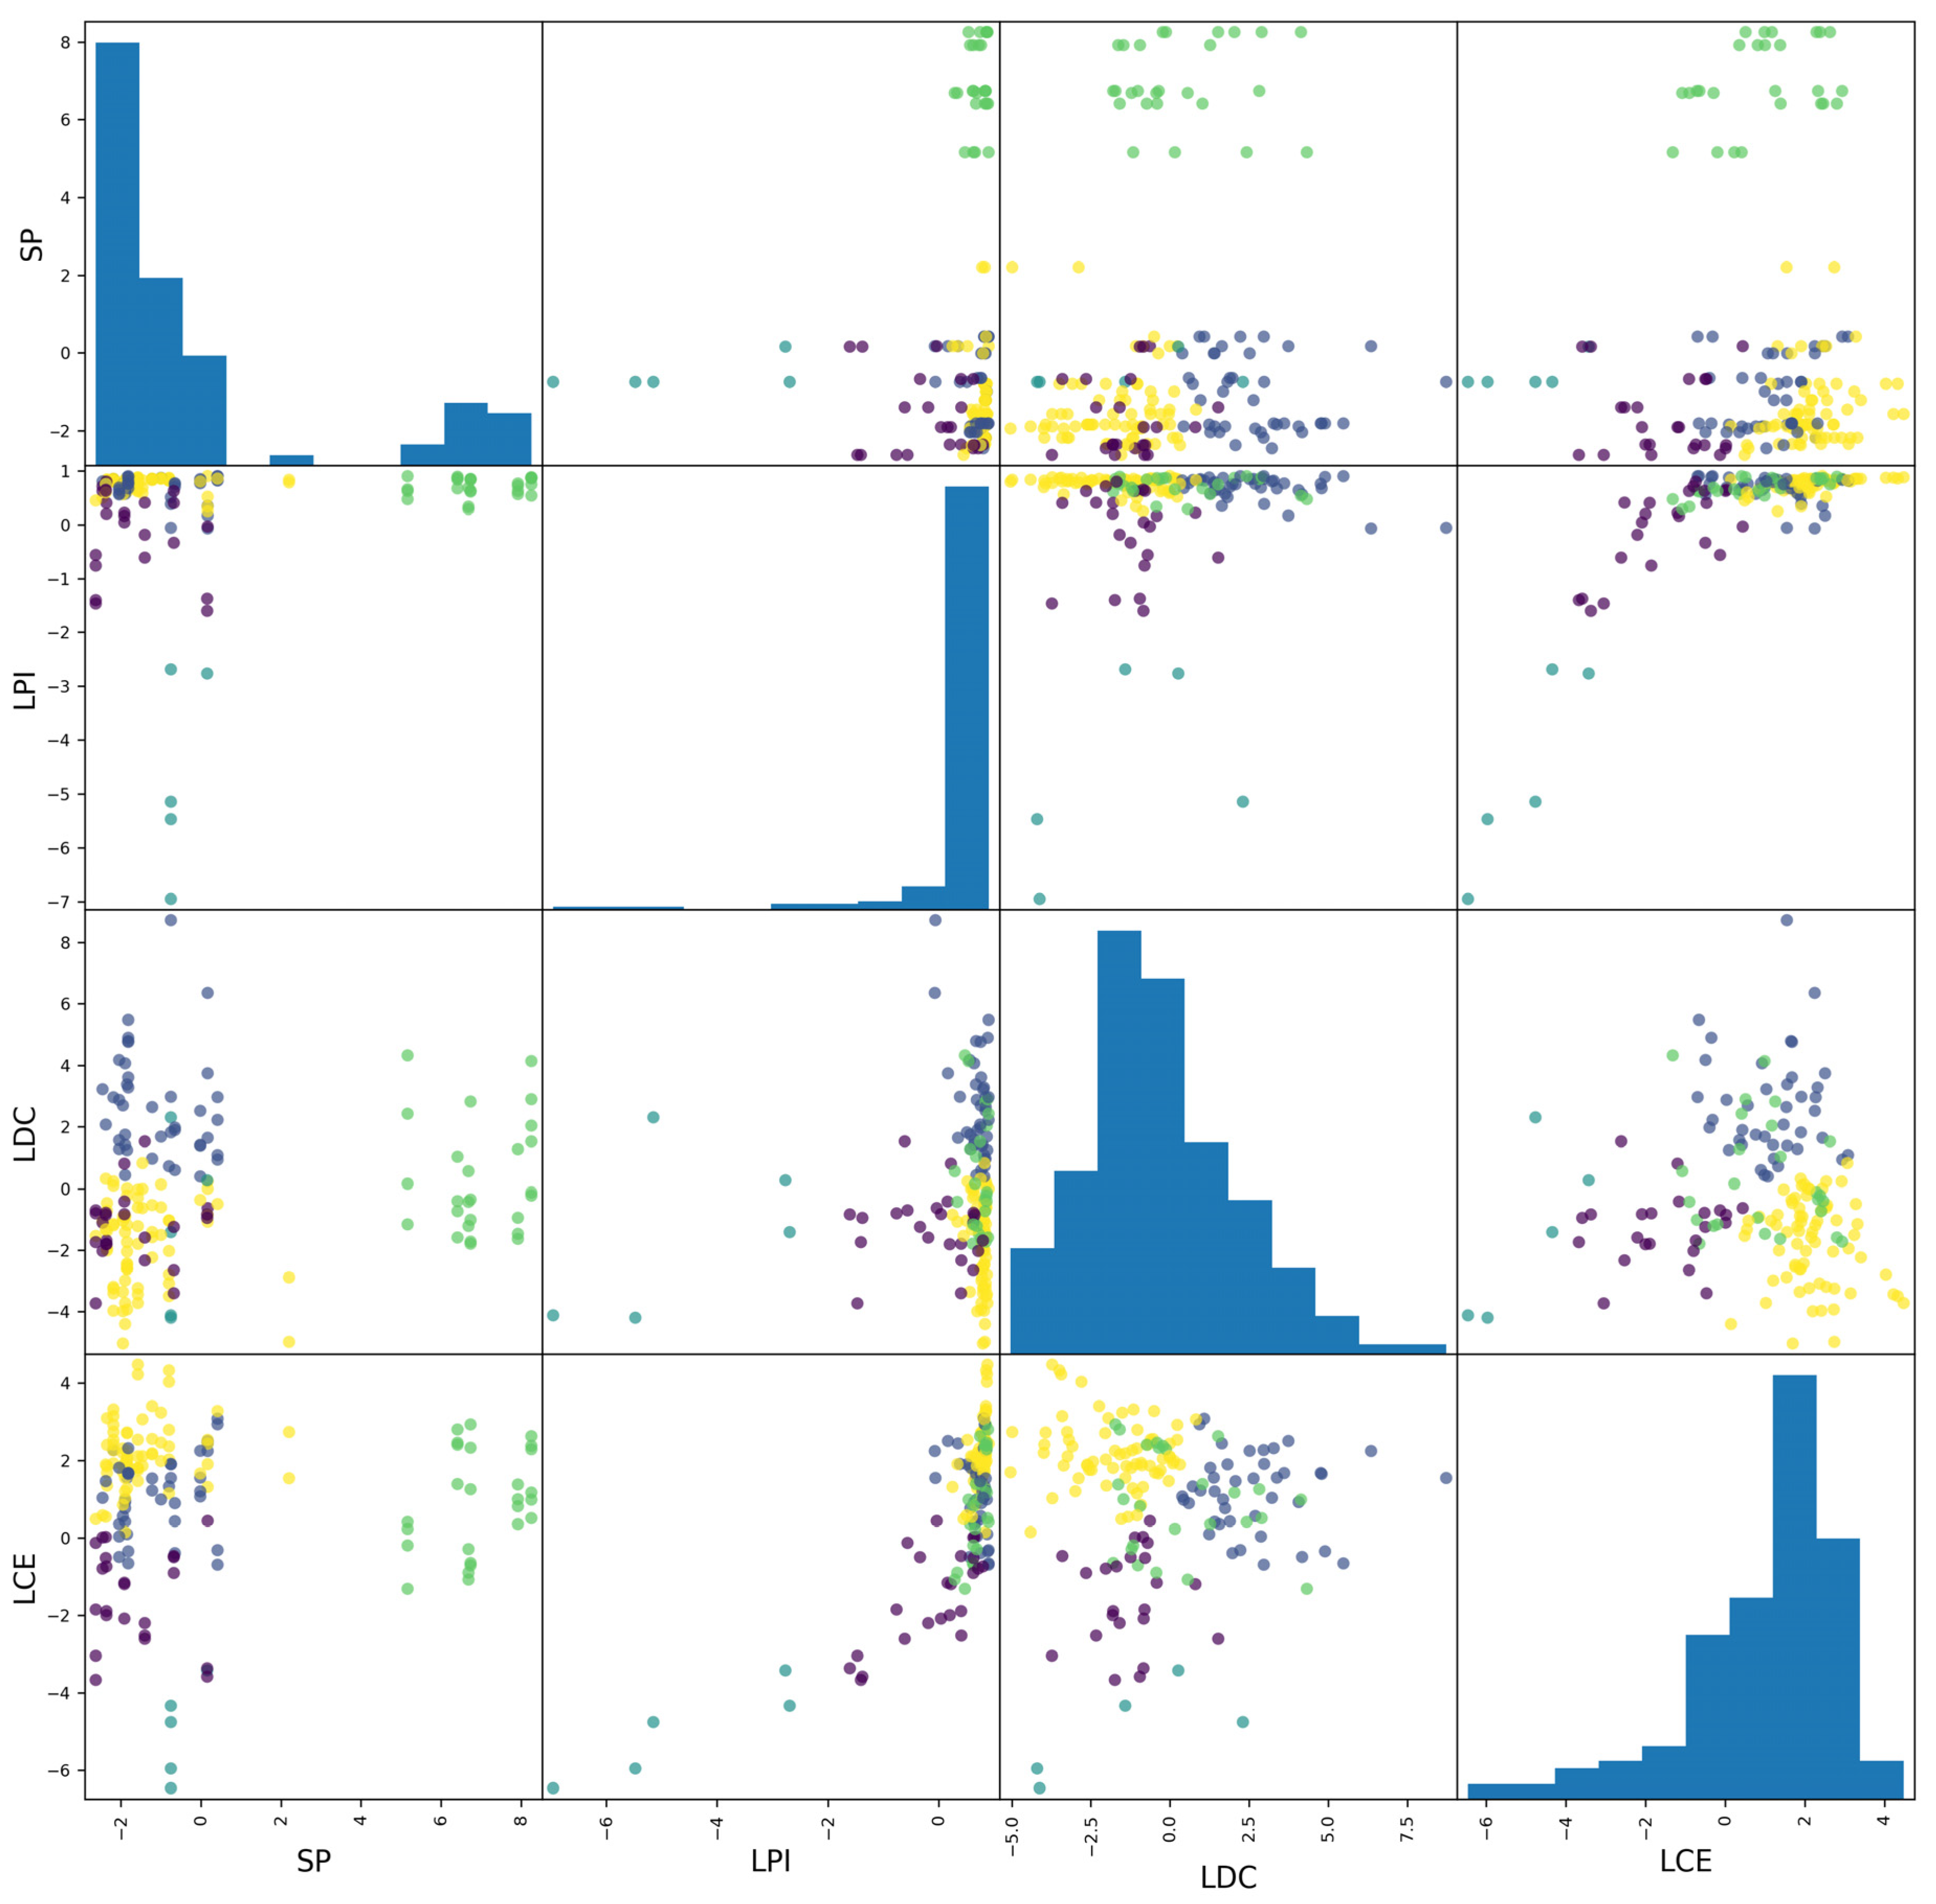
The spatial distribution of each cluster within the input feature scatter matrix is displayed in Figure 12. In comparison to Figure 9, the class separability is markedly enhanced after dimensionality reduction, indicating improved clustering performance.
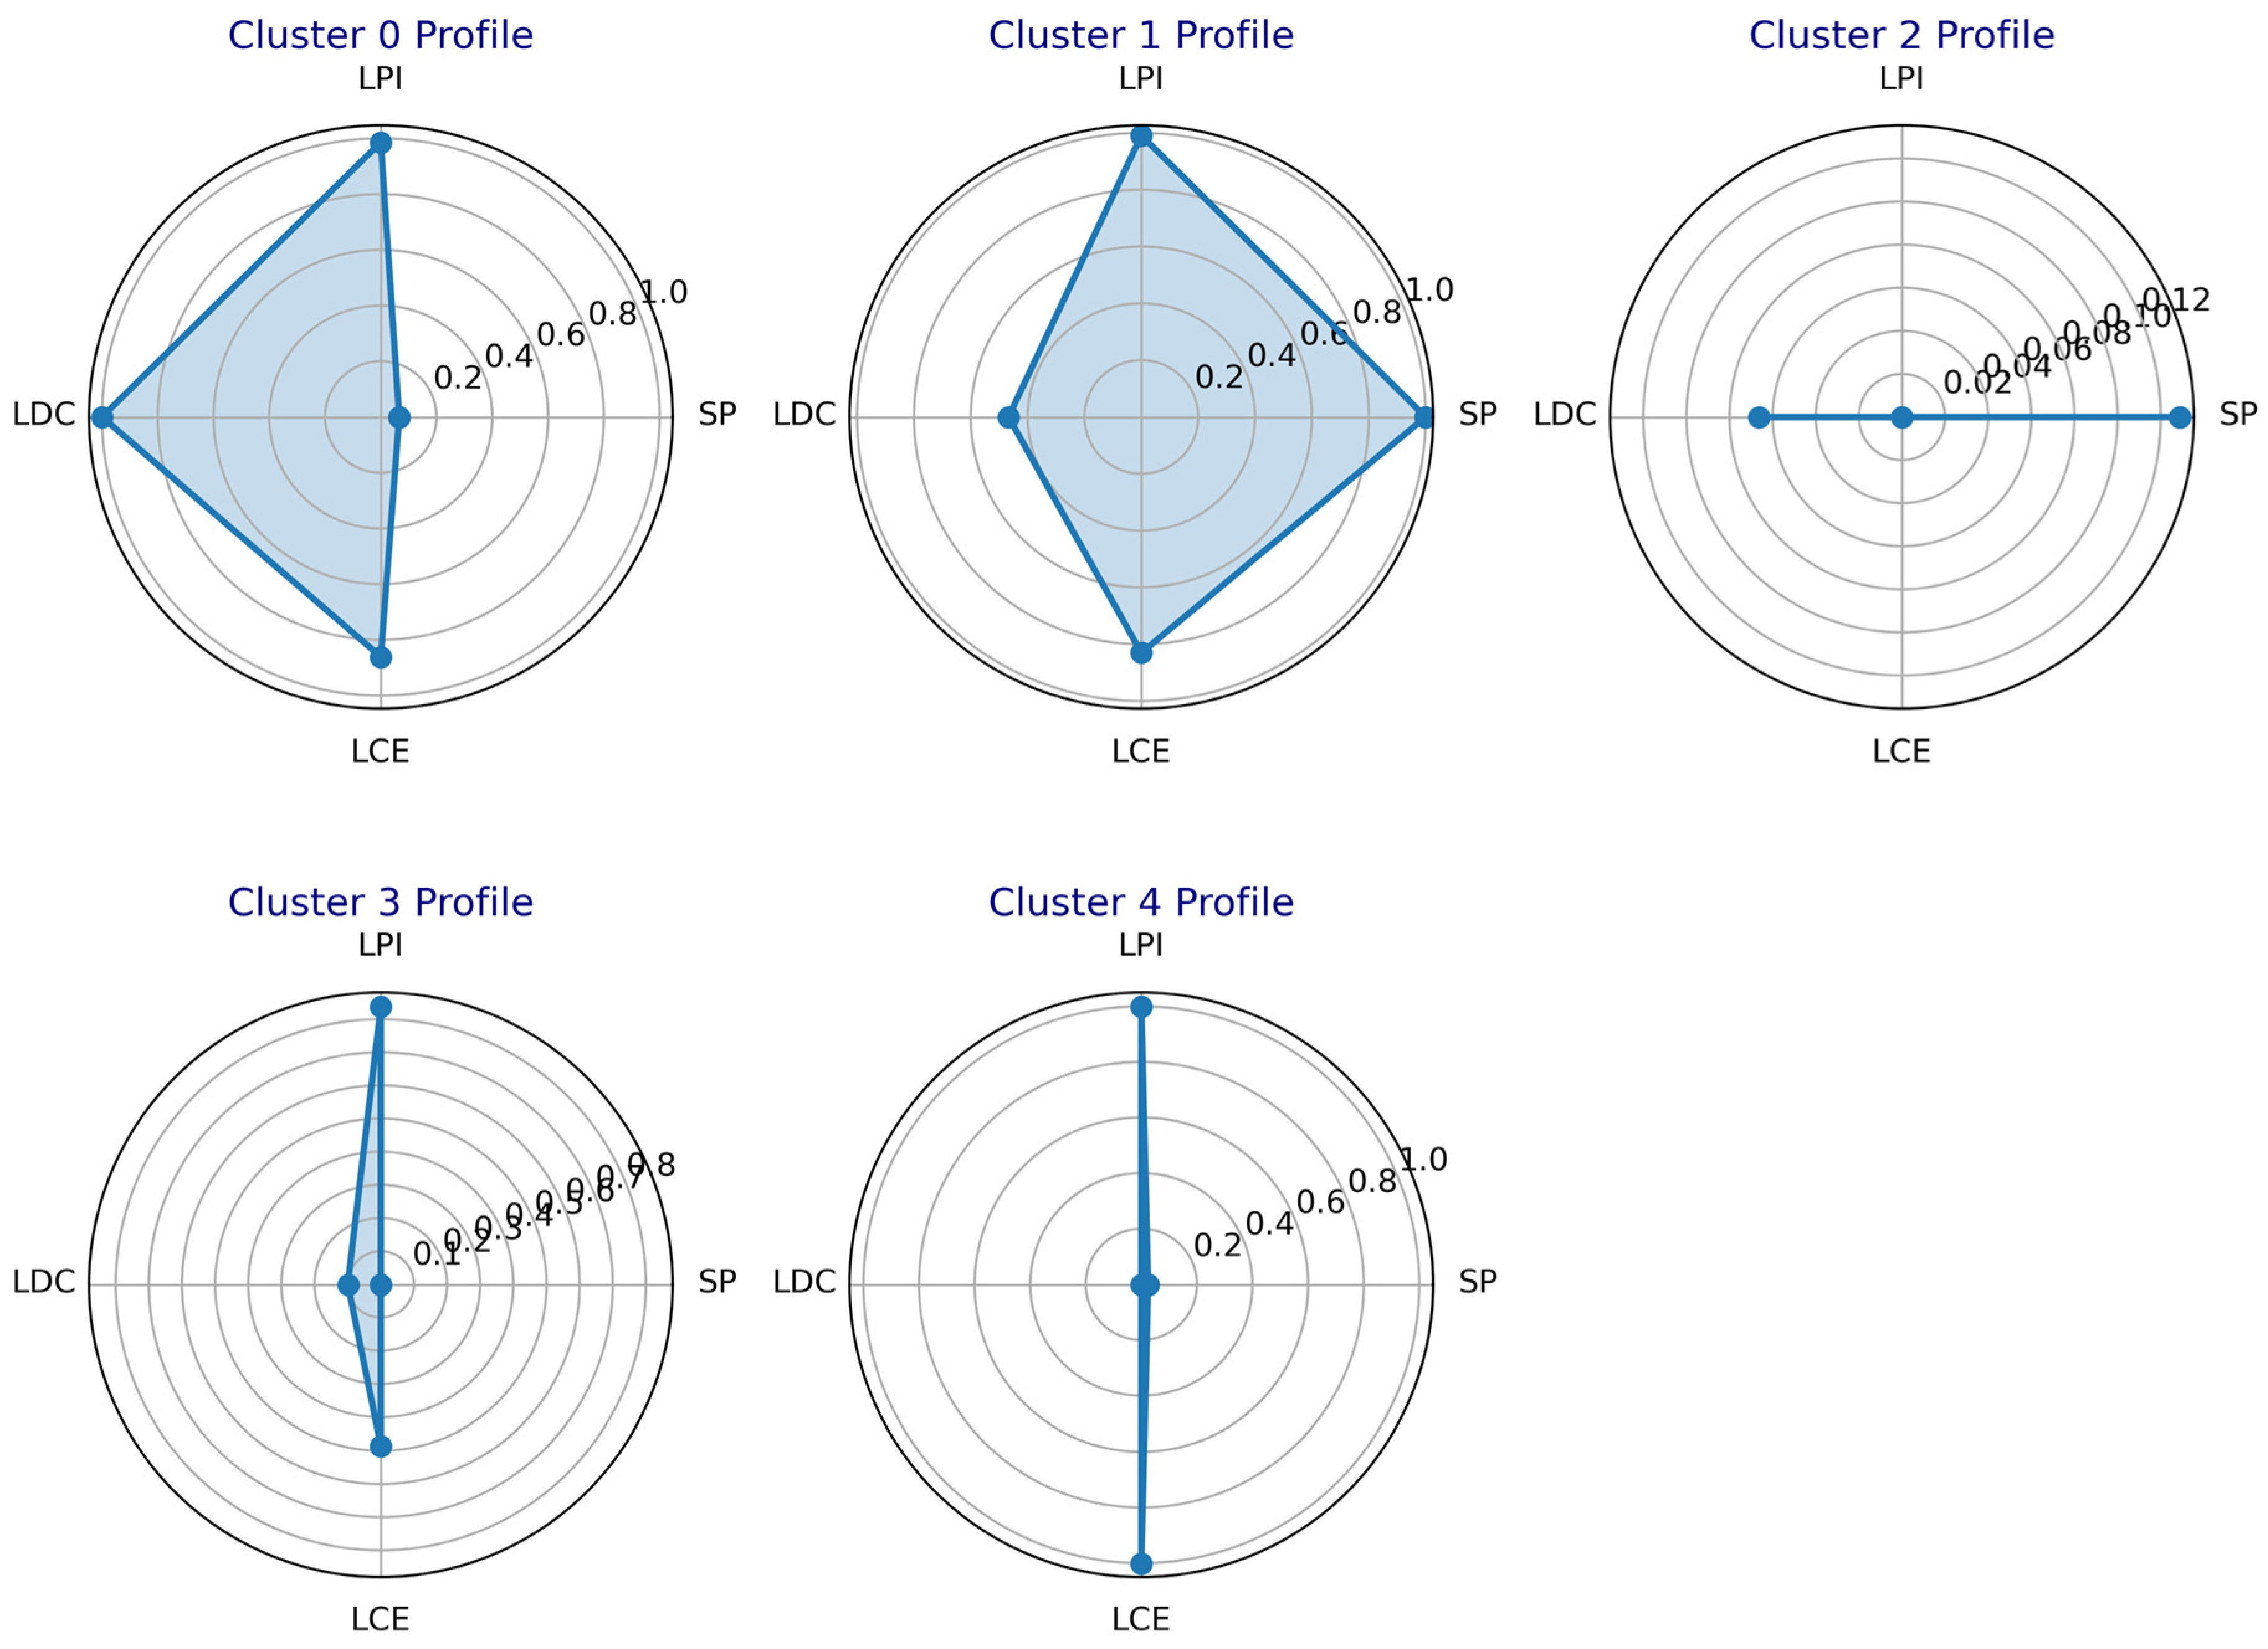
Figure 13 presents the feature distribution of each clustering category. The detailed analysis is summarized as follows:
(1)
Cluster 0: This cluster exhibits high values for LPI, LDC, and LCE indices (close to 1), while the SP index remains low (close to 0). These characteristics indicate poor static reservoir performance and low liquid production intensity. However, both liquid drainage capacity and liquid carrying efficiency are relatively high. The well demonstrates a moderate capacity for production allocation adjustment, suggesting that optimization of the production allocation strategy is recommended.
(2)
Cluster 1: The SP, LPI, and LCE indices are high (close to 1), while the LDC index is at a moderate level. This cluster represents gas wells with favorable static reservoir performance, low liquid production intensity, and high liquid carrying efficiency. The wells exhibit medium liquid drainage capacity, strong stable production capability, and the ability to continuously carry liquid without requiring additional drainage or production enhancement measures.
(3)
Cluster 2: All indicator values are relatively low. These wells are characterized by high liquid production intensity, poor static reservoir performance, and limited liquid drainage capacity. They exhibit low gas production rates and face challenges in maintaining continuous liquid carrying, resulting in intermittent production behavior. Therefore, the implementation of effective artificial drainage gas recovery measures is strongly recommended.
(4)
Cluster 3: The LPI index is high, the LCE index is moderate, and the remaining indices are low. These wells exhibit low liquid production intensity and moderate liquid carrying efficiency, but poor static reservoir performance and limited liquid drainage capacity. The gas production rate is low, and it is recommended to apply the foam drainage gas recovery technique to enhance performance.
(5)
Cluster 4: This cluster is characterized by high LPI and LCE indices, with all other indices at low levels. The wells exhibit low liquid production intensity and high liquid carrying efficiency, but extremely poor static reservoir performance and inadequate liquid drainage capacity. Given the low gas production rate, it is recommended to implement optimized tubing string or plunger gas lift drainage gas recovery technologies to improve the liquid carrying efficiency of these wells.
To quantitatively demonstrate the individual contribution of each proposed parameter (LPI, LDC, LCE) to the clustering quality, a detailed sensitivity analysis was performed via an ablation study. The present study involved the design of three variant models of the hybrid method. Each variant eliminated one of the three new parameters. The evaluation of these variant models was conducted on the same dataset, employing established internal validation indicators that have been previously documented. The results of this sensitivity analysis are summarized in Table 4, which clearly demonstrates how the absence of each parameter affects the clustering performance. As demonstrated, in comparison with the full model, the elimination of LPI resulted in a substantial decrease in the silhouette score and a significant increase in the Davies–Bouldin index. The influence of LCE on these two indicators was not significant. It is evident that LPI has the greatest impact on the quality of clustering, with LDC ranking second and LCE having the least significant effect.

4.3. Comparative Analysis of Two Clustering Approaches

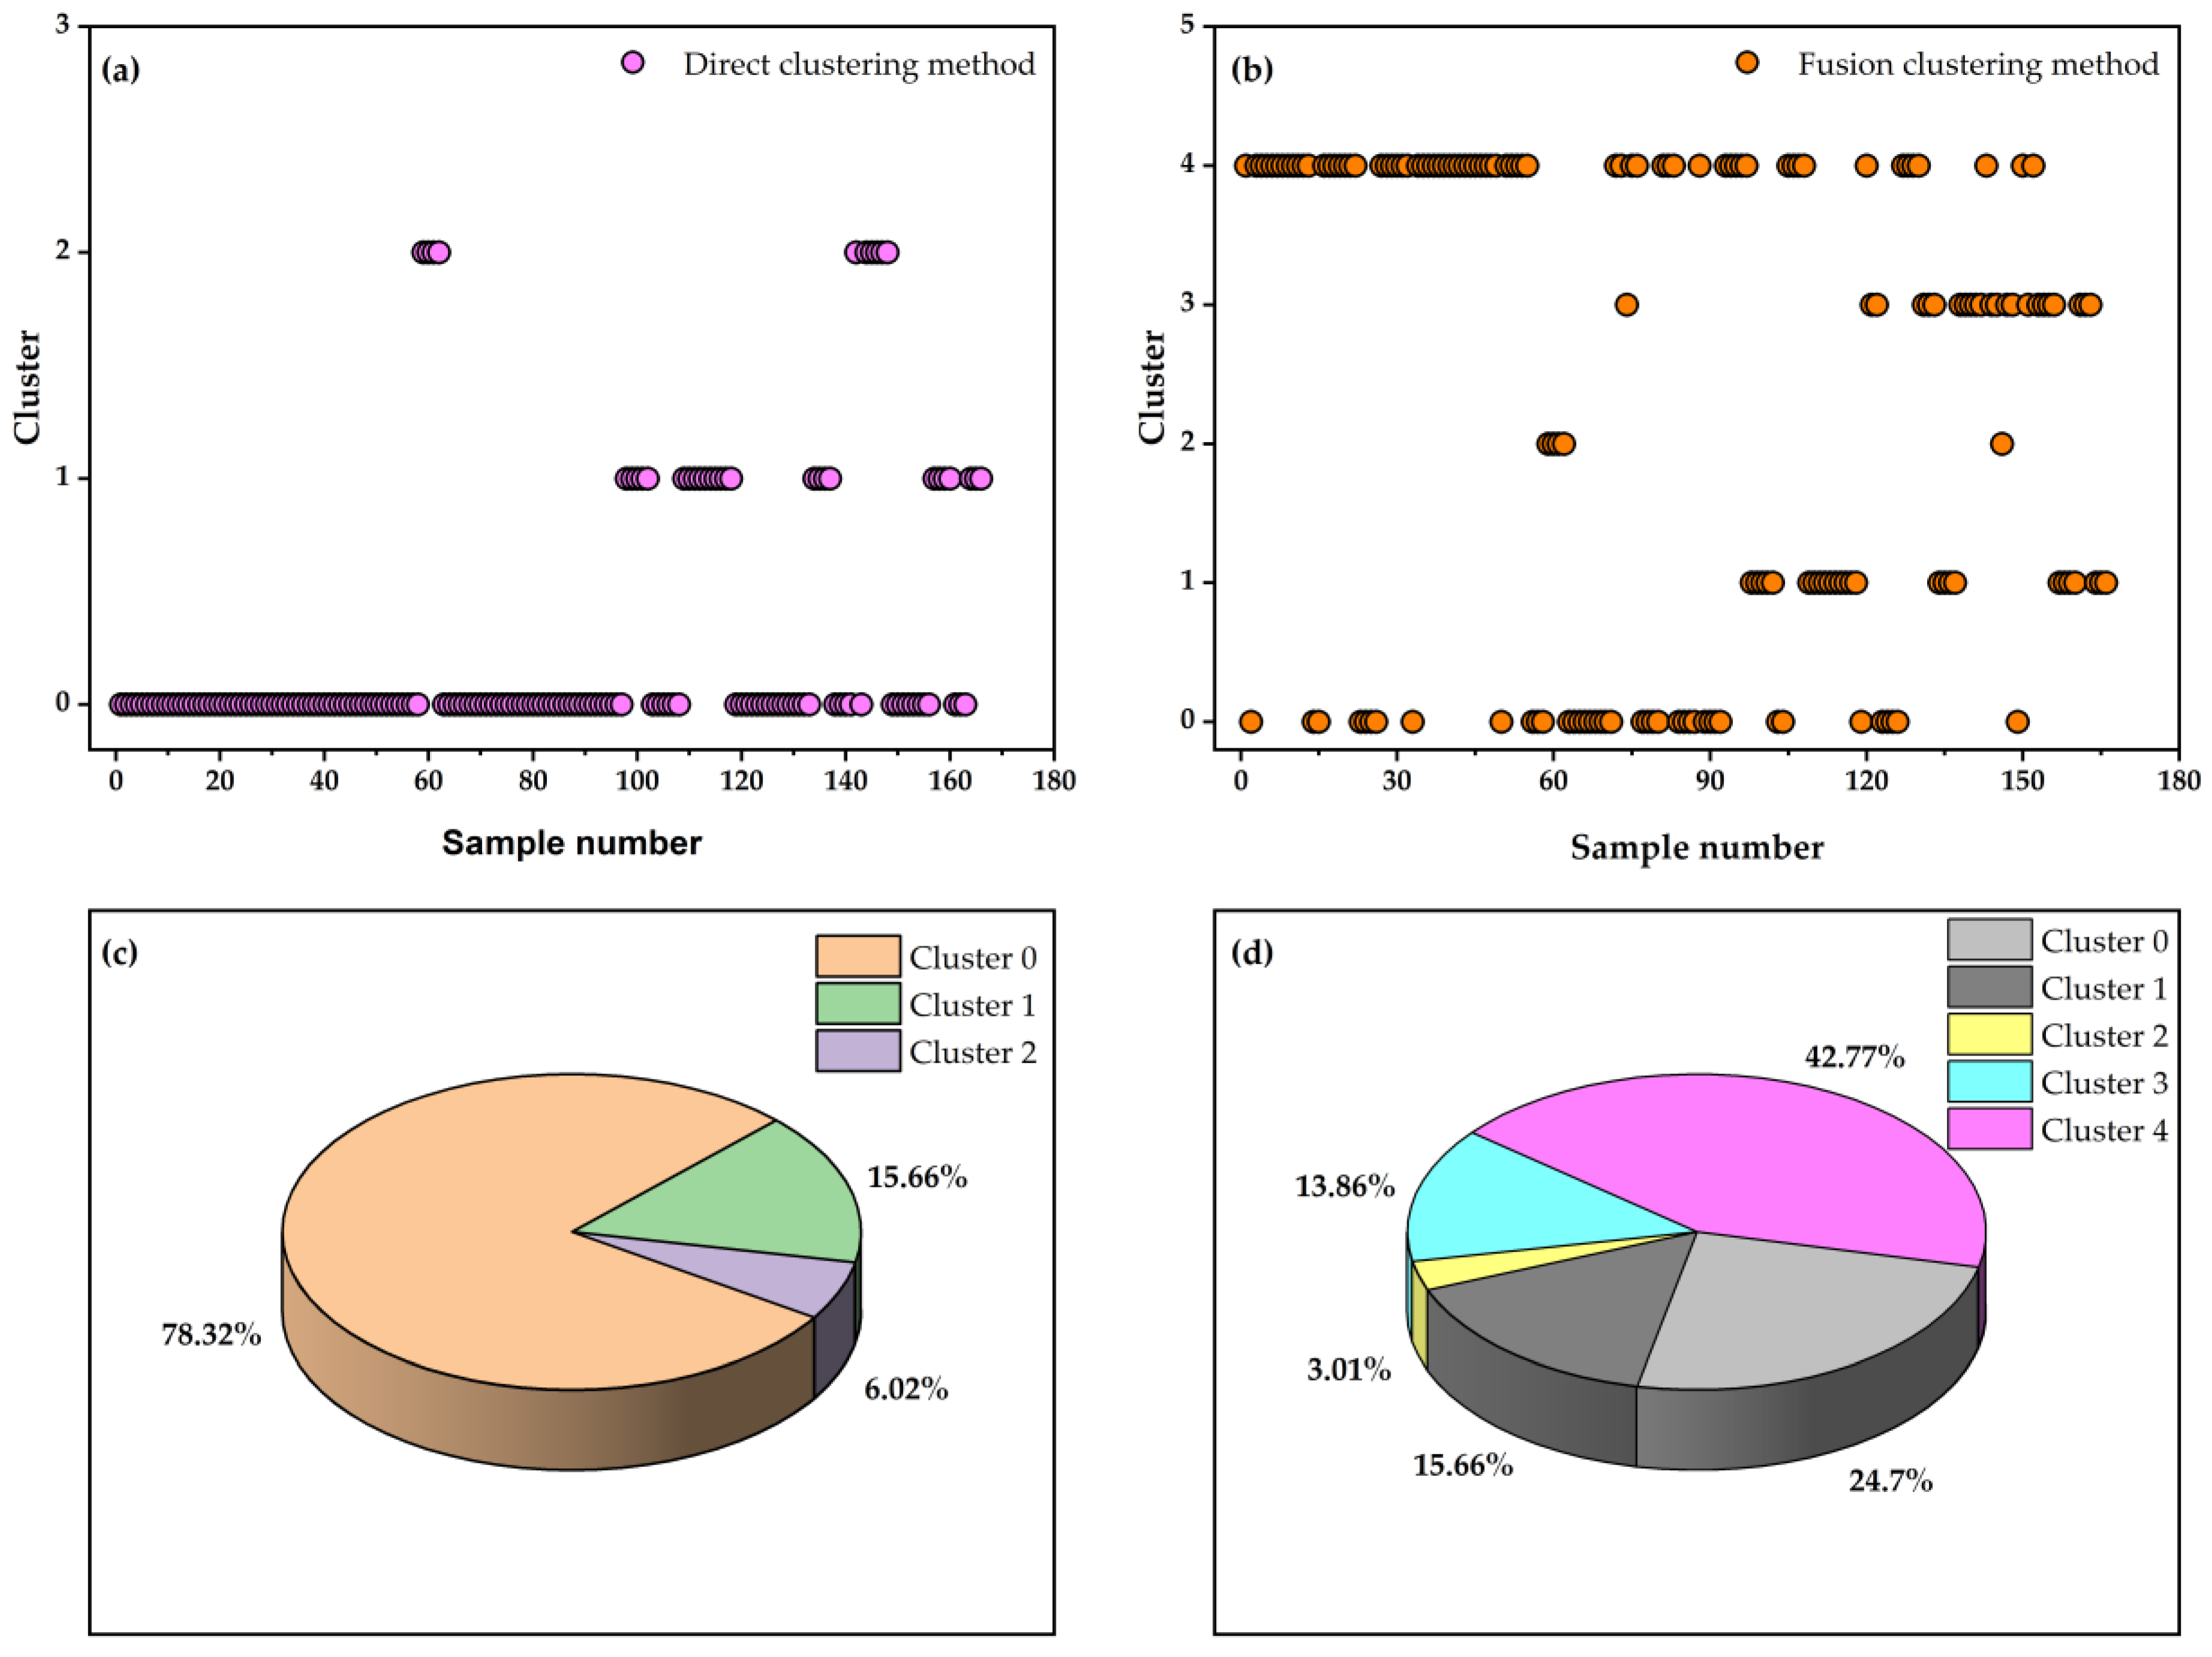
As previously analyzed, the fusion clustering method categorizes gas wells into a greater number of types compared to direct clustering. Figure 14 presents the cluster classifications for each gas well sample and the corresponding proportions under the two clustering schemes. In scheme 1, the three identified categories consist of 130, 26, and 10 wells, respectively, indicating that 26 wells are capable of continuous liquid carrying. However, the proportion of wells characterized by low comprehensive production capacity (cluster 0) reaches as high as 78.32%, which does not align with actual production dynamics. This suggests that the classification of low-quality wells derived from the direct clustering method is overly generalized and its reliability is questionable. In contrast, scheme 2 identifies five distinct categories comprising 41, 26, 5, 23, and 71 wells, respectively. Among these, the number of high-quality wells remains consistent with scheme 1 at 26. Additionally, 41 wells require stable production enhancement measures, 5 wells necessitate mandatory drainage measures, 23 wells are suitable for foam-assisted drainage gas production, and 71 wells are recommended for optimized tubing string or plunger lift-assisted drainage gas production.
In summary, the classification outcomes generated by the fusion method exhibit a higher degree of refinement, thereby facilitating more effective and refined management of gas wells.
Although the proposed fusion method demonstrates promise, several limitations should be acknowledged. First, the model was trained solely on data from a specific geographic region, and its generalizability to other gas fields has not yet been established. Second, while the current feature set integrates domain-specific knowledge, it may not fully account for all variables influencing well performance. To address these constraints, future research should prioritize validating and refining the approach using larger, multi-regional datasets to enhance its robustness and broader applicability. Additionally, investigating deep learning-based feature extraction methods applied directly to raw production data could complement the existing hand-engineered features and improve the model’s representational capability.

5. Conclusions

Accurate classification of horizontal gas wells serves as a critical foundation for developing effective production and drainage strategies and achieving refined management of gas fields. This study introduces a hybrid classification approach that integrates supervised LDA with unsupervised K-means clustering, specifically designed to meet the operational requirements of gas well production and drainage. Compared to conventional K-means clustering, the proposed fusion method demonstrates superior classification performance. The key findings are summarized as follows:
(1)
Horizontal gas wells were classified based on four dimensions: static performance, liquid production intensity, liquid drainage capacity, and liquid carrying efficiency. The results indicate a low degree of alignment between dynamic and static classification outcomes, suggesting that single-dimensional classification methods—whether dynamic or static—are insufficient to comprehensively characterize the actual production conditions of gas wells.
(2)
By integrating dynamic and static parameters and applying a strategy combining LDA-based dimensionality reduction with K-means clustering, horizontal gas wells were categorized into five distinct types. In comparison to direct clustering, the proposed method yields more refined classification results with enhanced practical relevance for production guidance.
(3)
Significant differences in production characteristics were observed among the five well types. Accordingly, targeted production optimization strategies were proposed, including production allocation optimization, continuous production (without the need for drainage), intensified drainage measures, foam-assisted drainage, and selection of optimal tubing or plunger lift systems.
(4)
The methodologies and conclusions presented in this study offer theoretical support and technical insights that can be applied to the classification of horizontal gas wells in other unconventional reservoirs, such as shale gas formations.

Author Contributions

Conceptualization, H.G. and J.W.; Methodology, H.G. and J.W.; Software, H.G., J.W., T.L. and G.W.; Validation, J.W., T.L. and G.W.; Formal analysis, J.W., T.L. and G.W.; Investigation, T.L., S.L., B.W., Z.Z., G.W. and R.L.; Resources, S.L., B.W. and Z.Z.; Data curation, S.L., L.G., Z.Z. and G.W.; Writing—original draft, H.G., S.L. and B.W.; Visualization, B.W., L.G. and R.L.; Supervision, H.G., L.G. and R.L.; Project administration, H.G.; Funding acquisition, Z.Z. and R.L. All authors have read and agreed to the published version of the manuscript.

Funding

This work was financially supported by the National Natural Science Foundation of China (62173049), the Projects of Talents Recruitment of GDUPT (2022rcyj2009) and the Science and Technology Project of Maoming (2023014).

Data Availability Statement

The data that support the findings of this study are available from the corresponding author upon reasonable request.

Conflicts of Interest

Authors Han Gao, Jia Wang, Tao Liu, Siyu Lai, Bo Wang and Ling Guo were employed by Oil Recovery Technology Research Institute, Xinjiang Oilfield Branch. The remaining authors declare that the research was conducted in the absence of any commercial or financial relationships that could be construed as a potential conflict of interest.

References

  1. Shang, Y.; Zhai, S.; Lin, X.; Li, X.; Li, H.; Feng, Q. Dynamic and static integrated classification model for low permeability tight gas wells based on XGBoost algorithm. Spec. Oil Gas Reserv. 2023, 30, 135–143. [Google Scholar] [CrossRef]
  2. Wei, Y.; Jia, A.; He, D.; Liu, Y.; Ji, G.; Cui, B.; Ren, L. Classification and evaluation of horizontal well performance in Sulige tight gas reservoirs, Ordos Basin. Nat. Gas Ind. 2013, 33, 47–51. [Google Scholar] [CrossRef]
  3. Li, J.; Liu, Z.; Kou, S.; Zhang, X.; Liu, R.; Wang, J. Study on main controlling factors of water production in tight gas wells. Xinjiang Oil Gas 2022, 18, 20–25. [Google Scholar] [CrossRef]
  4. Chen, R. Well selection conditions of velocity string fluid drainage and gas production technology. Xinjiang Oil Gas 2022, 18, 67–73. [Google Scholar] [CrossRef]
  5. Jia, Y.; Shi, J.; Li, X.; Chen, H.; Fang, J.; Jiao, T.; Zhang, H.; Wang, Y. Classification and evaluation methods for low-permeability tight gas wells in the Zizhou gas field of Changqing. Geol. Explor. 2021, 57, 647–655. [Google Scholar] [CrossRef]
  6. Li, T.; Huang, X. Classification of horizontal wells based on dynamic data and its application in ultra-low permeability gas reservoirs. Chem. Technol. Fuels Oils 2017, 53, 123–134. [Google Scholar] [CrossRef]
  7. Dong, J.; Yue, X.; Ding, J. Evaluation model of liquid production and its application in tight water-bearing gas reservoir. Spec. Oil Gas Reserv. 2018, 25, 90–94. [Google Scholar] [CrossRef]
  8. Zhu, Z.; Han, G.; Liang, X.; Chang, S.; Yang, B.; Yang, D. Rapid Classification and Diagnosis of Gas Wells Driven by Production Data. Processes 2024, 12, 1254. [Google Scholar] [CrossRef]
  9. Chi, M.; Ma, W.; Guo, L.; Xin, X.; Liao, R.; Gao, H.; Du, J.; Wang, X. An effective classification method for low-pressure and low production gas wells in XJ oilfield. J. Kunming Univ. Sci. Technol. (Nat. Sci.) 2023, 48, 55–63. [Google Scholar] [CrossRef]
  10. Zhao, C.; Jia, Y.; Qu, Y.; Zheng, W.; Hou, S.; Wang, B. Forecasting Gas Well Classification Based on a Two-Dimensional Convolutional Neural Network Deep Learning Model. Processes 2024, 12, 878. [Google Scholar] [CrossRef]
  11. Tian, L.; Zhu, Z.; Wang, L.; Yu, J.; Wang, Y. A rock drillability characterization method based on big data and unsupervised clustering algorithm. Xinjiang Oil Gas 2024, 20, 29–36. [Google Scholar] [CrossRef]
  12. Song, X.; Wang, Y.; Yang, Y.; Liu, M.; Zhu, Z. Intelligent diagnosis and analysis of stuck pipe based on supervised and unsupervised algorithms. Xinjiang Oil Gas 2025, 21, 24–34. [Google Scholar] [CrossRef]
  13. Yuan, J.; Xia, Y.; Li, J.; Ai, Q.; Xie, S.; Wu, Y. Classification of low pressure water producing gas wells by grey relational analysis. Petrochem. Ind. Appl. 2018, 37, 73–75. [Google Scholar] [CrossRef]
  14. Dong, F.; Sun, Z.; Gao, Z.; Sun, Z.; Huang, H.; Chen, Y.; Lu, X. Optimization of low-production and low-efficiency gas wells based on multi-method fusion. Geol. Explor. 2023, 59, 657–663. [Google Scholar] [CrossRef]
  15. Cai, J.; Peng, X.; Yang, C.; Li, L.; Liu, W.; Liu, X.; Xu, R.; Wang, B.; Li, Y.; Jiang, J. Research status and prospect of methods for determining the lower limit of reservoir physical properties in carbonate gas reservoirs. Nat. Gas Geosci. 2024, 35, 104–118. [Google Scholar]
  16. Sun, W.; Lou, Y.; Kamgue Lenwoue, A.R.; Li, Z.; Zhu, L.; Wu, H. Classification and Evaluation of Volcanic Rock Reservoirs Based on the Constraints of Energy Storage Coefficient. Front. Earth Sci. 2022, 10, 914383. [Google Scholar] [CrossRef]
  17. Zhang, H.; Pu, J.; Zhang, L.; Deng, H.; Yu, J.; Xie, Y.; Tong, X.; Man, X.; Liu, Z. Gas Production Prediction Model of Volcanic Reservoir Based on Data-Driven Method. Energies 2024, 17, 5461. [Google Scholar] [CrossRef]
  18. Albiter, A.; Vargas, J.A.; Contreras, A.; Cruz-Castro, L. A case study on the application of a mechanical system in a Mexican gas well with liquid loading issues. Flow Meas. Instrum. 2025, 104, 102887. [Google Scholar] [CrossRef]
  19. Mukherjee, H.; Brill, J.P. Liquid holdup correlations for inclined two-phase flow. J. Pet. Technol. 1983, 35, 1003–1008. [Google Scholar] [CrossRef]
  20. Wang, H.; Zhou, C.; Zhou, Z.; He, Z.; Chen, M. Comprehensive optimal selection method of drainage gas recovery technology for shale gas horizontal wells. Drill. Prod. Technol. 2022, 45, 154–159. [Google Scholar] [CrossRef]
  21. Beggs, D.H.; Brill, J.P. A study of two-phase flow in inclined pipes. J. Pet. Technol. 1973, 25, 607–617. [Google Scholar] [CrossRef]
  22. Zhao, S.; Zhang, B.; Yang, J.; Zhou, J.; Xu, Y. Linear discriminant analysis. Nat. Rev. Methods Primers 2024, 4, 70. [Google Scholar] [CrossRef]
  23. Sinaga, K.P.; Yang, M. Unsupervised K-means clustering algorithm. IEEE Access 2020, 8, 80716–80727. [Google Scholar] [CrossRef]
  24. Hosseinzadeh, S.; Mollajan, A.; Akbarzadeh, S.; Kadkhodaie, A. Rock type based-estimation of pore throat size distribution in carbonate reservoirs using integrated analysis of well logs and seismic attributes. Carbonates Evaporites 2024, 39, 46. [Google Scholar] [CrossRef]
  25. Abbas, M.A.; Al-Mudhafar, W.J.; Anees, A.; Wood, D.A. Integrating petrophysical data into efficient iterative cluster analysis for electrofacies identification in clastic reservoirs. Energy Geosci. 2024, 5, 100341. [Google Scholar] [CrossRef]
  26. Kazemi, H.; Yazdjerdi, K.; Asadi, A.; Mozafari, M.R. Comparison of clustering methods and conventional approaches for geological fracture analysis: A case study in northern Shiraz, Iran. An. Acad. Bras. Ciências 2025, 97, e20250043. [Google Scholar] [CrossRef]
  27. Ikotun, A.M.; Ezugwu, A.E.; Abualigah, L.; Abuhaija, B.; Heming, J. K-means clustering algorithms: A comprehensive review, variants analysis, and advances in the era of big data. Inf. Sci. 2023, 622, 178–210. [Google Scholar] [CrossRef]
  28. Chen, Y.; Chen, P.; Wang, Y.; Feng, G.; Yang, C.; Wang, Q. From clustering to federated learning: A collaborative approach to optimizing data-driven models for the production monitoring of unconventional natural gas wells. Gas Sci. Eng. 2025, 137, 205580. [Google Scholar] [CrossRef]
  29. Wang, W.; Lei, Y.; Liao, R.; Shi, H.; Zhang, Z. Mechanism-Data Coupling Driven Prediction Models of Liquid Leakage for Plunger Lift in Inclined Tube. Energy Sci. Eng. 2025, 13, 4825–4838. [Google Scholar] [CrossRef]
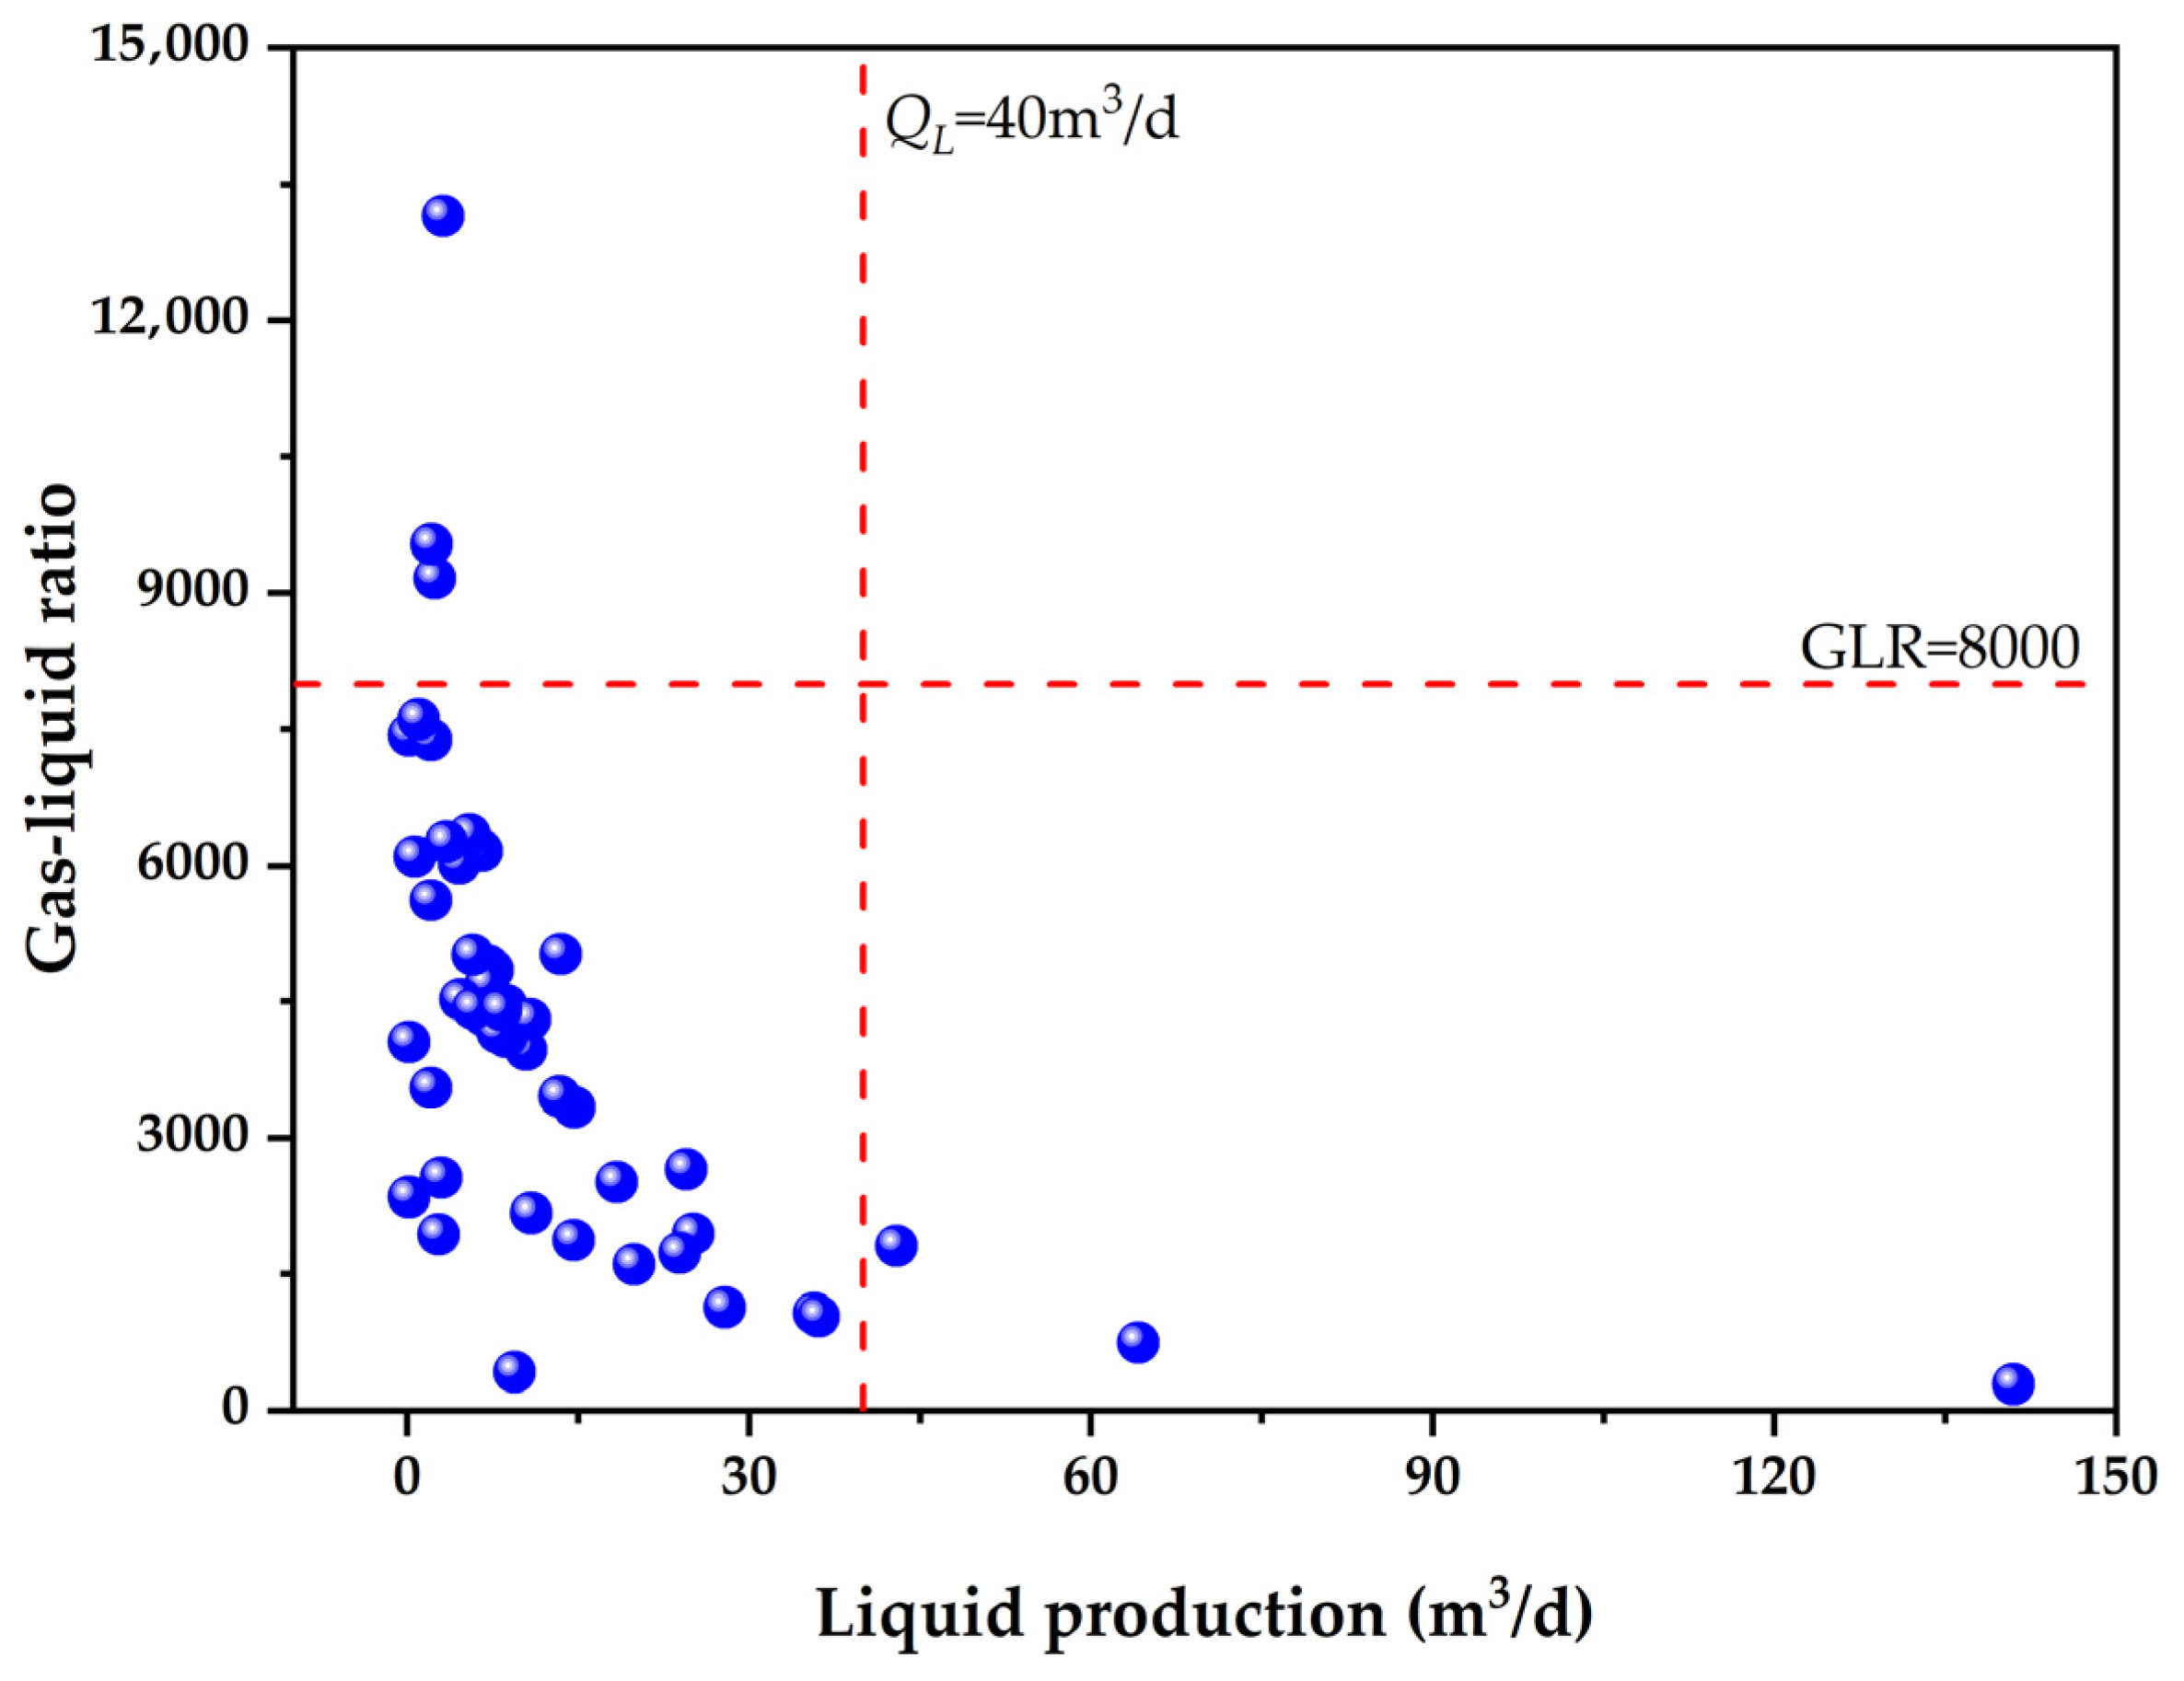
Figure 1. Cross plot of gas–liquid ratio versus liquid production for horizontal gas wells.
Processes 13 03278 g001
Figure 2. Production dynamic characteristics of the typical horizontal gas wells in the study area.
Processes 13 03278 g002
Figure 3. Cross plot of energy storage coefficient versus formation coefficient.
Processes 13 03278 g003
Figure 4. Dynamic classification of horizontal gas wells based on multi-dimensional performance indicators: (a) LPI, (b) LDC, and (c) LCE.
Processes 13 03278 g004
Figure 5. Low-dimensional index values representing static and dynamic performance: (a) SP, (b) LPI, (c) LDC, and (d) LCE.
Processes 13 03278 g005
Figure 6. Distribution of static and dynamic performance characteristics for 32 horizontal gas wells.
Processes 13 03278 g006
Figure 7. Classification schemes for horizontal gas wells based on the integration of dynamic and static parameters: (a) direct clustering method (scheme 1), (b) LDA-Kmeans fusion clustering method (scheme 2).
Processes 13 03278 g007
Figure 8. The variation trend of evaluation indicators in scheme 1 with respect to changes in the number of clusters: (a) WCSS, (b) silhouette score, and (c) Davies–Bouldin index.
Processes 13 03278 g008
Figure 9. The scatterplot matrix of input features for cluster visualization under scheme 1.
Processes 13 03278 g009
Figure 10. Comparison of cluster characteristics in scheme 1 based on radar chart.
Processes 13 03278 g010
Figure 11. The variation trend of evaluation indicators in scheme 2 with respect to changes in the number of clusters: (a) WCSS, (b) silhouette score, and (c) Davies–Bouldin index.
Processes 13 03278 g011
Figure 12. The scatterplot matrix of input features for cluster visualization under scheme 2.
Processes 13 03278 g012
Figure 13. Comparison of cluster characteristics in scheme 2 based on radar chart.
Processes 13 03278 g013
Figure 14. Cluster classifications of gas well samples and their corresponding proportions under the two clustering schemes: (a) cluster distribution based on the direct clustering method, (b) cluster distribution based on the fusion clustering method, (c) proportional distribution of clusters under the direct clustering method, and (d) proportional distribution of clusters under the fusion clustering method.
Processes 13 03278 g014
Table 2. Statistical analysis of the sample input features.
VariablesUnitRangeMeanVariance
Rm0.473~11.3452.4646.523
KhmD∙m0.293~37.4844.27553.603
Qwm3/d0.080~196.53311.079661.050
SdrwgDimensionless0.001~17.5591.0806.516
Qg104 m3/d1.341~21.2975.5717.847
PtMPa1.673~27.06712.46431.067
GpMPa/100 m0034~0.3160.1440.003
GfrDimensionless0.323~6.2301.1140.925
Table 3. Comparison of indicators for direct K-means clustering and hybrid Clustering.
MethodsOptimal Number of ClustersWCSSSilhouette ScoreDavies–Bouldin Index
Direct K-means3778.3760.5370.758
Hybrid clustering5163.3820.5590.576
Table 4. Summary of the sensitivity analysis results.
ModelsExcluded FeatureOptimal Number
of Clusters
WCSSSilhouette ScoreDavies–Bouldin
Index
Full modelNone5163.3820.5590.576
Variant model 1LPI4147.2830.4330.765
Variant model 2LDC4151.8430.4810.597
Variant model 3LCE3219.9910.5190.581
Disclaimer/Publisher’s Note: The statements, opinions and data contained in all publications are solely those of the individual author(s) and contributor(s) and not of MDPI and/or the editor(s). MDPI and/or the editor(s) disclaim responsibility for any injury to people or property resulting from any ideas, methods, instructions or products referred to in the content.