Abstract
The high proportion of renewable energy connected to the grid has resulted in insufficient consumption capacity in distribution networks, while the construction of new-type power distribution systems has imposed higher reliability requirements. With its flexible power synchronization control capabilities, grid-forming energy storage systems possess the ability to both promote the consumption of distributed energy resources in new-type distribution networks and enhance their reliability. However, current control methods are still hindered by drawbacks such as high computational complexity and a singular optimization objective. To address this, this paper proposes an optimized strategy for unified active–reactive power coordinated control in high-proportion renewable energy distribution networks with the participation of multiple grid-forming energy storage systems. Firstly, to optimize the parameters of grid-forming energy storage systems more accurately, this paper employs an improved iterative self-organizing data analysis technique algorithm to generate typical scenarios consistent with the scheduling time scale. Quantile regression (QR) and Gaussian mixture model (GMM) clustering are utilized to generate typical scenarios for renewable energy output. Subsequently, considering operational constraints and equipment state constraints, a unified active–reactive power coordinated control model for the distribution network is established. Meanwhile, to ensure the optimality of the results, this paper adopts an improved northern goshawk optimization (NGO) algorithm to solve the model. Finally, the effectiveness and feasibility of the proposed method are validated and illustrated through an improved IEEE-33 bus test system tested on MATLAB 2024B. Through analysis, the proposed method can reduce the average voltage fluctuation by 6.72% and increase the renewable energy accommodation rate by up to 8.64%.
1. Introduction
The large-scale integration of new energy sources, represented by wind power and photovoltaics, into the power grid [1] is driving the transformation of traditional power systems into new-type power systems [1]. However, the intermittency and uncertainty of wind and solar power output also pose risks to the safe operation of these new-type power systems [2]. With the rapid growth in the installed capacity of renewable energy and the proportion of new-type loads, the randomness and volatility of both power sources and loads have intensified. On the other hand, the rotational inertia and support capacity of the power system have decreased, resulting in weaker anti-disturbance capabilities, more complex fault characteristics, and interconnected fault patterns, posing challenges to the safe and stable operation of the system [3]. Therefore, there is an urgent need to advance grid-forming technologies capable of actively supporting grid voltage, frequency, and power angle stability to enhance the level of safe and stable system operation [4]. Grid-forming energy storage systems, owing to their advantages in power regulation and power quality assurance, have emerged as an effective means to address voltage stability issues in distribution networks and the challenge of renewable energy consumption [5].
Numerous scholars have conducted research on the reactive power and voltage control issues in distribution systems with a high proportion of renewable energy. For distribution networks with a high penetration of renewable energy, employing multiple devices such as inverters, on-load tap changers (OLTC), and shunt capacitor banks (SCB) for regulation has become a feasible approach to address voltage violations and fluctuations. Reference [6] combines distributed generation resources with traditional voltage regulation methods and employs a two-stage planning approach to optimize distribution network voltage. Reference [7] proposes a multi-layer optimization strategy to coordinate and optimize the output and operation of photovoltaic (PV) inverters and voltage regulation equipment. Reference [8] first optimizes equipment such as OLTC based on forecasted values and then adjusts the output of distributed PV inverters to achieve voltage stability. Reference [9] considers PV curtailment and utilizes a model predictive control algorithm to optimize the operation timing, tap positions of OLTC and SCB, as well as the output power of inverters. Reference [10] proposes a voltage optimization method for distribution networks that accounts for load characteristics, eliminating voltage fluctuations caused by forecast errors by optimizing the output of PV inverters. The aforementioned studies consider the regulatory capabilities of inverter equipment and coordinate various types of voltage regulation devices to improve grid operation. Considering the significant wear and tear on traditional voltage regulation equipment such as OLTC and SCB, which makes frequent adjustments impractical, Reference [11] proposes a reactive power optimization dispatch method based on regulation costs. This method utilizes regulation costs to decouple and solve the regulation issues of reactive power compensation equipment, achieving favorable optimization results. However, in systems that incorporate multiple types of active and reactive power devices, achieving satisfactory optimization results becomes challenging when considering overall system economics. Since inverter equipment can be frequently regulated through power electronics technology, how to fully exploit and utilize the regulatory characteristics of inverter equipment becomes a pressing issue to address [12].
A grid-forming energy storage system consists of a grid-forming converter, a step-up transformer, and power lines. Variations in system capacity directly affect the equivalent impedance of the grid-forming converter, step-up transformer, and power lines [13]. Therefore, grid-forming energy storage cannot be simply regarded as an ideal voltage source [14]. Further research is needed to investigate how changes in the equivalent impedance and capacity of the energy storage system impact system stability, as well as how to effectively coordinate and optimize the ratio between grid-forming energy storage and renewable energy sources for efficient management and control of grid-forming energy storage [15]. Reference [16] optimizes the capacity allocation of a combined photovoltaic and fuel cell system through detailed mathematical modeling and hourly numerical simulations. Reference [17] proposes a microgrid operation strategy based on a model predictive control framework that includes hydrogen energy storage and battery energy storage units, with the proposed control strategy enhancing battery lifespan and reducing maintenance costs. Reference [18] presents an analytical method for designing the power and capacity of grid-forming energy storage based on the small-signal model of a virtual synchronous generator (VSG), considering different inertia and damping parameters. However, this model does not account for the primary frequency regulation capability of energy storage. Reference [19] comprehensively considers the inertia and frequency regulation characteristics in energy storage configuration and provides a detailed analysis of the relationship between energy storage power, capacity, and VSG parameters. Nevertheless, the model only focuses on single-machine operation conditions and does not extend to multi-machine scenarios, while also noting differences in dynamic response and functional positioning between inertia support and primary frequency regulation. Reference [20] explores these differences but offers limited discussion on specific energy storage configuration schemes, such as maximum power, capacity requirements, and response times.
Grid-forming energy storage can effectively address the impacts of high-proportion renewable energy integration on system power flow and voltage regulation. Reference [21] indicates that energy storage systems can improve grid frequency and voltage fluctuations caused by uncertainties in renewable energy grid integration by adjusting power output. Reference [22] resolves reverse power flow and voltage boost issues in solar grid integration, as well as suppresses PV output fluctuations, by configuring corresponding energy storage devices for photovoltaic systems. Currently, due to the high cost of energy storage configuration, the siting and sizing of grid-forming energy storage are key research focuses when integrating into the system. Reference [23] aims to minimize network losses, introducing a network loss factor to determine the installation location and capacity of energy storage, but fails to consider the economic efficiency of system operation. Reference [24] analyzes the power output characteristics of renewable energy stations but only provides an analytical foundation for energy storage planning, lacking an analysis of technical characteristics. Reference [25] studies the optimal siting of battery energy storage systems (BESS) considering the impact of voltage sensitivity, but employs a single time scale in the research. Reference [26] aims to minimize both the operation and pollution emissions of the distribution network system, considering the siting and sizing optimization of energy storage and distributed generation sources. Reference [27] establishes an optimization model for energy storage siting and sizing based on node voltage, load, and energy storage capacity. However, none of these studies consider the charging and discharging processes of energy storage, leading to inaccurate optimization results. Reference [28] optimizes the location, capacity, and output of energy storage separately through a bi-level optimization model, but the inner and outer levels lack interaction and are mutually independent. Reference [29] considers network losses and voltage deviations to establish an optimization model for energy storage in distribution networks, but fails to optimize the obtained energy storage capacity. Most of the aforementioned studies fail to jointly optimize economic and technical indicators and do not account for the uncertainties of renewable energy, making them unsuitable for the application of grid-forming energy storage.
Although numerous scholars have currently conducted research on the scheduling involving grid-forming energy storage systems, several research challenges still persist, as shown in Table 1.

Table 1.
Gap analysis of current research reference.
To address these issues, this paper proposes an optimized strategy for unified active–reactive power coordinated control in high-proportion renewable energy distribution networks with the participation of multiple grid-forming energy storage systems. The main innovative points of this paper are summarized as follows:
(1) This paper employs an improved ISO-DATA, combined with QR and GMM clustering, to generate typical scenarios consistent with the scheduling time scale. This approach enables more accurate optimization of the parameters of grid-forming energy storage systems.
(2) This paper proposes a unified active–reactive power coordinated control optimization strategy for distribution networks with high proportions of renewable energy, considering the participation of multiple grid-forming energy storage systems. An improved NGO algorithm is adopted to solve the model, ensuring the optimality of the results.
The research framework of this paper is organized as follows: Section 2 introduces the method for generating typical scenarios for renewable energy and loads. Based on this, Section 3 presents the coordinated active–reactive power control strategy for grid-forming energy storage. Considering the non-convex and nonlinear characteristics of the model, an improved NGO algorithm is introduced in Section 4. Subsequently, Section 5 employs an improved IEEE-33 bus test system for case study validation. Finally, Section 6 summarizes the entire paper.
2. Scenario Generation Method for Source-Load Uncertainty
To formulate control strategies more accurately, this paper employs an improved Iterative Self-Organizing Data Analysis Technique Algorithm (ISO-DATA) to generate typical scenarios for net load, and utilizes Quantile Regression (QR) combined with Gaussian Mixture Model (GMM) clustering to generate typical scenarios for renewable energy output. The output of new energy sources and load power are influenced by weather conditions. The output power of wind turbines directly depends on meteorological factors such as wind speed, wind direction, and air density. For instance, excessively low wind speeds can cause turbines to shut down, while gusts or turbulence may induce power fluctuations. The efficiency of PV power generation is significantly affected by sunlight intensity, cloud cover, temperature, and duration of sunshine, with output dropping sharply or even reaching zero during overcast or rainy weather, as well as during day-night transitions. Meanwhile, the demand pattern for load power is closely tied to weather conditions—extreme temperatures drive up electricity consumption from air conditioning and heating systems, while rainfall, strong winds, and other weather phenomena may alter industrial production schedules or residential electricity usage behaviors, further exacerbating load volatility. Therefore, prior to generating typical scenarios, different scenario classifications can be constructed using historical data, as illustrated in Figure 1 below.
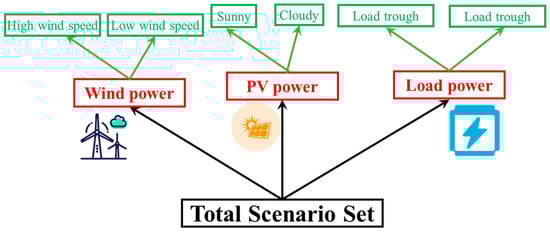
Figure 1.
Visualized classification and presentation of different scenarios.
2.1. Load Scenario Generation
Among unsupervised clustering algorithms, compared to K-means clustering, the ISODATA allows for dynamic changes in the number of clusters through merging and splitting operations. However, load curves contain high-dimensional features, such as temporal variation characteristics, which cannot be extracted using the conventional ISODATA algorithm that employs Euclidean distance as a distance metric. To address this, the original load data is mapped into an appropriate high-dimensional space where the load curves become easier to separate and structure. Kernel functions enable the direct computation of inner products in high-dimensional spaces without explicitly calculating the mapping function, as shown in Equation (1).
Here, K(⋅) represents the kernel function; ϕ(⋅) represents the high-dimensional mapping function; and x1 and x2 are net load samples.
Therefore, the distance d(x1, x2) between two samples in high-dimensional space can be simplified for calculation using the kernel function, as shown in Equation (2).
By utilizing the distances between samples in high-dimensional space, load curves are classified to enhance the similarity of net load curves within clusters and the dissimilarity between clusters. Since each cluster center is representative of its respective cluster, the samples closest to each cluster center are selected as typical load scenarios. To identify the optimal kernel function and validate the superiority of the proposed improved ISODATA, this paper employs the Davies-Bouldin Index (DBI) and Dunn Index (DI) as metrics for evaluating clustering performance. These two indices reflect clustering effectiveness from the perspectives of cluster centers and boundaries, respectively, as shown in Equation (3). Specifically, a smaller DBI indicates greater inter-cluster dissimilarity and intra-cluster similarity, implying better clustering performance; conversely, a larger DI also signifies better clustering performance.
Here, kc represents the total number of clusters; denotes the average distance from samples in cluster to its cluster center ui; is the minimum distance between samples in clusters and ; and is the maximum distance between samples within cluster .
2.2. Generation of New Energy Output Scenarios
The uncertainty in power systems with a high penetration rate of renewable energy mainly stems from renewable energy sources. To characterize the uncertainty of renewable energy, this section proposes a method for generating new energy output scenario sets based on QR and GMM. Firstly, it is assumed that there exists the following linear fitting relationship between the actual power and the forecasted power:
Here, represents the forecasted new energy output; denotes the fitted actual new energy power at the τ-quantile; and and are the parameters of the linear fitting equation at the τ-quantile.
The forecasted new energy output and the actual new energy output are represented using a quantile matrix T. The generated quantile-based daily variation curves are clustered into scenarios using GMM. GMM is characterized by its strong robustness, dividing the sample data into D categories, which correspond to the D multidimensional Gaussian distribution components of the Gaussian mixture model. The idea behind the GMM algorithm is to estimate the sample data as a linear superposition of probabilities belonging to D multidimensional Gaussian distributions, with each category of samples following a multidimensional Gaussian distribution. The definition of the GMM probability density function g(x) is shown in Equation (5).
Here, represents the weight coefficient of the s-th Gaussian distribution component; is the probability density function of a Gaussian distribution with mean and covariance ; and x is the sample corresponding to the new energy. The parameters , , and of the GMM are generally estimated using the Expectation-Maximization algorithm.
3. Optimized Strategy for Unified Active–Reactive Power Coordinated Control in Distribution Networks
3.1. Objective Function
This paper considers the control strategy from the perspective of active power dispatch, focusing on system network losses, and from the perspective of reactive power control, focusing on system voltage fluctuations. The two objective functions are respectively expressed as shown in Equations (6) and (7) below.
Here, T represents the total scheduling time horizon, which is set to 24 in this paper; and denote the sets of lines and nodes, respectively; and represent the penalty coefficients for network losses and voltage fluctuations, respectively; denotes the square of the current in line ij at time t; represents the resistance value of line ij; and and denote the voltage magnitude and per-unit value at node I at time t, respectively.
By introducing penalty coefficients, Objective Functions (1) and (2) are transformed into a minimization problem of economic costs with the same dimension. At this point, the overall operational objective of the distribution network can be expressed as:
3.2. Constraints
(1) Power flow constraints
For radial distribution networks, this paper employs the DistFlow branch power flow model to represent the power flow constraints, as shown in Equation (9).
Here, Pj,t and Qj,t are the active and reactive power injections at node j during time period t, respectively; Uj,t is the voltage magnitude at node j during time period t; rij and xij are the resistance and reactance between nodes i and j, respectively; u(j) represents the set of starting nodes of branches that have node j as the ending node; v(j) represents the set of ending nodes of branches that have node j as the starting node; and Pij,t and Qij,t are the active and reactive power injections from node i to node j during time period t, respectively.
(2) Constraints on traditional energy storage equipment
Here, and represent the maximum allowable charging and discharging power of the energy storage at node i, respectively; and are binary variables (0–1 variables) indicating the charging and discharging states of the energy storage at node i during time period t. Specifically, equals 1 when the energy storage is charging and 0 otherwise, while equals 1 when the energy storage is discharging and 0 otherwise; and represent the state of charge (SOC) of the energy storage at node i during time periods t and t − 1, respectively; and are the upper and lower limits of the SOC of the energy storage at node i, respectively; and and are the charging and discharging efficiencies of the energy storage, respectively.
(3) Constraints on renewable energy output
The types of renewable energy considered in this paper are wind power and photovoltaic power, which need to satisfy constraint (11). Grid integration of renewable energy must satisfy constraints for safe grid operation, including active/reactive power balance constraints, voltage fluctuation limits, and frequency stability requirements. Additionally, equipment status constraints—such as maximum output limits for wind turbines/PV inverters, charging/discharging power and capacity constraints for energy storage systems, and scheduling time-scale constraints—must also be considered to ensure dynamic adaptability between renewable energy generation and the power grid. For detailed constraint models, refer to [30].
(4) Tie-line Power Constraints
When there is a power imbalance in the system, the distribution network can purchase electricity from or sell electricity to the upper-level grid through tie-lines, which must satisfy constraint (12).
(5) Node Voltage/Line Current Constraints
(6) Constraints on Grid-Forming Energy Storage
Grid-forming energy storage systems can flexibly control the output of active and reactive power. During the operation of the distribution network, they provide reactive and active power support for loads and voltage stabilization, as shown in Equation (14):
The charging and discharging model of grid-forming energy storage is of the same type as the traditional energy storage model, which can be referred to in Expression (10). Here, E represents the root mean square value of the output voltage; δi,t is the power angle; and Xf denotes the filtering reactance.
Capacitor banks and OLTC serve as discrete decision variables, with strict limitations on the number of operations within a scheduling period. Therefore, this paper incorporates constraints on the number of actions of reactive power compensation equipment for optimal segmentation. The specific constraints are as follows:
(7) Constraints on Capacitor Bank Adjustment
Here, represents the upper limit on the number of operations for the capacitor banks over the entire optimization period; denotes the maximum number of switching groups for the reactive power compensation capacitor; is the number of switching groups of the reactive power compensation capacitor during time period t; represents the switching capacity of the reactive power compensation capacitor group during time period t; and is the switching capacity of a single group.
(8) Constraints on OLTC Adjustment
Here, represents the maximum number of adjustments for the OLTC tap changer over the entire optimization period; and are the lower and upper limits, respectively, of the maximum allowable adjustment range for the OLTC tap changer; indicates the position of the OLTC tap changer during time period t, which always takes an integer value; and is the voltage regulation step size of the OLTC.
4. Solution Method Based on an Improved Northern Goshawk Optimization Algorithm
Although the Disflow model reduces the solution complexity to a certain extent, the scheduling decision problem remains inherently a mixed-integer nonlinear programming problem. Therefore, this paper employs the Northern Goshawk Optimizer (NGO), which can effectively explore different regions of the solution space and is applicable to a variety of optimization problems, including both continuous and discrete optimization.
4.1. Basic Principle of NGO
In the NGO algorithm, the hunting process of the northern goshawk is divided into two phases: the exploration phase of prey identification and attack, and the exploitation phase of goshawk pursuit and prey escape.
(1) Phase 1: Exploration Phase.
In the first phase, the northern goshawk randomly selects a prey and launches a rapid attack. It conducts a global search within the search space, determining the optimization scope through random selection of targets, thereby enhancing the algorithm’s detection capability. The behaviors exhibited by the northern goshawk in this phase can be described as follows:
Here, represents the position of the prey of the n-th northern goshawk; represents the position of the k-th northern goshawk; represents the objective function value of the prey’s position of the n-th northern goshawk; k is a random integer within the range of [1, N]; represents the number of northern goshawks; represents the new position of the n-th northern goshawk; represents the position of the n-th northern goshawk in the j-th dimension; represents the new position in the j-th dimension of the prey of the n-th northern goshawk; represents the objective function value of the n-th northern goshawk after the update in the first phase; r is a random number within the range of [0, 1]; and is a random integer that is either 1 or 2.
(2) Phase 2: Exploitation Phase
After the northern goshawk launches an attack on its prey, the prey attempts to flee. Consequently, throughout a series of pursuit and evasion actions, the goshawk persistently chases after its prey. Due to the high-speed maneuverability of northern goshawks, they can nearly always capture their prey under any circumstances. By simulating this behavior, the local search capability of the algorithm is improved. Assuming that this hunting activity is centered around an attack position within a radius of R, it satisfies Equations (20)–(22):
Here, represents the new position of northern goshawk n in the j-th dimension; represents the position of northern goshawk n in the j-th dimension after the update in the second phase; represents the objective function value of northern goshawk n; w represents the current iteration number; and represents the maximum number of iterations.
4.2. Multi-Strategy Improvement Approach
Improvement 1: Refracted Opposition-Based Learning Strategy
The NGO algorithm employs random initialization, which fails to ensure population diversity and thus affects the quality of the global optimal solution. In this paper, we initialize the population using the Refracted Opposition-Based Learning strategy, which expands the range of the initialized population by solving for the opposite of the current solutions. Refracted opposition-based learning is expressed as follows:
Here, is the refracted opposite solution of ; and and are the maximum and minimum values of the j-th dimension in the search space respectively.
Improvement 2: Sine-Cosine Strategy
To prevent the algorithm from getting trapped in local optima, the Sine-Cosine Algorithm (SCA) is employed to replace the position update formula during the prey identification phase, as follows:
Here, represents the position of individual i at the t-th iteration; is the current best individual in the population at the t-th iteration; and is a random parameter.
The original step-size search factor in SCA shows a linearly decreasing trend, which is not conducive to balancing global and local search capabilities. Therefore, the step-size search factor of the sine-cosine strategy is improved as follows:
Here, represents the improved r1; η is an adjustment coefficient, with a value greater than or equal to 1.
5. Case Study Analysis
This paper employs a modified IEEE-33 node system for case verification, with the relevant topology shown in Figure 2 below. Specifically, two grid-forming energy storage devices are installed at nodes 10 and 24; a conventional energy storage device is installed at node 29. Distributed renewable energy sources, including wind power and photovoltaics, are installed at nodes 3 and 15 respectively, and a capacitor bank is installed at node 2.
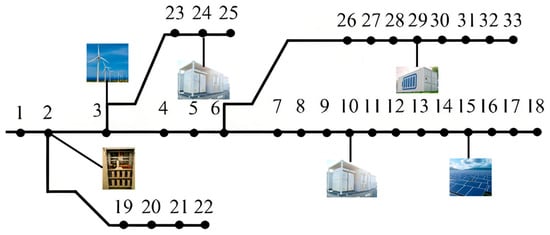
Figure 2.
Topology of the modified IEEE-33 node system.
5.1. Effectiveness Analysis of Scenario Generation
The load, wind power, and photovoltaic output scenarios generated using the proposed method are illustrated in Figure 3, Figure 4 and Figure 5 below.
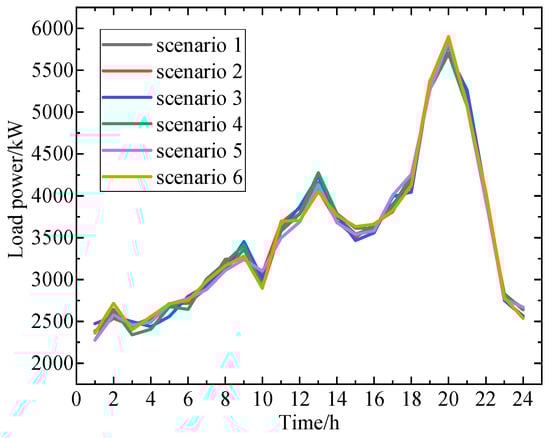
Figure 3.
The load power scenarios.
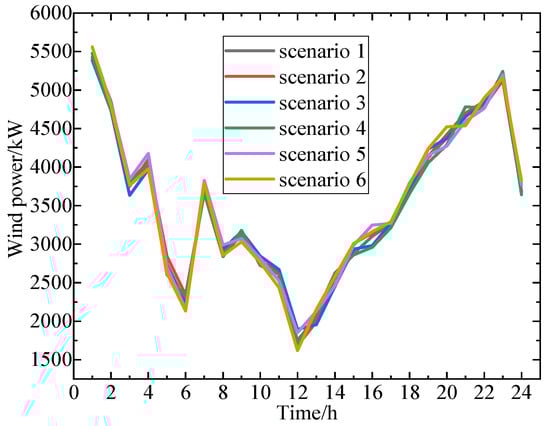
Figure 4.
Wind power output scenarios.
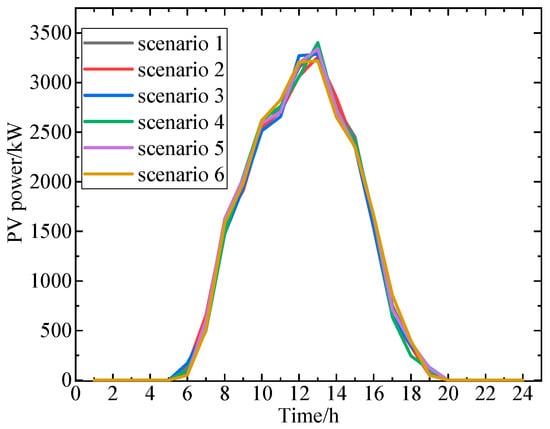
Figure 5.
Photovoltaic output scenarios.
By observing the above figures, it can be found that the load and wind-solar power output scenarios generated by the method in this paper exhibit small errors. This is because when using the improved iterative self-organizing data analysis technique algorithm to generate typical load output scenarios, the algorithm can perform targeted processing based on the dispatching time scale, better capturing the characteristics and variation patterns of the load at the corresponding time scale, resulting in generated scenarios that more closely align with reality. Meanwhile, when generating typical scenarios for renewable energy output using quantile regression and Gaussian mixture model clustering, quantile regression can account for information at different quantiles, and Gaussian mixture model clustering can effectively uncover the underlying data structure. The combination of these two methods enables a more precise depiction of the complex characteristics of renewable energy output, thereby reducing errors in the generated scenarios.
To more intuitively demonstrate the effectiveness of the method proposed in this paper, comparisons were made with other methods, including k-means and generative adversarial network (GAN) approaches, with relevant data results presented in Table 2 below. This paper selects k-means algorithm and GAN for comparison primarily because they are representative benchmark methods suitable for typical scenario generation tasks. As a classic unsupervised clustering method, k-means, while computationally efficient, relies on Euclidean distance and a fixed number of clusters, making it difficult to capture the temporal characteristics and dynamic variation patterns of high-dimensional load curves. GAN, through adversarial training between the generator and discriminator, can fit complex distributions; however, its training process is unstable and sensitive to data noise, often leading to significant deviations between generated scenarios and actual conditions. By comparing these two methods, the advantages of the proposed scenario generation method, which combines improved ISO-DATA with QR-GMM, in dynamic feature extraction, high-dimensional data adaptability, and generation accuracy can be highlighted. This validates its more precise modeling capability for renewable energy and load uncertainties.
Table 2.
Comparison of indicators for different scenario generation methods.
The DBI evaluates clustering performance by calculating the ratio of intra-cluster compactness to inter-cluster separation, where a lower value indicates higher clustering quality. The DBI value of typical scenarios generated by the proposed method is 0.35, significantly lower than those of k-means (0.62) and GAN (0.58), demonstrating that the load and renewable energy scenarios produced by this method exhibit tighter intra-cluster cohesion and more distinct inter-cluster differences, effectively avoiding data misclassification. This is attributed to the improved ISO-DATA algorithm, which maps high-dimensional features via kernel functions and integrates QR-GMM to quantify output characteristics across different quantiles, enabling the generated typical scenarios to more closely align with actual operational patterns. This validates the method’s superiority in scenario generation accuracy. The DI is also an important metric for evaluating clustering effectiveness, with a higher value indicating better clustering quality. The DI value of our method reaches 0.82, significantly higher than those of the other three methods. The DI value for the k-means method is 0.55, for the GAN method it is 0.60. This indicates that our method, during the clustering process, can better group similar data together while maintaining a larger distance between different clusters, enhancing the clarity and interpretability of the clusters and making the generated typical scenarios more consistent with the distribution characteristics of actual data. Error metrics directly reflect the degree of deviation between the generated scenarios and actual data. The error of our method is 0.08, the smallest among the four methods. The error for the k-means method is 0.15, for the GAN method it is 0.13. This fully proves that the typical scenarios of load and wind-solar power output generated by our method are closer to actual data, enabling more accurate simulation of real-world operating conditions and providing a reliable basis for subsequent scheduling decisions.
5.2. Analysis of System Operation Performance
During periods of significant fluctuations in renewable energy output or heavy load conditions, the OLTC and capacitor banks coordinate with each other to maintain node voltages within a safe range. Their operational status is illustrated in Figure 6 below.
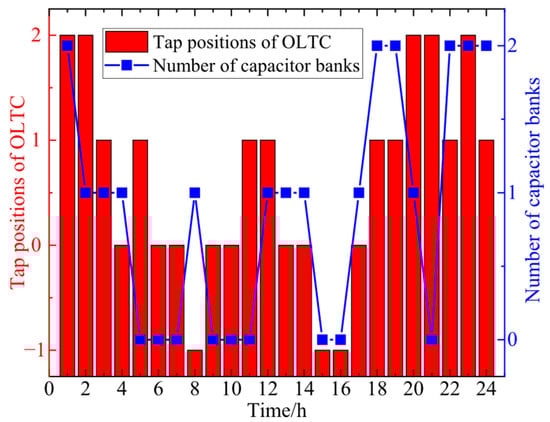
Figure 6.
Operational status of OLTC and capacitor banks.
During periods of significant fluctuations in renewable energy output, such as when photovoltaic power generation experiences a sudden decrease or increase due to cloud cover or when wind power generation undergoes abrupt changes due to wind speed variations, the original power balance of the power grid is disrupted, causing node voltages to deviate from their normal range. Similarly, during periods of heavy load, when a large number of electrical devices operate concurrently, the line current increases, leading to a rise in line voltage drop and a subsequent decrease in node voltage. At such times, the OLTC adjusts the transformer’s turns ratio by changing the tap positions, thereby altering the secondary-side voltage to raise or lower the node voltage. Meanwhile, the capacitor banks modify the reactive power distribution in the power grid by switching capacitors in or out, compensating for reactive power losses in the lines and improving voltage levels. Through their coordinated operation, the OLTC addresses the fundamental aspect of adjusting voltage magnitude, while the capacitor banks focus on compensating reactive power and improving the power factor. Together, they maintain node voltages within a safe range, ensuring the stable operation of the power grid.
Figure 7 further illustrates the charging and discharging status of the energy storage devices.
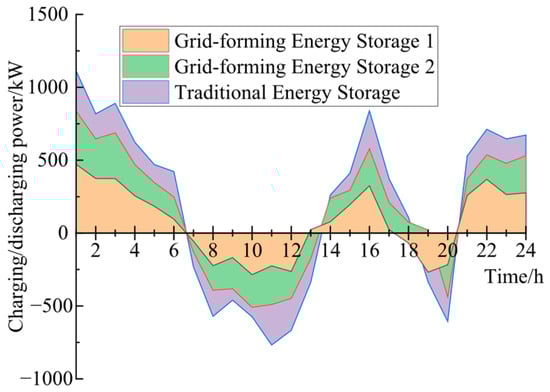
Figure 7.
Charging and discharging status of the energy storage devices.
Observing Figure 7 above, it can be seen that when renewable energy output is high, a large amount of clean energy surges into the distribution network. If not promptly absorbed, this can easily lead to voltage increases or even exceedances. At this time, the energy storage device charges to absorb the surplus electrical energy, preventing excessive voltage rises caused by power surplus in the grid and stabilizing the voltage level. During peak load periods, when electricity demand surges, the line voltage drop becomes significant, causing the voltage to decrease accordingly. The energy storage device discharges to supplement electrical energy to the grid, providing reactive or active power support to enhance voltage quality and prevent excessively low voltages. Through this flexible adjustment of charging during periods of high renewable energy output and discharging during peak load periods, the energy storage device effectively balances the power in the grid and maintains the voltage of the distribution network within a reasonable and stable range.
To further demonstrate the effectiveness of voltage control, the voltage curves of some key nodes are shown in Figure 8 below. In this paper, wind power and PV access nodes are selected as key nodes. In the voltage regulation of distribution networks, wind power/PV access nodes are regarded as crucial primarily because the output of these renewable energy sources exhibits intermittency and uncertainty. Their power fluctuations directly impact the voltage levels at the access nodes, leading to voltage fluctuations or violations of limits. Meanwhile, the integration of wind power/PV alters the power distribution and flow direction within the distribution network, thereby limiting the effectiveness of traditional voltage regulation devices, including OLTC and capacitor banks. Therefore, it is essential to focus on the voltage stability of these nodes and achieve effective voltage regulation through coordinated control of energy storage systems, reactive power compensation devices, and other means.
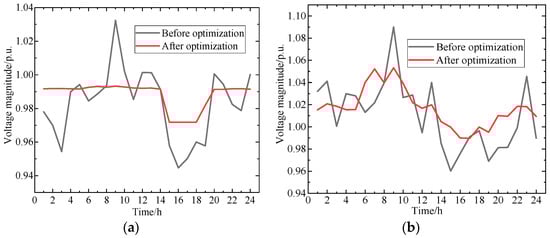
Figure 8.
Voltage magnitude of some key nodes. (a) node 3, (b) node 15.
Observing Figure 8 above, it is evident that the involvement of grid-forming energy storage in dispatch significantly reduces voltage fluctuations. It can actively establish voltage and frequency, simulate the characteristics of synchronous generators, flexibly adjust its own output power according to system demands, rapidly respond to fluctuations in renewable energy output and load changes, and precisely compensate for reactive power to stabilize voltage amplitude. Compared with traditional energy storage systems, the advantages of grid-forming energy storage are markedly prominent. Traditional energy storage systems are mostly grid-following types, relying on grid voltage and frequency support, with passive responses and limited regulation capabilities. In contrast, grid-forming energy storage possesses autonomous support capabilities, enabling stable operation even in weak grid or off-grid scenarios. It can also provide inertia support to the system, enhancing the grid’s anti-interference ability and improving voltage stability and power quality.
6. Conclusions
Distribution networks face challenges of insufficient consumption capacity and increasingly stringent reliability requirements. Grid-forming energy storage systems, with their flexible power synchronization control capabilities, offer great potential to tackle these issues by promoting distributed energy resource consumption and enhancing network reliability. Nevertheless, existing control methods are limited by high computational complexity and a single optimization objective. To overcome these limitations, this paper has presented an optimized strategy for unified active–reactive power coordinated control in high-proportion renewable energy distribution networks with multiple grid-forming energy storage systems. By utilizing an improved iterative self-organizing data analysis technique algorithm, combined with quantile regression and Gaussian mixture model clustering, we are able to generate typical scenarios for renewable energy output that align with the scheduling time scale, enabling the more accurate parameter optimization of grid-forming energy storage systems.
The establishment of a unified active–reactive power coordinated control model, taking into account operational and equipment state constraints, provides a comprehensive framework for power control in distribution networks. The adoption of an improved northern goshawk optimization algorithm ensures the optimality of the solution results. Through tests on an improved IEEE-33 bus test system, the proposed method demonstrated its effectiveness and feasibility. Based on the conducted analysis, the method introduced in this study is capable of decreasing the mean voltage variation by 6.72% and enhancing the renewable energy integration capacity by as much as 8.64%. It not only improves the consumption of renewable energy but also enhances the reliability of the distribution network. This research provides valuable insights and practical solutions for the efficient and reliable operation of high-proportion renewable energy distribution networks, and it can serve as a reference for future related studies and engineering applications.
Author Contributions
Conceptualization, Y.K., Z.L., L.Y., X.C., B.F., Y.H. and H.Z.; methodology, Y.K., Z.L., L.Y., X.C., B.F., Y.H. and H.Z.; validation, Y.K., Z.L., L.Y., X.C., B.F., Y.H. and H.Z.; writing—original draft preparation, Y.K., Z.L., L.Y., X.C., B.F., Y.H. and H.Z. All authors have read and agreed to the published version of the manuscript.
Funding
This work was supported by the Science and technology projects of State Grid Hubei Corporation, Project No. 52153224002D.
Data Availability Statement
The original contributions presented in this study are included in the article. Further inquiries can be directed to the corresponding author.
Conflicts of Interest
The authors declare no conflict of interest.
Abbreviations
The following abbreviations are used in this manuscript:
| Abbreviation | Meaning |
| GMM | Gaussian mixture model |
| QR | Quantile regression |
| NGO | Northern goshawk optimization |
| OLTC | On-load tap changers |
| SCB | Shunt capacitor banks |
| VSG | Virtual synchronous generator |
| ISO-DATA | Iterative Self-Organizing Data Analysis Technique Algorithm |
| DBI | Davies-Bouldin Index |
| DI | Dunn Index |
| SOC | State of charge |
| GAN | Generative adversarial network |
| Variables and Parameters | Meaning and units |
| K(⋅) | The kernel function |
| ϕ(⋅) | The high-dimensional mapping function |
| x1 and x2 | Net load samples |
| kc | The total number of clusters |
| The average distance from samples in cluster to its cluster center ui | |
| The minimum distance between samples in clusters and | |
| The maximum distance between samples within cluster | |
| The forecasted new energy output | |
| The fitted actual new energy power at the τ-quantile | |
| and | The parameters of the linear fitting equation at the τ-quantile |
| The weight coefficient of the s-th Gaussian distribution component | |
| The probability density function of a Gaussian distribution with mean and covariance | |
| T | The total scheduling time horizon/h |
| and | The sets of lines and nodes |
| and | The penalty coefficients for network losses and voltage fluctuations/$ |
| The square of the current in line ij at time t/A2 | |
| and | The voltage magnitude and per-unit value at node I at time t/p.u. |
| The resistance value of line ij/Ω | |
| Pj,t and Qj,t are, respectively; | The active and reactive power injections at node j during time period t/kW and kVar |
| Uj,t | The voltage magnitude at node j during time period t/p.u. |
| rij and xij | The resistance and reactance between nodes i and j |
| u(j) and v(j) | The set of starting/ending nodes of branches that have node j as the ending/starting node |
| Pij,t and Qij,t | The active and reactive power injections from node i to node j during time period t/kW and kVar |
| and | The maximum allowable charging and discharging power of the energy storage at node i |
| and | The binary variables indicating the charging and discharging states of the energy storage at node i during time period t |
| and | The SOC of the energy storage at node i during time periods t and t−1 |
| and | The upper and lower limits of the SOC of the energy storage at node i |
| and | The charging and discharging efficiencies of the energy storage |
| E | The root mean square value of the output voltage |
| δi,t | The power angle |
| Xf | The filtering reactance |
References
- Yang, L.; Cao, X.; Zhou, Y.; Lin, Z.; Zhou, J.; Guan, X.; Wu, Q. Frequency-Constrained Coordinated Scheduling for Asynchronous AC Systems Under Uncertainty via Distributional Robustness. IEEE Trans. Netw. Sci. Eng. 2025, 1–18. [Google Scholar] [CrossRef]
- Cui, Y.; Xu, Y.; Wang, Y.; Li, Y.; Zhao, Y. Multi-Microgrid Optimization Operation Strategy Considering Nonlinear Conditions and Renewable Energy Uncertainty: A Data-Driven Method. IEEE Trans. Ind. Appl. 2025, 61, 1533–1545. [Google Scholar] [CrossRef]
- Xia, Y.; Li, Z.; Xi, Y.; Wu, G.; Peng, W.; Mu, L. Accurate Fault Location Method for Multiple Faults in Transmission Networks Using Travelling Waves. IEEE Trans. Ind. Inform. 2024, 20, 8717–8728. [Google Scholar] [CrossRef]
- Hao, G.; Li, Y.; Li, Y.; Guang, K.; Zeng, Z. Safe Reinforcement Learning for Active Distribution Networks Reconfiguration Considering Uncertainty. IEEE Trans. Ind. Appl. 2025, 61, 1757–1769. [Google Scholar] [CrossRef]
- Wu, X.; Liu, L.; Wu, Y.; Luo, C.; Tang, Z.; Kerekes, T. Near-Optimal Energy Management Strategy for a Grid-Forming PV and Hybrid Energy Storage System. IEEE Trans. Smart Grid 2025, 16, 1422–1433. [Google Scholar] [CrossRef]
- Guo, L.; Yang, G.; Liu, Y.; Zhang, Y.; Wang, Z.; Yu, H.; Wang, Y.; Wang, C. Topology and Parameter Identification of Three-Phase Low-Voltage Distribution Network and Voltage Control Strategy Based on User Smart Meter Measurements: A Data-Driven Approach. IEEE Trans. Instrum. Meas. 2025, 74, 9006413. [Google Scholar] [CrossRef]
- Zhang, B.; Kong, K.; Zhang, L.; Zhang, Q.; Cai, Y.; Zhao, C. Coordinated Power Control Strategy of PV Inverters and VSCs in DC-Interconnected Low-Voltage Distribution Networks. IEEE Trans. Ind. Appl. 2025, 61, 8001–8014. [Google Scholar] [CrossRef]
- Yu, P.; Wan, C.; Qin, H.; Lao, K.-W.; Song, Y.; Ju, P. Centralized-Distributed Coordinated Voltage Control of Active Distribution Networks with Renewables. IEEE Trans. Sustain. Energy 2025, 16, 1504–1517. [Google Scholar] [CrossRef]
- Zhang, J.; Ji, Y.; Zhou, J.; Jia, Y.; Shi, G.; Wang, H. Cooperative AC/DC Voltage Margin Control for Mitigating Voltage Violation of Rural Distribution Networks with Interconnected DC Link. IEEE Trans. Power Deliv. 2025, 40, 1014–1029. [Google Scholar] [CrossRef]
- Prasad, M.; Rather, Z.H.; Razzaghi, R.; Doolla, S. A New Approach to Determine Feasible Operating Region of Unbalanced Distribution Networks with Distributed Photovoltaics. IEEE Trans. Power Deliv. 2025, 40, 1493–1504. [Google Scholar] [CrossRef]
- Zhang, B.; He, C. Decentralized Voltage and Var Control of Active Distribution Network Based on Parameter-Sharing Deep Reinforcement Learning. IEEE Access 2025, 13, 115090–115101. [Google Scholar] [CrossRef]
- Zhu, Y.; Liao, K.; Yang, J.; He, Z. Coordinated Voltage Fluctuation Suppression Strategy for MPET in Hybrid AC/DC Distribution Network Based on Dynamic Control Mode Switch. IEEE Trans. Sustain. Energy 2025, 16, 735–751. [Google Scholar] [CrossRef]
- Wu, X.; Wu, S.; Wang, F.; Wei, C.; Li, R.; Jiang, X.; Cai, X. Grid-Forming Control and Experimental Validation for High Voltage Transformerless Battery Energy Storage System. IEEE Trans. Power Electron. 2025, 40, 4889–4901. [Google Scholar] [CrossRef]
- Ullah, I.; Hashfi, T.B.; Döhler, J.S.; de Albuquerque, V.M.; Aitkulova, A.; Forslund, J.; Boström, C.; Wahyudie, A.; Temiz, I. Isolated Grid-Forming Control of Wave Energy Converter for Island Electrification. IEEE Access 2025, 13, 50860–50875. [Google Scholar] [CrossRef]
- Zhang, X.; Huang, Y.; Fu, Y. Oscillation Energy Transfer and Integrated Stability Control of Grid-Forming Wind Turbines. IEEE Trans. Sustain. Energy 2025, 16, 826–839. [Google Scholar] [CrossRef]
- Liu, Y.; Chen, Y.; Xin, H.; Tu, J.; Zhang, L.; Song, M.; Zhu, J. System Strength Constrained Grid-Forming Energy Storage Planning in Renewable Power Systems. IEEE Trans. Sustain. Energy 2025, 16, 981–994. [Google Scholar] [CrossRef]
- Baeckeland, N.; Pal, D.; Seo, G.-S.; Johnson, B.; Dhople, S. Large-Signal Stability Analysis of Grid-Forming Inverters with Equivalent-Circuit Models. IEEE Trans. Energy Convers. 2025, 40, 2453–2465. [Google Scholar] [CrossRef]
- Zheng, Z.; Li, S.; Huang, C.; Chen, Y.; Ma, J.; Zhang, M.; Xiao, X.; Ren, J.; Fu, Q. Hierarchical Proactive Control Based Grid-Forming Energy Router for Industrial Microgrid. IEEE Trans. Energy Convers. 2025, 40, 2642–2654. [Google Scholar] [CrossRef]
- Zhang, W.; Wang, Z.; Peng, Y.; Wu, J.; Li, Q.; Yi, H.; Yang, Z.; Li, L.; Zhuo, F. Frequency Deadband Control of Grid-forming Energy Storage Inverter in Primary Frequency Regulation. J. Mod. Power Syst. Clean Energy 2025, 13, 167–178. [Google Scholar] [CrossRef]
- Dubey, A.K.; Kumar, A.; Mishra, J.P.; NC, R. Grid Forming Power Converter Equipped with SAPF and Active Islanding Detection Capabilities Employing SOSF-SOFLL Based Synchronization. IEEE Trans. Ind. Appl. 2025, 61, 4626–4635. [Google Scholar] [CrossRef]
- Maharjan, S.; Bai, C.; Wang, H.; Yao, Y.; Ding, F.; Wang, Z. Distribution System Blackstart and Restoration Using DERs and Dynamically Formed Microgrids. IEEE Trans. Smart Grid 2025, 16, 2100–2114. [Google Scholar] [CrossRef]
- Chen, Q.; Tang, Y.; Gong, D.; Lin, L.; Zeng, Q.; Shi, X. Analysis and Enhancement of Synchronization Stability in Grid-forming PV Systems Using Torque Component Quantification. IEEE Trans. Energy Convers. 2025, 40, 2227–2241. [Google Scholar] [CrossRef]
- Deng, Z.; Cao, S.; Ma, K.; Wang, H.; Zhou, D.; Cai, X. Active Thermal Control for Enhancing Fault Current Output Capability of Grid-Forming Converters. IEEE Trans. Power Electron. 2025, 40, 13448–13458. [Google Scholar] [CrossRef]
- Joshal, K.S.; Gupta, N. A Novel Grid-Forming Inverter Control Strategy for Resilient Operations in an Islanded Microgrid with Bidirectional Electric Vehicle Integration. IEEE Trans. Ind. Appl. 2025, 61, 5350–5361. [Google Scholar] [CrossRef]
- Cheng, Y.; Wu, W. Adaptive Data-Driven Frequency Control with Minimal Cost for Renewables Dominated Microgrids. IEEE Trans. Smart Grid 2025, 16, 3563–3574. [Google Scholar] [CrossRef]
- Huang, H.; Lin, Y. Switching Dynamic State Estimation and Event Detection for Inverter-Based Resources with Multiple Control Modes. IEEE Trans. Power Syst. 2025, 40, 3439–3451. [Google Scholar] [CrossRef]
- Sajwan, S.; Panigrahi, B.K.; Srivastava, A.K. Multi-Stage Operational Resilience Metric-Driven Optimal Service Restoration in DER-Rich Power Distribution Systems. IEEE Access 2025, 13, 95275–95287. [Google Scholar] [CrossRef]
- Mahmoudian, A.; Taghizadeh, F.; Garmabdari, R.; Bai, F.; Mousavizade, S.; Lu, J. Optimal Coordinated Scheduling of Grid-Connected Hybrid AC/DC Microgrid for Minimizing Battery Degradation Costs and Interlink Converter Stress Levels. IEEE Trans. Power Deliv. 2025, 40, 1948–1959. [Google Scholar] [CrossRef]
- Wu, Z.; Zhang, M.; Fan, B.; Shi, Y.; Guan, X. Deep Synchronization Control of Grid-Forming Converters: A Reinforcement Learning Approach. IEEE/CAA J. Autom. Sin. 2025, 12, 273–275. [Google Scholar] [CrossRef]
- Davoodi, M.; Kaleybar, H.J.; Brenna, M.; Zaninelli, D. Sustainable Electric Railway System Integrated with Distributed Energy Resources: Optimal Operation and Smart Energy Management System. Int. Trans. Electr. Energy Syst. 2025, 2025. [Google Scholar] [CrossRef]


Disclaimer/Publisher’s Note: The statements, opinions and data contained in all publications are solely those of the individual author(s) and contributor(s) and not of MDPI and/or the editor(s). MDPI and/or the editor(s) disclaim responsibility for any injury to people or property resulting from any ideas, methods, instructions or products referred to in the content. |
© 2025 by the authors. Licensee MDPI, Basel, Switzerland. This article is an open access article distributed under the terms and conditions of the Creative Commons Attribution (CC BY) license (https://creativecommons.org/licenses/by/4.0/).