Article

Study on Lower Limb Motion Intention Recognition Based on PO-SVMD-ResNet-GRU

1
Key Laboratory of Intelligent Rehabilitation and Accessibility for People with Disabilities, Ministry of Education of China, Changchun University, Changchun 130022, China
2
Shandong Jite Industrial Technology Co., Ltd., Rizhao 262399, China
*
Author to whom correspondence should be addressed.
Processes 2025, 13(10), 3252; https://doi.org/10.3390/pr13103252
Submission received: 15 September 2025 / Revised: 10 October 2025 / Accepted: 11 October 2025 / Published: 13 October 2025

Abstract

This study aims to enhance the accuracy of human lower limb motion intention recognition based on surface electromyography (sEMG) signals and proposes a signal denoising method based on Sequential Variational Mode Decomposition (SVMD) optimized by the Parrot Optimization (PO) algorithm and a joint motion angle prediction model combining Residual Network (ResNet) with Gated Recurrent Unit (GRU) for the two aspects of signal processing and predictive modeling, respectively. First, for the two motion conditions of level walking and stair climbing, sEMG signals from the rectus femoris, vastus lateralis, semitendinosus, and biceps femoris, as well as the motion angles of the hip and knee joints, were simultaneously collected from five healthy subjects, yielding a total of 400 gait cycle data points. The sEMG signals were denoised using the method combining PO-SVMD with wavelet thresholding. Compared with denoising methods such as Empirical Mode Decomposition, Partial Ensemble Empirical Mode Decomposition, Independent Component Analysis, and wavelet thresholding alone, the signal-to-noise ratio (SNR) of the proposed method was increased to a maximum of 23.42 dB. Then, the gait cycle information was divided into training and testing sets at a 4:1 ratio, and five models—ResNet-GRU, Transformer-LSTM, CNN-GRU, ResNet, and GRU—were trained and tested individually using the processed sEMG signals as input and the hip and knee joint movement angles as output. Finally, the root mean square error (RMSE), mean absolute error (MAE), and coefficient of determination (R2) were used as evaluation metrics for the test results. The results show that for both motion conditions, the evaluation metrics of the ResNet-GRU model in the test results are superior to those of the other four models. The optimal evaluation metrics for level walking are 2.512 ± 0.415°, 1.863 ± 0.265°, and 0.979 ± 0.007, respectively, while the optimal evaluation metrics for stair climbing are 2.475 ± 0.442°, 2.012 ± 0.336°, and 0.98 ± 0.009, respectively. The method proposed in this study achieves improvements in both signal processing and predictive modeling, providing a new method for research on lower limb motion intention recognition.

1. Introduction

With the rapid development of artificial intelligence and robotics, lower limb motion intention recognition has become increasingly important in fields such as rehabilitation medicine and motion assistance. Accurately recognizing lower limb motion intentions can not only help patients with lower limb motor dysfunction restore motion ability but also provide personalized motion assistance support for healthy individuals [1,2,3].
Surface electromyography (sEMG) signals are physiological electrical signals generated by muscle activities, featuring characteristics such as non-invasive acquisition and preceding the occurrence of movements [4,5]. Therefore, using sEMG signals to recognize human motion intentions can improve rehabilitation efficacy in the field of rehabilitation medicine and enhance user comfort in the field of motion assistance.
In recent years, scholars at home and abroad have proposed a variety of denoising methods to address the non-stationary nature and noise sensitivity of sEMG signals, aiming to improve the accuracy of human motion intention recognition. Common methods include wavelet thresholding (WT) [6], Ensemble Empirical Mode Decomposition (EEMD) [7], and Variational Mode Decomposition (VMD) [8]. These methods have improved signal quality to varying degrees, but they also have certain limitations. For instance, WT is sensitive to threshold selection, which easily leads to signal distortion; EEMD suffers from mode mixing; and VMD is sensitive to parameter selection. To tackle these issues, some studies have attempted to combine different methods—such as the fusion of VMD with Empirical Wavelet Transform (EWT) [9] or the joint application of CEEMDAN with WT [10]—to enhance the signal denoising effect. However, such methods still suffer from the problem of strong parameter dependence.
In response to the aforementioned shortcomings, swarm-inspired optimization techniques have been widely applied in signal processing [11,12]. By simulating group behaviors in nature for global optimization, these techniques possess advantages such as simple implementation and strong global search capability, which can effectively avoid the problems of traditional parameter adjustment—such as reliance on experience or trapping in local optima. This paper proposes a denoising method based on Sequential Variational Mode Decomposition (SVMD) optimized by the Parrot Optimization (PO) algorithm. Specifically, the PO algorithm is used to realize adaptive optimization of the key parameters of SVMD, eliminating the uncertainty caused by manual parameter setting. Under the condition of optimal parameters, the PO-optimized SVMD can separate components in different frequency bands more accurately, thus effectively alleviating the problem of mode mixing. Meanwhile, this denoising method is combined with wavelet thresholding (WT) to further suppress noise and improve the accuracy of noise separation.
Based on the processed sEMG signals, scholars have further researched motion intention recognition models. Yang et al. [13] combined a convolutional neural network with a Support Vector Machine, using five extracted features of sEMG signals as input to the CNN-SVM model to recognize 15 types of hand gestures, achieving a maximum classification accuracy of 97.7%. Li et al. [14] combined a convolutional neural network (CNN) with a recurrent neural network (RNN), taking preprocessed surface electromyography signals as input to the CNN-RNN model to recognize 20 types of hand gestures, with an average recognition accuracy of 98.96%. Zhu et al. [15] combined a convolutional neural network (CNN) with a long short-term memory network (LSTM), using surface electromyography signals processed by kernel principal component analysis (KPCA) as input to the CNN-LSTM model to predict knee joint movement angles, with a prediction error of 1.34 ± 0.25°. Although the aforementioned studies can recognize motion intentions based on sEMG signals, they still have limitations in feature extraction or temporal capture. For example, CNN may suffer from gradient vanishing during local feature extraction, thereby affecting model performance. SVM has limited capability in processing temporal data and struggles to capture the dynamic change patterns of signals during movement. RNN is prone to gradient vanishing or explosion when backpropagating to capture temporal patterns.
In response to the aforementioned shortcomings, this paper proposes a motion intention recognition model combining Residual Network (ResNet) and Gated Recurrent Unit (GRU). The residual connections in ResNet address the gradient vanishing issue of traditional convolutional neural networks (CNNs), enabling efficient extraction of local features from sEMG signals. Furthermore, the gating mechanism of GRU is integrated to capture temporal dependencies, avoiding gradient problems during backpropagation.
In summary, to improve the accuracy of lower limb motion intention recognition, this study first simultaneously collects the sEMG signals of lower limb muscles and joint movement angles. The PO-SVMD method combined with WT is used to denoise the sEMG signals, and the absolute peak envelope of the signals is extracted. Second, the joint movement angles are resampled, integrated with the processed sEMG signals, and then divided into training and testing sets. Third, the sEMG signals from the training set are used as input data, and the joint movement angles are used as output data to train the ResNet-GRU model. Finally, the sEMG signals from the testing set are used as input to test the trained model to predict the movement angles of the lower limb hip and knee joints. These predicted angles are then compared with the actual joint movement angles, as shown in Figure 1.
The main innovations and achievements of this study are reflected in the following two aspects:
(1)
An sEMG signal denoising method is proposed, which optimizes Sequential Variational Mode Decomposition (SVMD) based on the Parrot Optimization (PO) algorithm and integrates it with wavelet thresholding. This method improves the signal-to-noise ratio (SNR) through adaptive parameter optimization;
(2)
A prediction model for lower limb joint movement angles is constructed, which combines Residual Network (ResNet) and Gated Recurrent Unit (GRU). Compared with a variety of commonly used models, this model achieves higher prediction accuracy.

2. sEMG Signal Denoising Method Based on PO-SVMD

sEMG signals are weak and unstable bioelectrical signals. Generally, each collected sEMG signal is mixed with various types of noise [16]. To improve the signal-to-noise ratio (SNR) of sEMG signals and ensure the accuracy of subsequent joint motion angle prediction, it is necessary to perform denoising processing on the collected sEMG signals. This study proposes an improved Sequential Variational Mode Decomposition denoising method, which determines the parameters of Sequential Variational Mode Decomposition (SVMD) through the Parrot Optimization (PO) algorithm and combines with wavelet threshold. This method can denoise noisy sEMG signals, thereby obtaining more effective sEMG signals.

2.1. Sequential Variational Mode Decomposition

Sequential Variational Mode Decomposition (SVMD) realizes modal decomposition by adding constraint conditions on the basis of VMD [17]. Compared with VMD, this algorithm does not need to determine the number of decomposition layers K, supports the successive extraction of the optimal solution of the current Intrinsic Mode Function (IMF), and can reduce the aliasing phenomenon between IMF components. The construction process of the mathematical model of SVMD is as follows:
Assume that the sEMG signal I(t) of a certain channel is decomposed into the L-th IMF component uL(t) and the residual signal Ir(t), as shown in the following formula:
I t = u L t + I r t I r t = i = 1 L 1 u i t + I u t
where the residual signal Ir(t) consists of two parts: the previously obtained IMF components and the unprocessed part Iu(t) of the original sEMG signal I(t).
When the (L − 1)-th IMF components are known, the extraction of the L-th IMF component can be converted into a constrained minimization problem. Meanwhile, the Lagrange multiplier λ and quadratic penalty term are introduced to construct the augmented Lagrangian function, as shown in the following formula:
L u L , w L , λ = α J 1 + J 2 + J 3 + I t u L t + I u t + i = 1 L 1 u i t 2 2 + λ t , I t u L t + I u t + i = 1 L 1 u i t
where α is the balance parameter; wL is the central frequency of the L-th IMF component; and J1, J2, and J3 are the three criteria followed by the SVMD algorithm, which can be expressed by the following formulas.
J 1 = δ t δ t + j π t u L t e j w L t 2 2 J 2 = β L t I r t 2 2 J 3 = i = 1 L 1 β i t u L t 2 2
where δt is the Dirac delta function; wL is the central frequency of the L-th IMF component; and βL is a filter used to extract the L-th IMF component.
Similar to VMD, the alternating direction method of multipliers is adopted for iterative updating [18], and finally u ^ L n   +   1 , w L n   +   1 , and λn+1 can be obtained. Through the above mathematical operations, the original sEMG can be decomposed into a series of IMF components.

2.2. Determination of SVMD Parameters by PO Algorithm

For the SVMD decomposition algorithm, its performance is affected by the balancing parameter α. When the α value is too high, the regularization penalty becomes excessively strong, leading to the decomposition of an excessive number of incorrect modal components. Conversely, when the α value is too small, the regularization penalty is insufficient, resulting in the problem of mode mixing [19]. Since the decomposition performance of the SVMD algorithm indirectly affects the denoising effect of sEMG signals, this paper employs the Parrot Optimization algorithm to determine the balancing parameter α.
The Parrot Optimization (PO) algorithm is an optimization algorithm proposed by Lian et al. [20] in 2024. This algorithm utilizes four characteristics of parrots, foraging behavior, perching behavior, communication behavior, and fear behavior towards strangers, and proposes an efficient stochastic optimization method. By virtue of an efficient real-time architecture, it balances exploration and exploitation, avoids local optima, and significantly enhances the overall search ability and convergence capability. The mathematical expressions of the algorithm process are as follows:
(1)
Population initialization
The initialization formula of the PO algorithm is as follows:
X i 0 = l b × rand u b l b
where X i 0 is the initial position of the i-th parrot; ub is the upper bound of the search space; lb is the lower bound of the search space; and rand is a random value within the range [0, 1].
(2)
Foraging behavior
When parrots engage in foraging behavior, they mainly judge the approximate location of food by observing the position of food or paying attention to the owner’s position and then fly to the judged food location. The foraging behavior of parrots follows the following formula:
X i n + 1 = X i n X best Lvey dim + rand ( 1 n iter max ) 2 n iter max X mean n
where X i n is the current position; X i n + 1 is the updated position; Xbest is the best position searched so far; n is the number of iterations; itermax is the maximum number of iterations; and Lvey(x) is the Lvey distribution, which is used to describe the flight situation of parrots.
(3)
Perching behavior
When parrots are active, they will suddenly fly to any part of the owner’s body and stay there for a period of time. The process of perching behavior can be expressed by the following formula:
X i n + 1 = X i n + X best Lvey dim + rand ones 1 , dim
where ones(1, dim) is an all-ones vector of dimension dim.
(4)
Communication behavior
Parrots’ communication with the flock is divided into two scenarios: flying towards the flock and not flying towards the flock. The occurrence probabilities of these two scenarios are the same, and the center of the flock is the average position of the current population. The process of communication behavior can be expressed by the following formula:
X i n + 1 = 0.2 rand 1 n i t e r max X i n X m e a n , P 0.5 0.2 rand exp n rand iter max , P > 0.5
where, when P ≤ 0.5, the formula represents the process of parrots joining the flock for communication; when P > 0.5, the formula represents the process of parrots flying out immediately after communication.
(5)
Fear of strangers
The behavior of parrots staying away from strangers and seeking a safe environment along with their owner is given by the following formula:
X i n + 1 = X i n + rand cos 0.5 π n iter max X best X i n cos [ rand π ] n iter max 2 iter max X i n X best
where this formula consists of three parts: the parrot’s current position, flying towards the owner’s position, and staying away from the stranger’s position.
In this study, the minimum Mutual Information (MI) is selected as the fitness function of the PO algorithm, which is defined as the following formula:
MI X , Y = H X + H Y H X , Y
where H(X) and H(Y) are the marginal entropies of the two IMF components; H(X, Y) is the joint entropy of the two IMF components. The expressions of H(X), H(Y), and H(X, Y) can be represented by the following formulas:
H X = x P x log P x H Y = y P y log P y H X , Y = x , y P x , y log P x , y
where P(x) and P(y) are the marginal probability distributions of the two IMF components; P(x, y) is the joint probability distribution of the two IMF components.

2.3. Combining with Wavelet Threshold

For the IMF components obtained by the PO-SVMD algorithm, those with higher noise content are selected for further wavelet threshold processing. Permutation Entropy (PE) is a nonlinear estimation method used to describe the complexity of one-dimensional sequence signals [21]. Components with high PE values tend to contain more disordered noise components. Kurtosis is a statistic describing the “peakedness” of signal amplitude distribution, reflecting the intensity of impact components in the signal [22]; a higher kurtosis value indicates more impact characteristics of electromyographic signals. Combining the advantages of both, this study uses their ratio as an indicator for evaluating noise content, as shown in the following formula:
G i = H PE m K u i
where HPE(m) is the Permutation Entropy; Kui is the kurtosis value. A larger G value indicates that the component has higher noise content; a smaller G value indicates richer sEMG signal characteristics.
Select the IMF components with a G-value greater than the average value and further process them using wavelet thresholding (WT). Finally, the processed IMF components and unprocessed modal components are reconstructed to obtain denoised sEMG signals. The denoising process based on PO-SVMD is shown in Figure 2.

3. Prediction Method of ResNet-GRU Combined Model

The prediction model combining Residual Network and Gated Recurrent Unit (ResNet-GRU) can give full play to the advantages of each module: ResNet can conduct in-depth mining of feature data, efficiently extract its local correlation information, and at the same time reduce the problems of gradient vanishing and model degradation existing in traditional CNN; GRU focuses on capturing the temporal dependencies contained in feature data. This collaborative working mode can reduce the amount of input data while conducting in-depth analysis of the inherent patterns of the input data from different perspectives, thereby reducing the complexity of the model while improving the accuracy and generalization ability of prediction.

3.1. Convolutional Neural Network

CNN is a feedforward neural network with convolutional operations and a deep structure. It can extract high-dimensional features from input data using convolution and pooling techniques, accurately capture local structural information of the data, and thus can be applied to research on recognizing human motion intentions based on sEMG signals [23]. Since the surface electromyography signals in this study are one-dimensional sequence data, one-dimensional convolution operations are adopted. CNN mainly consists of convolutional layers, pooling layers, unfolding layers, and flattening layers.
The core of the Conv layer lies in convolutional kernels, and a convolutional layer is usually composed of multiple convolutional kernels. The essence of convolution operation is to calculate the dot product results in each corresponding region through a movable convolutional kernel, thereby obtaining local features. The convolution operation can be expressed as follows:
x j l = f i = 1 N x i l 1 c i , j l + b j l
where l is the l-th convolutional layer; x j l is the output signal of the j-th convolutional kernel in the l-th convolutional layer after convolution operation; x i l 1 is the input signal of the l-th convolutional layer; c i , j l is the weight of the j-th convolutional kernel in the l-th convolutional layer; b j l is the bias term corresponding to the j-th convolutional kernel in the l-th convolutional layer; N is the size of the convolutional kernel; and f(x) is the activation function.
The pooling layer is used for feature selection and redundant information filtering. While simplifying the data, it enhances the model robustness and extracts local nonlinear optimal features of sEMG signal data. This study adopts average pooling, and the process can be expressed as follows:
y i l = 1 N i = 1 N x i l
where y i l is the output signal of the l-th convolutional layer after pooling; x j l is the convolution result of the l-th convolutional layer; N is the number of inputs for each pooling operation.
The unfolding layer is used to reassemble the local temporal features obtained after convolution and pooling in chronological order to ensure the continuity of the feature sequence; the flattening layer further compresses the unfolded sequence features into a one-dimensional vector, so that redundant dimensions such as channels are eliminated.

3.2. Residual Network

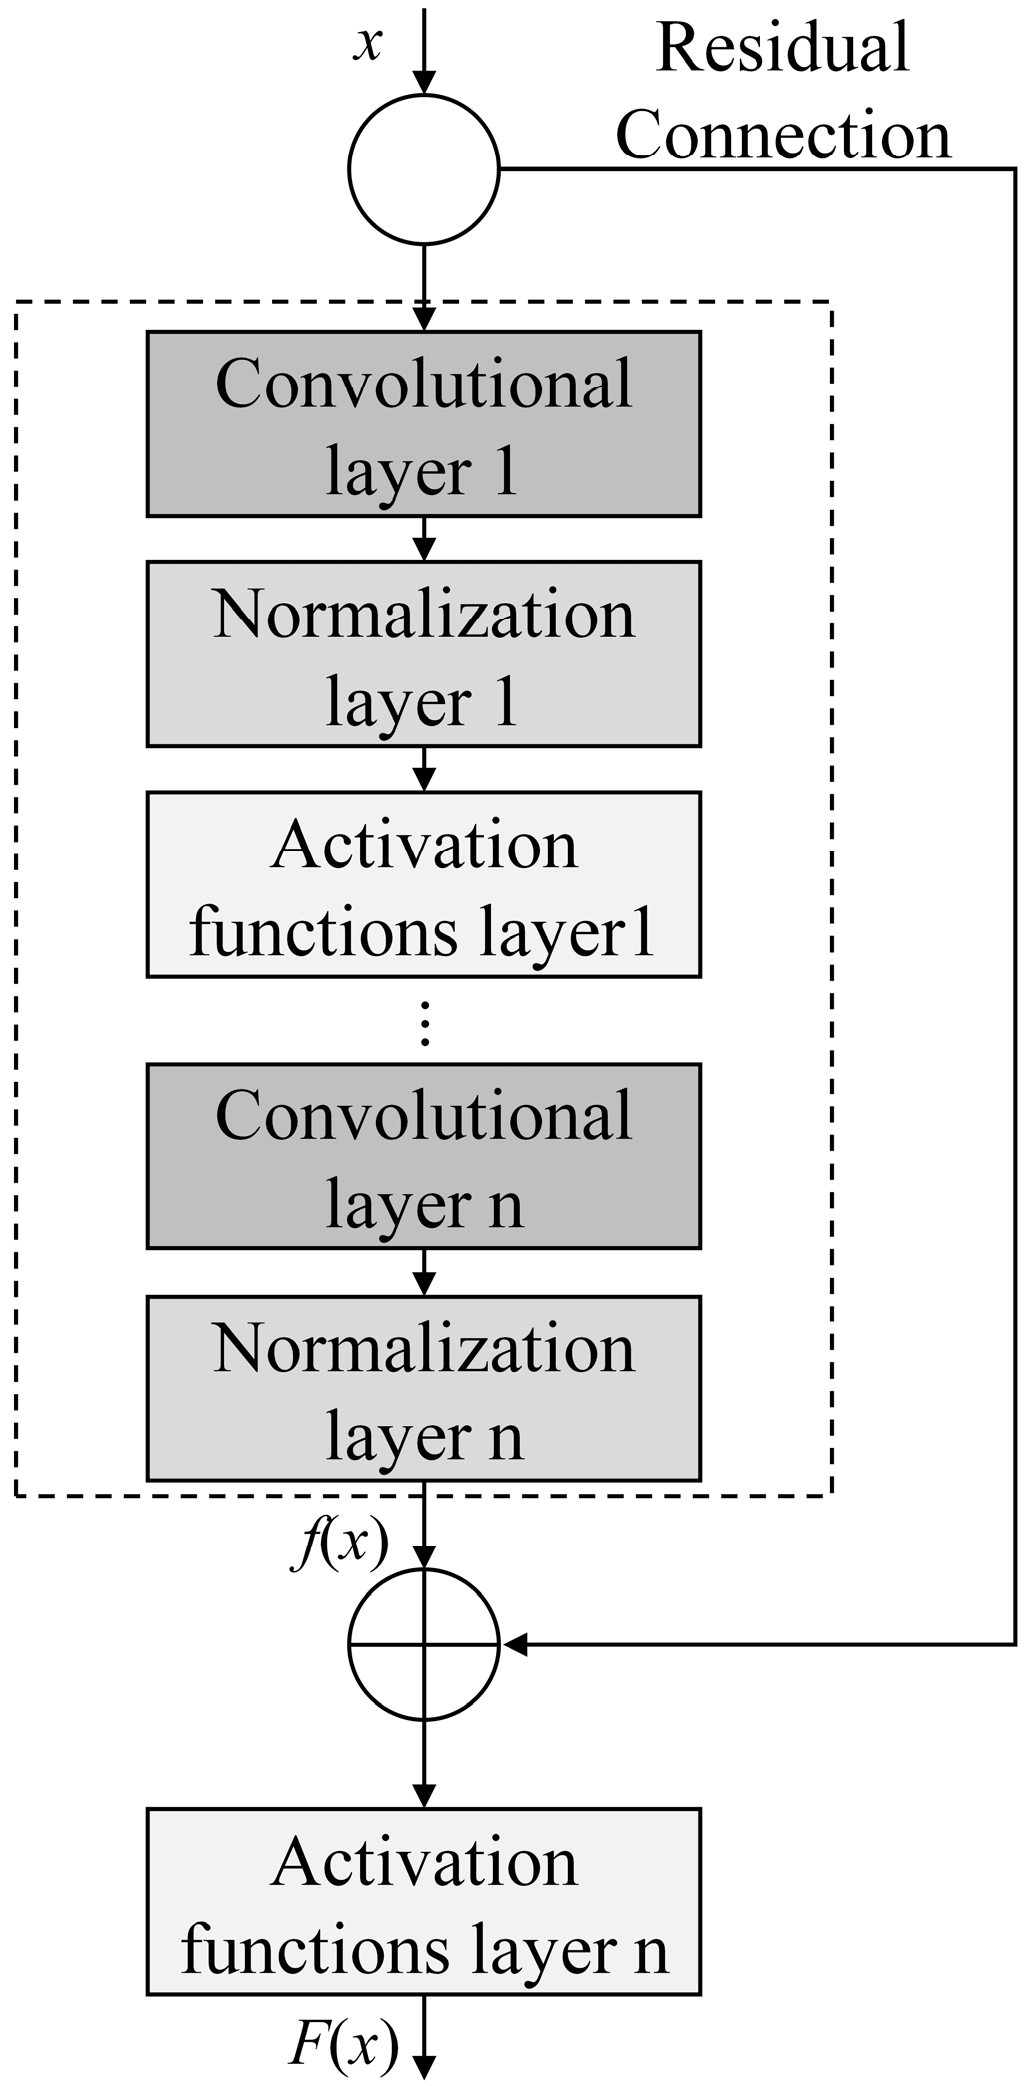
Generally speaking, the performance of neural networks improves as their depth increases. However, as the network depth grows, the network accuracy reaches a saturation point; further increasing the depth will instead lead to the phenomenon of gradient vanishing, causing network degradation and thus impairing the model’s performance [24]. Based on this, the Residual Network (ResNet) is introduced, which is a special type of CNN that incorporates residual blocks on top of the basic CNN structure. A residual block consists of a convolutional layer, a normalization layer, an activation function layer, and a residual connection, and it can solve the gradient vanishing problem that occurs during model training. Its structure is shown in Figure 3.
Input x can directly serve as the output of the mapping layer through the residual connection, increasing the depth of the model without increasing errors. The residual function can be expressed as follows:
F x = f x + x
where f(x) is the transformation of the main path; x is the input of the residual block.

3.3. Gated Recurrent Unit

Gated Recurrent Unit (GRU) is a variant of RNN. When processing sequential data such as sEMG signals, it can effectively alleviate the problem of gradient vanishing during gradient backpropagation, and it has better initial memory capability compared with traditional RNN [25]. The GRU module consists of a GRU layer and a Dropout layer.
The GRU layer is the core of the GRU module, consisting of two gating units (reset gate and update gate) and one hidden state, with its structure shown in Figure 4. The main calculation formulas of the GRU layer are as follows:
z t = σ W z h t 1 , x t
r t = σ W r h t 1 , x t
h ˜ t = tanh W r t h t 1 , x t
h t = 1 z t h t 1 + z t h ˜ t
where zt is the update gate; σ is the sigmoid function, which can map the value range to [0, 1]; Wz is the weight matrix of the update gate; xt is the input information of the current neuron; ht−1 is the hidden state at the previous moment, which contains the data information memorized by the recurrent neural network; rt is the reset gate; Wr is the weight matrix of the reset gate; h t ~ is the candidate hidden state; tanh is the hyperbolic tangent function, which can map the value range to [−1, 1]; W is the weight matrix of the candidate hidden state; and ht is the hidden state passed to the next moment.
The Dropout layer can reduce the risk of overfitting during model training by randomly dropping out neuron outputs with a certain probability, thereby improving its generalization ability.

3.4. ResNet-GRU Combined Prediction Model

The ResNet-GRU combined prediction model used in this study consists of a single input layer, an initial convolutional layer, a normalization layer, an activation function layer, a pooling layer, an unfolding layer, a flattening layer, a fully connected layer, an output layer, and multiple residual blocks and GRU modules. The structure of the ResNet-GRU model is shown in Figure 5.
After the input layer receives the data, the initial convolutional layer first extracts local features. Subsequently, the normalization layer stabilizes the data distribution to accelerate training, and then the activation function layer introduces nonlinear features to enhance the model’s expressive ability. Then, it enters the residual blocks, where residual connections alleviate the gradient vanishing problem in deep networks and deeply explore complex features of the data. After that, the pooling layer performs sampling to reduce the parameter scale while retaining key features. The unfolding layer and flattening layer integrate all neurons of the pooling layer to prepare for the input to the GRU module. The GRU module captures dependencies in the sequence dimension to extract temporal features. Finally, the fully connected layer integrates the features and maps them to the target dimension, and the prediction results are output through the output layer.

4. Data Collection and Processing

4.1. Signal Collection Equipment

This study used the ED0039 six-lead electromyography sensor produced by Jiangsu Purunning Technology Co., Ltd., Nanjing, China, to collect sEMG signals, as shown in Figure 6. This set of equipment includes an sEMG signal collection module, a Bluetooth module, electrode pad connecting wires, and an electrodes pad, with a sampling frequency of 1000 Hz.
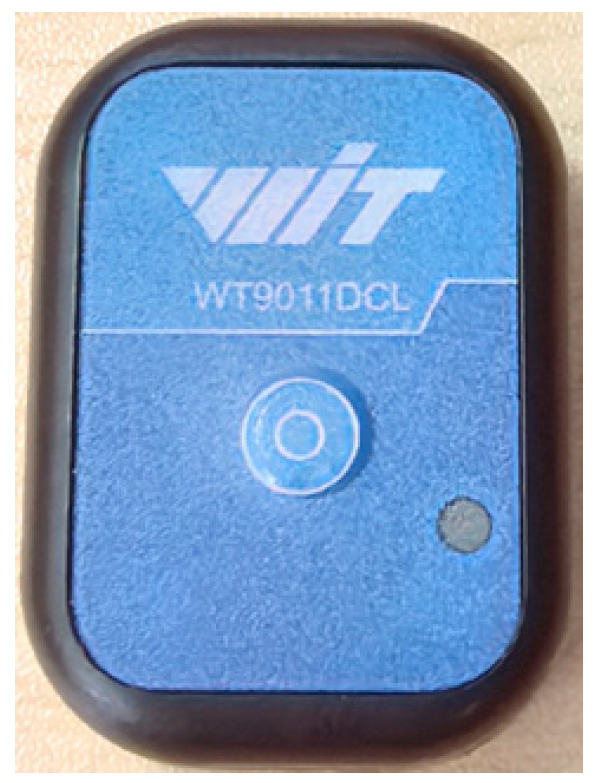
Meanwhile, the BWT9011DCL Bluetooth 5.0 nine-axis gyroscope sensor produced by Shenzhen Wit Intelligent Technology, China, was used to collect the motion angles of lower limb joints, with a sampling frequency of 200 Hz, as shown in Figure 7.

4.2. Muscle Selection

According to the muscle synergy theory, the execution of a movement is achieved through the coordinated control of multiple muscles [26]. This study focuses on two common movement conditions: level walking and stair climbing, which correspond to the flexion and extension movements of the hip and knee joints. Four muscles were selected to collect surface electromyography signals, namely the rectus femoris, vastus lateralis, semitendinosus, and biceps femoris. The distribution positions of the selected muscles in this study are shown in Figure 8.

4.3. Signal Collection

A total of five subjects were recruited in this study for signal collection, and the specific information of the subjects is shown in Table 1.
The signal collection was conducted on an open flat ground and a staircase. Each subject sequentially performed two movement conditions: level walking and stair climbing. Meanwhile, sEMG signal collection equipment and a nine-axis gyroscope were used to collect lower limb sEMG signals and joint motion angles, respectively, as detailed below.
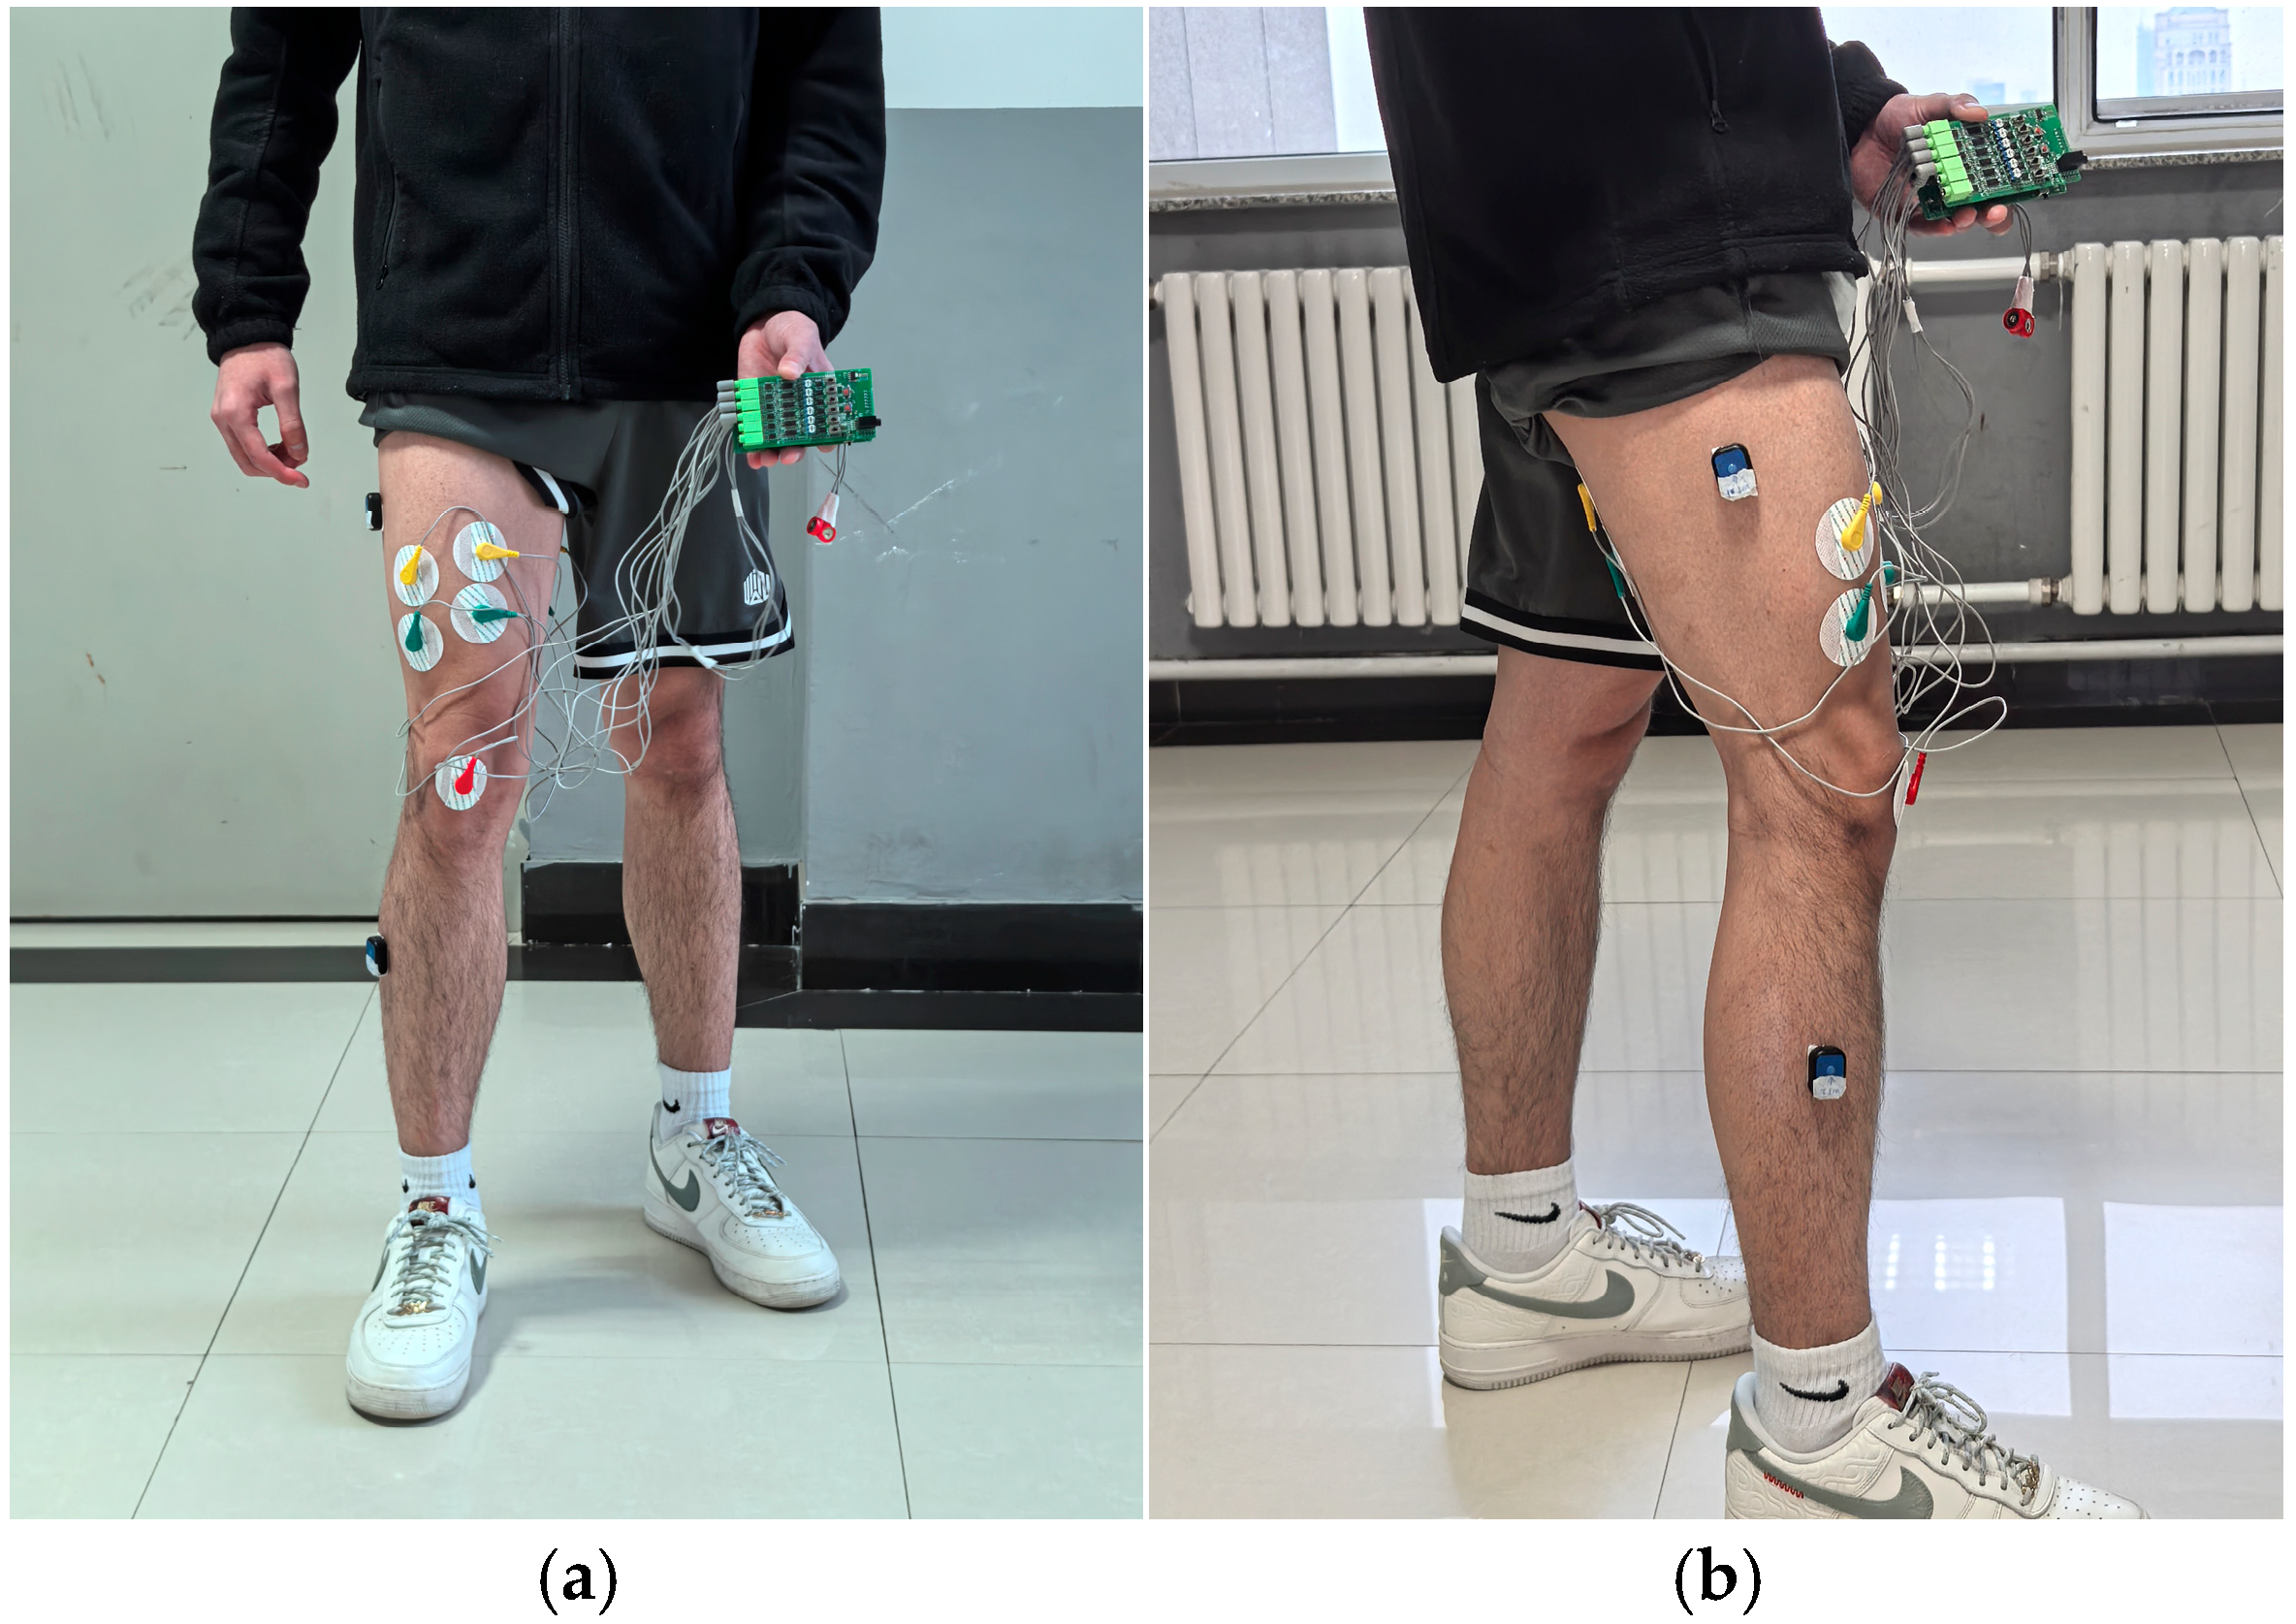
To reduce interference, it was necessary to remove part of the subjects’ body hair and clean the corresponding areas with alcohol. An ED0039 six-lead EMG sensor was used to collect lower limb sEMG signals: the active electrode pads of the EMG sensor were attached to the corresponding muscles on the subjects’ right legs, while the reference electrode pad was attached to the knee area with less muscle tissue and connected to the electrode lead wires. Meanwhile, a BWT9011DCL nine-axis gyroscope sensor was used to collect the movement angles of the hip and knee joints. Two angle signal sensors were vertically fixed on the lateral sides of the thigh and lower leg, respectively. The wearing diagram of the EMG sensor and angle sensor is shown in Figure 9.
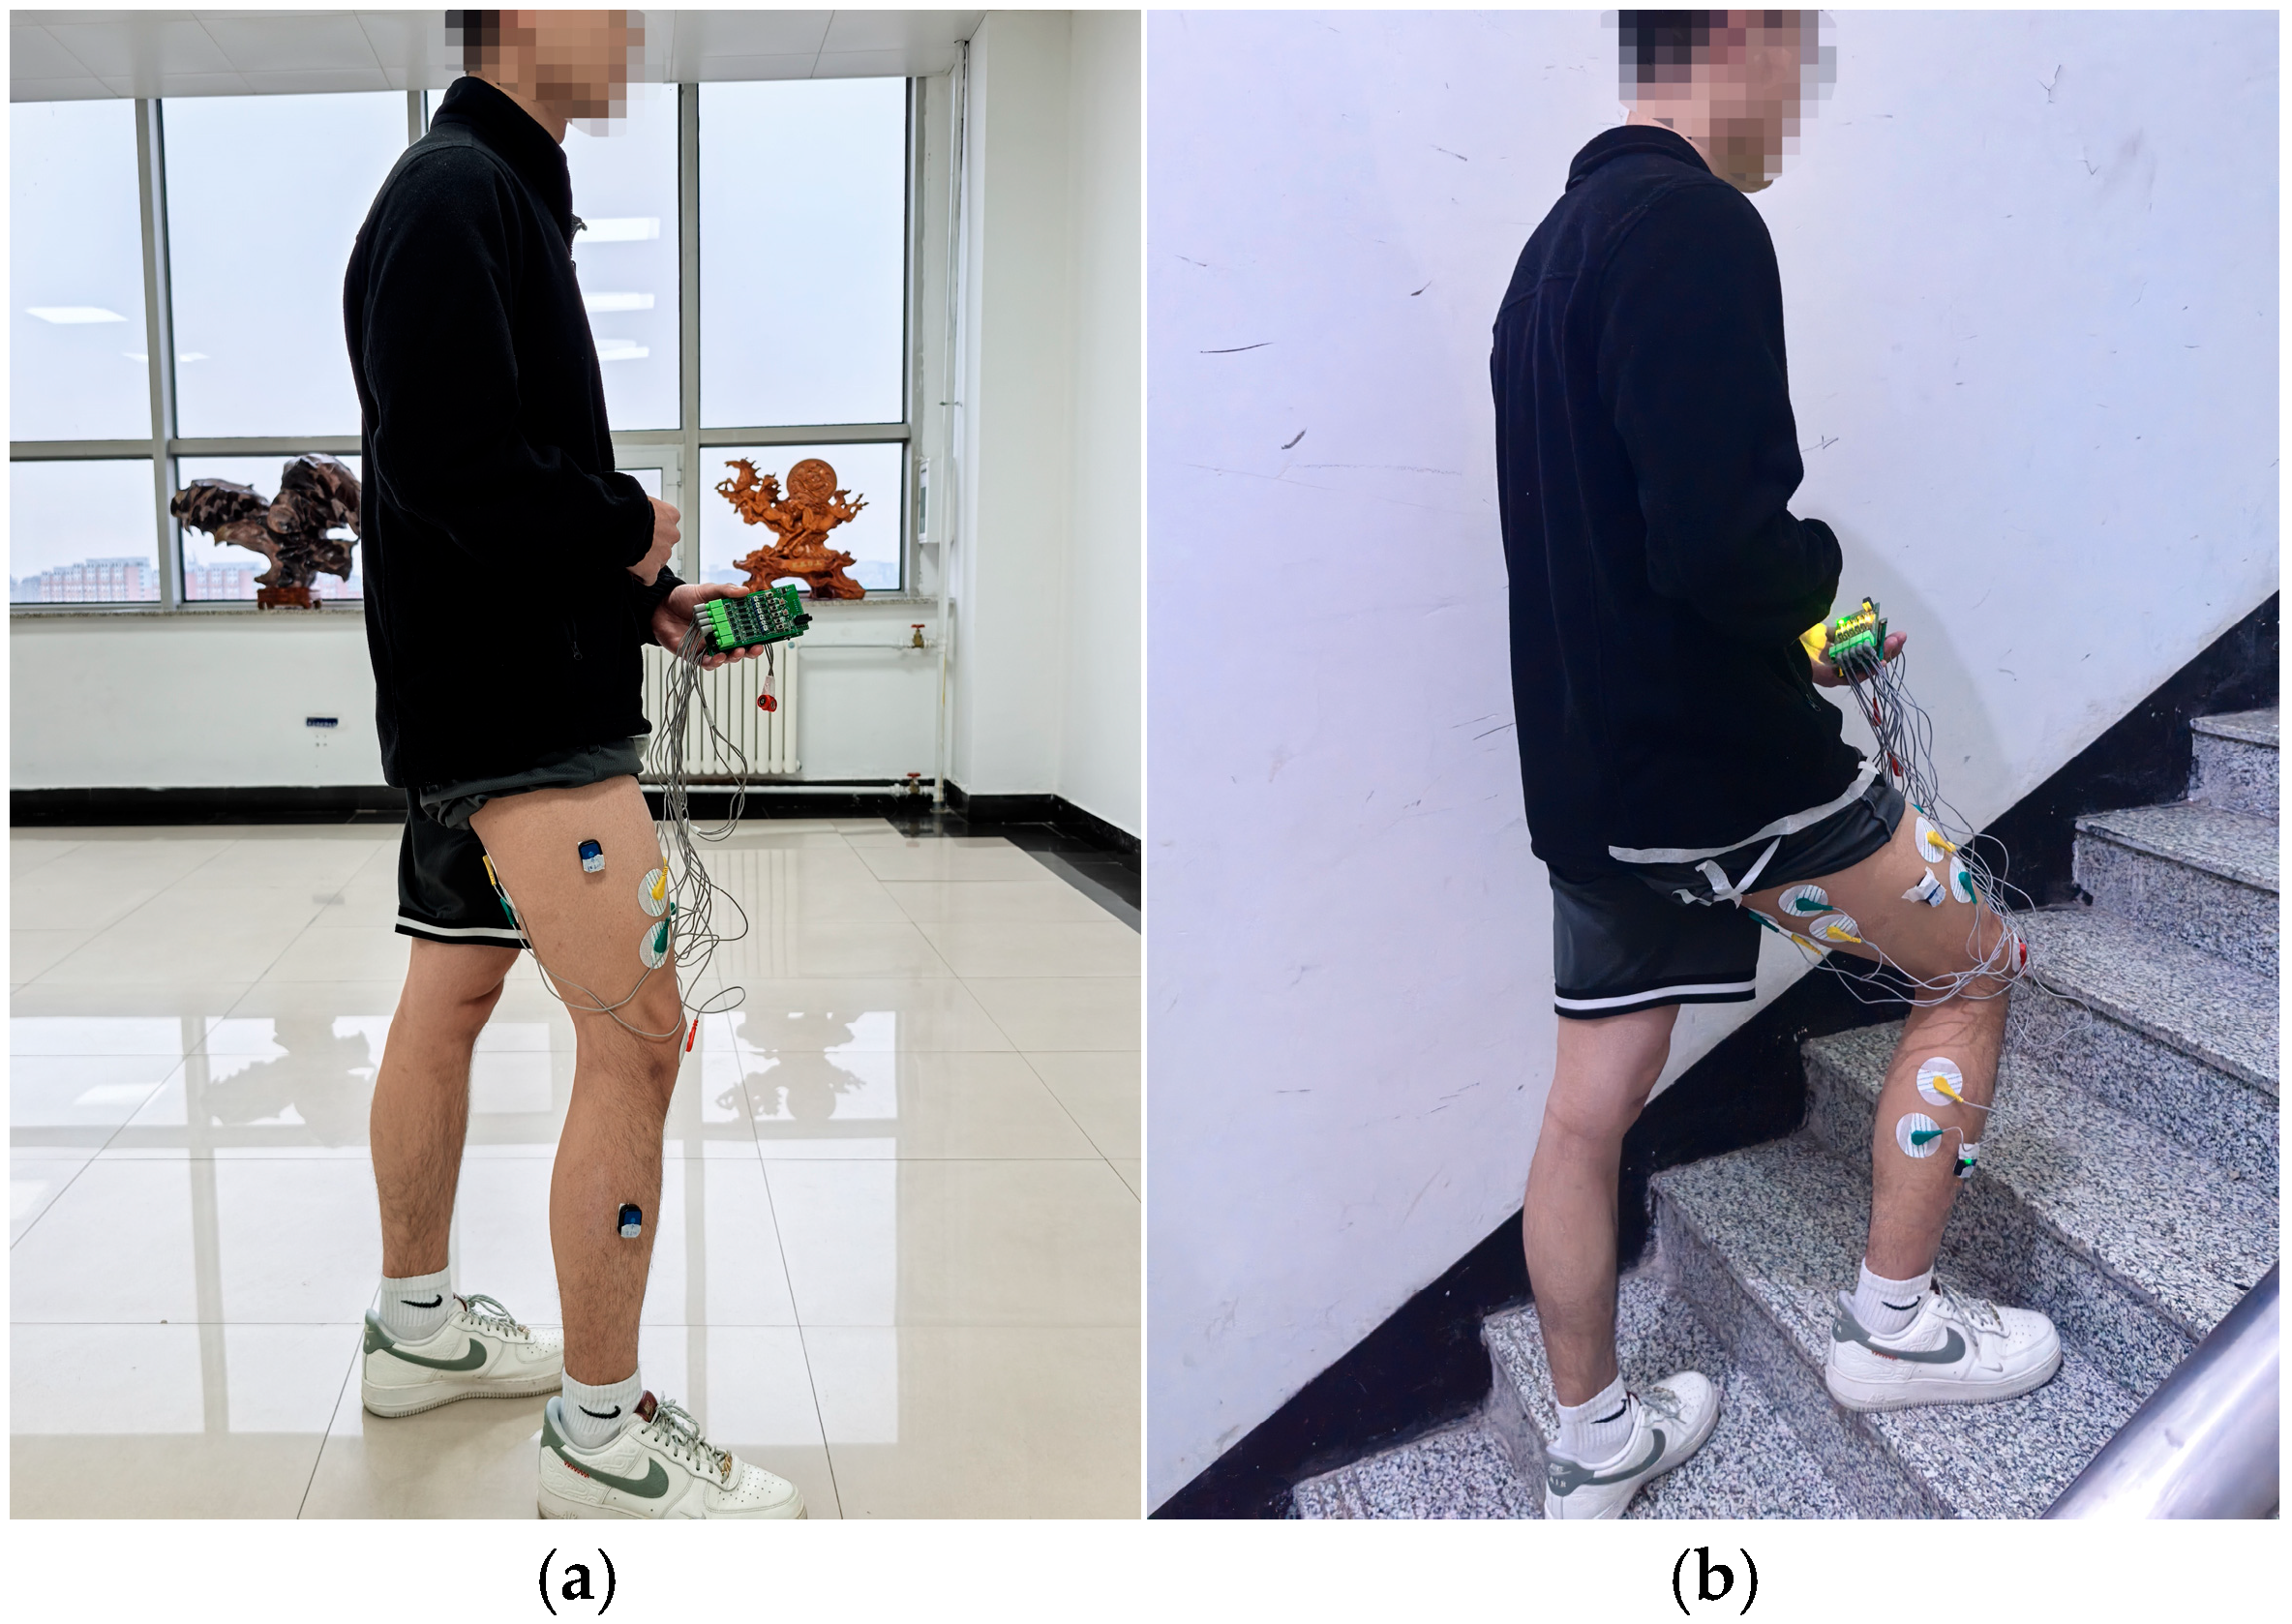
During the signal collection process, data corresponding to 40 active gait cycles were collected for each subject when they performed level walking and stair climbing, respectively. That is, each of the two movement conditions included data of 200 active gait cycles in total. After completing data collection for every 10 active gait cycles, the subjects rested for 5 min to prevent muscle fatigue from affecting signal collection. The collection process of sEMG signals and joint movement angles under the two movement conditions is shown in Figure 10.

4.4. Processing of sEMG Signals Based on PO-SVMD

4.4.1. Denoising Processing

In this study, PO-SVMD combined with wavelet threshold is used to denoise the original sEMG signals, taking the processing of sEMG signals of the semitendinosus during level walking as an example. First, the original sEMG signals are decomposed using PO-SVMD. The PO algorithm is initialized as follows: population size is 20, number of iterations is 10, upper variable limit is 2000, and lower variable limit is 500 [27]. For the SVMD algorithm, the settings were as follows: dual rising time step is 0, and convergence tolerance is 10−6 [28]. After decomposition, a series of Intrinsic Mode Function (IMF) components were obtained, as shown in Figure 11.
The comprehensive evaluation index G values of each IMF component obtained by decomposing the sEMG signals of the semitendinosus during level walking using PO-SVMD are shown in Table 2.
The IMF components with a comprehensive evaluation index (G) greater than the average value (0.05112), namely, IMF5, IMF6, IMF7, IMF8, and IMF9, were further processed using wavelet thresholding. For the wavelet thresholding algorithm, the settings were specified as follows: the wavelet basis function was db5, and the threshold selection adopted the adaptive threshold method [5,7]. The processed IMF components and unprocessed IMF components are reconstructed to form signals, obtaining denoised sEMG signals. The sEMG signals of the semitendinosus during level walking before and after denoising are shown in Figure 12 and Figure 13.
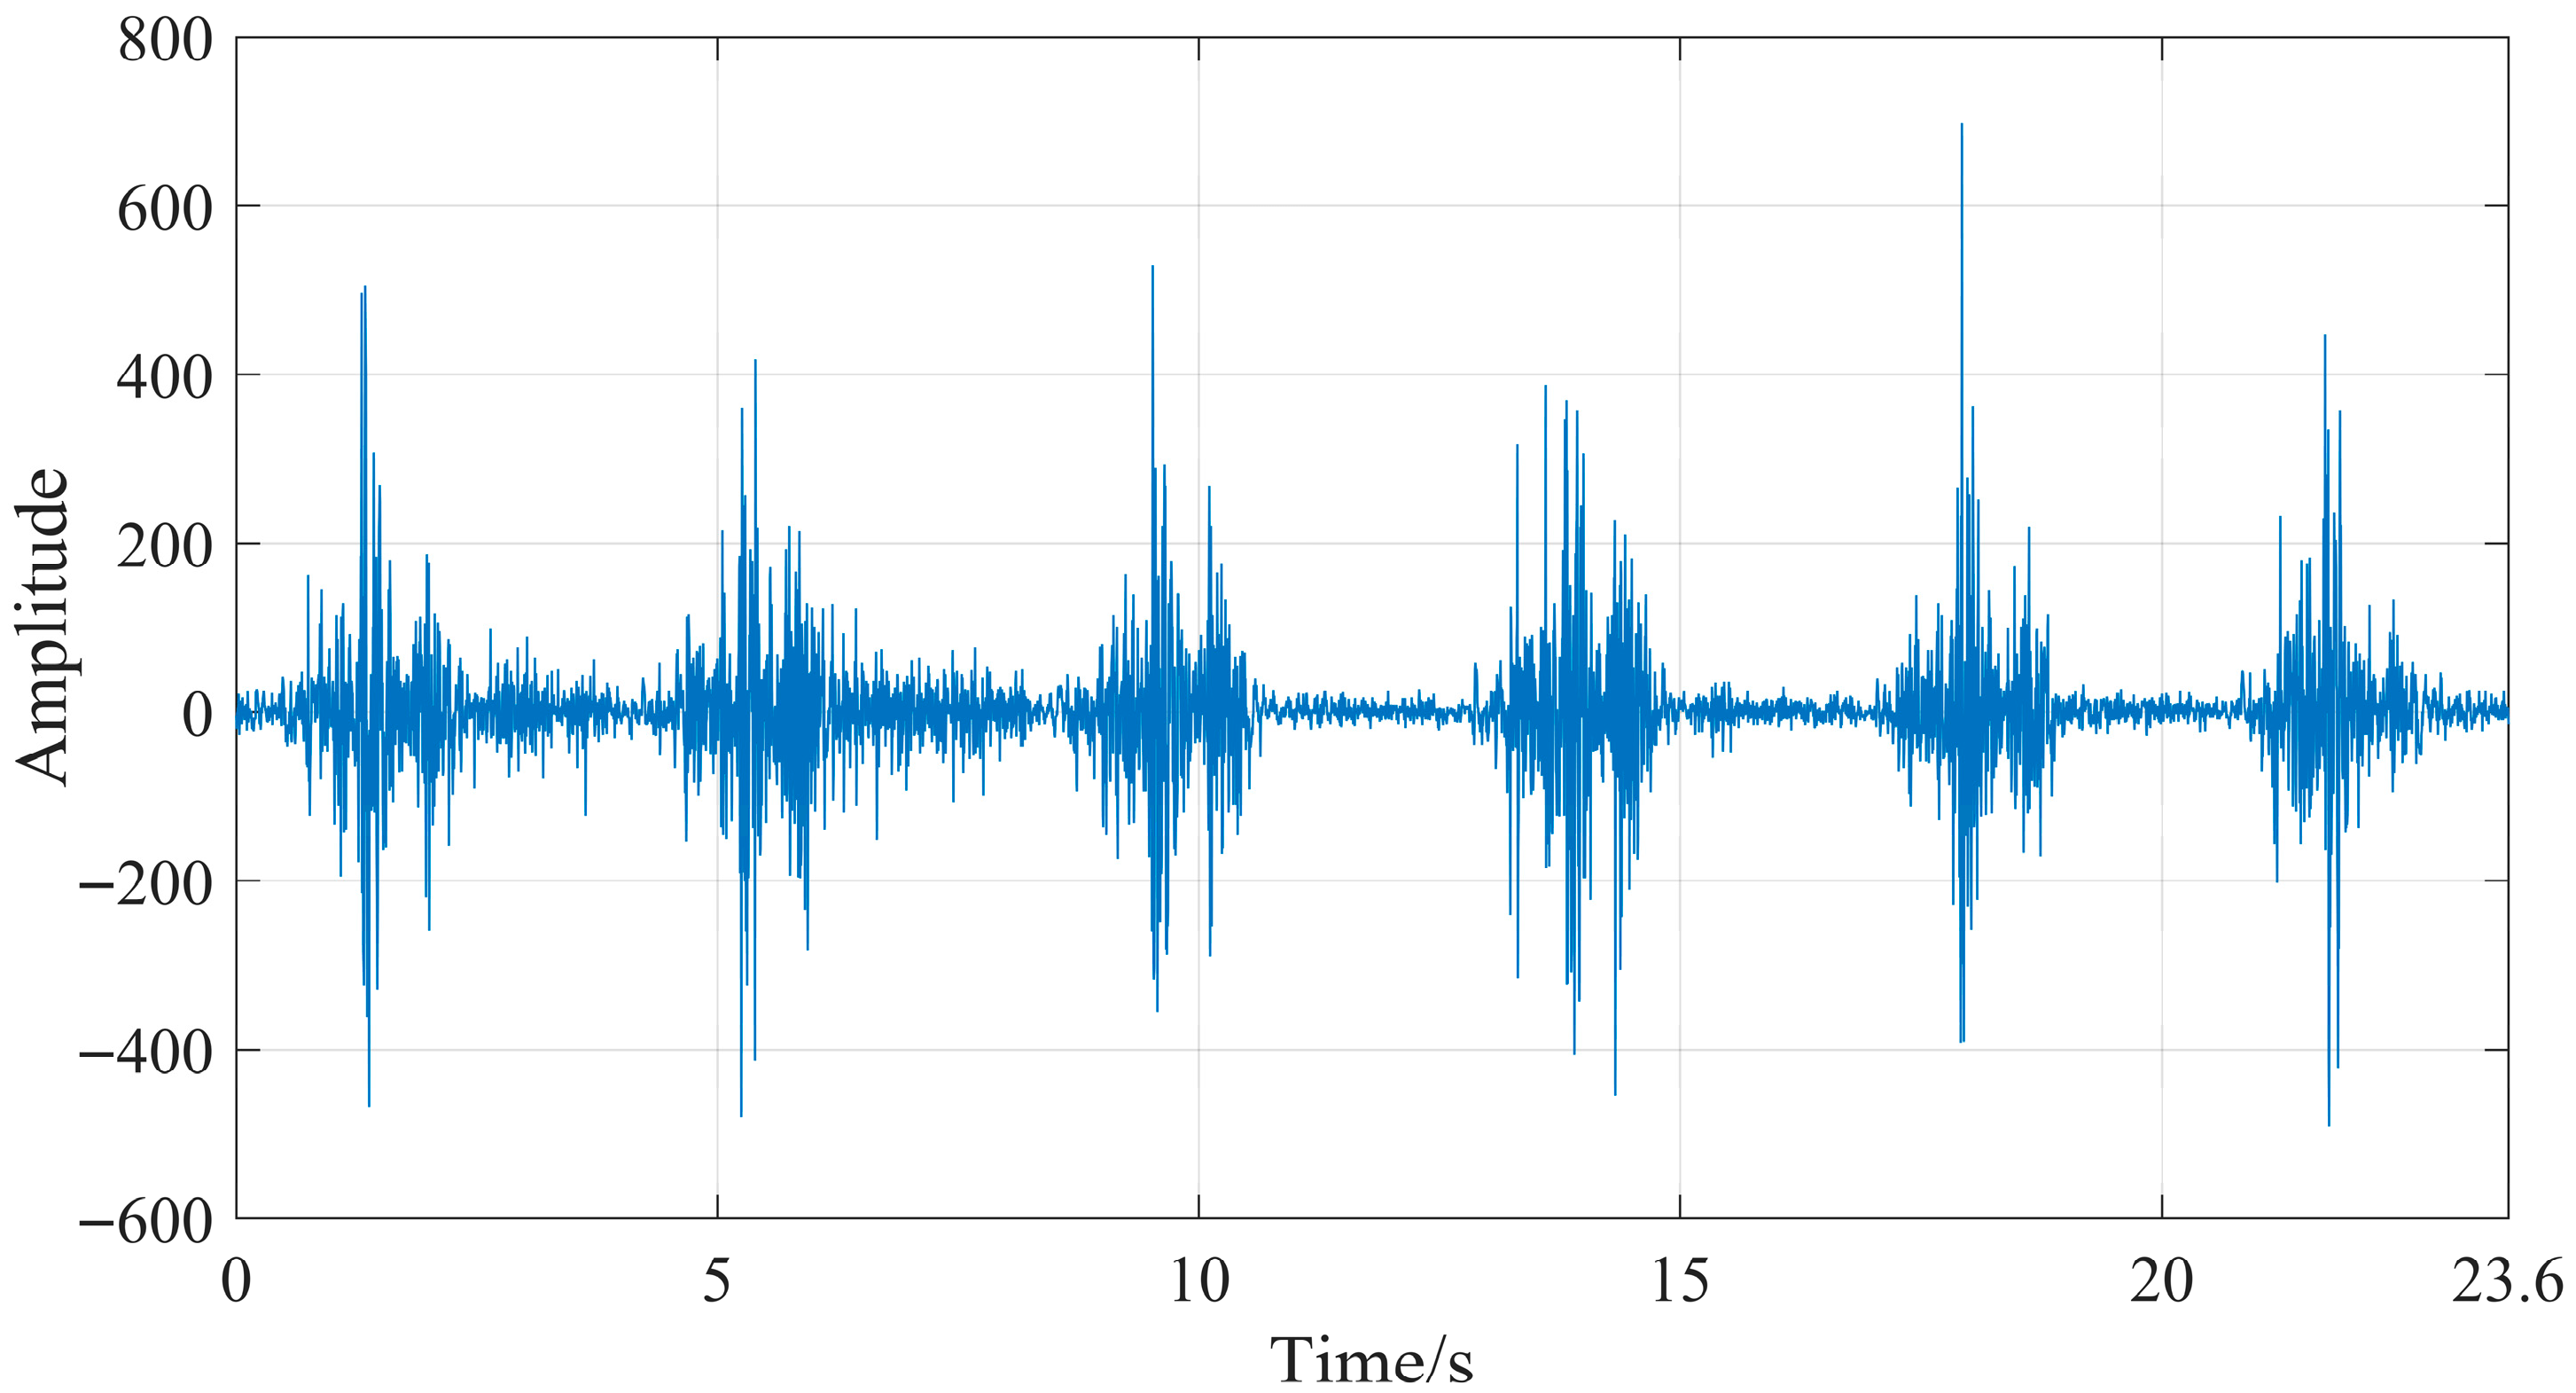
By comparing Figure 11 and Figure 12, it can be seen that the original sEMG signal is mixed with a large amount of noise. After denoising, most of the noise is eliminated, obtaining a more effective sEMG signal. To more intuitively evaluate the denoising effect of the proposed method in this study, the signal-to-noise ratio (SNR) is used as the evaluation index for the denoising effect, and the formula is as follows:
SNR = 10 lg t = 0 N O t 2 t = 0 N O t D t 2
where O is the original sEMG signal, and D is the denoised sEMG signal.
The denoising method proposed in this paper was compared with Empirical Mode Decomposition (EMD), Partial Ensemble Empirical Mode Decomposition (PEEMD) [29], Independent Component Analysis (ICA) [30], and the wavelet thresholding denoising method. The comparison results are shown in Table 3 and Table 4 below.
As can be seen from Table 2 and Table 3, for both movement conditions, the proposed PO-SVMD combined with WT denoising method in this study achieves an overall higher SNR than the WT, EMD, PEEMD, and ICA denoising methods. Compared with WT, the proposed method not only suppresses noise effectively but also better preserves the original characteristics of the signal. In contrast to EMD and PEEMD, the proposed method improves the accuracy of signal decomposition and mitigates mode mixing by adaptively optimizing key parameters; meanwhile, it further suppresses residual noise after decomposition, thereby achieving a better overall denoising effect. However, ICA fails to make full use of cross-channel information in the single-channel processing scenario of this study, resulting in a relatively weak denoising effect.
In summary, the PO-SVMD combined with WT denoising method proposed in this study can improve the SNR of sEMG signals, providing higher-quality signal input for subsequent lower limb movement intention recognition.

4.4.2. Extraction of Absolute Peak Envelope

To characterize the original morphological features of sEMG signals, this study adopted the sliding window method to extract the absolute peak envelope of denoised sEMG signals. The selection of window size and step size is critical for the sliding window: a larger window contains more information, but an excessively large window will lead to prolonged system response time; a smaller step size improves the timeliness of information processing, but an overly small step size results in redundancy between features [31]. In this study, the sliding window was set with a window size of 200 ms and a step size of 50 ms [32]. Taking the extraction of the peak envelope of denoised semitendinosus sEMG signals during level walking as an example, the result is shown in Figure 14 below. It can be observed that the extracted absolute peak envelope features of semitendinosus sEMG signals during level walking are relatively stable and exhibit obvious feature sequences.

4.5. Processing of Joint Motion Angles

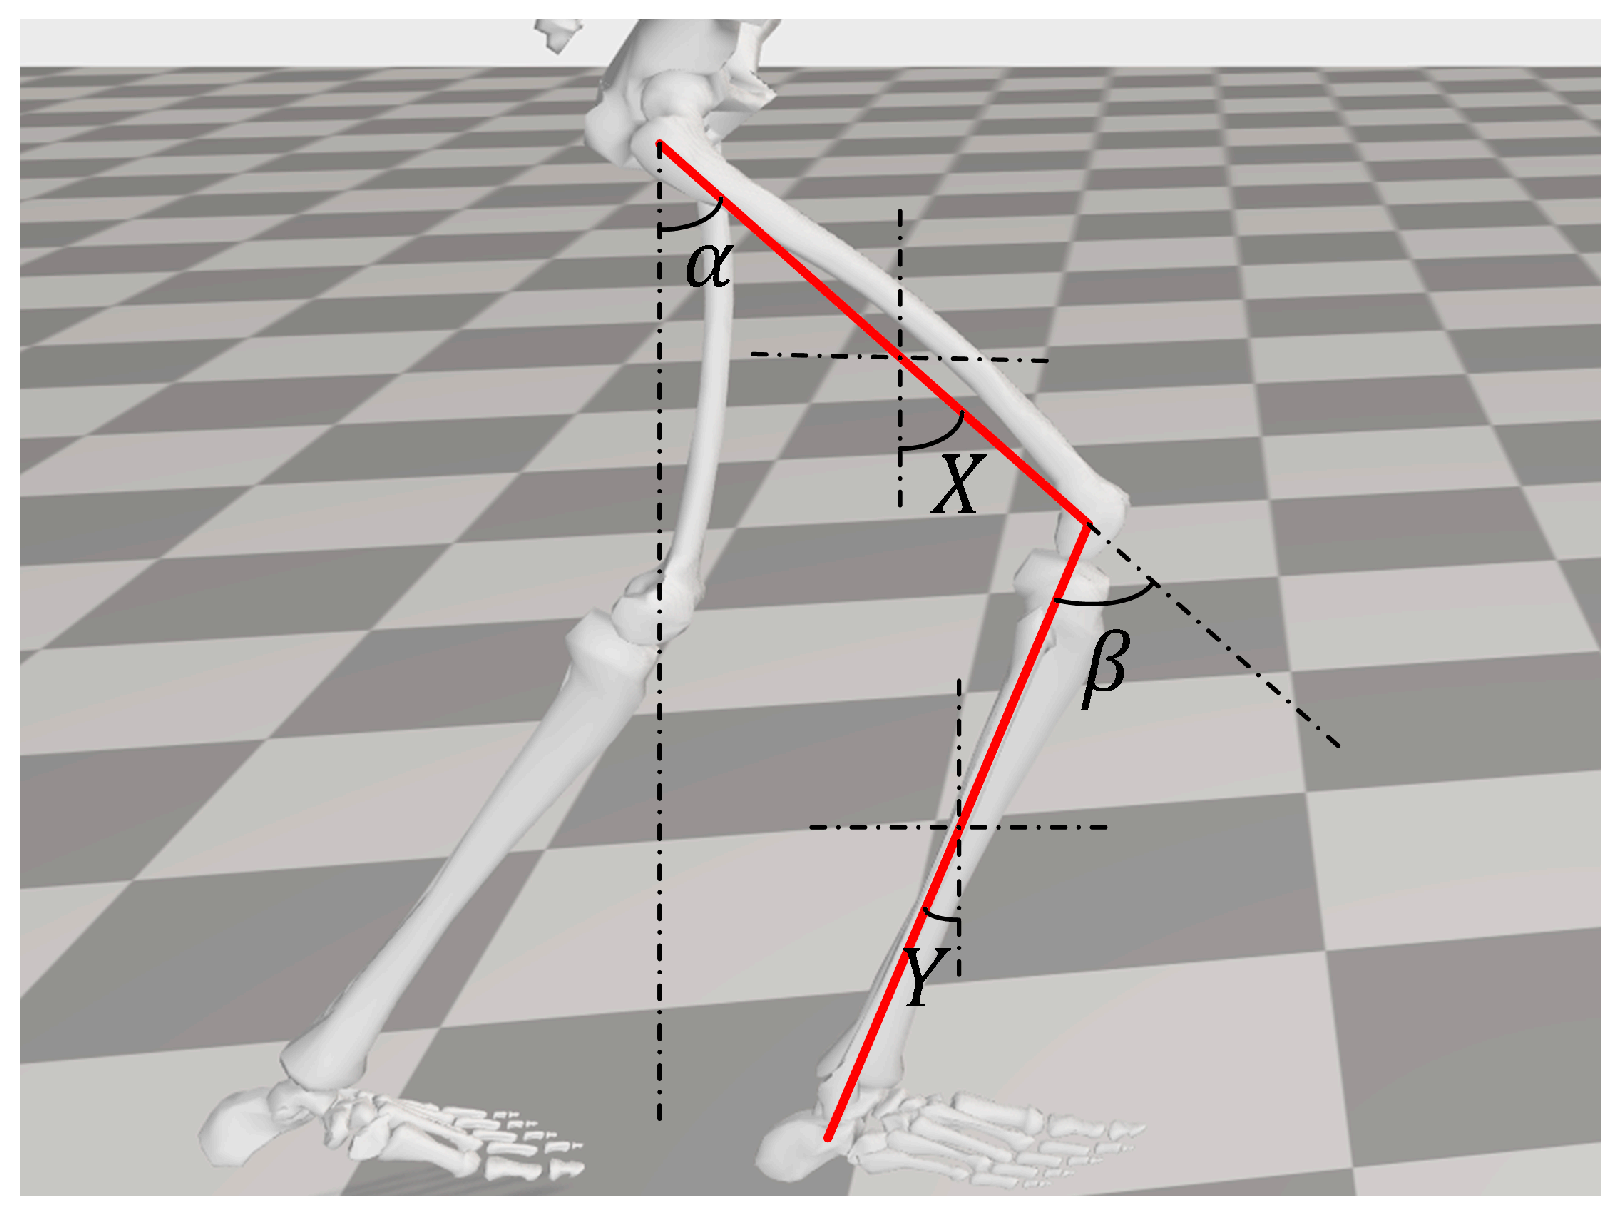
Since the level walking and stair climbing conditions studied in this paper are mainly performed in the sagittal plane, it is only necessary to collect the motion angles of the hip and knee joints in the sagittal plane of the human lower limbs. According to the position of the angle sensor fixed on the subject’s lower limb and the sensor manual provided by Shenzhen Wit Intelligent Technology, extracting data from the y-axis of the sensor can obtain the corresponding data.
According to the sensor manual, the angle signal output by the sensor is the attitude angle of the sensor rotated around its own axis. Therefore, not all data directly obtained from the angle sensor represent joint motion angles. As shown in Figure 15, α is the required hip joint motion angle, β is the required knee joint motion angle, X is the angle collected by the gyroscope worn on the thigh, and Y is the angle collected by the gyroscope worn on the lower leg.
The hip joint motion angle α and knee joint motion angle β can be expressed by the following formula:
α = X β = X Y
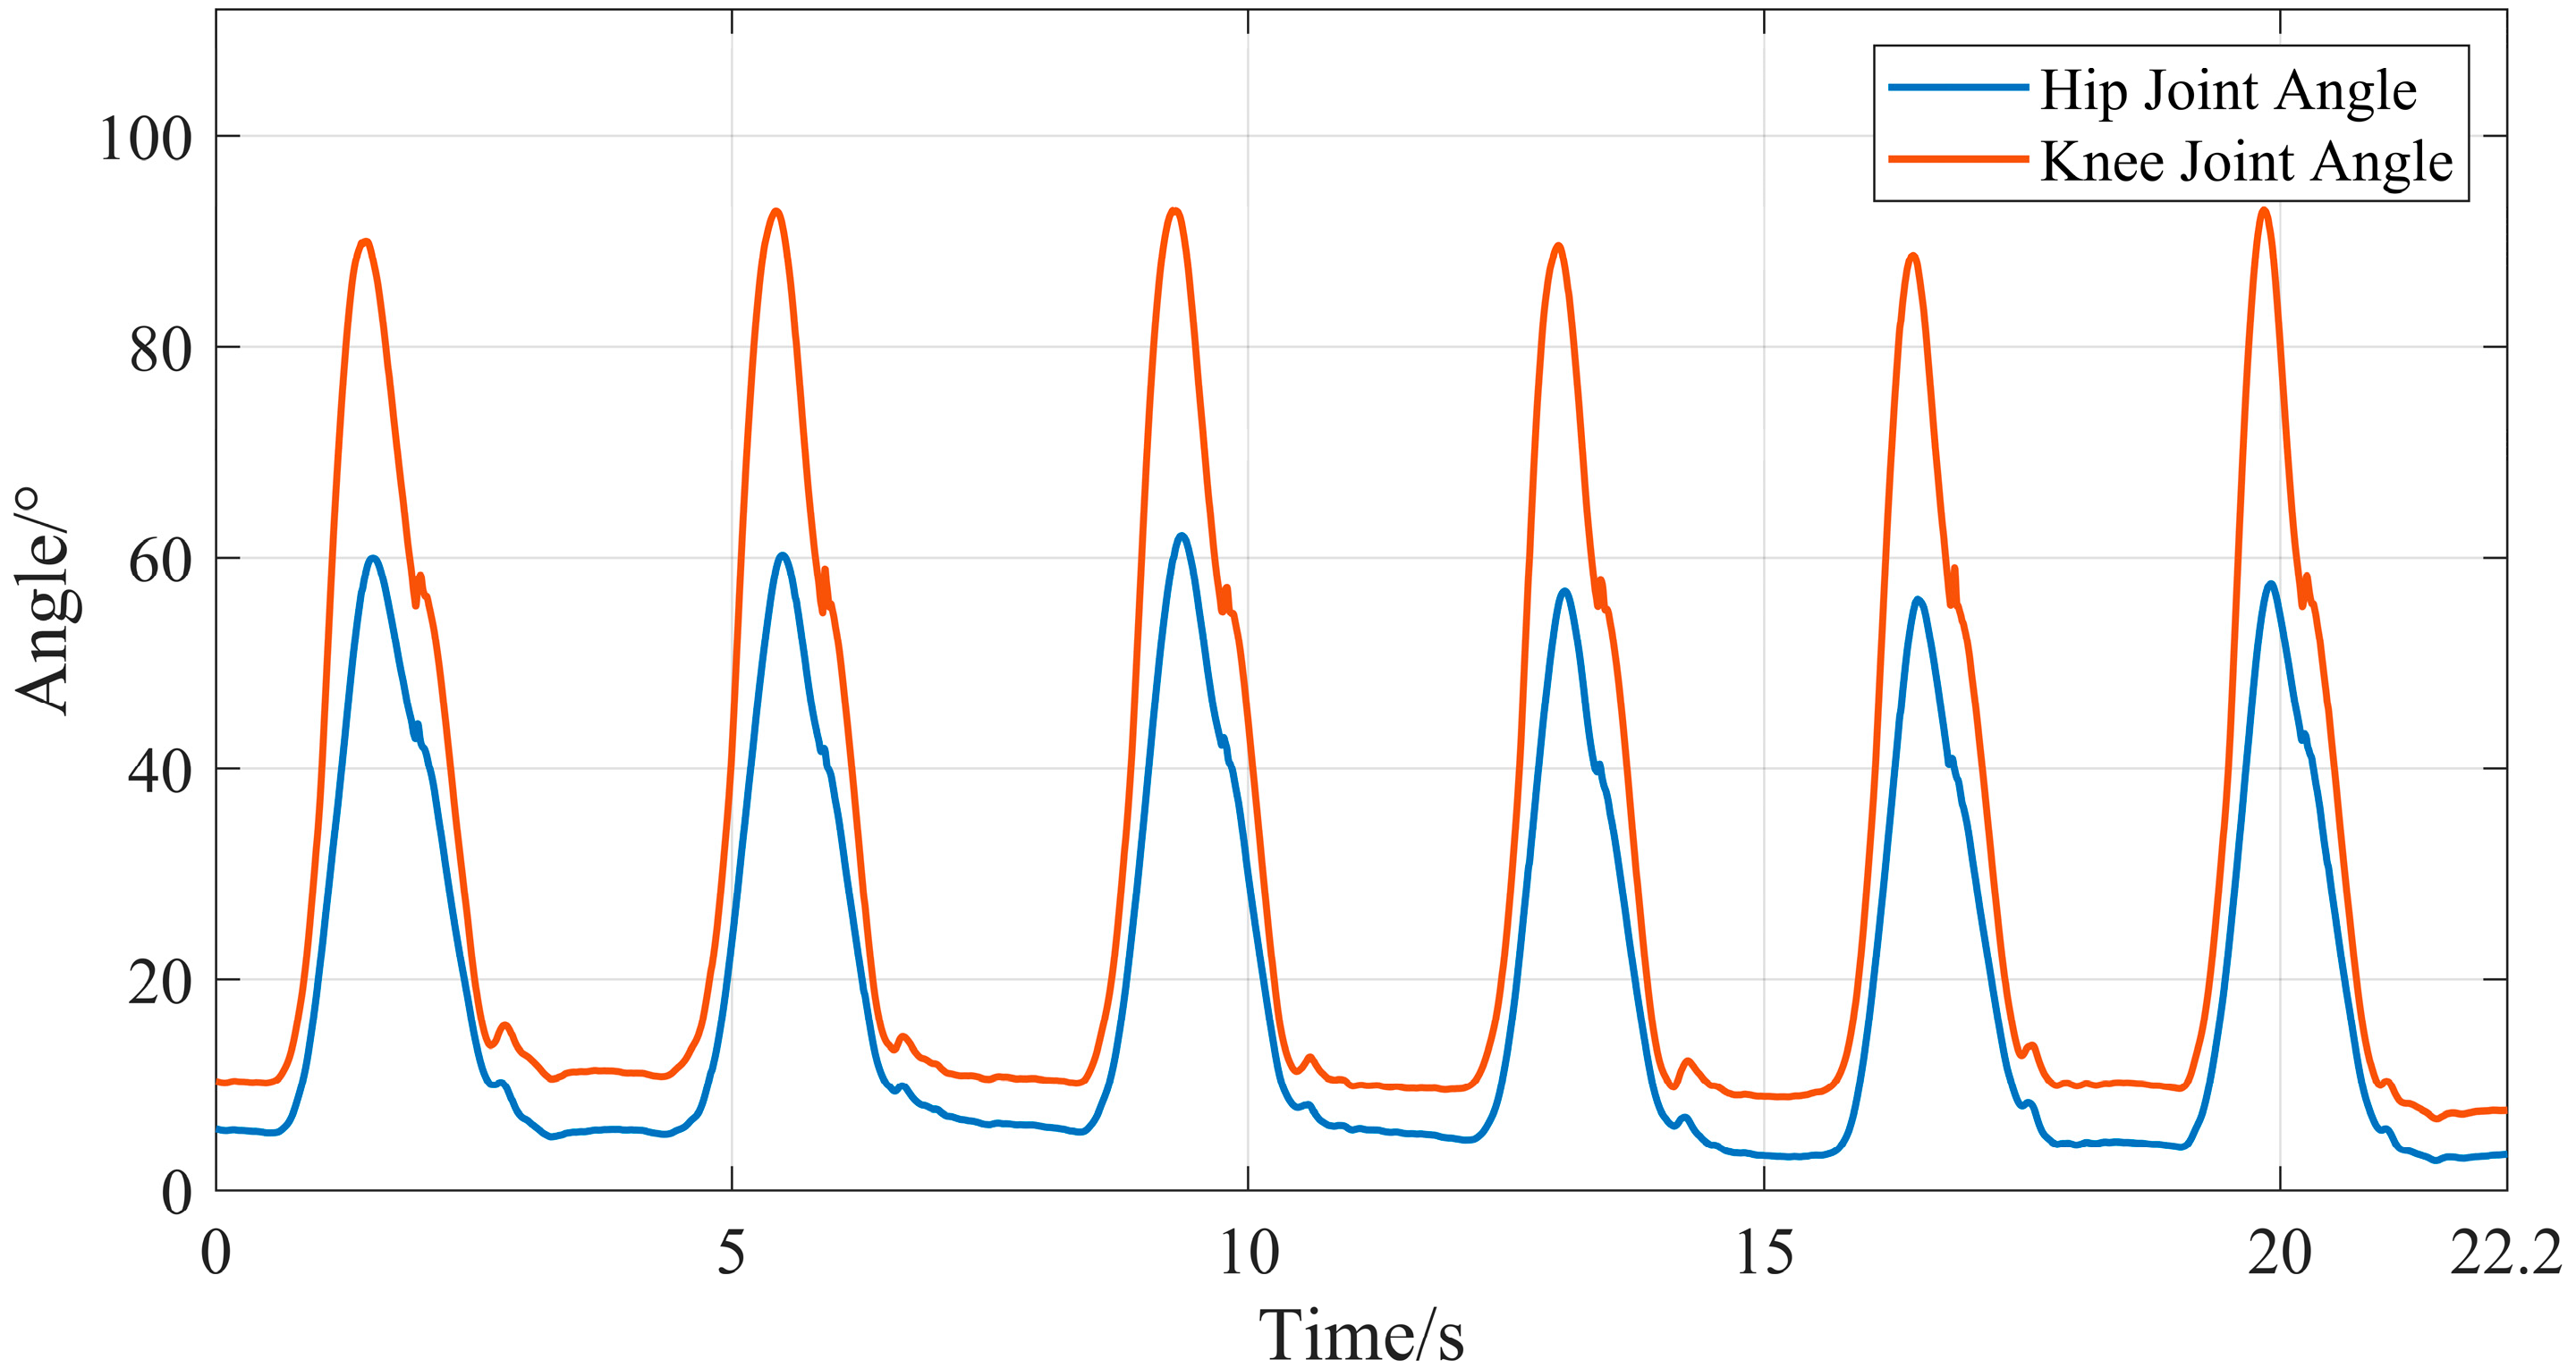
Since the sampling frequencies of the devices used to collect sEMG signals and joint movement angle signals in this study are inconsistent, a time difference may occur between the two types of signals. This time difference would introduce significant errors to subsequent research on joint movement angle prediction. Therefore, this study used the time axis of sEMG signals as the reference to perform resampling on the joint movement angle signals, ensuring that the two types of signals are aligned in the time dimension. The calculated lower limb joint movement angles under the two movement conditions are shown in Figure 16 and Figure 17.

5. Prediction of Lower Limb Hip and Knee Joint Motion Angles Based on ResNet-GRU

5.1. Data Partitioning

After denoising the collected sEMG signals, the absolute peak envelope features of each muscle’s signal were extracted separately, resulting in four groups of feature data corresponding to the four muscles. Additionally, two groups of hip and knee joint movement angle signal data were obtained through calculation.
This study collected information on 200 active gait cycles for two movement conditions (level walking and stair climbing). Each active gait cycle consists of four groups of sEMG signals and two groups of hip and knee joint movement angle signals. A 4:1 ratio was used for data splitting: 160 active gait cycle signals served as the training set, with sEMG signals as input data and hip/knee joint movement angle signals as output data for model training. The remaining 40 active gait cycle signals were used as the test set; with sEMG signals as input data, the trained ResNet-GRU model was employed to obtain the predicted hip and knee joint angles.

5.2. Model Training

5.2.1. Model Parameter Settings

The number of residual blocks and GRU modules is critical to the configuration of the ResNet-GRU model. Before the formal model training, this study temporarily split the training sets of the two movement conditions at a 4:1 ratio: 128 active gait cycles were used as the pre-training set, and 32 active gait cycles were used as the pre-test set. The influence of different numbers of modules on the mean absolute error (MAE) of the pre-test set prediction results was compared. The results are shown in Table 5 and Table 6.
It can be seen from Table 5 and Table 6 that for the ResNet-GRU model used in level walking, the mean absolute error (MAE) of hip and knee joint angle prediction results is the lowest when the number of residual blocks is two and the number of GRU modules is three. For the ResNet-GRU model used in stair climbing, the MAE of hip and knee joint angle prediction results is the lowest when the number of residual blocks is two and the number of GRU modules is two. Therefore, for the ResNet-GRU model applied to level walking, two residual blocks and three GRU modules are selected; for the ResNet-GRU model applied to stair climbing, two residual blocks and two GRU modules are selected. The specific parameters are shown in Table 7 and Table 8. The general parameters of the ResNet-GRU models for the two movement conditions are presented in Table 9.

5.2.2. Training Strategy

After constructing the ResNet-GRU model, the training set is used to train the model. The training option parameters are set as follows: the optimizer is Adam, the learning rate is 0.005, the batch size is 200, and the number of epochs is 20. For loss calculation during model training, the mean squared error loss function LMSE serves as the base loss function, and its mathematical expression is as follows:
L MSE = 1 N i = 1 N α t β t
where α(t) is the predicted joint motion angle at a certain moment during training, β(t) is the actual joint motion angle at the corresponding moment in the training set, and N is the number of samples in the total duration of the training set.
To avoid overfitting during model training, weight decay regularization (L2) is introduced to impose constraints on training weights, with a regularization coefficient of 1 × 10⁻³. The mathematical expression of the total loss function L2 after incorporating regularization is as follows:
L 2 = L MSE + λ w Θ w 2 2
where λ is the regularization coefficient; w is the training weight.
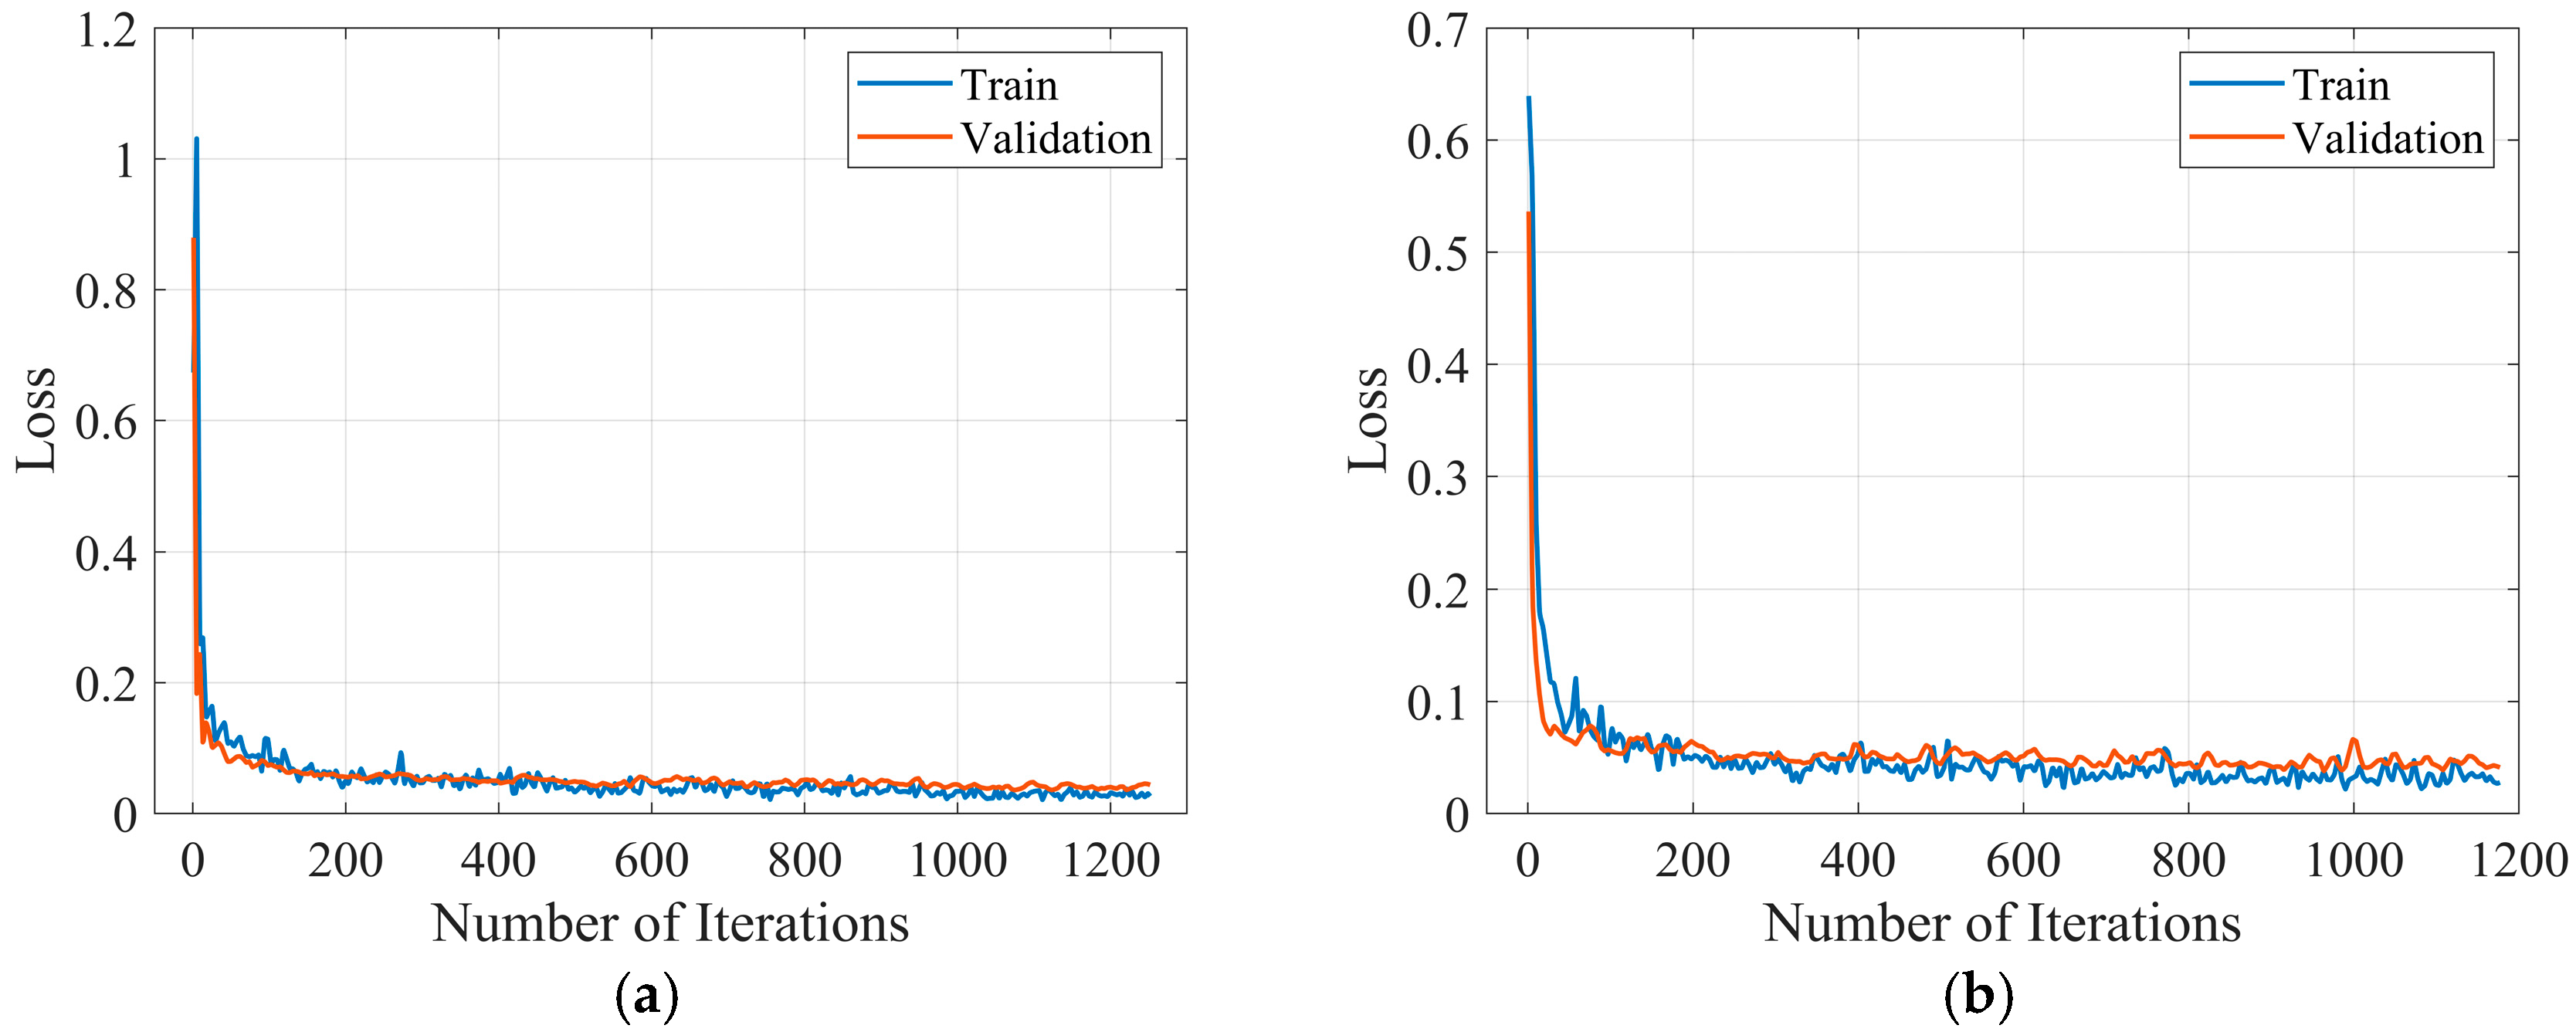
The loss rate variation curves of the ResNet-GRU models for the two movement conditions are shown in Figure 18. It can be observed that under both level walking and stair climbing conditions, the training loss and validation loss of the ResNet-GRU models steadily decrease towards 0 with the number of iteration rounds and gradually stabilize, indicating no risk of overfitting. After training, the hip and knee joint angle prediction models for level walking and stair climbing conditions are obtained, respectively.

5.3. Model Test Results and Comparison

To compare the performance of different hip and knee joint motion angle prediction models, this study used the same data and training strategy, with sEMG signals of the training set as input and hip and knee joint motion angles as output, to train the Transformer-LSTM [33], CNN-GRU, ResNet, and GRU models separately.
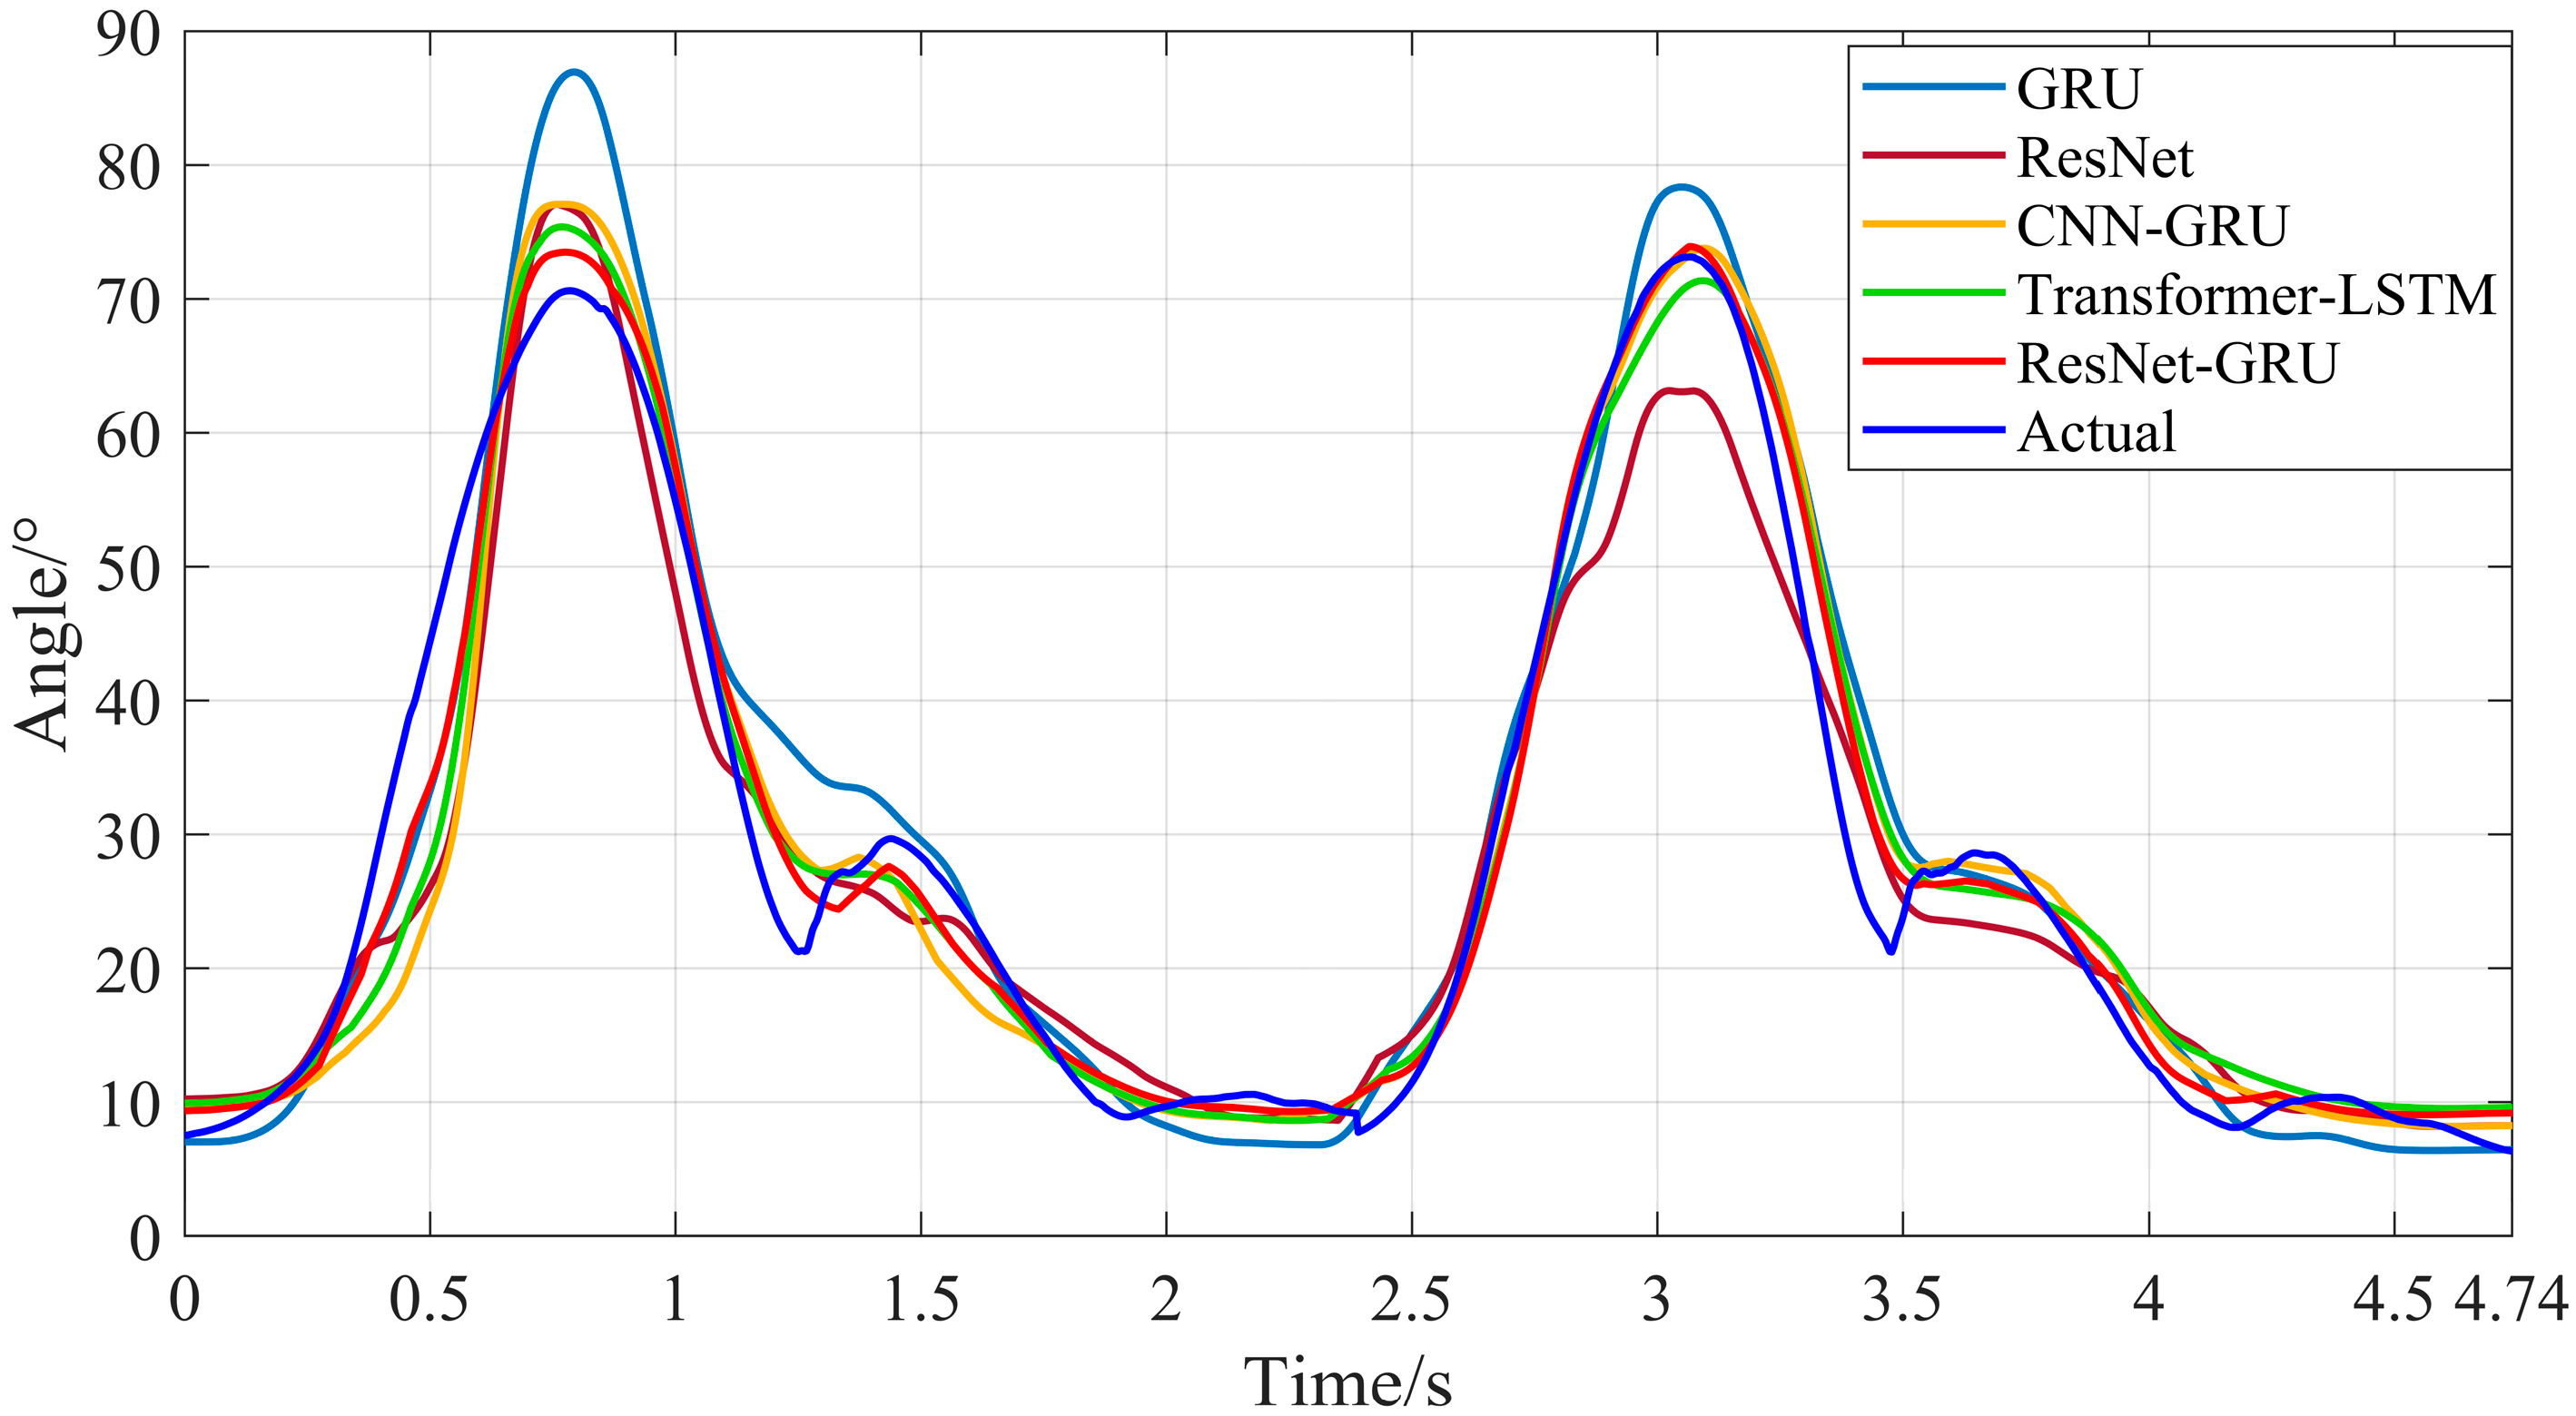
Subsequently, the sEMG signals of the test set were used as input data for the trained ResNet-GRU, Transformer-LSTM, CNN-GRU, ResNet, and GRU models to obtain the prediction results of hip and knee joint motion angles during level walking and stair climbing. As shown in Figure 19, Figure 20, Figure 21 and Figure 22, they are the comparison diagrams between the predicted values and actual values of hip and knee joint movement angles of the five models under level walking and stair climbing conditions, respectively.
It can be seen from Figure 18, Figure 19, Figure 20 and Figure 21 that for both level walking and stair climbing conditions, the hip and knee joint movement angles predicted by the ResNet-GRU model show no obvious fluctuations during the prediction process. Although there is a certain deviation from the actual values, the overall tracking effect of the ResNet-GRU model is better compared with the other four models.
To further verify the effectiveness of the ResNet-GRU model, the root mean square error (RMSE), mean absolute error (MAE), and coefficient of determination (R2) were selected as evaluation metrics to assess the overall test results. The formulas are as follows:
RMSE = 1 N i = 1 N α t β t 2
MAE = 1 N i = 1 N α t β t
R 2 = 1 i = 1 N α t β t 2 i = 1 N β t β ¯ 2
where α(t) is the joint motion angle at a certain moment in the test results, β(t) is the actual value corresponding to the joint motion angle at that moment in the test results, β ¯ is the average value of the actual joint motion angles, and N is the number of samples in the total duration of the test results. The smaller the RMSE and MAE values, and the closer the R2 value is to 1, the better the model performance.
For the two motion conditions, level walking and stair climbing, the evaluation indicators of the five models, ResNet-GRU, Transformer-LSTM, CNN-GRU, ResNet, and GRU, are compared, as shown in Table 10 and Table 11 below.
From the above data, it can be seen that for the two movement conditions, the evaluation metrics of the ResNet-GRU model for hip and knee joint movement prediction are all superior to those of the other four models. Among them, the optimal evaluation metrics for level walking are 2.512 ± 0.415°, 1.863 ± 0.265°, and 0.979 ± 0.007, respectively, while the optimal evaluation metrics for stair climbing are 2.475 ± 0.442°, 2.012 ± 0.336°, and 0.98 ± 0.009, respectively.
For the level walking condition, compared with the other four models, for the evaluation indicators of predicting hip joint motion by the ResNet-GRU model, the RMSE values decreased by approximately 1.13–2.056°, the MAE value decreased by approximately 0.922–1.649°, and the R2 value increased by approximately 0.019–0.039. For the evaluation indicators of predicting knee joint motion, the RMSE values decreased by approximately 0.873–2.202°, the MAE value decreased by approximately 0.728–1.808°, and the R2 value increased by approximately 0.021–0.053.
For the stair climbing condition, compared with the other four models, for the evalua-tion indicators of predicting hip joint motion by the ResNet-GRU model, the RMSE values decreased by approximately 1.01–2.623°, the MAE values decreased by approximately 1.075–2.4°, and the R2 values decreased by approximately 0.022–0.066. For the evaluation indicators of knee joint motion prediction, the RMSE values decreased by approximately 0.976–3.529°, the MAE values decreased by approximately 0.913–2.913°, and the R2 values increased by approximately 0.015–0.065.
The results show that the ResNet-GRU model achieves higher prediction accuracy than the Transformer-LSTM, CNN-GRU, ResNet, and GRU models in the lower limb movement intention recognition task. Specifically, the ResNet-GRU model combines the advantages of ResNet and GRU and simultaneously possesses strong local feature extraction capability and temporal information capture capability. In contrast, the CNN-GRU, ResNet, and GRU models each have shortcomings in either feature extraction or temporal information capture. Although the Transformer-LSTM model incorporates the attention mechanism and temporal information capture capability, it is relatively sensitive to hyperparameter settings and data scale and is prone to problems such as unstable convergence and overfitting. In summary, the ResNet-GRU model can improve the prediction accuracy of lower limb joint movement angles.

6. Conclusions

Surface electromyography (sEMG) signals are physiological signals generated by the human body that are closely related to human movement and play an important role in motion intention recognition. To improve the recognition accuracy of human lower limb movement intention, this study first adopts the PO algorithm to determine the balance parameter α of the SVMD and combines wavelet thresholding to perform denoising on the collected lower limb muscle sEMG signals. Compared with the EMD, PEEMD, ICA, and WT denoising methods, this approach enhances the SNR and provides high-quality signal input for subsequent lower limb movement intention recognition. Next, the study combines the Residual Network (ResNet) with the Gated Recurrent Unit (GRU) to predict lower limb joint movement angles based on the processed sEMG signals. The results show that for the two movement conditions, the proposed ResNet-GRU model in this study exhibits smaller errors and higher prediction accuracy compared with the four models, namely Transformer-LSTM, CNN-GRU, ResNet, and GRU. This study implements improvements in two aspects: signal processing and prediction models, providing a new method for research on lower limb movement intention recognition.
This study still has certain limitations. The types of movement conditions studied are relatively single, the number of subjects and samples is limited, and transfer learning, cross-subject generalization verification, and inter-individual variability analysis have not yet been carried out. In the future, we will expand the scale of data collection and the types of movement conditions and explore transfer learning and generalization strategies to further improve the robustness and application potential of the model.

Author Contributions

Conceptualization, W.L. and M.W.; methodology, W.L.; software, M.W.; validation, M.W., W.L. and Z.J.; formal analysis, D.S.; investigation, Z.J.; resources, Z.Y.; data curation, M.W.; writing—original draft preparation, M.W.; writing—review and editing, W.L.; visualization, W.L. and M.W.; supervision, D.S.; project administration, W.L.; funding acquisition, Z.Y. All authors have read and agreed to the published version of the manuscript.

Funding

This research was funded by Jilin Provincial Department of Science and Technology, grant number 20250203177SF.

Data Availability Statement

The data presented in this study are available on request from the corresponding author. The data are not publicly available due to privacy.

Acknowledgments

The authors sincerely thank the editors and reviewers and the support of the Jilin Provincial Department of Science and Technology (20250203177SF).

Conflicts of Interest

Author Zhengwei Yue was employed by the Shandong Jite Industrial Technology Co., Ltd. The remaining authors declare that the research was conducted in the absence of any commercial or financial relationships that could be construed as a potential conflict of interest.

Abbreviations

The following abbreviations are used in this manuscript:
sEMGsurface electromyography
POParrot Optimization
SVMDSequential Variational Mode Decomposition
ResNetResidual Network
CNNconvolutional neural network
GRUGated Recurrent Unit
MAEmean absolute error
R2C4oefficient of determination

References

  1. Nanbancha, A.; Mawhinney, C.; Sinsurin, K. The effect of motor imagery and action observation in the rehabilitation of lower limb injuries: A scoping review. Clin. Rehabil. 2023, 37, 145–161. [Google Scholar] [CrossRef]
  2. Yang, J.; He, Y.; Shi, P.; Yu, H. A review on human intent understanding and compliance control strategies for lower limb ex-oskeletons. Proc. Inst. Mech. Eng. Part I J. Syst. Control Eng. 2022, 236, 1067–1086. [Google Scholar]
  3. Peng, Y.; Sakai, Y.; Nakagawa, K.; Funabora, Y.; Aoyama, T.; Yokoe, E.; Doki, S. Funabot-Suit: A bio-inspired and McKibben muscle-actuated suit for natural kinesthetic perception. Biomim. Intell. Robot. 2023, 3, 100127. [Google Scholar] [CrossRef]
  4. Wu, J.; Li, X.; Liu, W.; Wang, Z.J. sEMG signal processing methods: A review. J. Phys. Conf. Ser. 2019, 1237, 032008. [Google Scholar] [CrossRef]
  5. Laport, F.; Iglesia, D.; Dapena, A.; Castro, P.M.; Vazquez-Araujo, F.J. Proposals and comparisons from one-sensor EEG and EOG human-machine interfaces. Sensors 2021, 21, 2220. [Google Scholar] [CrossRef] [PubMed]
  6. Ouyang, C.; Cai, L.; Liu, B.; Zhang, T. An improved wavelet threshold denoising approach for surface electromyography signal. EURASIP J. Adv. Signal Process. 2023, 2023, 108. [Google Scholar] [CrossRef]
  7. Sun, Z.; Xi, X.; Yuan, C.; Yang, Y.; Hua, X. Surface electromyography signal denoising via EEMD and improved wavelet thresholds. Math. Biosci. Eng. 2020, 17, 6945–6962. [Google Scholar] [CrossRef]
  8. Ashraf, H.; Shafiq, U.; Sajjad, Q.; Waris, A.; Gilani, O.; Boutaayamou, M.; Khan, S. Variational mode decomposition for surface and intramuscular EMG signal denoising. Biomed. Signal Process. Control 2023, 82, 104560. [Google Scholar] [CrossRef]
  9. Rani, G.J.; Hashmi, M.F.; Muhammad, G. Variational Mode Decomposition and Empirical Wavelet Transform-Based Feature Extraction and Ensemble Classifier for Lower Limb Movement Prediction with Surface Electromyography Signal. IEEE Access 2024, 12, 55201–55217. [Google Scholar] [CrossRef]
  10. Zhao, H.; Qiu, Z.; Peng, D.; Wang, F.; Wang, Z.; Qiu, S.; Shi, X.; Chu, Q. Prediction of Joint Angles Based on Human Lower Limb Surface Electromyography. Sensors 2023, 23, 5404. [Google Scholar] [CrossRef]
  11. Li, C.X.; Li, M.T.; Huang, Z.Q.; Liu, M.; Mao, Y. Application of optimized variational mode decomposition for masseter surface electromyography classification. In Proceedings of the 2025 International Conference on Artificial Intelligence and Computational Intelligence (AICI 2025), Kuala, Malaysia, 14–16 February 2025. [Google Scholar]
  12. Li, C.; Deng, H.; Yin, S.; Wang, C.; Zhu, Y. sEMG signal filtering study using synchrosqueezing wavelet transform with differential evolution optimized threshold. Results Eng. 2023, 18, 101150. [Google Scholar] [CrossRef]
  13. Yang, R.; Deng, H.; Xu, W.; Wang, X.; Li, C. Multi-stream CNN-SVM hybrid model for gesture recognition based on sEMG signals. In Proceedings of the 2023 6th International Conference on Electronics Technology (ICET 2023), Guangzhou, China, 12–15 May 2023; pp. 1435–1440. [Google Scholar]
  14. Li, S.; Zhang, Y.; Tang, Y.; Li, W.; Sun, W.; Yu, H. Real-time sEMG pattern recognition of multiple-mode motions for artificial limbs based on CNN-RNN algorithm. Electronics 2023, 12, 2444. [Google Scholar] [CrossRef]
  15. Zhu, M.; Guan, X.; Li, Z. sEMG-based lower limb motion prediction using CNN-LSTM with improved PCA optimization algo-rithm. J. Bionic Eng. 2023, 20, 612–627. [Google Scholar] [CrossRef]
  16. Zaim, T.; Abdel-Hadi, S.; Mahmoud, R.; Khandakar, A.; Rakhtala, S.M.; Chowdhury, M.E.H. Machine Learning- and Deep Learning-Based Myoelectric Control System for Upper Limb Rehabilitation Utilizing EEG and EMG Signals: A Systematic Review. Bioengineering 2025, 12, 144. [Google Scholar] [CrossRef]
  17. Nazari, M.; Sakhaei, S.M. Successive variational mode decomposition. Signal Process. 2020, 174, 107610. [Google Scholar] [CrossRef]
  18. Dragomiretskiy, K.; Zosso, D. Variational Mode Decomposition. IEEE Trans. Signal Process. 2014, 62, 531–544. [Google Scholar] [CrossRef]
  19. Liu, L.; Wang, K.; Jiang, T.; Luo, S.; Xu, S. Research on off-axis integrated cavity output spectrum signal denoising based on CSGWO-SVMD-SVD method. Opt. Express 2024, 32, 33698–33715. [Google Scholar] [CrossRef]
  20. Lian, J.; Hui, G.; Ma, L.; Zhu, T.; Wu, X.; Heidari, A.A.; Chen, Y.; Chen, H. Parrot optimizer: Algorithm and applications to medical problems. Comput. Biol. Med. 2024, 172, 108064. [Google Scholar] [CrossRef]
  21. Koppolu, P.K.; Chemmangat, K. A Comparison of Different Signal Processing Techniques for Upper Limb Muscle Activity Onset Detection using Surface Electromyography. In Proceedings of the 2023 3rd International conference on Artificial Intelligence and Signal Processing (AISP), Vijayawada, India, 18–20 March 2023. [Google Scholar]
  22. Zhao, H.; Wang, Z.; Yang, Y.; Zhang, Z. FastICA-based noise reduction algorithm for surface electromyographic signals. In Proceedings of the 2024 4th International Conference on Neural Networks, Information and Communication Engineering (NNICE), Guangzhou, China, 19–21 January 2024. [Google Scholar]
  23. Vijayvargiya, A.; Khimraj; Kumar, R.; Dey, N. Voting-based 1D CNN model for human lower limb activity recognition using sEMG signal. Phys. Eng. Sci. Med. 2021, 44, 1297–1309. [Google Scholar] [CrossRef]
  24. Sun, J.; Wang, Y.; Hou, J.; Li, G.; Sun, B.; Lu, P. Deep Learning for Electromyographic Lower-Limb Motion Signal Classification Using Residual Learning. IEEE Trans. Neural Syst. Rehabil. Eng. 2024, 32, 2078–2086. [Google Scholar] [CrossRef] [PubMed]
  25. Zarzycki, K.; Ławryńczuk, M. Advanced predictive control for GRU and LSTM networks. Inf. Sci. 2022, 616, 229–254. [Google Scholar] [CrossRef]
  26. Latash, M.L. Human Movements: Synergies, Stability, and Agility. In Biomechanics of Anthropomorphic Systems; Springer: Cham, Switzerland, 2018; Volume 124, pp. 135–154. [Google Scholar]
  27. Lv, S.; Tao, C.; Zhai, Y.; Shi, W.; Hou, Z.; Ni, H.; Tan, L. Research on noise reduction of pressure pulsation signal of axial flow pump based on global optimization parrot algorithm improved variational mode decomposition. Phys. Fluids 2025, 37, 077185. [Google Scholar] [CrossRef]
  28. Zhang, Y.; Bai, Y.; Wen, Y.; Luo, X. Whale sound signal denoising based on SVMD and improved wavelet thresholding. Meas. Sci. Technol. 2024, 35, 095008. [Google Scholar] [CrossRef]
  29. Koppolu, P.K.; Chemmangat, K. Automatic selection of IMFs to denoise the sEMG signals using EMD. J. Electromyogr. Kinesiol. 2023, 73, 102834. [Google Scholar] [CrossRef]
  30. Zhu, M.; Guan, X.; Li, Z.; Gao, Y.; Zou, K.; Gao, X.; Wang, Z.; Li, H.; Cai, K. Prediction of knee trajectory based on surface electromyogram with independent component analysis combined with support vector regression. Int. J. Adv. Robot. Syst. 2022, 19, 17298806221119668. [Google Scholar] [CrossRef]
  31. Sharma, T.; Sharma, K.P.; Veer, K. Decomposition and evaluation of SEMG for hand prostheses control. Measurement 2021, 186, 110102. [Google Scholar] [CrossRef]
  32. De la Fuente, C.; Martinez-Valdes, E.; Priego-Quesada, J.I.; Weinstein, A.; Valencia, O.; Kunzler, M.R.; Alvarez-Ruf, J.; Carpes, F.P. Understanding the effect of window length and overlap for assessing sEMG in dynamic fatiguing contractions: A non-linear dimensionality reduction and clustering. J. Biomech. 2021, 125, 110598. [Google Scholar] [CrossRef] [PubMed]
  33. Zhang, C.; Liang, S. sEMG-based recognition of wrist-hand movements using a composite transformer-LSTM model. Rev. Sci. Instrum. 2025, 96, 085208. [Google Scholar] [CrossRef] [PubMed]
Figure 1. Prediction process of hip and knee joint motion angles based on PO-SVMD-ResNet-GRU.
Processes 13 03252 g001
Figure 2. Denoising process of sEMG signals based on PO-SVMD.
Processes 13 03252 g002
Figure 3. Structure of the residual block.
Processes 13 03252 g003
Figure 4. Structure of the GRU.
Processes 13 03252 g004
Figure 5. Structure of the ResNet-GRU model.
Processes 13 03252 g005
Figure 6. sEMG signal collection equipment.
Processes 13 03252 g006
Figure 7. Joint motion angle collection equipment.
Processes 13 03252 g007
Figure 8. Distribution of selected muscles.
Processes 13 03252 g008
Figure 9. Schematic diagram of electromyography sensor and angle sensor placement: (a) front view; (b) side view.
Processes 13 03252 g009
Figure 10. Collection process of sEMG signals and joint motion angles: (a) level walking; (b) stair climbing.
Processes 13 03252 g010
Figure 11. PO-SVMD decomposition of sEMG signals of the semitendinosus during level walking.
Processes 13 03252 g011
Figure 12. Original sEMG signal of the semitendinosus during level walking.
Processes 13 03252 g012
Figure 13. Denoised sEMG signal of the semitendinosus during level walking.
Processes 13 03252 g013
Figure 14. Absolute peak envelope of semitendinosus sEMG during level walking.
Processes 13 03252 g014
Figure 15. Collection principle of lower limb joint motion angles.
Processes 13 03252 g015
Figure 16. Motion angles of lower limb hip and knee joints during level walking.
Processes 13 03252 g016
Figure 17. Motion angles of lower limb hip and knee joints during stair climbing.
Processes 13 03252 g017
Figure 18. Loss rate variation curve of the ResNet-GRU model: (a) level walking; (b) stair climbing.
Processes 13 03252 g018
Figure 19. Comparison between the predicted results and actual values of hip joint motion angles for the five models during level walking.
Processes 13 03252 g019
Figure 20. Comparison between the predicted results and actual values of knee joint motion angles for the five models during level walking.
Processes 13 03252 g020
Figure 21. Comparison between the predicted results and actual values of hip joint motion angles for the five models during stair climbing.
Processes 13 03252 g021
Figure 22. Comparison between the predicted results and actual values of knee joint motion angles for the five models during stair climbing.
Processes 13 03252 g022
Table 1. Subject information.
SubjectGenderHeight/cmWeight/kgHealth Status
1Male17565Health
2Female16958Health
3Male17870Health
4Female16555Health
5Male17262Health
Table 2. Comprehensive evaluation indicators of each IMF component of sEMG signals of the semitendinosus during level walking decomposed by PO-SVMD.
IMF1IMF2IMF3IMF4IMF5
G0.04340.02700.02370.04650.0605
IMF6IMF7IMF8IMF9IMF10
G0.06490.07270.07380.05600.0427
Table 3. Signal-to-noise ratio (SNR/dB) of denoised signals from four muscles via different methods during level walking.
MusclePO-SVMD Combine with WTPEEMDEMDICAWT
Rectus Femoris19.5613.0212.3115.6913.36
Vastus Lateralis16.7514.3113.9211.3512.03
Semitendinosus18.2614.7812.1117.6515.62
Biceps Femoris19.4818.1316.4816.2913.58
Table 4. Signal-to-noise ratio (SNR/dB) of denoised signals from four muscles via different methods during stair climbing.
MusclePO-SVMD Combine with WTPEEMDEMDICAWT
Rectus Femoris23.4220.3618.6916.2820.68
Vastus Lateralis20.2516.0916.9417.269.63
Semitendinosus21.6917.5616.2811.6218.55
Biceps Femoris20.7618.2315.7414.0910.81
Table 5. MAE/° of prediction results on ResNet-GRU model pre-test set during level walking.
Number of Residual ModulesNumber of GRU ModulesHip JointKnee Joint
112.83423.3294
122.31562.5305
221.66421.9204
231.98652.1688
322.32452.3647
332.36892.4651
Table 6. MAE/° of prediction results on ResNet-GRU model pre-test set during stair climbing.
Number of Residual ModulesNumber of GRU ModulesHip JointKnee Joint
112.6423.234
122.26122.8622
221.94872.6324
231.92432.2624
322.02892.3351
332.1642.6135
Table 7. Parameters of ResNet and GRU modules for level walking.
StructureParametersOutput
Residual block 1(convolutional kernel size 10 × 1, number 128, BN, ReLU) × 1
(convolutional kernel size 10 × 1, number 64, BN, ReLU) × 1
4 × 1 × 64
Residual block 2(convolutional kernel size 10 × 1, number 128, BN, ReLU) × 1
(convolutional kernel size 10 × 1, number 64, BN, ReLU) × 1
4 × 1 × 64
GRU block 1128 hidden layer nodes, dropout rate 0.25128
GRU block 264 hidden layer nodes, dropout rate 0.2564
GRU block 332 hidden layer nodes, dropout rate 0.2532
Table 8. Parameters of ResNet and GRU modules for stair climbing.
StructureParametersOutput
Residual block 1(convolutional kernel size 10 × 1, number 128, BN, ReLU) × 1
(convolutional kernel size 10 × 1, number 64, BN, ReLU) × 1
4 × 1 × 64
Residual block 2(convolutional kernel size 10 × 1, number 128, BN, ReLU) × 1
(convolutional kernel size 10 × 1, number 64, BN, ReLU) × 1
4 × 1 × 64
GRU block 1128 hidden layer nodes, dropout rate 0.25128
GRU block 264 hidden layer nodes, dropout rate 0.2564
Table 9. General parameters of the ResNet-GRU model for two movement conditions.
StructureParametersOutput
Input layersEMG signal4 × 1 × 1
Initial convolutional layerconvolutional kernel size 10 × 1, number 644 × 1 × 64
Normalization layerBN4 × 1 × 64
Activation function layerReLU4 × 1 × 64
Pooling layeraverage pooling, pooling window stride 4, number 641 × 1 × 64
Unfolding layersequence unfolding1 × 1 × 64
Flattening layerflattening64
Fully connected layer64 weights, 2 biases2
Output layerhip and knee joint motion angle2
Table 10. Evaluation indicators of joint motion prediction by the five models during level walking (95% confidence interval).
ModelHip JointKnee Joint
RMSE/°MAE/°R2RMSE/°MAE/°R2
ResNet-GRU2.512 ± 0.4151.863 ± 0.2650.979 ± 0.0073.785 ± 0.3862.487 ± 0.3250.973 ± 0.006
Transformer-LSTM3.642 ± 0.4682.785 ± 0.3240.96 ± 0.0084.658 ± 0.4453.215 ± 0.3460.952 ± 0.007
CNN-GRU3.956 ± 0.4283.112 ± 0.2930.949 ± 0.015.587 ± 0.5063.612 ± 0.3250.931 ± 0.01
ResNet4.925 ± 0.5164.238 ± 0.3720.93 ± 0.0115.798 ± 0.6034.189 ± 0.4430.923 ± 0.013
GRU4.568 ± 0.5743.512 ± 0.4260.94 ± 0.015.987 ± 0.5624.295 ± 0.3950.92 ± 0.012
Table 11. Evaluation indicators of joint motion prediction by the five models during stair climbing (95% confidence interval).
ModelHip JointKnee Joint
RMSE/°MAE/°R2RMSE/°MAE/°R2
ResNet-GRU2.475 ± 0.4422.012 ± 0.3360.98 ± 0.0094.086 ± 0.4533.485 ± 0.4120.976 ± 0.008
Transformer-LSTM3.485 ± 0.5263.087 ± 0.3520.958 ± 0.0095.062 ± 0.5324.398 ± 0.4350.961 ± 0.008
CNN-GRU4.315 ± 0.4693.572 ± 0.3340.936 ± 0.0116.612 ± 0.6155.638 ± 0.4870.927 ± 0.011
ResNet5.126 ± 0.5744.258 ± 0.3980.911 ± 0.0127.852 ± 0.6746.598 ± 0.5430.908 ± 0.013
GRU5.098 ± 0.6234.412 ± 0.4650.914 ± 0.0117.615 ± 0.6526.398 ± 0.5740.911 ± 0.012
Disclaimer/Publisher’s Note: The statements, opinions and data contained in all publications are solely those of the individual author(s) and contributor(s) and not of MDPI and/or the editor(s). MDPI and/or the editor(s) disclaim responsibility for any injury to people or property resulting from any ideas, methods, instructions or products referred to in the content.