Abstract
As oil and gas exploration and development advance into deep and ultra-deep areas, kick accidents are becoming more frequent during drilling operations, posing a serious threat to construction safety. Traditional kick monitoring methods are limited in their multivariate coupling modeling. These models rely too heavily on single-feature weights, making them prone to misjudgment. Therefore, this paper proposes a drilling kick risk prediction method based on image modality. First, a sliding window mechanism is used to slice key drilling parameters in time series to extract multivariate data for continuous time periods. Second, data processing is performed to construct joint logging curve image samples. Then, classical CNN models such as VGG16 and ResNet are used to train and classify image samples; finally, the performance of the model on a number of indicators is evaluated and compared with different CNN and temporal neural network models. Finally, the model’s performance is evaluated across multiple metrics and compared with CNN and time series neural network models of different structures. Experimental results show that the image-based VGG16 model outperforms typical convolutional neural network models such as AlexNet, ResNet, and EfficientNet in overall performance, and significantly outperforms LSTM and GRU time series models in classification accuracy and comprehensive discriminative power. Compared to LSTM, the recall rate increased by 23.8% and the precision increased by 5.8%, demonstrating that its convolutional structure possesses stronger perception and discriminative capabilities in extracting local spatiotemporal features and recognizing patterns, enabling more accurate identification of kick risks. Furthermore, the pre-trained VGG16 model achieved an 8.69% improvement in accuracy compared to the custom VGG16 model, fully demonstrating the effectiveness and generalization advantages of transfer learning in small-sample engineering problems and providing feasibility support for model deployment and engineering applications.
1. Introduction
As global oil and gas development progresses toward deeper and ultra-deep formations, the downhole environment faces challenges such as high temperatures, high pressures, and complex formation conditions. The risk of spills has significantly increased, becoming a key challenge affecting the safety and efficiency of drilling operations. Failure to promptly identify and address spills can easily lead to serious accidents such as blowouts, lost circulation, and formation contamination, posing a significant threat to both operator safety and the environment.
Traditional drilling kick monitoring technology mainly relies on abnormal changes in physical parameters such as outlet flow, riser pressure, and drilling fluid volume in real-time logging data, and makes judgments by setting empirical thresholds or based on mathematical models. For example, Wu Faping et al. used ultrasonic liquid level sensors to monitor changes in drilling fluid outlet discharge and degasser liquid level conditions at the logging site, replacing traditional target flow sensors, achieving higher-precision flow monitoring and well control assurance [1]. Zhang Shiming et al. used on-site engineers to manually monitor changes in logging parameters at four locations: the drill bit, wellbore, wellhead, and mud pool, and comprehensively judged whether kick had occurred, effectively improving the accuracy of kick monitoring [2]. Wang Zhi constructed a pressure-controlled drilling kick monitoring system based on vertical pressure and casing pressure monitoring, effectively improving the accuracy and real-time performance of early warning [3].
Traditional kick monitoring methods mainly rely on experienced field engineers to make judgments by observing instrument readings and curve changes. They are highly subjective and easily affected by personal judgment, resulting in insufficient identification stability and accuracy. In addition, such methods often only react when anomalies are obvious, resulting in response lags, easily missing the optimal time for intervention, and increasing well control risks. In addition, traditional methods are mostly based on empirical rules for specific blocks or a small number of wells, lacking versatility and making it difficult to achieve effective migration and large-scale application under different geological conditions and working conditions. In the process of promotion in new blocks, it is often necessary to rely on manual judgment to make targeted adjustments to the original logic, which is not only inefficient, but also leads to frequent false alarms and missed reports.
With the rapid development of big data technology and the integration of cutting-edge technologies such as artificial intelligence, the Internet of Things, and information interaction, the field of oil and gas engineering is undergoing tremendous changes. Artificial intelligence technology is increasingly being used throughout the entire process of oil and gas development, covering multiple links such as geological modeling, reservoir prediction, drilling parameter optimization, equipment fault diagnosis, and production optimization [4,5,6,7,8]. Kick monitoring, as a classification problem involving multivariate time series characteristics, also has broad prospects for introducing artificial intelligence methods for intelligent identification and early warning [9,10,11,12,13,14,15,16,17,18,19,20,21,22,23,24,25,26,27,28,29,30,31,32,33,34,35]. At present, domestic and foreign scholars have conducted a lot of research on early warning and monitoring methods for kicks. For example, Liang et al. constructed a GA-BP kick diagnosis model based on riser and casing pressure monitoring data to improve the convergence speed and avoid getting trapped in local minima by integrating genetic algorithm into BP neural network [36]. Yang Xiangqian et al. proposed an early warning method for offshore drilling kicks based on PSO-LSSVM and Bayesian fusion, which achieved kick trend prediction and probability fusion through multi-model collaboration, effectively improving the warning accuracy and reducing the risk of false alarms [37]. Li Yufei et al. constructed a BP neural network (GA-BP) kick diagnosis model based on support vector machine posterior probability and D-S evidence. The integrated multi-parameter early kick monitoring method comprehensively utilizes the multi-source characteristics of the surface and underground, effectively improving the stability and field adaptability of kick identification, and solving the problem of conflicting results between multiple monitoring methods [38]. Sun Weifeng et al. proposed a kick- and well-leakage monitoring method that integrates drilling condition information and bidirectional gated cyclical unit (Bi-GRU), effectively eliminating the false alarm problem caused by pump start-stop conditions and improving the recognition accuracy [39]. Li Hui et al. proposed a kick-warning model based on relative entropy improved fuzzy C-means clustering, combined with the vertical pressure and casing pressure change trends, to achieve accurate and timely identification of early kick [40].
Existing kick monitoring technologies enable real-time processing and dynamic monitoring of multi-source data during drilling, significantly improving the timeliness of early warnings and the efficiency of emergency responses. Furthermore, by mining large amounts of historical data, they can identify potential evolutionary patterns, providing a data-driven scientific basis for quantitative assessment of kick risk. However, despite this progress, current approaches still have limitations. Specifically, most studies overlook complex coupling relationships and interdependent evolutionary mechanisms among multiple parameters during modeling. Under complex drilling conditions, different monitoring parameters often exhibit significant synergistic changes and dynamic interactions. Traditional artificial intelligence methods typically assign fixed weights to single variables, leading to the dominance of certain parameters in overall judgment due to their high weights. Slight fluctuations in these highly weighted parameters can easily be misclassified as anomalies by the model, resulting in false alarms. Conversely, even significant anomalies in low-weighted parameters may be overlooked. These limitations not only weaken the model’s ability to characterize cross-variable correlation patterns but also lead to reduced accuracy and generalization in the face of fluctuating operating conditions and noise interference, thus restricting the model’s reliability and robustness in practical engineering applications.
In recent years, with the rapid development of deep learning technology, convolutional neural networks (CNNs) have been widely used in industrial monitoring, medical diagnosis, anomaly detection, and other fields due to their powerful feature extraction capabilities in image recognition tasks [41,42,43,44,45,46,47]. Their multi-layer perception mechanism and local receptive field structure give them a natural advantage in processing unstructured image data, effectively extracting spatial patterns and local dependencies between multiple variables. To address the limitations of traditional artificial intelligence methods in feature modeling, CNNs, from the perspective of modality construction, transform multivariate time series data into a two-dimensional image format, setting the time dimension as the horizontal axis of the image and the variable dimension as the vertical axis. Each pixel reflects the value of the corresponding variable at that time point. By sliding the convolution kernel across the image, CNNs can simultaneously perceive the change patterns of multiple variables within a specific time window, explore their local spatial structure and temporal evolution characteristics, and achieve efficient perception and discrimination of abnormal behavior, providing a new technical path for the accurate identification of complex events such as kick.
Based on this, this study proposes a CNN-based kick risk identification method. This method converts time series data of key parameters during the drilling process (such as riser pressure, inlet and outlet flow rates, and pool volume) into image samples using a sliding window mechanism. These images are then fed into a CNN model for training and classification. This approach avoids directly modeling the time series for the following reasons: First, by converting multi-parameter time series into images, the temporal dependencies and coupling relationships between parameters can be represented as spatial structures, which facilitates the CNN’s exploration of local correlation patterns and hierarchical features. Second, CNNs inherently possess powerful spatial feature extraction capabilities, effectively capturing the coordinated changes and hidden interactions between multiple variables, avoiding the sensitivity imbalances associated with fixed weights in traditional methods. Furthermore, the image modality enhances robustness to noise, helps suppress false alarms caused by fluctuations in a single parameter, and improves the model’s discriminative stability and generalization capabilities under complex operating conditions. Therefore, the CNN-based image representation method provides a more suitable modeling approach for multivariate coupling analysis in kick risk monitoring.
2. Data Processing and Image Construction Methods
2.1. Data Source
The data used in this study comes from 79 wells in seven major oil fields in my country, covering complex geological zones such as Southwest China, North China, and Xinjiang. The data were collected in real time by a field logging system. The data included key monitoring variables such as standpipe pressure, inlet flow rate, outlet flow rate, total pool volume, and total hydrocarbon content. These parameters cover both kick and normal drilling conditions, providing a rich sample base and diverse operating characteristics for model construction.
2.2. Correlation Analysis
Feature optimization is an essential prerequisite for improving model predictive capabilities, mitigating overfitting, shortening training time, enhancing interpretability, and, to a certain extent, reducing the burden of data collection and storage. By rationally selecting the key variables that most significantly influence prediction results, we can not only effectively reduce model complexity while ensuring performance, but also further improve operational efficiency, providing strong support for building efficient and robust intelligent diagnostic systems.
During feature optimization, the Pearson correlation coefficient is often used as an evaluation metric to measure the degree of linear correlation between features and the target variable. The Pearson correlation coefficient is a classic statistical metric with a value ranging from −1 to 1. It measures the strength and direction of the linear relationship between two continuous variables: a value of 1 indicates a perfect positive correlation between the two variables; −1 indicates a perfect negative correlation; and 0 indicates no linear correlation between the two variables.
By calculating and analyzing the Pearson correlation coefficients between features and labels, we can effectively identify key variables with significant correlations with the predicted target and eliminate redundant or low-contribution feature variables. This process not only helps improve the generalization ability and prediction accuracy of the model, but also enhances the interpretability of the model, providing solid data support for building an accurate and efficient intelligent diagnosis system.
The calculation Formula of Pearson correlation coefficient is
where
: pearson correlation coefficient between variables X and Y;
: covariance of X and Y;
: standard deviations of X;
: standard deviations of Y.
By performing Pearson correlation coefficient analysis on each characterization parameter, a heat map as shown in Figure 1 is drawn to intuitively display the correlation relationship between variables. The depth of the color in the figure reflects the absolute value of the Pearson correlation coefficient: the darker the color, the stronger the linear correlation between the variables and the more significant the correlation. In the feature selection process, in order to improve the stability and generalization ability of the model, it is necessary to ensure the relative independence of the selected features as much as possible. To this end, for those features that are highly correlated with each other, one of them should be eliminated to reduce the impact of multicollinearity. For example, the Pearson correlation coefficient between the master cylinder stroke and the outlet flow rate is as high as 0.88, indicating that there is a strong linear correlation between the two. Therefore, in subsequent modeling, one of them should be retained and the other should be eliminated to optimize the feature set structure and avoid redundant information from interfering with the model performance.
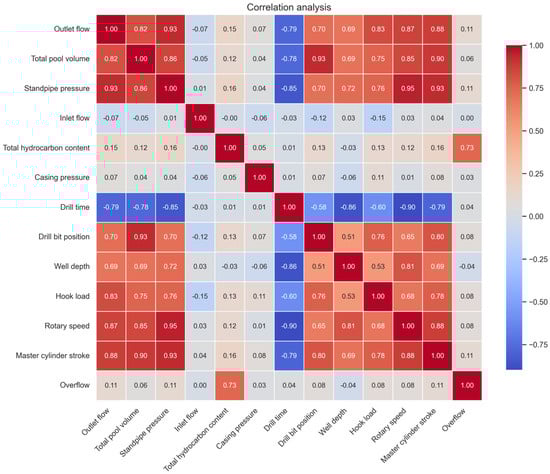
Figure 1.
Correlation Matrix Heat Map.
2.3. Feature Optimization
In our correlation analysis, we found no significant linear correlation between any single feature and kick events. However, given the stringent requirements of drilling sites for real-time model performance and practicality, this paper selected the following five key features as model inputs based on three dimensions: engineering observability, signal sensitivity, and physical mechanism interpretability: riser pressure, inlet flow rate, outlet flow rate, total pool volume, and total hydrocarbon content. This combination aims to balance computational efficiency with field reliability, resulting in more efficient and accurate kick identification. The following sections explain the rationale for each of these features and the reasons for excluding other common features.
Standpipe pressure is a key indirect indicator of bottomhole pressure dynamics. When a kick occurs, the drilling fluid column drops, reducing bottomhole pressure and, consequently, standpipe pressure. Although this parameter is less affected by circulating pressure loss, its changing trend is consistent with the physical process of kick, providing good engineering indicative value, and therefore was prioritized for inclusion.
Inlet and outlet flow rates are core parameters for monitoring drilling fluid circulation balance. When pumping conditions are stable, an abnormal increase in outlet flow rate can directly indicate formation fluid intrusion. These two parameters have the advantages of high sampling frequency and real-time performance, making them suitable for rapid response models, so they are retained.
The total pool volume can comprehensively reflect the changes in the total amount of drilling fluid. Especially under gas invasion conditions, the pool volume usually increases rapidly due to the gas expansion effect. This parameter has good signal sensitivity for various kick types and is therefore introduced as an important supplementary feature.
The total hydrocarbon content directly indicates the abnormal increase in gas components in the drilling fluid. It is highly specific to gas invasion kick and can be used as an effective auxiliary indicator for early warnings to make up for the lag of hydraulic parameters in gas response.
Other drilling parameters (such as rotary drilling rate, hook load, and casing pressure) were not included due to comprehensive considerations of measurement reliability, signal specificity, real-time requirements, and model complexity. The specific reasons are as follows:
First, these parameters are significantly affected by human manipulation and drilling process variations, resulting in a low signal-to-noise ratio. For example, while rotary table speed is somewhat related to downhole dynamics and wellbore stability, it is more susceptible to interference from the drill tool assembly, friction conditions, and the operator’s speed control strategy. The sources of its variation are complex, making it difficult to establish a stable, direct causal relationship with kick events. Similarly, hook load often fluctuates dramatically due to drill tool lowering speed, tripping conditions, or wellbore friction, while casing pressure is easily affected by circulation state switching, mud property fluctuations, and pump stroke adjustments. These external disturbances often cover up the subtle changes caused by kicks, thus increasing the false alarm rate and misjudgment risk in practical application.
Second, the measurement frequency and data stability of the above parameters often fail to meet the requirements of high-speed kick identification. Data such as riser pressure, flow rate, and pool volume are typically collected in real time by dedicated sensors with high sampling rates, while parameters such as rotary table drilling speed sometimes rely on indirect calculations or lower-frequency monitoring, resulting in significant data delays and interruptions, making it difficult to detect early signs of kick in a short period of time.
Furthermore, from a mechanistic perspective, parameters such as rotary drilling rate and hook load primarily reflect the state of mechanical drilling, and their physical connection to downhole fluid balance is relatively indirect. Their response to overflow is delayed and non-specific, unlike the rapid and intuitive response to fluid inflow phenomena such as outlet flow rate and total reservoir volume.
Finally, increasing the number of features directly increases model complexity and computational overhead. Introducing redundant or low-signal-to-noise-ratio features not only dilutes the contribution of valid signals but also increases the data processing and storage burden of field systems, impacting the efficiency of model deployment on edge devices. To ensure efficient and stable algorithm operation at the drilling site, this study adheres to the principle of feature concentration, retaining only core variables with clear physical meaning, reliable data quality, and sensitive responses.
2.4. Data Cleaning
Data cleaning is a key step in ensuring data quality and improving data analysis and modeling. It aims to reduce noise, remove outliers, and fill in missing information, thereby enhancing the data’s applicability and effectiveness in tasks like machine learning.
In this study, data cleaning primarily involves three aspects: outlier detection, missing value imputation, and data smoothing. The specific implementation of each step is as follows:
For outlier detection, the classic Three Sigma Rule was employed. This method, based on the assumption of a normal distribution, measures the degree of data dispersion using the mean and standard deviation. Specifically, when a data point deviates from the mean of its corresponding variable by more than three standard deviations, the data point is identified as an outlier and removed. This method is robust and practical when the data distribution is approximately normal.
For missing value handling, mean imputation was used to impute missing values. This method replaces missing entries in each variable with the mean of that variable. This method is suitable for numerical continuous variables and offers advantages such as ease of operation and high computational efficiency. However, it should be noted that it may introduce systematic bias in scenarios with missing values not completely at random (MNAR).
The Savitzky–Golay filter is used in the data smoothing process. This method achieves a smoothed estimate of the data by performing a polynomial fit on the raw data within a local sliding window. Compared with traditional moving average methods, the Savitzky–Golay filter not only has superior denoising capabilities but also better preserves the changing trends and edge features of the raw data, making it particularly suitable for signal processing and time series data analysis.
Take the data from well 1011 to well 222 as an example, as shown in Figure 2:
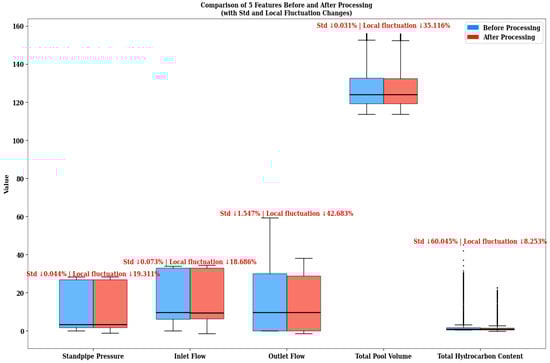
Figure 2.
Comparison results of data from well 1011 to well 222 before and after cleaning.
A comparative analysis of data characteristics reveals the following: First, during the outlier detection phase, the 3σ criterion was used to identify and eliminate statistically significant extreme points, effectively reducing the impact of noise on overall volatility indicators. For example, the standard deviation of the “total hydrocarbon” variable decreased by 60.04% after cleaning, significantly improving its volatility structure. This indicates that the original data contained numerous outliers that deviated from the mean, negatively impacting data stability. Second, during the data smoothing phase, a Savitzky–Golay filter was introduced, achieving a balance between trend preservation and noise suppression through local polynomial fitting, further improving data quality. After cleaning, the local fluctuation amplitudes of the “outlet flow rate” and “total pool volume” variables decreased by 42.68% and 35.12%, respectively. This demonstrates that this method effectively eliminates short-term, strong disturbance signals and improves the modelability and analytical robustness of time series data.
While the above data cleaning steps effectively improve data quality, each step is based on specific statistical assumptions and has corresponding limitations, which are explained here:
First, the 3σ criterion assumes that the data are approximately normally distributed. Under this assumption, it can effectively identify and remove extreme values at the tail of the distribution. However, this method is limited by its sensitivity to distributional form: if the data exhibit significant skewness or heavy tails, this criterion may result in significant false positives (such as mistakenly deleting normal data or misclassifying true tail values as outliers). Furthermore, as a univariate detection method, it cannot capture multivariate outliers formed by combinations of multiple features. To assess its applicability, a preliminary test of the distribution of key variables was conducted.
Second, mean imputation implicitly assumes that the data are missing completely at random (MCAR) or at random (MAR), meaning that the presence of missing values is unrelated to the magnitude of the data itself. Its main limitation is that if the missingness mechanism is non-random (MNAR), for example, high values are more likely to be missing, mean imputation will systematically underestimate the variance and volatility of the data and may introduce bias, distorting the original distribution characteristics of the variable. Given that the missing values in this study were primarily due to the removal of clear outliers and were relatively low, this assumption is considered to be met to a certain extent. However, caution is still warranted in interpreting the results.
Finally, during the data smoothing phase, the application of the Savitzky–Golay filter assumes that the true signal in the data is smooth and differentiable within a local window, enabling effective separation of noise and trend through polynomial fitting. Its limitations are related to the selection of key parameters (window size and polynomial order), which is essentially a trade-off between “noise suppression” and “signal fidelity.” Excessive smoothing can obliterate meaningful short-term fluctuations, while insufficient smoothing will fail to effectively remove noise.
In summary, the cleaning strategy used in this study was chosen after balancing the above assumptions and limitations. Evidence such as a 60.04% decrease in the standard deviation of “total hydrocarbons” after cleaning demonstrates that this process effectively achieved its stated goals of suppressing noise and improving data quality, laying a more reliable foundation for subsequent analysis.
2.5. Unified Time and Frequency
Because the dataset used in this study originates from 79 different wells, and the temporal frequencies used by sensors during data acquisition vary across each well, directly training the neural network model would result in inconsistent temporal features, impacting model performance. Furthermore, when converting the time series into images for input into the CNN, data with varying frequencies produces scale-distorted images, making it difficult for the model to discern consistent local patterns. Therefore, it is necessary to standardize the temporal frequency across the entire dataset to ensure data comparability and standardized training.
To achieve this consistency, this paper constructed an automated data standardization process. This process first uses a batch reading mechanism to identify the raw logging data from the 79 wells. Using a unified time parsing function, the time fields in each data file are normalized to a standard datetime format to ensure consistent time representation. The data is then preprocessed to remove records missing the “kick” label and set the time column as the index field, resulting in a clearly structured, time-focused series data framework.
To address the inconsistent data frequencies across wells, resampling techniques are used to standardize all data to a 1-s temporal resolution to ensure consistent temporal structure. For data with an original sampling frequency below 1 s, interpolation is performed to fill gaps within the time interval, maintaining data continuity and integrity.
Finally, the processed data is saved to a designated path, forming a dataset with a unified structure and consistent temporal frequency. This processing flow not only improves data quality but also lays a solid foundation for subsequent interwell data integration, time series data visualization, neural network model training, and time series feature extraction, ensuring the model can more stably and accurately learn kick risk characteristics.
2.6. Sample Balance
In anomaly detection tasks, imbalanced sample class distribution is a key issue that impacts model performance. This is particularly true in the drilling kick detection scenario, where kick events, as a minority class, occur far less frequently than normal operating conditions. Using raw data directly for training can easily bias the model, favoring outputs of the “normal” class, resulting in reduced anomaly detection capabilities and false positives or missed detections.
To address this issue, this paper introduces a data balancing strategy in the construction of a supervised learning model. Based on the accurately labeled start and duration of kick events, normal data with an equal duration, without kicks, is back-sampled as corresponding negative samples, constructing a training subset with an equal number of positive and negative samples.
This strategy enhances the model’s performance in minority class detection without introducing false data or artificial perturbations, improving the recall rate of kick event detection and the overall model robustness, providing a more balanced and reliable data foundation for subsequent prediction model training.
3. Mud Logging Data Visualization and CNN Modeling Method
To accurately identify multivariate conditions in imaged mud logging data, this study constructed a CNN-based classification model system, encompassing two technical approaches: custom structure construction and transfer learning integration. A standardized input strategy was employed to explore the model’s performance under different image composition methods, as shown in Figure 3. This study selected four representative architectures: AlexNet, VGG16, ResNet, and EfficientNet. A non-pretrained model and a transfer model based on ImageNet weights were designed, respectively, for systematic comparison and optimization.
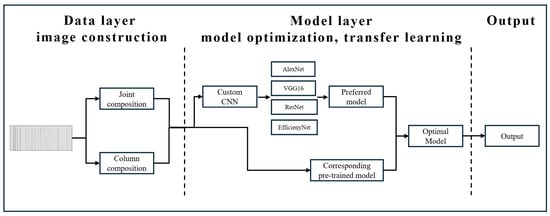
Figure 3.
Model design route.
3.1. Image Data Construction Strategy
To fully exploit the nonlinear coupling relationships and coevolutionary patterns among multivariate drilling monitoring parameters, this paper introduces a graphical modeling approach to map high-dimensional time series data into a two-dimensional image structure, effectively identifying complex kick conditions. This strategy balances the preservation of temporal structure with the enhancement of spatial correlations, forming the input foundation for the CNN model.
During the sample construction phase, the standardized multivariate time series data is sliced using a fixed-length sliding window, with a window length of 100 sampling points and a sliding step of 1 sampling point. Each window segment forms a 100 × 5-dimensional subsequence containing five key operating parameters: riser pressure, inlet flow rate, outlet flow rate, total pool volume, and total hydrocarbon content.
Subsequently, each window segment is mapped into a two-dimensional image using the following two mapping strategies:
Original value column plotting: Graphs are created using unnormalized physical values directly. Each variable is assigned a separate visual range and plotted with time as the horizontal axis and the raw value as the vertical axis, as shown in Figure 4. This method preserves the true magnitude differences in the variables, helping the model perceive sudden changes in parameter behavior on an absolute scale. It is particularly suitable for detecting amplitude anomalies in engineering scenarios.
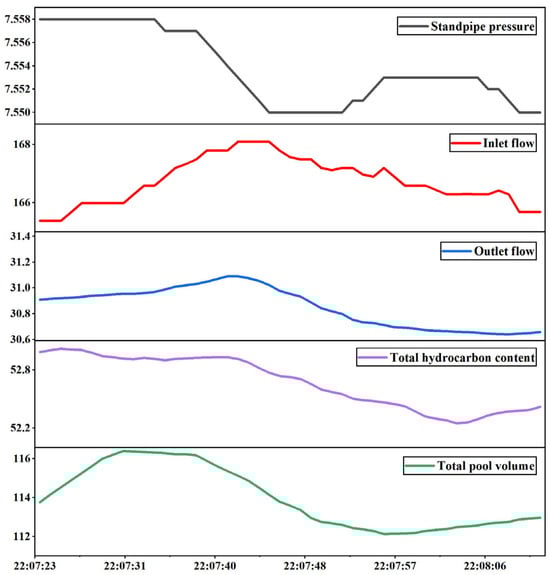
Figure 4.
Original value column composition.
Normalized Joint Mapping: All variables are uniformly Z-score normalized, the normalized results are mapped to the interval [0, 1], and the plots are overlaid on a unified coordinate system. Five normalized curves are distinguished by color and line type, as shown in Figure 5. This mapping method constructs a compact, uniformly scaled image space, which helps CNNs extract synchronous variation patterns and coupling relationships across variables within a local receptive field.
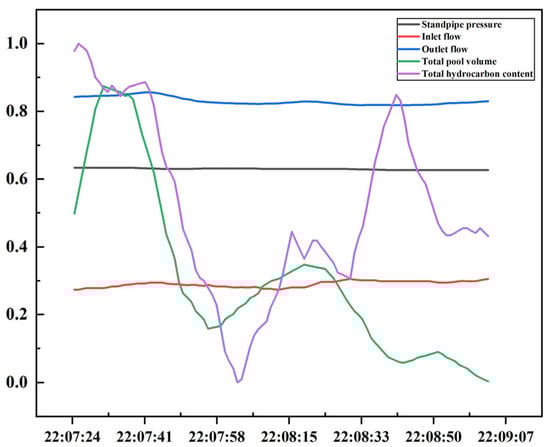
Figure 5.
Normalized joint composition.
In this normalized joint mapping method, the temporal dimension is strictly preserved through the order of the horizontal axis, while the spatial dimension is represented by the relative positions of multiple normalized variables within a unified coordinate system. The sliding convolution operation within the two-dimensional image space not only corresponds to the local dynamics of the time series but also captures the spatial coupling relationships between different variables. Therefore, this mapping method maintains temporal continuity while preserving spatial correlations across variables, thereby ensuring the effectiveness of CNN feature extraction.
After the image was constructed, the supervised image dataset was constructed by classifying the image samples into positive (kick) or negative (normal) classes based on whether the window contained a labeled kick event. All images were uniformly scaled to 224 × 224 pixels and saved in PNG format, adapting them to mainstream CNN models such as VGG and AlexNet. The resulting dataset exceeded 90,000 images, covering multiple wells and a variety of complex operating conditions, demonstrating both diversity and generalizability.
3.2. Introduction to CNN
Convolutional neural networks are deep learning models widely used in image recognition and feature extraction tasks. Their core mechanisms, such as local receptive field, weight sharing, and downsampling, give the model advantages of a small number of parameters, high training efficiency, and sensitivity to local spatial structure, enabling it to effectively identify key patterns and local changes in images [48]. Furthermore, CNNs have the ability to construct feature abstractions layer by layer, from low-level edge and texture information to high-level semantic structures, enabling comprehensive capture of multi-scale and multi-level image information [49].
3.2.1. AlexNet Model
AlexNet [50] is a landmark convolutional neural network in the field of deep learning. By introducing the ReLU activation function, local response normalization (LRN), and large receptive field convolution kernels, it has achieved breakthroughs in image feature extraction and training efficiency and has promoted the widespread application of deep CNNs. Considering the characteristics of mud logging curve images, which have simple textures but are sensitive to morphological changes, this study inherits the advantages of AlexNet’s multi-scale convolutional feature extraction, moderately trims the network depth and number of parameters, and introduces Dropout in the classifier to alleviate overfitting, as shown in Figure 6. This optimized structure can effectively capture the overall trend of the curve and local abnormal patterns, while maintaining good computational efficiency and generalization capabilities.
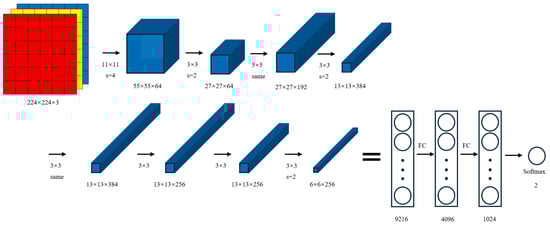
Figure 6.
AlexNet model.
3.2.2. VGG16 Model
VGG16 is a classic deep convolutional neural network proposed by the VGG team at the University of Oxford. It enhances nonlinear representation capabilities by stacking multiple 3 × 3 convolution kernels and ReLU activation functions and combines this with max pooling to gradually extract multi-level features. Classification is ultimately achieved through fully connected layers and softmax.
To adapt to the characteristics of mud logging data and improve kick identification performance, this study simplified the original network structure. Given that the large number of parameters in the full VGG16 model can easily lead to overfitting and computational overhead, this study retained its first three convolutional modules to extract basic features. The original classifier was replaced with a more compact three-layer fully connected structure, significantly reducing the number of parameters. A dropout mechanism was also introduced to enhance generalization, as shown in Figure 7. The improved model maintains its feature extraction capabilities while being more lightweight and efficient, making it more suitable for practical kick identification tasks.
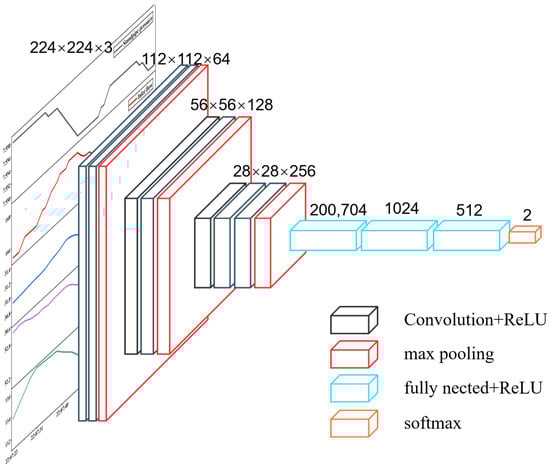
Figure 7.
VGG16 custom model.
3.2.3. ResNet Model
ResNet [51] is a deep convolutional neural network proposed by Microsoft Research. Its core solves the gradient vanishing and degradation problems of deep networks by introducing residual learning and shortcut connections, making it possible to train extremely deep networks.
In response to the needs of logging curve data and kick identification tasks, this study made targeted improvements to ResNet: a customized network depth and a lighter BasicBlock basic residual block were used to reduce model complexity and parameter count to prevent overfitting; the final output dimension was adjusted to 2 to directly adapt to the kick binary classification task; and Kaiming initialization and optional zero-initialization of the residual branch BN layer weights were applied to improve training stability and efficiency, as shown in Figure 8. While maintaining excellent feature extraction capabilities, the improved model significantly enhances adaptability and generalization performance for small-scale datasets, making it more suitable for actual kick identification applications.
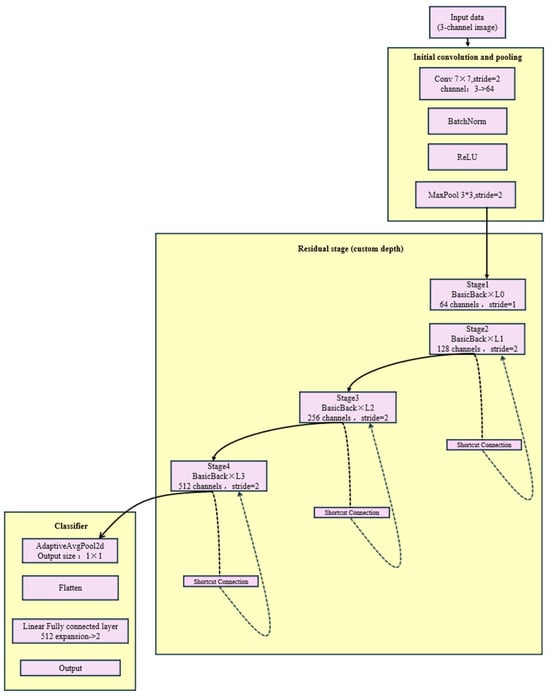
Figure 8.
ResNet custom model.
3.2.4. EfficientNet Model
EfficientNet [52] is an efficient convolutional neural network proposed by Google Research. Its core achieves excellent performance and parameter efficiency through a composite scaling method (simultaneously optimizing network depth, width, and resolution). The model uses the MBConv module (including depthwise separable convolution and Squeeze-Excite attention mechanism) and the Swish activation function, which significantly reduces the number of parameters while maintaining strong feature extraction capabilities.
To adapt to logging curve data and kick identification tasks, this study made targeted improvements based on the EfficientNet architecture: the network was constructed based on the basic configuration of EfficientNet-B0, and the model scale was flexibly adjusted through width coefficients and depth coefficients to cope with different data volumes and computing resource constraints; the final classifier output dimension was set to 2 to directly serve the kick binary classification task; and the Dropout layer was introduced in the head to enhance the model generalization ability and prevent overfitting, as shown in Figure 9. The improved model inherits the high parameter efficiency advantage of EfficientNet and further improves the adaptability and classification performance for logging data characteristics, making it more suitable for actual engineering application scenarios.
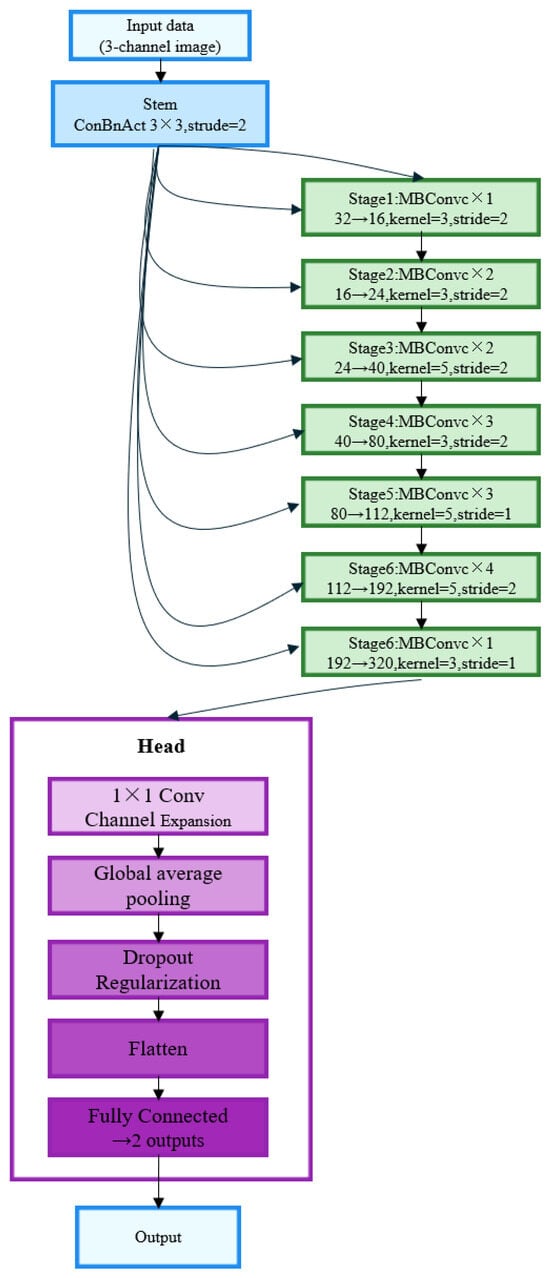
Figure 9.
EfficientNet custom model.
3.3. Pre-Trained Models
In the field of deep learning, pre-trained models have become an important model building method. The core idea is to first pre-train deep neural networks on large-scale standard datasets (such as ImageNet and COCO) to learn rich and versatile feature representations. This model is then transferred to specific downstream tasks for fine-tuning or feature extraction. This strategy not only significantly improves training efficiency but also effectively addresses issues such as overfitting and insufficient generalization in small sample sizes.
The main reason for using pre-trained models is that training complex models from scratch typically requires a large number of labeled samples and long computational resources, which are difficult to meet in many practical applications. Pre-trained models, however, are initially trained on high-quality datasets containing millions of images and already possess the ability to extract multi-scale features, from low-level edges and textures to high-level semantic structures. Therefore, for downstream tasks with limited data and moderate complexity, transferring pre-trained weights and making minor adjustments can achieve good performance in a relatively short period of time. In image classification, convolutional neural networks, such as VGG, ResNet, and DenseNet, have been widely used in various visual recognition tasks due to their outstanding performance on datasets such as ImageNet. These models not only extract key spatial structural information from images but also preserve global and local features at different levels, thereby enhancing classification and discrimination capabilities.
The drilling kick risk identification task studied in this paper is essentially a binary image classification problem with domain-specific characteristics. Through preliminary image processing, raw drilling parameters (such as outlet flow rate, riser pressure, and total pool volume) are converted into two-dimensional images containing multiple parameter curves. While these images contain certain temporal and trend information, their overall structure is relatively simple, unlike the complex textures and scenes found in natural images. Therefore, this task can be considered a low-complexity image classification problem.
In this context, the introduction of a pre-trained model offers significant advantages: on the one hand, its learned image structural features facilitate rapid adaptation to pattern recognition tasks within drilling curves; on the other hand, it avoids training instabilities caused by the limited sample size of this study. By carefully fine-tuning the pre-trained model, we can retain its general feature extraction capabilities while effectively incorporating the specific information of the kick images, thereby improving the robustness and classification accuracy of the overall model.
3.4. Model Generalization and Training Configuration
Although convolutional neural networks (CNNs) demonstrate excellent feature extraction capabilities in image recognition tasks, their deep architecture and large parameter count lead to significant overfitting risks when trained on the relatively limited dataset of drilling kick time series images used in this study. Overfitting causes the model to learn occasional noise and local patterns in the training data rather than key features that generalize to unseen conditions, thereby undermining its reliability and practicality in real-world drilling environments.
To effectively mitigate this issue, this study designed and implemented a systematic regularization and hyperparameter optimization strategy. First, dropout technology was introduced at the model architecture level, with a dropout rate set to 0.5 through cross-validation. This technique randomly masks the outputs of some neurons in the fully connected layers, weakening the complex co-adaptive relationships between neurons and forcing the network to learn more robust and distributed feature representations. Second, an early stopping strategy was employed during training. By monitoring the loss curve on the validation set, training was terminated early after the model performance peaked, preventing overfitting. At the same time, methods such as data augmentation and weight decay are combined to suppress overfitting from multiple perspectives at the data, algorithm, structure, and training levels, significantly improving the model’s generalization ability. Experimental results show that the regularization combination not only stabilizes the training process but also ensures the model’s performance on the test set and the smooth convergence of the loss curve.
In terms of hyperparameter optimization, this study determined the optimal parameter configuration through systematic experiments, and the results are shown in Table 1:

Table 1.
Hyperparameter optimization results.
To ensure fairness and reproducibility of experimental results, all experiments were conducted in a unified computing environment: Windows 11 64-bit, Python 3.12.9, and PyTorch 2.7.0. Training and testing were performed on a hardware platform equipped with an NVIDIA GeForce RTX 5070Ti GPU (12 GB of video memory) and an AMD Ryzen 9 8945HX processor. All models were trained and evaluated 30 times using the same hardware conditions and random seeds, and the average results were used as the final performance metric. This training configuration not only ensures the stability and statistical significance of the results but also provides solid technical support for the deployment of the models in real-world industrial scenarios.
4. Experimental Results and Analysis
4.1. Model Evaluation Metrics
When applying machine learning methods to real-world problems, evaluating model performance is crucial. This article focuses on the kick diagnosis task, which is essentially a binary classification problem within the anomaly detection context. To comprehensively evaluate the classification performance of the constructed model, this article introduces several commonly used evaluation metrics, including accuracy, precision, and recall, to reflect the model’s performance across different dimensions.
Considering the potential trade-off between precision and recall, the F1 score is further introduced as a comprehensive evaluation metric to more objectively measure the overall performance of the model. These metrics are calculated based on the confusion matrix. The confusion matrix, also known as the error matrix or probability matrix, is a tool used to display the prediction results of a classification model, providing a visual representation of the model’s classification performance across different categories. The specific definitions are shown in Table 2.
Table 2.
Composition of confusion matrix.
Table 2 details the definitions of each metric in the confusion matrix. TP (True Positives) represents the number of samples that the model successfully identified as positive (kick); FN (False Negatives) represents the number of positive samples that the model mistakenly classified as negative (non-kick); FP (False Positives) refers to samples that should have been negative but were incorrectly classified as positive; and TN (True Negatives) indicates that the model accurately identified negative samples. In binary classification problems, the detection performance of positive samples is typically of greater interest. In this study, kick events were identified as positive. Therefore, improving the model’s ability to discriminate positive (kick) samples is crucial for the accuracy and reliability of risk warning systems.
The accuracy rate indicates the ratio of all samples correctly judged by the model to the total number of samples. The calculation Formula is
Precision refers to the proportion of positive samples predicted by the model that are actually positive. This indicator reflects the reliability of the model in identifying positive samples. Its calculation Formula is
Recall is used to measure the proportion of positive samples successfully identified by the model among all actual positive samples, reflecting the model’s ability to identify positive samples. The calculation Formula is as follows:
The F1 score is the harmonic mean of precision and recall, taking into account the trade-off between the two. It is particularly suitable for situations where both false alarms and missed alarms need to be considered. Its calculation Formula is
4.2. Model Optimization Comparison
4.2.1. CNN Model Selection
In order to evaluate the performance of the constructed convolutional neural network model in the task of kick recognition in logging images, this paper conducts comparative analysis on the custom models AlexNet, VGG16, Reset, and EfficientNet on the test set, and introduces two classic machine learning methods, Random Forest and XGBoost, as base model references. All experiments are carried out under the same training set and test set division to ensure the fairness and comparability of the evaluation results. The results are shown in Table 3.
Table 3.
CNN model comparison results.
Based on a comprehensive analysis of experimental results, the VGG16 model demonstrated the best overall performance in the flood detection task. It ranked first in both accuracy (0.69) and F1 score (0.75), demonstrating its ability to effectively capture real flood samples and minimize the risk of false negatives. This outstanding performance is attributed to its deep network architecture and continuous small convolution kernel design, which enables the model to learn a richer and more nuanced hierarchy of image features, accurately identifying subtle pattern changes that characterize flooding within complex mud logging images. In comparison, AlexNet lags behind in all metrics due to its shallow network depth and limited feature abstraction capabilities. While ResNet, thanks to its residual connections, achieves a slight advantage in precision, it performs poorly in recall, indicating a lack of sensitivity to subtle features. EfficientNet sacrifices some discrimination accuracy in its trade-off between performance and efficiency. RandomForest achieves the highest recall, but its accuracy and precision are significantly lower, suggesting a tendency to misclassify a large number of negative samples as kicks, leading to a high false positive rate. Its high recall is partly due to biased classification strategies. Overall, VGG16 achieves optimal recall while maintaining high precision, which is crucial for safety-critical industrial applications like kick detection, making it the most reliable choice for this task.
4.2.2. Comparison Between CNN and Time Series Models
Most existing kick monitoring models focus on time series information modeling and often use recurrent neural networks such as LSTM and GRU to process the time series of drilling parameters. In order to further verify the effectiveness and advantages of the CNN model based on logging images proposed in this study in kick monitoring tasks, we constructed the original drilling parameters into a time series dataset under the same time window setting and trained and tested them based on two typical time series models, LSTM and GRU. Subsequently, we compared its performance with the VGG16 model under the image construction strategy adopted in this study. The results are shown in Table 4.
Table 4.
Comparison results between VGG16 and time series models.
Experimental results show that VGG16 outperforms two time series models (LSTM and GRU) in the kick detection task. VGG16 outperforms the time series models in all metrics. Its higher precision and recall demonstrate its superior coverage of kick samples while maintaining classification accuracy.
The core reason for VGG16’s superiority over time series models lies in its deep convolutional architecture, which enables multi-level feature extraction from imaged drilling curves. In the two-dimensional image representation, the spatial distribution and coupling relationships of drilling parameters are preserved, allowing VGG16 to simultaneously model the interaction patterns of multiple variables within the receptive field of the local convolution kernel. This advantage in modeling spatial structure enables it to more sensitively capture subtle fluctuations and complex coupling features in the curves before and after a kick, thereby improving overall discrimination capabilities.
In contrast, while LSTM and GRU, as typical time series models, have certain advantages in handling temporal dependencies, their feature extraction capabilities primarily rely on the time series patterns of a single variable or a small number of variables, and they are inadequate in modeling the spatial correlations between multidimensional parameters. In drilling scenarios, where multiple variables are tightly coupled, time series models often struggle to effectively capture cross-feature correlations, limiting their performance in complex pattern recognition. Furthermore, due to sample imbalance, LSTM and GRU models tend to favor majority class samples, sacrificing sensitivity to kick samples. This results in lower recall and F1-score performance than VGG16.
In summary, VGG16, leveraging its graphical feature representation and spatial modeling capabilities of deep convolutional layers, demonstrates stronger discriminative power and robustness in kick detection. Traditional time series models, however, perform relatively poorly overall due to their limited ability to model feature interactions and high sensitivity to sample distribution.
4.3. Comparison of Pre-Training Effects
Having selected VGG16 as the convolutional neural network architecture for this study, this paper further introduced a VGG16 model pre-trained on the ImageNet dataset to explore the impact of transfer learning strategies on model performance in a small sample size setting. By comparing the pre-trained model with a VGG16 model trained from scratch using the same data partitioning and experimental setup, we systematically evaluated the transfer effect of the pre-trained weights on the kick detection task and their impact on the model’s discriminative ability, convergence efficiency, and generalization capability. The relevant comparative results are shown in Table 5.
Table 5.
Comparison of pre-training effects.
In this study, by incorporating pre-trained weights from the ImageNet dataset, the VGG16 pre-trained model significantly outperformed a homogeneous model trained from scratch across multiple key performance metrics, demonstrating the significant advantages of pre-training in small sample sizes. Specifically, the pre-trained model leverages low-level visual features (such as edges, textures, and color distribution) and some mid-level semantic structures (such as geometric shapes and local structure) learned from large-scale natural image data early in training, providing a robust initialization weight foundation for feature extraction from mud logging images. These universal visual features exhibit strong transferability and generalization capabilities, effectively adapting to the unstructured image patterns presented by drilling parameters in mud logging images.
Furthermore, compared to models initialized from random weights, the pre-trained model exhibits faster convergence and greater stability during training, significantly reducing the risk of overfitting and improving the model’s discriminative and generalization capabilities. Given the limited number of mud logging image samples and the class imbalance, transfer learning not only improves the model’s final recognition performance but also effectively enhances training efficiency and robustness.
4.4. Optimal Comparison of Composition Methods
After completing the model optimization, the VGG16 (pre-trained) model was selected to further compare the impact of the two logging image composition methods on classification performance. The results are shown in Table 6.
Table 6.
Comparison results of composition methods.
Experimental results further validate the superiority of the normalized joint composition strategy for kick detection in mud logging images. The significant improvement in model diagnostic performance is attributed to the strong compatibility and complementarity between the image construction method and the convolutional neural network (CNN) architecture.
Specifically, the normalized joint composition method first normalizes multiple mud logging parameters, aligning all dimensional features within a uniform numerical range and preventing interference from varying dimensions and scales on image representation. All parameter curves are then densely arranged along the time axis within a single image matrix, forming a compact, highly information-integrated two-dimensional image. This design preserves the temporal synchronization and spatial contiguity between parameters in image space, enhancing the explicit representation of the underlying coupling structure between parameters and laying the foundation for subsequent model-based feature learning.
Building on this foundation, the CNN convolutional kernel mechanism can slide across the entire two-dimensional image, unconstrained by a single parameter or local region, and possesses the ability to mine joint features across parameters and time periods. Through layer-by-layer convolution and pooling operations, the network adaptively extracts multi-level information, from underlying texture changes to higher-order statistical patterns, significantly improving the model’s sensitivity, discriminability, and robustness to kick anomaly images. Furthermore, this composition method provides a high-density information representation, enabling the network to capture sufficient cross-dimensional interaction information even within a limited receptive field, helping to mitigate overfitting issues when kick samples are scarce, thereby improving overall generalization.
In contrast, the column-by-column composition method plots each parameter as a separate column of curves. While this visually separates the features of each parameter, facilitating manual analysis, it exhibits several limitations in convolutional feature extraction. Because CNN convolutional kernels are inherently locally connected perceptual mechanisms, the model tends to capture univariate variations within a column, making it difficult to establish effective connections between parameters across image gaps. This image organization weakens the expressiveness of cross-parameter correlations, limits the model’s learning of potential coupling patterns, and may even lead to the model mistakenly learning spurious correlations caused by curve proximity. This leads to poor robustness and generalization in the face of real-world mud logging data variability.
In summary, the normalized joint composition not only enhances the representation of spatial dependencies between parameters through design techniques such as unified scaling and dense arrangement, but also fully leverages the structural advantages of CNNs in image pattern recognition, enabling the model to effectively learn potential cross-dimensional coupling patterns in complex, high-dimensional data. This approach, while ensuring the physical authenticity of mud logging data, provides a more discriminative input format for deep convolutional networks, making it a key factor in improving the accuracy and robustness of kicking identification.
4.5. Practical Application of the Model and Feasibility Analysis
Take a typical kick well in the Xinjiang Oilfield as an example. This well contains 250 mud logging image samples, including 76 images of normal operating conditions and 174 images of kick conditions. The results, shown in Figure 10 and Figure 11, show that the VGG model issued a kick warning early in the initial phase, when the total pool volume only slightly increased. In comparison, while the LSTM model also issued a warning earlier, its lead time was not as significant as that of the VGG16 model. This demonstrates its strong sensitivity and discriminative ability in capturing early features of abnormal trends, demonstrating excellent risk perception performance.
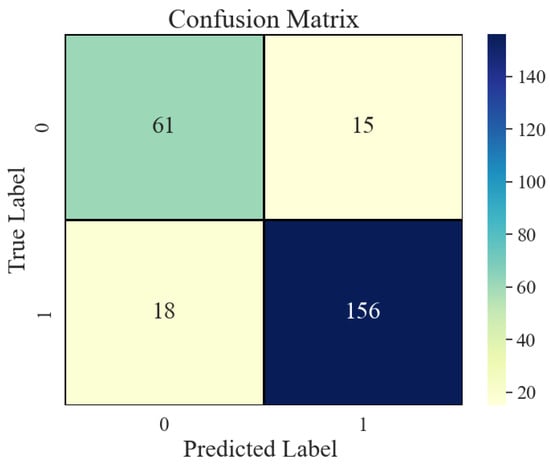
Figure 10.
Example Verification Confusion Matrix.
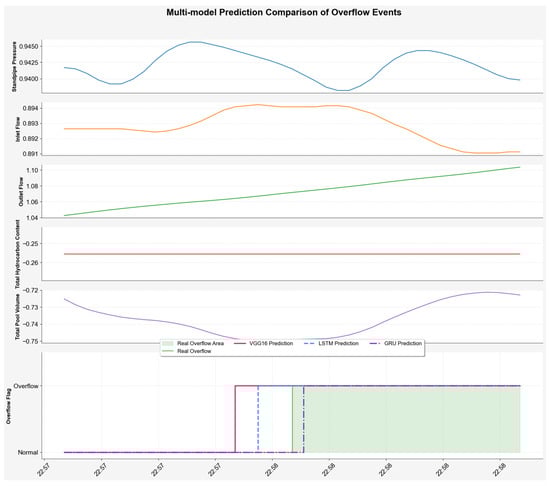
Figure 11.
Comparison of prediction results.
The pre-trained VGG16 model proposed in this article is lightweight, and its resource usage is well-suited to the capabilities of drilling site equipment. In terms of hardware compatibility, the model can be directly deployed on commonly used edge GPU devices at drilling sites (such as the NVIDIA Jetson AGX Orin and Huawei Atlas 200), eliminating the need for high-performance servers. Its graphics memory usage matches the typical configuration of edge devices, allowing for stable operation within limited on-site hardware resources and meeting the resource requirements of industrial-scale deployments.
In terms of processing efficiency, using actual data from a well as an example, the visualization phase for 1622 mud logging images took a total of 227.82 s, an average of 0.1405 s per image; data format conversion took a total of 27.85 s, an average of 0.0172 s per image; and the model prediction phase was even more efficient, taking only 5.8392 s, an average of 0.0036 s per image. The complete process of receiving and processing single-window data to outputting warning results takes approximately 0.16 s, far less than the 1-sec sampling interval. This fully meets the real-time warning requirements, eliminates the risk of data accumulation or delay, and effectively adapts to the engineering requirements of drilling operations for monitoring response speed.
5. Conclusions
To address the challenges of kicking identification and poor feature coupling during drilling operations, this paper proposes an intelligent recognition framework that integrates the graphical representation of multivariate mud logging parameters with a convolutional neural network (CNN) classification model. The framework systematically investigates the image construction strategy, network architecture design, transfer learning integration, and experimental evaluation. The main conclusions are as follows:
- The visualization strategy enhances multivariate coupling modeling capabilities, improves the spatial representation of inter-parameter linkage patterns, and structurally strengthens the uniformity of feature distribution, providing a stable data foundation for input adaptation and representation learning of deep models.
- VGG16, leveraging its deep convolutional architecture, achieves spatial modeling of multi-dimensional parameters within imaged drilling curves, effectively capturing subtle fluctuations and complex coupling features before and after a kick, significantly improving discrimination performance. In comparison, LSTM and GRU models lack the ability to model cross-feature correlations and identify minority samples, resulting in overall inferior performance to VGG16. In terms of precision, VGG16 achieves 0.69, an improvement of approximately 5.8% over LSTM, and a 23.8% improvement in recall, demonstrating its structural advantages in kick detection.
- The pre-trained VGG16 model exhibits significant advantages in structural depth and feature transfer capabilities. The pre-trained weights transferred from ImageNet contain a wealth of low-level, common image features, such as edges and textures, which help improve the model’s ability to perceive local patterns in mud logging images, resulting in superior performance across all architectures.
- In comparative experiments using different image input methods, the normalized joint image significantly improved across all metrics compared to the original data composition. This demonstrates that time series visualization at a unified scale is more suitable for the receptive field mechanism of convolutional models, enabling them to more fully capture potential spatial collaborations and edge anomalies between multiple variables, thereby enhancing the model’s discriminative ability and robustness.
Overall, this method theoretically verifies the effective modeling capability of CNN for image-based logging data and provides a feasible path for intelligent identification of kick risks in engineering. Subsequent research can introduce time series modeling and multimodal information fusion to further enhance the model’s dynamic perception and decision support capabilities. At the same time, with regard to the problem of data imbalance, although this paper has adopted a reverse sampling strategy for preliminary mitigation, there is still room for further optimization. Related research has shown that the introduction of synthetic minority class oversampling techniques (such as SMOTE) [53], focal loss functions, and cost-sensitive learning methods have significant advantages in dealing with imbalanced class distributions [54]. Therefore, future work will consider combining these advanced technologies to enhance the model’s robustness and generalization capabilities in identifying minority class samples.
Author Contributions
Conceptualization, W.L. and Z.Z.; methodology, Z.Z.; software, Z.Z.; validation, W.L., J.F. and Y.Z.; formal analysis, W.L.; investigation, Y.W.; resources, W.L., J.F. and Y.Z.; data curation, Y.W.; writing—original draft preparation, Y.W.; writing—review and editing, Y.W., Q.L. and T.P.; visualization, Y.W.; supervision, Y.W.; project administration, Z.Z.; funding acquisition, W.L. All authors have read and agreed to the published version of the manuscript.
Funding
This research received no external funding.
Data Availability Statement
The original contributions presented in the study are included in the article, further inquiries can be directed to the corresponding author. The data originated from actual logging data collected on-site at drilling locations. For further inquiries, please directly contact the author.
Conflicts of Interest
Authors Wei Liu, Jiasheng Fu and Yi Zou were employed by the company CNPC Engineering Technology R&D Company Limited Co., Ltd. The remaining authors declare that the research was conducted in the absence of any commercial or financial relationships that could be construed as a potential conflict of interest.
References
- Wu, F.; Li, X.; Yue, Y.; Gao, J.; Xiang, W. Discussion and Comparative Analysis of Two Methods for Measuring Drilling Fluid Flow-out Rate. Xinjiang Pet. Sci. Technol. 2016, 26, 15–25. [Google Scholar]
- Zhang, S.; Zhang, L.; Yue, J.; Chen, D.; He, Y.; Han, X.; Liu, X.; Li, D. Method of Forecasting Overflow with Comprehensive Mud Logging Parameters during Drilling. Mud Logging Eng. 2018, 29, 29–33, 109–110. [Google Scholar] [CrossRef]
- Wang, Z. Research and Design of Kick Monitoring and Early Warning System for Managed Pressure Drilling. Master’s Thesis, Southwest Petroleum University, Chengdu, China, 2018. [Google Scholar]
- Zhao, F.; Wang, H.; Chen, M.; Gao, B. Detecting Harmful Vibrations in the Drilling Industry through Time Series Classification. In Proceedings of the 2024 10th IEEE International Conference on Intelligent Data and Security (IDS), New York, NY, USA, 10 May 2024; pp. 70–74. [Google Scholar]
- Yang, X.; Zhang, Y.; Zhou, D.; Ji, Y.; Song, X.; Li, D.; Zhu, Z.; Wang, Z.; Liu, Z. Drilling Conditions Classification Based on Improved Stacking Ensemble Learning. Energies 2023, 16, 5747. [Google Scholar] [CrossRef]
- Sun, J.; Tang, K.; Ren, L.; Zhang, Y.; Zhang, Z. Intelligent Interpretation of Sandstone Reservoir Porosity Based on Data-Driven Methods. Processes 2025, 13, 2775. [Google Scholar] [CrossRef]
- Fan, H.; Wu, M.; Lai, X.; Du, S.; Lu, C.; Chen, L. Process Monitoring Based on Probabilistic Principal Component Analysis for Drilling Process. In Proceedings of the IECON 2021—47th Annual Conference of the IEEE Industrial Electronics Society, Toronto, ON, Canada, 13–16 October 2021; pp. 1–6. [Google Scholar]
- Jin, H.; Sun, X.; Peng, P.; Wang, Z. Research on Key Technologies for Intelligent Monitoring in Drilling and Extraction. In Proceedings of the 2024 4th International Conference on Robotics, Automation and Intelligent Control (ICRAIC), Changsha, China, 6 December 2024; pp. 212–217. [Google Scholar]
- Zhang, X.; Wang, Z.; Li, X.; Sun, R.; Yang, Z. Current Status of Overflow Monitoring and Early Warning Development Driven by Big Data. China Pet. Chem. Stand. Qual. 2022, 42, 124–125, 128. [Google Scholar]
- Shi, Y.; Hao, H.; Liu, R.; Deng, S.; Li, C.; Li, Q.; Liu, C. Drilling Overflow Diagnosis Based on the Fusion of Physical and Intelligent Algorithms. Processes 2025, 13, 577. [Google Scholar] [CrossRef]
- Wu, L.; Wang, X.; Zhang, Z.; Zhu, G.; Zhang, Q.; Dong, P.; Wang, J.; Zhu, Z. Intelligent Monitoring Model for Lost Circulation Based on Unsupervised Time Series Autoencoder. Processes 2024, 12, 1297. [Google Scholar] [CrossRef]
- Wu, L.; Zhou, D.; Li, G.; Gong, N.; Song, X.; Zhang, Q.; Yan, Z.; Pan, T.; Zhang, Z. Kick Risk Diagnosis Method Based on Ensemble Learning Models. Processes 2024, 12, 2704. [Google Scholar] [CrossRef]
- Duan, M.; Wei, Q.; Yang, G.; He, X.; Xue, Q.; Feng, Y. Research on Drilling Overflow Warning Method Based on Logging Data and LSTM. In Proceedings of the 2023 8th International Conference on Cloud Computing and Big Data Analytics (ICCCBDA), Chengdu, China, 26–28 April 2023; pp. 106–112. [Google Scholar]
- Liu, C. Research and Application of Overflow Monitoring and Intelligent Well Control System in Data-Driven Mode. Master’s Thesis, Xi’an Petroleum University, Xi’an, China, 2024. [Google Scholar]
- Su, Y. Research on Intelligent Identification of Overflow in Drilling Conditions Based on Multi-Parameter Fusion. Master’s Thesis, China University of Petroleum (East China), Qingdao, China, 2025. [Google Scholar]
- Chen, Q.; Huang, Z.; Kong, X.; He, H.; Xu, Z.; An, G. Study on Overflow Accident Monitoring Based on Synchronous Features of Multiple Well Logging Parameters. Appl. Math. Mech. 2025, 46, 241–253. [Google Scholar]
- Pang, M.; Li, Y.; Fu, J.; Hua, J.; Lu, S.; Ren, D. Trend Analysis of Early Overflow Monitoring Technology in Drilling Based on Patent Information. Saf. Health Environ. 2022, 22, 5–10. [Google Scholar]
- Zhou, D.; Zhu, Z.; Zhou, C.; Song, X.; Li, G.; Zhang, C.; Li, Q.; Li, S. Unsupervised Learning–Based Kick Risk Warning with Dynamic Thresholds and Knowledge Embedding. SPE J. 2025, 1–19. [Google Scholar] [CrossRef]
- Liu, W.; Liu, W.; Gu, J.; Ji, C.; Sui, G. Research on Interwell Connectivity of Oil Reservoirs Based on Kalman Filter and Artificial Neural Network. Pet. Geol. Recovery Effic. 2020, 27, 118–124. [Google Scholar]
- Wu, J.; Li, Z.; Sun, Y.; Cao, X. Neural Network-Based Prediction of Remaining Oil Distribution and Optimization of Injection-Production Parameters. Pet. Geol. Recovery Effic. 2020, 27, 85–93. [Google Scholar] [CrossRef]
- Ji, Y. Research on Intelligent Diagnosis Method of Downhole Overflow Leakage Risk Based on Drilling Big Data and Physical Mode. Master’s Thesis, China University of Petroleum, Beijing, China, 2023. [Google Scholar]
- Wang, Z.; Liu, X.; Tang, H.; Lv, Z.; Liu, Q. Study on Automatic Reservoir History Matching Based on ES-MDA Algorithm. Spec. Oil Gas Reserv. 2021, 28, 99–105. [Google Scholar] [CrossRef]
- Zhang, B.; Hu, X.; Liu, G.; Li, Y.; Sun, W.; Dai, Y. Simulation Modeling Method of Drilling Engineering Parameters for Early Overflow Monitoring. Mud Logging Eng. 2019, 30, 44–50, 147. [Google Scholar] [CrossRef]
- Li, X.; Zuo, X.; Gao, X.; Yue, Y. Intelligent Diagnosis Method for Kick Based on KPCA-SSELM. Pet. Geol. Recovery Effic. 2022, 29, 190–196. [Google Scholar] [CrossRef]
- Tang, T.; Ma, T.; Chen, P.; Zeng, X.; Sun, S. Study on Choke Pressure Difference Behavior of Down-Hole Micro-Flux Measuring Device. China Pet. Mach. 2019, 47, 1–6. [Google Scholar] [CrossRef]
- Xiao, H. Research and Application of Oil Drilling Flow Monitoring Based on Machine Learning. Master’s Thesis, Beijing University of Posts and Telecommunications, Beijing, China, 2021. [Google Scholar]
- Wang, J.; Li, J.; Liu, G.; Luo, X. Study on the Change Law of Annular Outlet Flow Rate in New-Type Dual-Gradient Drilling under Gas Cut Condition. Pet. Drill. Technol. 2020, 48, 43–49. [Google Scholar] [CrossRef]
- Guan, Z.; Li, X.; Wang, J.; Tan, J.; Hu, H.; Li, H.; Xi, D. Intelligent Real-Time Early Warning Model for Drilling Overflow Based on Gas Logging Data. World Pet. Ind. 2024, 31, 83–90. [Google Scholar] [CrossRef]
- Pang, M.; Lei, Y.; Lu, H.; Huang, Q.; He, S. Discussion on Methods of Reducing False Alarm Rate of Intelligent Early-Warning of Drilling Overflow. Technol. Superv. Pet. Ind. 2021, 37, 44–49. [Google Scholar]
- Wang, Y.; Hao, J.; Zhang, F.; Wei, Q.; Peng, Z.; Duan, M. Adaptive LSTM Early Warning Method for Kick Detection in Drilling. Control Theory Appl. 2022, 39, 441–448. [Google Scholar] [CrossRef]
- Yuan, J.; Fan, B.; Xin, X.; Geng, L.; Yin, Z.; Wang, Y. Real-Time Early Warning of Drilling Overflow Based on Naive Bayes Algorithm. Oil Drill. Prod. Technol. 2021, 43, 455–460. [Google Scholar] [CrossRef]
- Wang, J.; Li, Q.; Yin, H. Architecture of Intelligent Early Warning System for Complex Drilling Risks Based on Digital Twin Technology. Pet. Drill. Technol. 2024, 52, 154–162. [Google Scholar] [CrossRef]
- Yi, W.; Liu, W.; Fu, J.; He, L.; Han, X. An Improved Transformer Framework for Well-Overflow Early Detection via Self-Supervised Learning. Energies 2022, 15, 8799. [Google Scholar] [CrossRef]
- Guo, Z.; Feng, X.; Tian, D.; Zhang, Y.; Li, Y.; Zhang, C.; Xu, K. EKM Intelligent System and Its Application. Drill. Prod. Technol. 2020, 43, 132–134. [Google Scholar] [CrossRef]
- Fan, X.; Shuai, J.; Li, Z.; Zhou, Y.; Ma, T.; Zhao, P.; Lv, D. Research Status and Prospect on Early Kick Detection Technology of Oil and Gas Wells. Drill. Prod. Technol. 2020, 43, 23–26, 2. [Google Scholar] [CrossRef]
- Liang, H.; Zou, J.; Liang, W. An Early Intelligent Diagnosis Model for Drilling Overflow Based on GA–BP Algorithm. Clust. Comput. 2019, 22, 10649–10668. [Google Scholar] [CrossRef]
- Yang, X.; Zhang, P.; Wu, S.; Zhang, L.; Li, Z.; Feng, H. Early Prediction and Warning of Offshore Drilling Overflow Based on Data Model Collaboration. China Saf. Sci. J. 2024, 34, 93–100. [Google Scholar] [CrossRef]
- Li, Y.; Zhang, B.; Sun, W. Research on Intelligent Early Kick Identification Method Based on SVM and D-S Evidence Theory. Drill. Prod. Technol. 2020, 43, 27–30, 6. [Google Scholar] [CrossRef]
- Sun, W.; Liu, K.; Zhang, D.; Li, W.; Xu, L.; Dai, Y. A Kick and Lost Circulation Monitoring Method Combining Bi-GRU and Drilling Conditions. Pet. Drill. Technol. 2023, 51, 37–44. [Google Scholar] [CrossRef]
- Li, H.; Man, Y.; Sun, P. Research on Kick Warning Based on Relative Entropy Improved Fuzzy C-Mean Clustering. Drill. Prod. Technol. 2023, 46, 165–170. [Google Scholar] [CrossRef]
- Long, M.; Ouyang, C.; Liu, H.; Fu, Q. Image Recognition of Camellia Oleifera Diseases Based on Convolutional Neural Network & Transfer Learning. Trans. Chin. Soc. Agric. Eng. 2018, 34, 194–201. [Google Scholar] [CrossRef]
- Xu, J.; Shao, M.; Wang, Y.; Han, W. Recognition of Corn Leaf Spot and Rust Based on Transfer Learning with Convolutional Neural Network. Trans. Chin. Soc. Agric. Mach. 2020, 51, 230–236, 253. [Google Scholar] [CrossRef]
- Chen, J.; Wang, Y.; Pan, Z. Fine-Grained Image Recognition Based on Interventional Attention. J. Univ. Shanghai Sci. Technol. 2025, 47, 209–219. [Google Scholar] [CrossRef]
- Wang, Y.; Yang, H.; Gou, H.; Hua, H.; Xu, Z. Intelligent Fatigue Crack Identification Methods for Orthotropic Steel Bridge Deck Based on Deep Learning. Bridge Constr. 2024, 54, 68–74. [Google Scholar] [CrossRef]
- Yan, Z.; Wang, H.; Geng, Y. Coal-Rock Interface Image Recognition Method Based on Improved DeeplabV3+and Transfer Learning. Coal Sci. Technol. 2023, 51, 429–439. [Google Scholar] [CrossRef]
- Oyedeji, O.A.; Khan, S.; Erkoyuncu, J.A. Application of CNN for Multiple Phase Corrosion Identification and Region Detection. Appl. Soft Comput. 2024, 164, 112008. [Google Scholar] [CrossRef]
- Sapkota, R.; Ahmed, D.; Karkee, M. Comparing YOLOv8 and Mask R-CNN for Instance Segmentation in Complex Orchard Environments. Artif. Intell. Agric. 2024, 13, 84–99. [Google Scholar] [CrossRef]
- LeCun, Y.; Bottou, L.; Bengio, Y.; Haffner, P. Gradient-Based Learning Applied to Document Recognition. Proc. IEEE 2002, 86, 2278–2324. [Google Scholar] [CrossRef]
- Simonyan, K.; Zisserman, A. Very Deep Convolutional Networks for Large-Scale Image Recognition. arXiv 2015, arXiv:1409.1556. [Google Scholar] [CrossRef]
- Krizhevsky, A.; Sutskever, I.; Hinton, G.E. ImageNet Classification with Deep Convolutional Neural Networks. Commun. ACM 2017, 60, 84–90. [Google Scholar] [CrossRef]
- He, K.; Zhang, X.; Ren, S.; Sun, J. Deep Residual Learning for Image Recognition. In Proceedings of the IEEE Conference on Computer Vision and Pattern Recognition (CVPR), Boston, MA, USA, 27–30 June 2015. [Google Scholar]
- Tan, M.; Le, Q.V. EfficientNet: Rethinking Model Scaling for Convolutional Neural Networks. In Proceedings of the 36th International Conference on Machine Learning, Virtual Event, 13–18 July 2020. [Google Scholar]
- Amirruddin, A.D.; Muharam, F.M.; Ismail, M.H.; Tan, N.P.; Ismail, M.F. Synthetic Minority Over-Sampling TEchnique (SMOTE) and Logistic Model Tree (LMT)-Adaptive Boosting Algorithms for Classifying Imbalanced Datasets of Nutrient and Chlorophyll Sufficiency Levels of Oil Palm (Elaeis guineensis) Using Spectroradiometers and Unmanned Aerial Vehicles. Comput. Electron. Agric. 2022, 193, 106646. [Google Scholar] [CrossRef]
- Korkmaz, A.; Bulut, S.; Talan, T.; Kosunalp, S.; Iliev, T. Enhancing Firewall Packet Classification through Artificial Neural Networks and Synthetic Minority Over-Sampling Technique: An Innovative Approach with Evaluative Comparison. Appl. Sci. 2024, 14, 7426. [Google Scholar] [CrossRef]
Disclaimer/Publisher’s Note: The statements, opinions and data contained in all publications are solely those of the individual author(s) and contributor(s) and not of MDPI and/or the editor(s). MDPI and/or the editor(s) disclaim responsibility for any injury to people or property resulting from any ideas, methods, instructions or products referred to in the content. |
© 2025 by the authors. Licensee MDPI, Basel, Switzerland. This article is an open access article distributed under the terms and conditions of the Creative Commons Attribution (CC BY) license (https://creativecommons.org/licenses/by/4.0/).