Article

Numerical Study of 3D Heat Transfer in Heat Sinks with Circular Profile Fins Using CFD

by
Fernando Toapanta-Ramos
1,*,
Mayra Guashco Rubio
1,
Fernando Ortega-Loza
2,3 and
William Diaz
1
1
Mechanical Engineering, Research Group in Engineering, Productivity and Industrial Simulation (GIIPSI), Master’s Program in Mechanical Engineering, Universidad Politécnica Salesiana, Quito 170702, Ecuador
2
Department of Energy and Mechanical Sciences, Universidad de las Fuerzas Armadas ESPE, Sangolquí 171103, Ecuador
3
Faculty of Engineering in Applied Sciences FICA, Universidad Técnica del Norte (UTN), Ibarra 100101, Ecuador
*
Author to whom correspondence should be addressed.
Processes 2025, 13(10), 3199; https://doi.org/10.3390/pr13103199
Submission received: 3 September 2025 / Revised: 26 September 2025 / Accepted: 27 September 2025 / Published: 9 October 2025
(This article belongs to the Special Issue Numerical Simulation of Flow and Heat Transfer Processes)

Abstract

A 3D numerical study using computational fluid dynamics simulations is carried out on a heat sink with circular fins. These devices are used to reject heat on motherboards and graphics cards. The software used in this investigation was ANSYS Fluent-CFD, with energy- and momentum-conservation models, as well as two-equation κ ϵ turbulence models. Three temperatures are set at the base of the heat sink: 80 °C, 90 °C, and 100 °C; as well as three air velocities for cooling: 10 m/s, 15 m/s, and 20 m/s. The analysis determined that the temperature at the fins depends on the length of time the heat sink is exposed to high temperatures. Furthermore, the temperature in the center of the heat sink is lower than at the edges. On the other hand, the analysis times with periods of 2 s, 5 s, and 10 s, this variable being the most fluctuating since significant changes in the temperature of the fins and the surrounding air are observed; increases are determined ranging from 7.96% for the shortest time of exposure to forced convective air, up to 54.55%, for the longest heat-transfer time. However, in the simulations it was observed that from the eighth second the heat transfer stabilizes.
Keywords:
heat sink; fins; circular; CFD

1. Introduction

In recent years, the use of more efficient computer systems has been achieved. However, these systems generate a lot of heat, making it essential to evacuate all this heat to prevent failures in the main systems. Heat sinks are the most commonly used alternative; however, their shape, size, geometry, and material are of significant importance. Modifications to the surface of heat sinks can be made to improve heat transfer [1,2,3]. Heat sinks are primarily manufactured using die casting, extrusion, and forging. Extrusion and forging are suitable for manufacturing simple heat sink shapes using only wrought aluminum alloys. However, complex shapes require die casting or machining [4,5,6]. The optimized heat sinks can better balance heat dissipation and energy consumption, which can be applied to heat dissipation of high-power equipment in high-tech fields, e.g., power batteries and energy-conversion systems [7], and electronics cooling and energy storage [8] to improve the cost-effectiveness of liquid cooling systems.
The distribution of pin-fins has only a little impact on temperature and pressure drop. However, the trend shows that cooling plates with a uniform distribution of pin-fins have lower maximum temperatures and pressure drop, indicating better heat-dissipation capability and power consumption. Therefore, pin-fin positions should be evenly arranged within the cooling plate [9]. Nilpueng et al. [10] present new experimental data on the influence of fin curvature offset, air velocity, and heat sink surface temperature on the heat-transfer coefficient. The latter improves with increasing Reynolds number and phase offset. Increasing the phase offset at the walls of sinusoidal wave fins increases the heat-transfer coefficient by 6.8% to 30.7%, compared to a phase offset of 0°.
Plate-fin geometries demonstrated superior thermal dissipation compared to circular-fin designs, due to their larger surface area and linear configurations, which enhanced heat transfer through convection and radiation. Thinner fins with 2 mm thickness improved heat transfer to the ambient by optimizing the fluid-flow channels and increasing the effective heat-transfer surface area [11]. In the work conducted by Li et al. [12], they studied curved heat sinks. They found that the radius of the curvature aggravates the uneven temperature distribution because the fluid deflects toward the walls of the heat sink. Similarly, Kahbandeh et al. [13] detailed in their research with curved channels how vortex effects at the inlet and outlet improve the thermal performance of heat sinks compared to straight channels. This represents a 10% reduction in thermal resistance, thus improving heat transfer.
The research conducted by Chatterjee et al. [14] is based on heat transfer in spiral microchannels. They indicate that curved channels better contribute to the movement of the working fluid. This is because they manage to reduce the temperature along the curved direction. This behavior is driven by the merging and splitting of vortices along the flow direction. Similarly, Narendran et al. [15] in their curved heat sink design argue that fluid disturbance is essential to contribute to temperature reduction.
Singh et al. [16] conducted a study to determine the optimal air inlet velocity to the heat sink, setting a constant temperature of 50 °C. They found that heat flux is the leading cause of electronic device failures. They believe that the air inlet velocity should be increased and the temperature of this fluid should be taken into account, since as the air temperature increases, the electronic device’s temperature also increases, and therefore, it will begin to fail.
Increased heat flux leads to higher convective heat-transfer coefficient and Nusselt number and lower pressure drop. It also reduces the base temperature uniformity of the heat sink. However, increased fin height increases the Nusselt number due to the increase in the effective surface area of heat transfer and also increases the pressure drop due to the blockage in the flow direction. Improved heat transfer leads to a decrease in the non-uniformity and maximum temperature of the base of the heat sink [17]. In disk-shaped pinfin heat sinks, increasing the number of disks reduced the Nusselt number, friction coefficient, and thermal performance coefficient. This reduction was due to decreased flow turbulence caused by a smaller cross-sectional area perpendicular to the flow direction [18]. Mohsen and Hamza [19] used numerical simulation with CFD software COMSOL 5.6 to improve the thermal performance of heat sinks. They also suggested circular and circular-cut fins as new designs, as well as other more conventional geometries. They obtained results indicating that circular and circular-cut fins have the best thermal performance, superior to the other fins. Furthermore, the heat-transfer coefficient and Nusselt number increase with increasing Reynolds number in all cases.
In their numerical simulation study, Ozkan & Yildirim [20] establish that to improve the performance of the system’s fins, many modifications have been made, such as creating perforated pins and increasing the surface area. The results indicate that straight perforated heat sinks provide a baseline for heat-transfer performance. When the inclination angle is increased to θ = 45 ° , the Nusselt number shows an improvement of 5–6%, demonstrating enhanced heat dissipation. Gupta et al. [21] agree that circular perforation produces the best system performance compared to all types of perforated shapes considered as it shows a higher Nu and a lower pressure drop due to having a high value of hydraulic diameter. Jasim et al. [22] in their numerical study with ANSYS Fluent increase the air speed from 0.5 m/s to 1.5 m/s, reducing the surface temperature by 7.71 °C in the numerical part and 7.84 °C in the experimental part. Djebara et al. [23] perform an extensive numerical simulation to analyze four heat sink schemes with varying fin number and geometry. Their study evaluates heat sink efficiency at inlet velocities ranging from 0.3 m/s to 1 m/s. They determined that, for an inlet velocity of 1 m/s, this alternative achieves superior performance in the folded mini-channel heat sink (Case D), reducing the total thermal resistance (0.206 K/W) compared to the other three heat sink types, whose thermal resistances were 0.361, 0.357, and 0.256 K/W, respectively.
As noted, heat sinks are very useful in various systems, both for cooling and refrigeration. In computer systems, heat sinks are essential; they vary according to their size and shape. The space in which they are located is limited, so the shape of the heat sinks is one of the most important variables in analyzing heat transfer when using these devices. Many research projects have been conducted on heat sinks; however, very few implement curved surfaces or curved profiles. This research focuses on a numerical study using CFD with ANSYS Fluent software. The heat sink has curved fins and four curved spaces between the fins. The temperature at the base of the heat sink is set to three temperature ranges: 80 °C, 90 °C, and 100 °C. The velocity of entry into the heat sink is also modified, with three different velocities: 10 m/s, 15 m/s, and 20 m/s. This type of analysis is important since electronic devices depend on the amount of heat that can be removed, thereby maintaining or reducing the internal temperature of these devices.

2. Materials and Methods

Heat transfer through extended surfaces has been a method for improving heat dissipation from hot spaces, such as video cards and processors. Curved surfaces dissipate heat more quickly. However, a free space for air to circulate is required.
The simulations performed in this study were carried out in a Computational Fluid Dynamics (CFD) environment using the commercial software ANSYS-Fluent. Turbulent air flow was solved using the governing equations, in addition to other fluid dynamics equations.
The heat sink is made of aluminum, which is used due to its low density. This is beneficial because it allows for longer fins without exceeding the total weight of the heat sink. Its medium-high thermal conductivity distributes heat better, reducing the time variation required to dissipate heat [24]. Table 1 shows the thermal and physical properties of the material used for the heat sink as well as the one for the air intake temperature; this is 15 °C.

2.1. Geometry and Meshing

The analyzed heat sink has extended fins; however, its peculiarity lies in the fact that the pattern is circular and divided into four parts. Each part has 10 fins; however, the two end fins have a different height: the first 8 are 45 mm, the ninth fin is 35 mm, and the tenth fin is 25 mm high. On the other hand, the versatility of the curved fins lies in their larger surface area than that of flat plates. Figure 1 shows the heat sink in this analysis.
In Fluent simulations, there are three boundary conditions, which are detailed as follows: the first is the surrounding air, the heat sink, and the hot wall below the flat surface. For airflow, there are three velocities: 10 m/s, 15 m/s, and 20 m/s. These velocities result in turbulent flow, as well as three hot wall temperatures: 80 °C, 90 °C, and 100 °C.
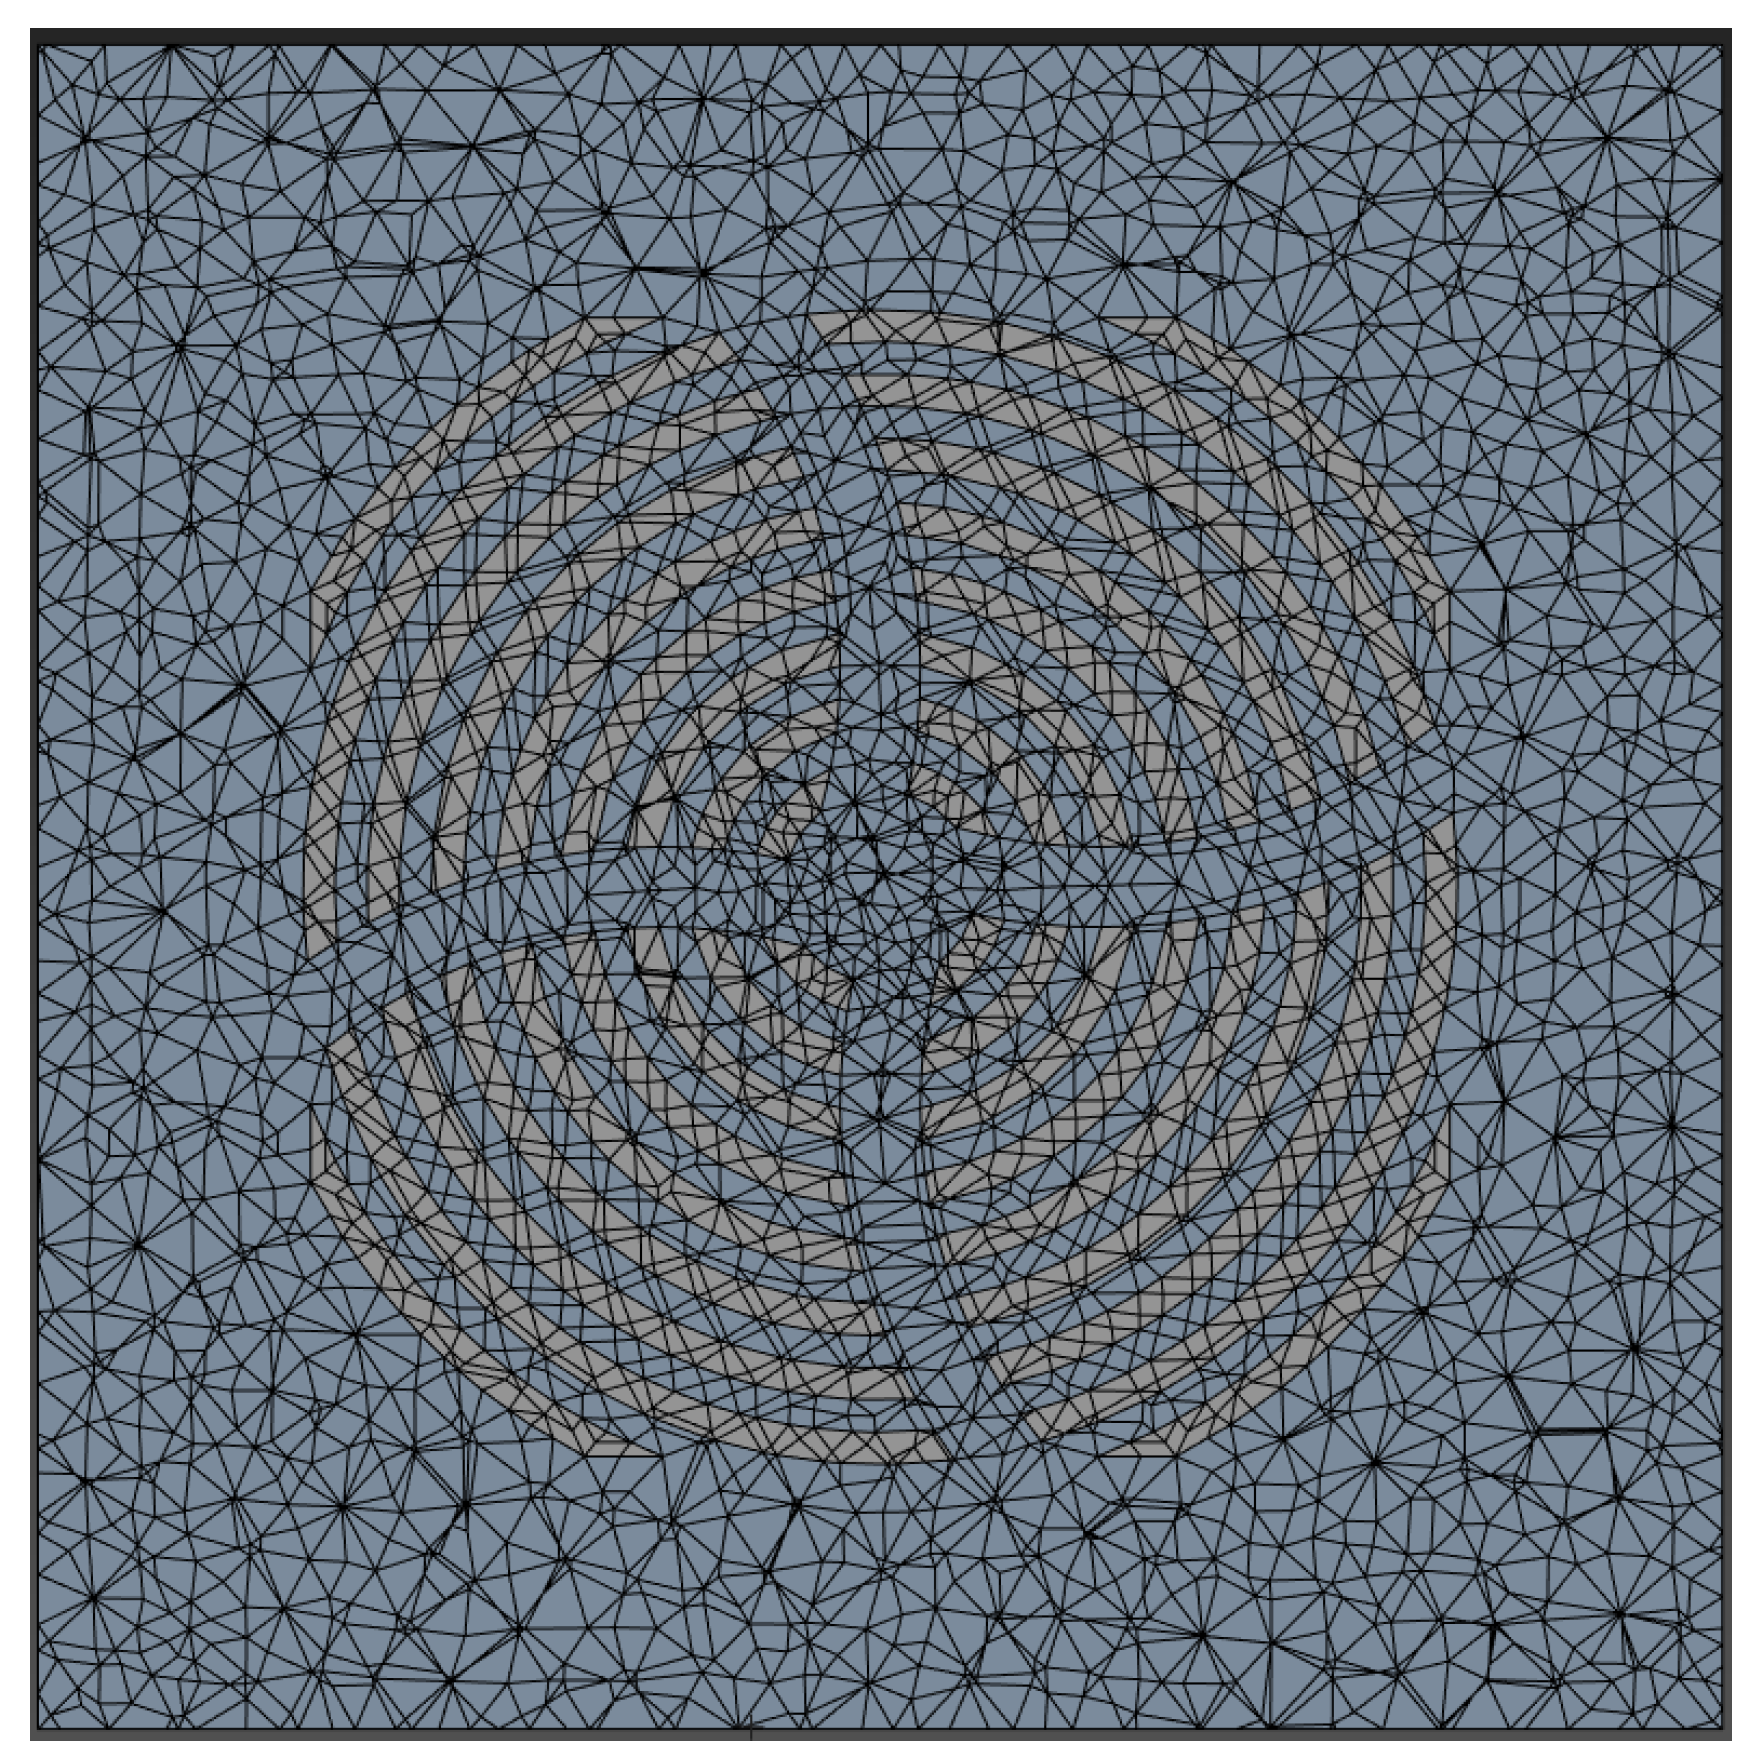
Every numerical simulation must include a mesh analysis; these are no exceptions. Figure 2 shows that the mesh is applied to both sections: the heat sink and the surrounding air.
For meshing, several mesh simulations were performed, in addition to considering the Skewness metric. This mesh measurement model assumes that average meshes between 0 and 0.25 are considered excellent meshes. However, simulations 3 and 4, see Table 2, fall within the range of excellent meshes; however, the number of elements doubles between these two simulations. Therefore, all CFD simulations are performed with mesh 3 verified.

2.2. Governing Equations

The equations governing flow motion are the classic ones from fluid mechanics, such as continuity equations, momentum equations, and energy equation. They are expressed as follows:
Equation (1) is the general form of the mass-conservation equation and is valid for incompressible and compressible flows [25].
ρ t + · ( ρ v ) = S m
The conservation of momentum is described by the Equation (2),
t ρ v + · ρ v v = p + ρ g + F
where p is the static pressure and ρ g and F are the gravitational body force and external body forces (for example, forces that arise from interaction with the dispersed phase), respectively. F also contains other model-dependent source terms such as porous media and user-defined sources [25].
The conservation of energy is described by the Equation (3),
t ρ E + · V ρ E + p = · j h j J j + S h
Since the flow is moving at high speed, it is clear to infer that there is a turbulent flow; the heat-dissipation process is one of these. Two-equation turbulence models are among the most widely used in CFD, allowing the determination of the length and time scales of turbulence.
The κ ϵ turbulence model is based on the transport model for the kinetic energy κ and ϵ dissipation rate. However, these equations are only valid for completely turbulent flows.
Turbulence kinetic energy, and its rate of dissipation, are obtained from the transport Equations (4) and (5):
t ρ k + x j ρ k u j = x j μ + μ t σ k k x j + G k + G b ρ ε Y M + S k
and
t ρ ϵ + x j ρ ϵ u j = x j μ + μ t σ ϵ ϵ x j + ρ C 1 S ϵ ρ C 2 ϵ 2 k + ν ϵ + C 1 ϵ ϵ k C 3 ϵ G b + S ϵ
where
C 1 = max 0.43 , η η + 5
η = S k ϵ
S = 2 S i j S i j
In Equations (6)–(8), G κ represents the generation of turbulence kinetic energy due to mean velocity gradients. G b is the generation of turbulence kinetic energy due to buoyancy. Y M represents the contribution of the fluctuating dilatation in compressible turbulence to the overall dissipation rate. C 2 and C 1 ϵ are constants. σ κ and σ ϵ are the turbulent Prandtl numbers for κ and ϵ , respectively. S κ and S ϵ are user-defined source terms. The degree to which S ϵ is affected by the buoyancy is determined by the constant C 3 ϵ [25], Equation (9).
C 3 ϵ = tanh V U
The model constants C 2 , σ κ , and σ ϵ have been established to ensure that the model performs well for certain canonical flows. The model constants are C 1 ε = 1.44 , C 2 = 1.9 , σ k = 1.0 , σ ε = 1.2 .
Turbulent heat transport is modeled using the concept of Reynolds’ analogy to turbulent momentum transfer. The “modeled” energy equation is therefore given by Equation (10).
t ρ E + x j u i ( ρ E + p ) = x j k e f f T x j + u i ( τ i j ) e f f + S h
where E is the total energy, k e f f is the effective thermal conductivity, and ( τ i j ) e f f is the deviatoric stress tensor, defined as Equation (11):
τ i j e f f = μ e f f u j x i + u i x j 2 3 μ e f f u k x k δ i j
The term involving τ i j e f f represents the viscous heating and is always computed in the density-based solvers. It is not computed by default in the pressure-based solver. Therefore, the model that was used is the latter. However, it is also viable to use it in simulations with higher flow velocities.
For the RNG κ ϵ turbulence model, the effective thermal conductivity is determined by Equation (12):
k eff = α c p μ eff

3. Results and Discussion

This study is entirely numerical, using CFD simulations. Therefore, results are presented showing how heat is dissipated through the geometry of the heat sink. The results will be presented in terms of air velocity and fin temperature, all as a function of time.
To validate the CFD simulation of curved finned heat sinks, using ANSYS Fluent to predict the temporal temperature evolution of a curved finned heat sink under turbulent flow conditions. The validation focuses on the temperature variable during the transient regime. The SIMPLE (Semi-Implicit Method for Pressure-Linked Equations) algorithm was used for the pressure-velocity coupling scheme. Time discretization was performed using a second-order implicit scheme, ensuring greater precision in the temporal evolution of the variables. The time step size was set at 0.01 s, a value determined through a temporal convergence study that ensured numerical stability (Courant number < 10 in most cells) and adequate precision, avoiding divergences without incurring prohibitive computational costs.
The results presented by Kosdere et al. [26] are a similar study to the one presented in this research. They analyze different shapes and sizes of heat sinks through simulation using ANSYS software. Additionally, they obtained and analyzed the effects of air velocity on heat transfer. There is a 18.25% difference between this study and the one developed in this document, as they analyze in laminar flow regimes with velocities ranging from 4 to 8 m/s.
Several simulations have been carried out, with three well-defined variables, which are as follows: the temperature of the base in the heat sink, the speed of the air passing through the device, and the simulation time. These analysis cases can be seen in Table 3.
The velocities studied in this research represent an upper limit; these velocities are extremely high, as the goal is to determine whether excessively increased velocity proportionally influences the cooling of the heat sink. On the other hand, the temperature variable is more difficult to exceed beyond exaggerated limits; therefore, it is increased to a maximum of 25% for standard computer systems.
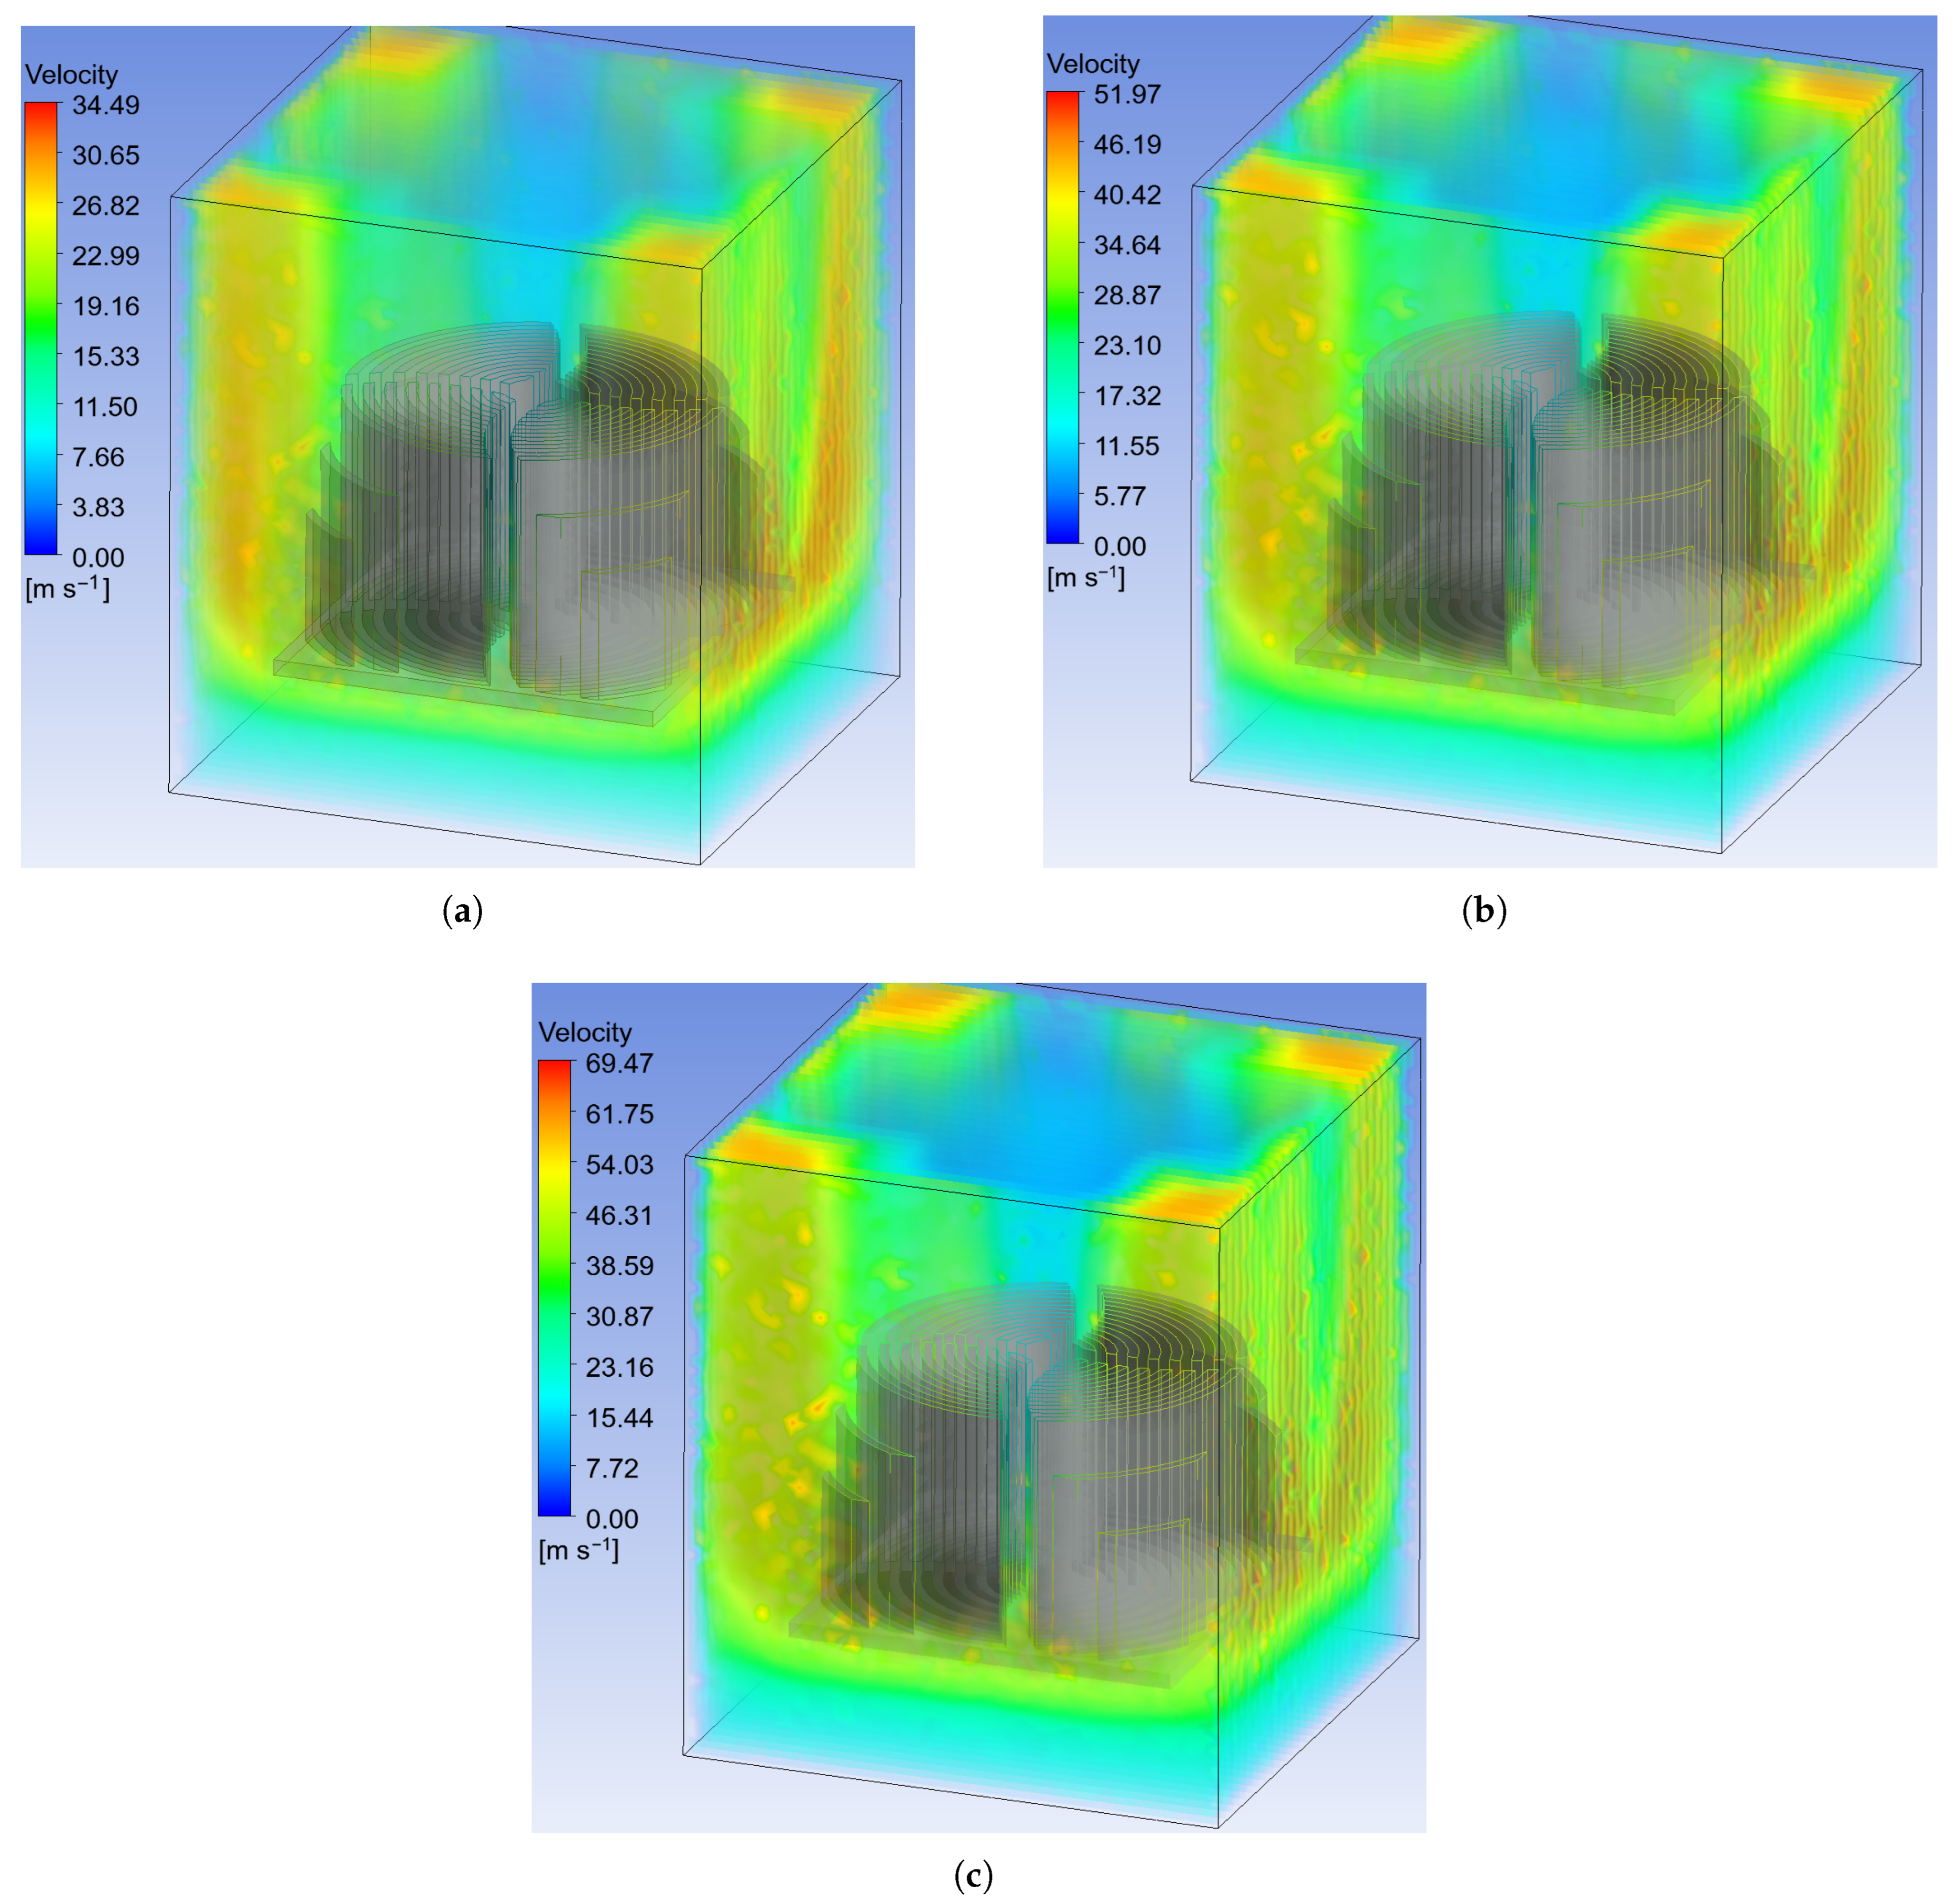
This section focuses on investigating the impact of the airflow velocity that circulates through the heat sink. Therefore, nine simulations were performed, with three velocities and three base temperatures. Figure 3 represents the air velocity under varying temperatures and with a constant input velocity.

3.1. Temperature at the Heat Sink for Time 2 s

In Figure 3a, the air velocity reaches a maximum value of 34.49 m/s at the corners of the heat sink, while in the center of the heat sink, near the top of the fins, the velocity is 5.87 m/s. This indicates that the velocity decreases as it approaches the heat sink fins. On the other hand, in Figure 3b, when the velocity increases to 15 m/s, the maximum speed in the simulation is 51.97 m/s, in the same sector as the first case, where an increase of 50.68% is observed; this will later determine a reduction in the temperature of the heat sink. Finally, in Figure 3c, the air speed in the heat sink is shown. In this figure, the maximum speed is 69.47 m/s, while in the center the speed has not increased much, barely reaching 7.32 m/s, which means 24.7% in that sector. Figure 4 shows the temperature contours of the air flow and the heat sink, at 10 s, with a temperature at the lower base of 80 °C and the three air inlet velocities.
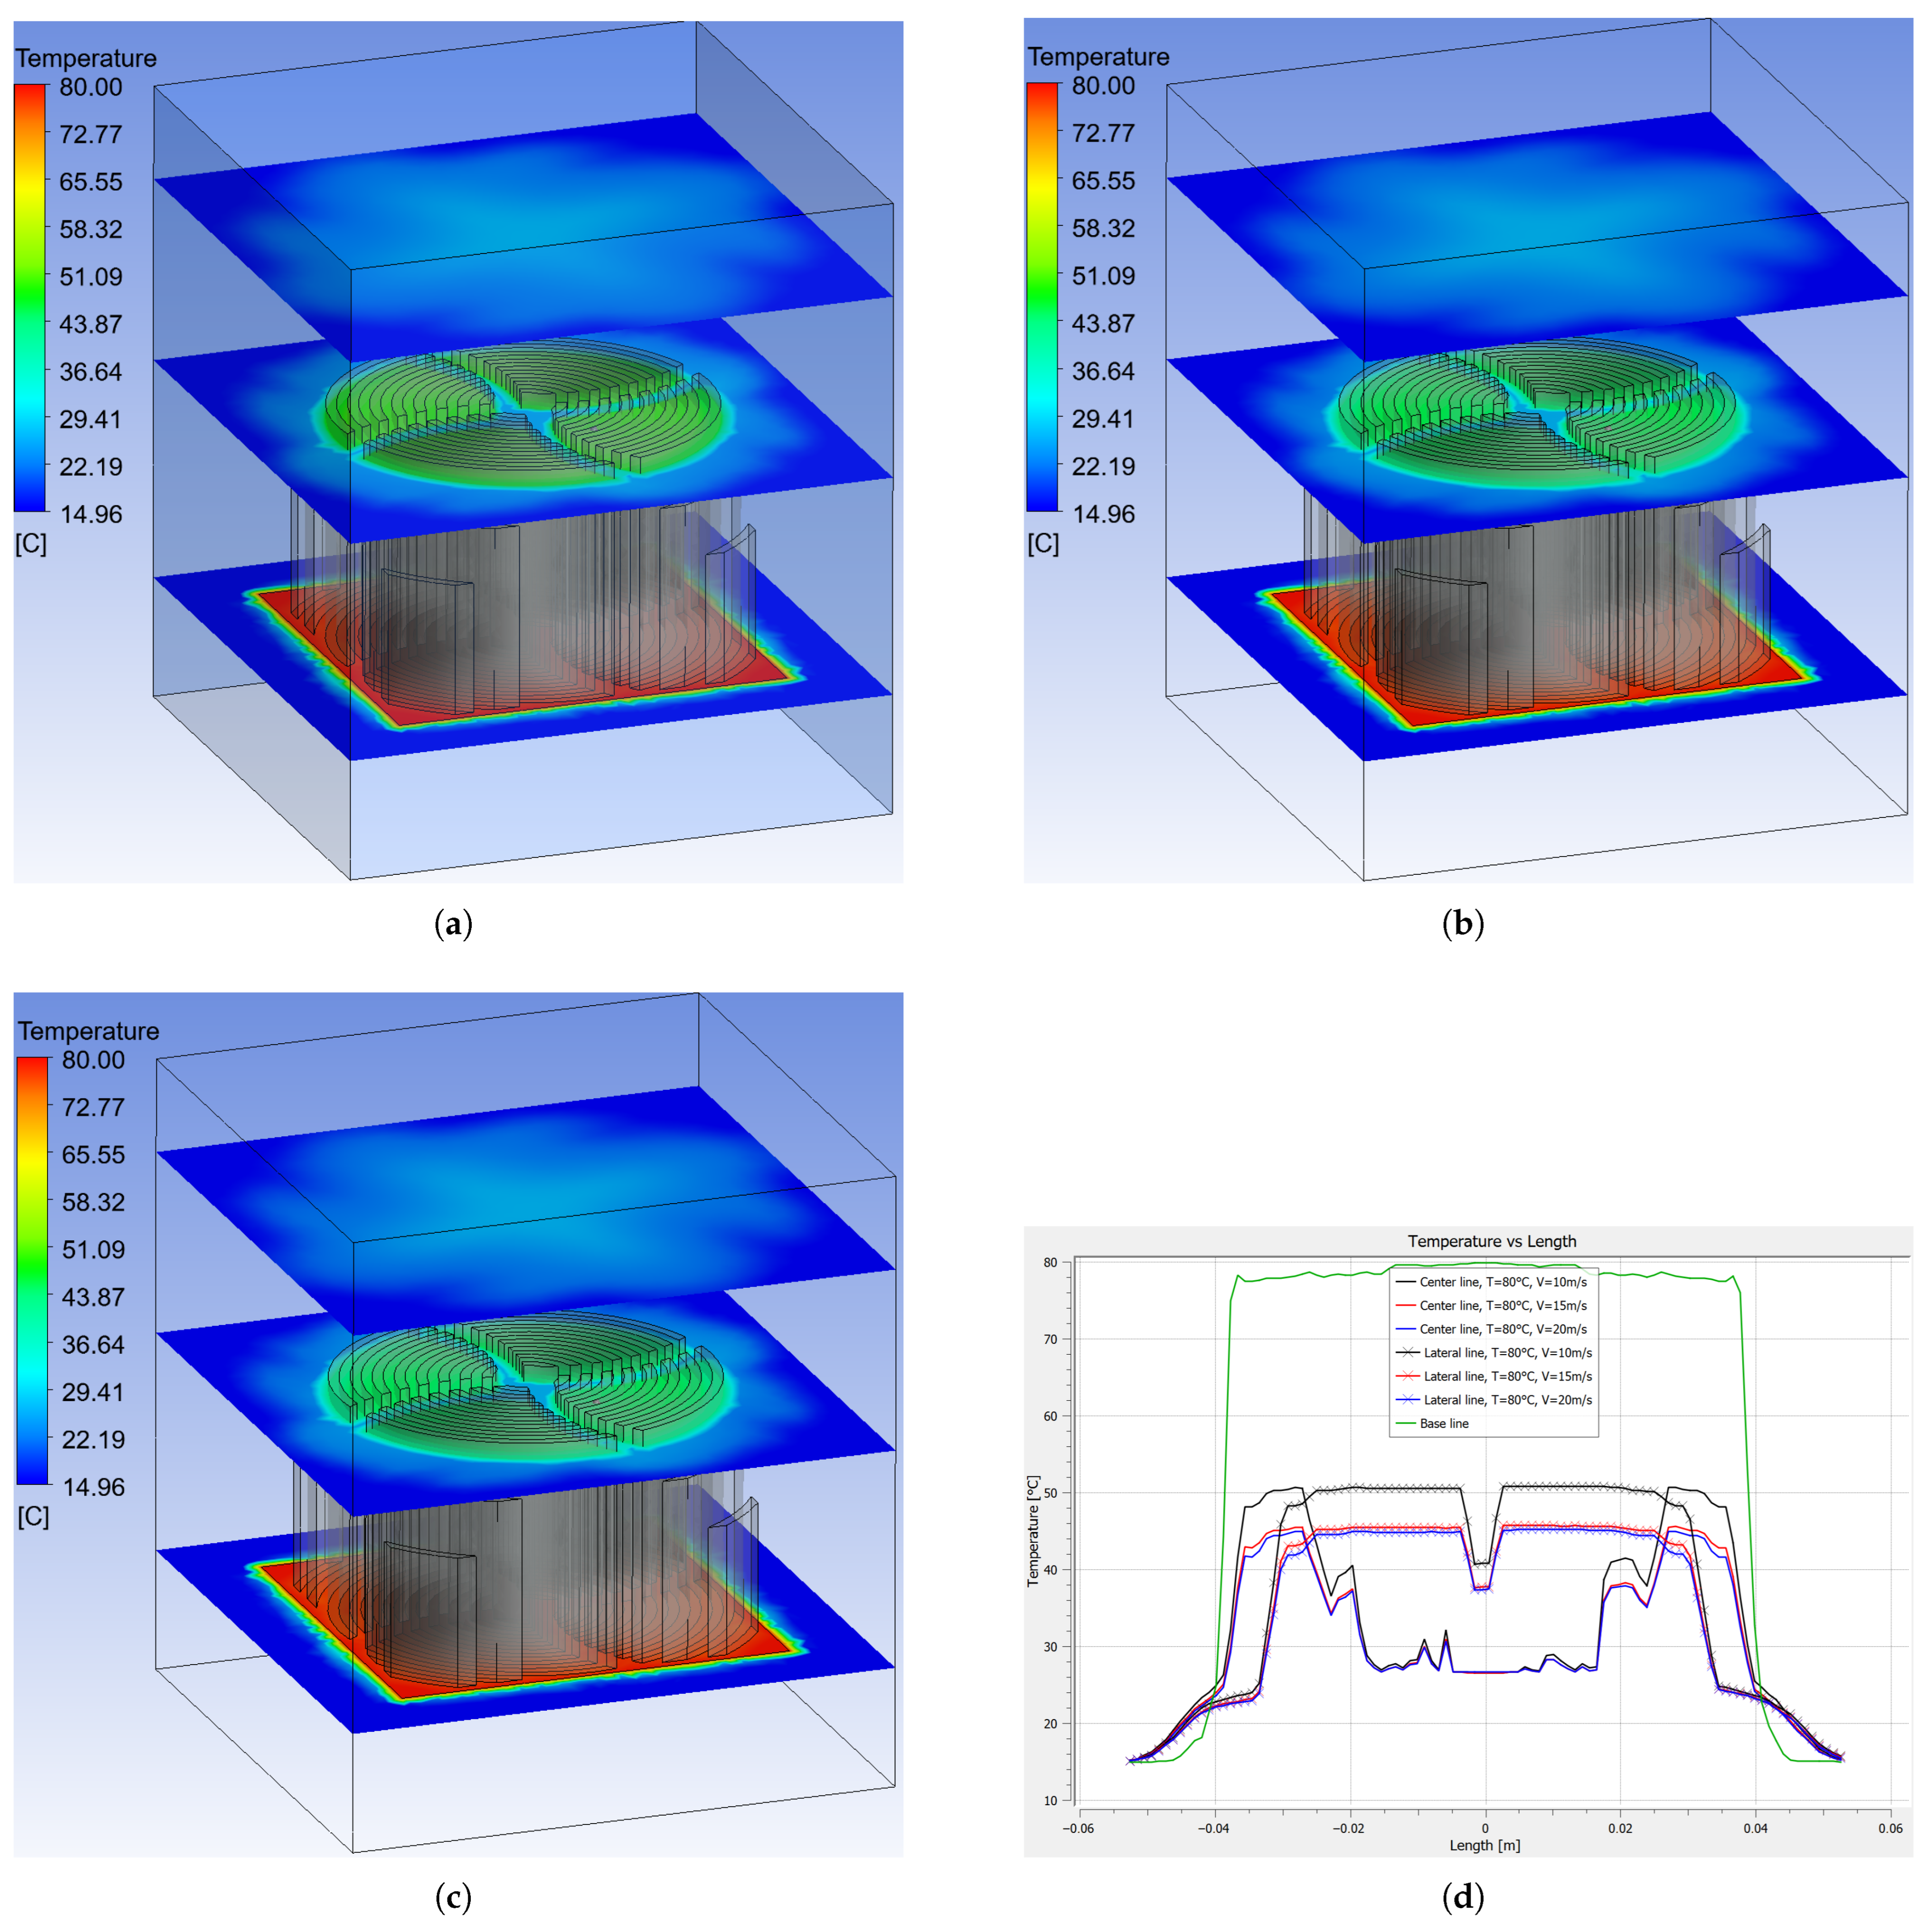
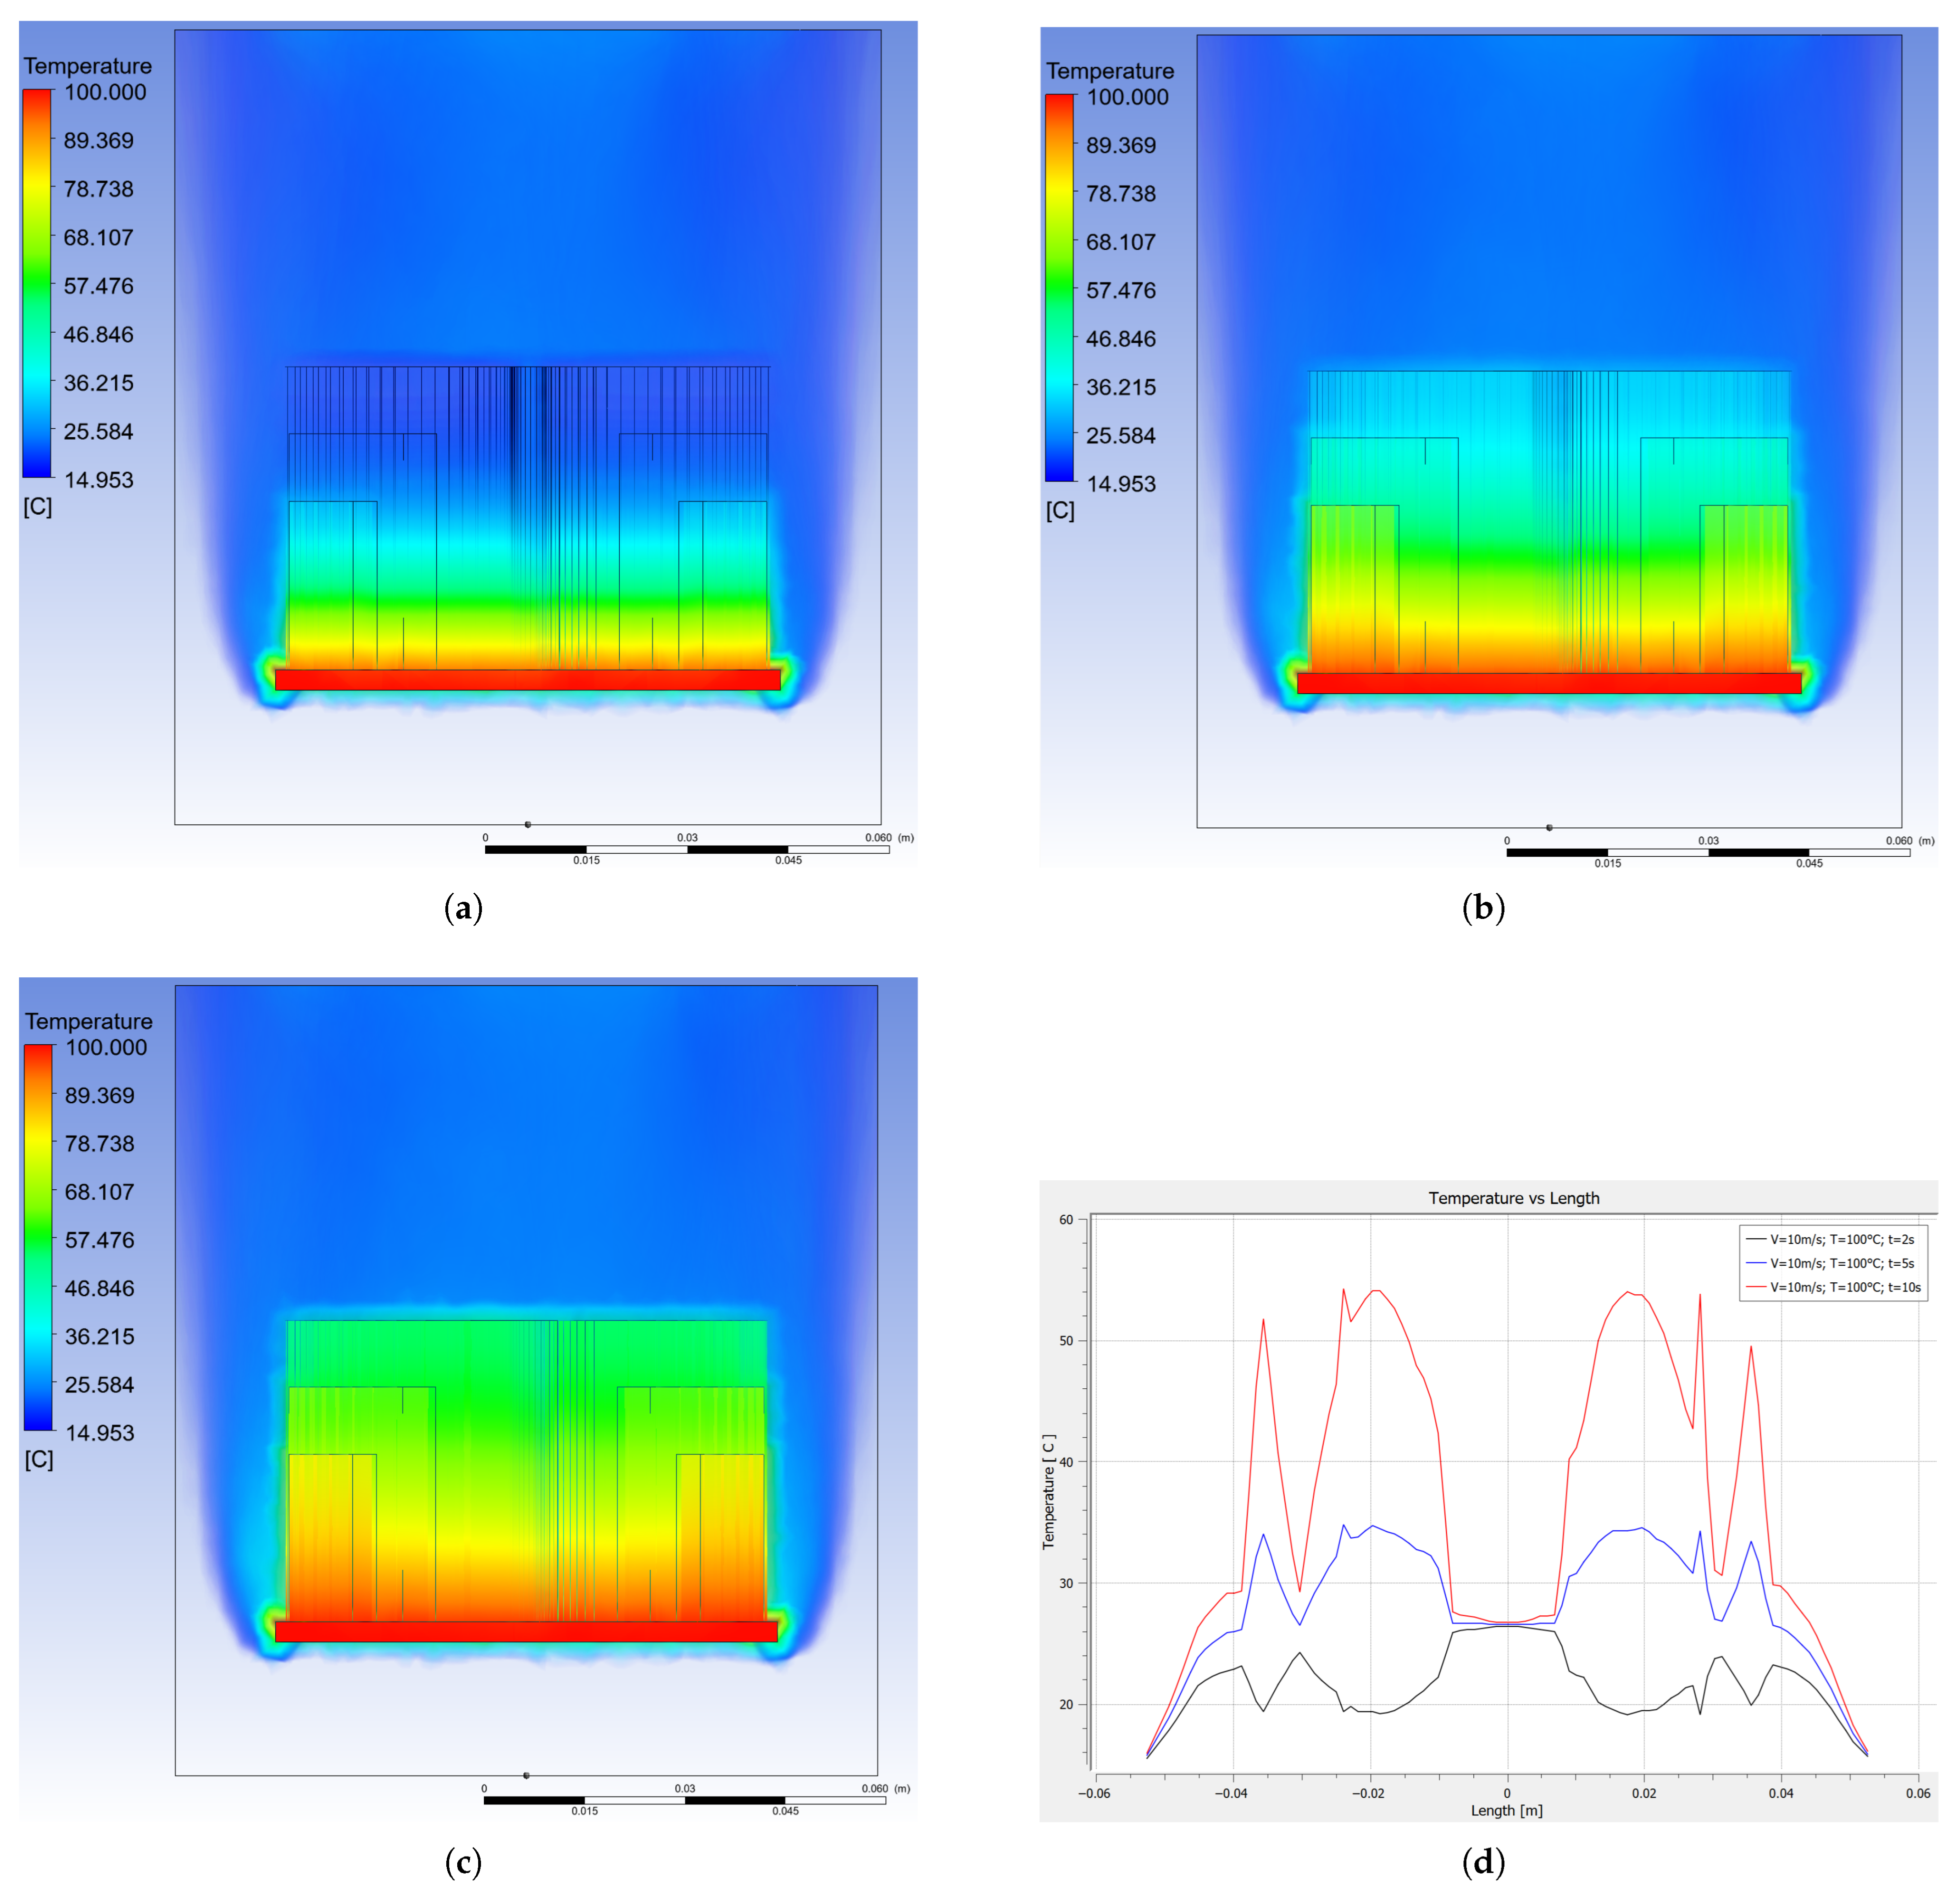
Figure 4a–c are the temperature contours. Each figure has three contour planes: top, center, and bottom. The top plane is 80 mm, the center plane is 45 mm, and the bottom plane is 3 mm from the bottom of the heat sink. The images appear identical; however, there are variations in temperature in detail.
Figure 4a, which has a speed of 10 m/s as air enters, shows that the temperature changes from the bottom. In the central plane at 45 mm, the air temperature is 26.58 °C; however, when moving to the right or left, at the fins the temperature is 50.20 °C. This shows that the air around the fins has different temperatures at this height. If the height is changed to 80 mm, in the same central part it is 26.84 °C, and on the lateral part it is 25.77 °C. These temperatures show that the air is heating up from the 15 °C at the beginning. By the concept of heat transfer, the fins are transferring their heat to the surrounding air.
Figure 4b is the temperature contour for a velocity of 15 m/s, taking into account a height of 45 mm, in the central part of the heat sink, the temperature is 26.58 °C; at this point, the temperature is almost identical to the previous case. However, when moving to the side of the heat sink, the temperature reaches 45.19 °C, a little lower than in the previous case. When rising to a height of 80 mm, in the same central part, the temperature is 26.84 °C, while in the lateral section the temperature is 25.73, these last two temperatures are identical to the previous simulation.
Figure 4c shows the temperatures for a velocity of 20 m/s. With a height of 80 mm, the temperatures are 26.60 °C and 44.52 °C for the central and lateral sections, respectively. On the other hand, when the height is changed to 80 mm, the temperatures are 26.84 °C and 25.74 °C for the central and lateral sections, respectively. Again, identical to the two previous simulations. This demonstrates that, as the heat sink moves away, the temperatures remain the same regardless of the ingress velocity.
Figure 4d is completely different from the previous three, showing how the temperature moves along the x axis of the heat sink. Data are taken from three different lines: the baseline is 3 mm from the bottom of the heat sink, the second line runs through the center at a height of 45 mm, and another line at the same height, but is offset 20 mm laterally from the center point. The temperature at the baseline is approximately 80 °C. The temperature at the center line increases and decreases as it moves away from or closer to the fins, respectively. Air speed changes the temperature of the heat sink from 10 m/s to 15 m/s, while the temperature remains the same from 15 m/s to 20 m/s.
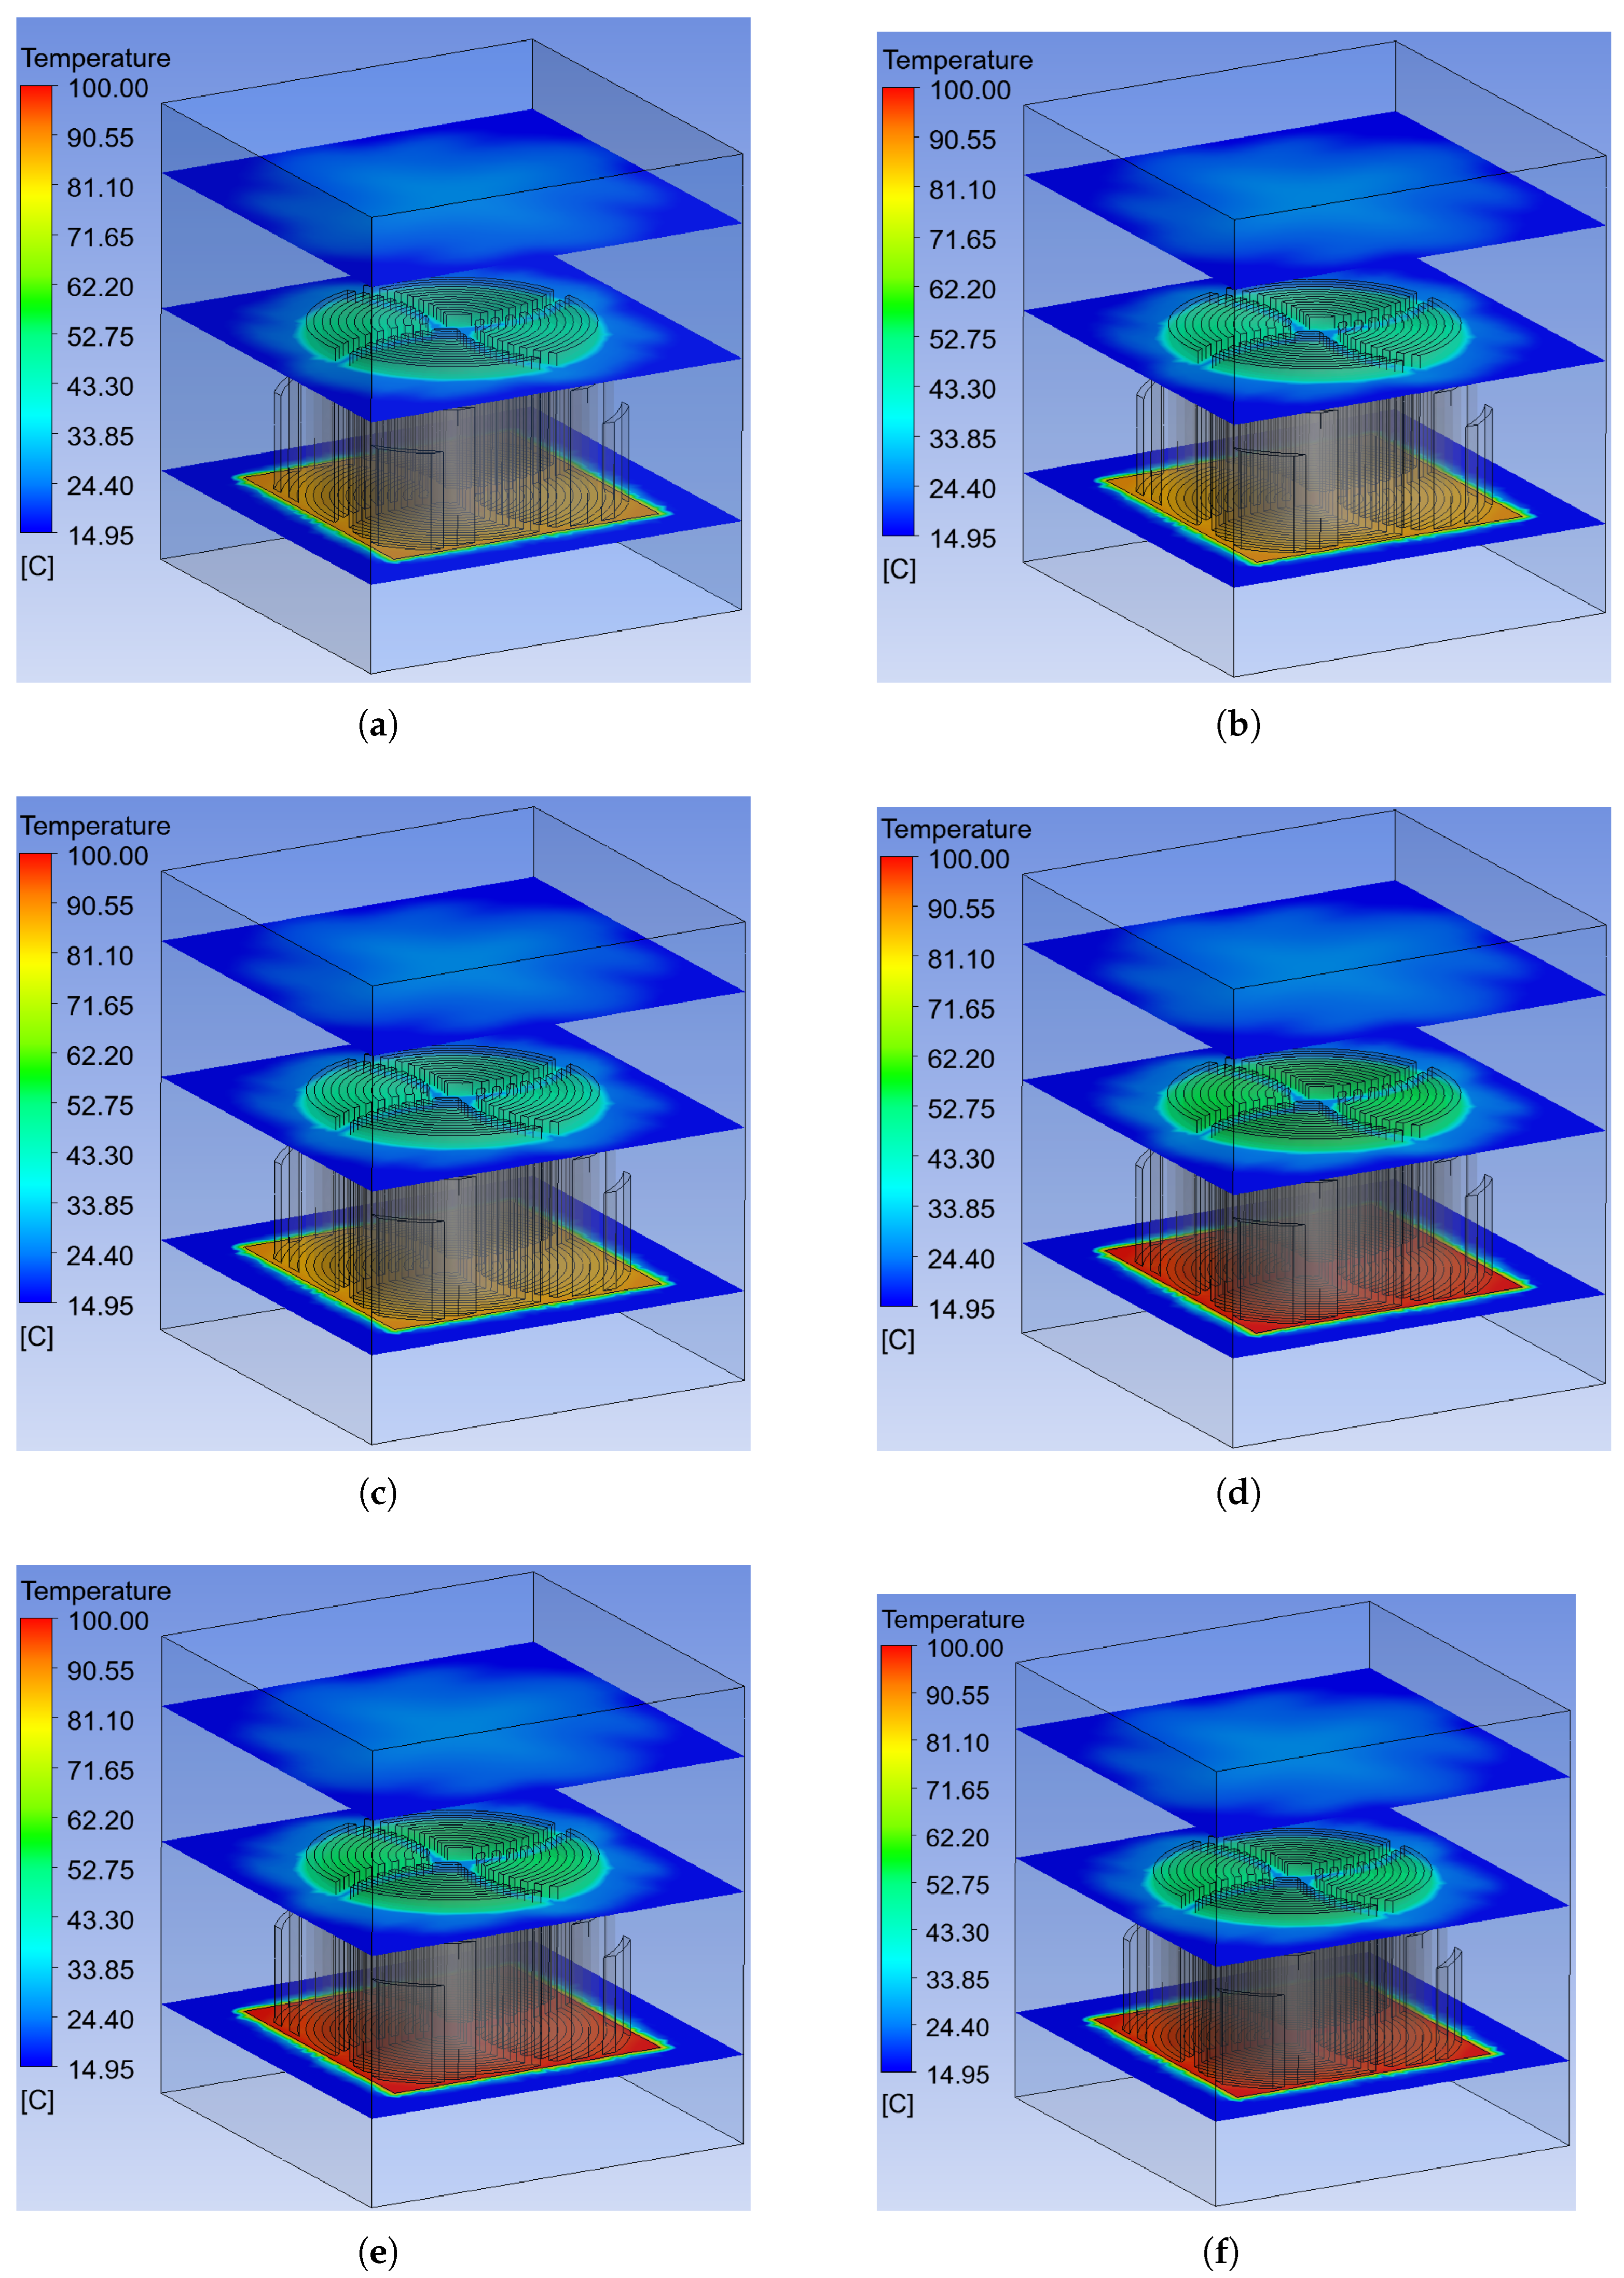
Figure 5 shows the temperature contours for the other six simulations, with a total time of 10 s. The first three figures represent the behavior of the heat sink at a temperature of 90 °C, with the three speeds analyzed. The following three figures are at a temperature of 100 °C, with the same three velocities.
In Figure 5a, the temperature contour in the circular heat sink is observed; in this case, different temperatures are established as we move away depending on the radius. For the temperature of 90 °C and velocity of 10 m/s, the analysis coordinates are as follows: x = −0.01 m, z = 0.045 m; and in the y direction, it changes to three points: −0.025 m, −0.035 m and 0.045 m. The temperatures inside the heat sink are 50.82 °C, 44.96 °C, and 19.94 °C, respectively. It is clearly evident that when leaving the fins in the heat sink, the temperature drops rapidly; however, when we are in the internal part, there is a reasonable change in temperature.
For Figure 5b,c, the temperature contours are displayed in the same way as in the previous case. The analysis coordinates will be the same as those analyzed. In Figure 5b, it has a velocity of 15 m/s and a temperature of 90 °C at the base. For the y distances of −0.02 m, −0.035 m and −0.045 m, the temperatures are 50.12 °C, 43.46 °C, and 19.68 °C, respectively. On the other hand, in Figure 5c, for the same positions, velocity of 20 m/s and a temperature of 90 °C at the base, the temperatures are 49.47 °C, 42.14 °C, and 19.53 °C. In these two simulations, the maximum variation of 3.33% in the coordinates, x = −0.01 m, y = −0.025 m, z = 0.045 m, can be seen, which indicates that there is a reduction in temperature in the heat sink due to the change in air velocity.
Figure 5d, is the representation of the temperature in the heat sink, with a temperature at the base of 100 °C and a velocity of 10 m/s. The temperature in the heat sink increases by 9.05% with reference to Figure 5a, the value that is had is 55.42 °C at the position of y = −0.025 m. For the other positions, the temperatures are 48.70 °C and 20.47 °C, these also increase, this is because the temperature at the base increases by 10 °C. However, this value does not increase throughout the heat sink.
In the last Figure 5e,f, there is a variation in temperature. Figure 5e has a base temperature of 100 °C and a velocity of 15 m/s, while Figure 5f has the same temperature and a speed of 20 m/s. The same analysis position is reported in these figures; for Figure 5e, the temperatures are 54.56 °C, 46.93 °C, and 20.16 °C, for the positions y = −0.025 m, y = −0.035 m, y = −0.045 m, respectively. The temperatures inside the heat sink increase by 8.85%, 7.98% and 2.43%, compared to the temperature contour when the temperature at the base is 90 °C. As we move away from the fins on the heat sink, the temperature remains somewhat similar.

3.2. Temperature for Analysis Times

This study examines the cooling of computer components using a circular fin heat sink. As explained above, the study is performed for different times, 2 s, 5 s, and 10 s, using the three temperatures and speeds previously evaluated.
Figure 6 represents how heat and temperature are extracted from electronic devices in computers using heat sinks. Figure 6a shows the temperature of the fins and the air around them. In this figure, a time of 2 s shows that the temperature at the base is 100 °C, with a velocity of 10 m/s, and tends to decrease as it ascends through the fins. However, in Figure 6b, time 5 s, the fins begin to gain temperature, as shown in Figure 6c. In addition, it can be seen that the air temperature also changes, always increasing.
Finally, Figure 6d shows the temperature change in the empty space between the fins at a height of 40 mm from the base. The speed and temperature in this figure are 10 m/s and 100 °C, respectively. As time passes, the temperature in this sector begins to increase. For 2 s time, the maximum temperature is 26.38 °C and the minimum is 19.08 °C. It is necessary to emphasize again that the surrounding air temperature is 15 °C. When analyzed for the 5 s time, the temperatures rose to 34.5 °C and 20.6 °C, indicating an increase of 7.96% in the lower temperature and 30.78% compared to the 2 s time. On the other hand, for the time of 10 s, there is the same tendency of temperature increase in the heat sink, having values of 53.94 °C and 26.72 °C, for the maximum and minimum temperature respectively.
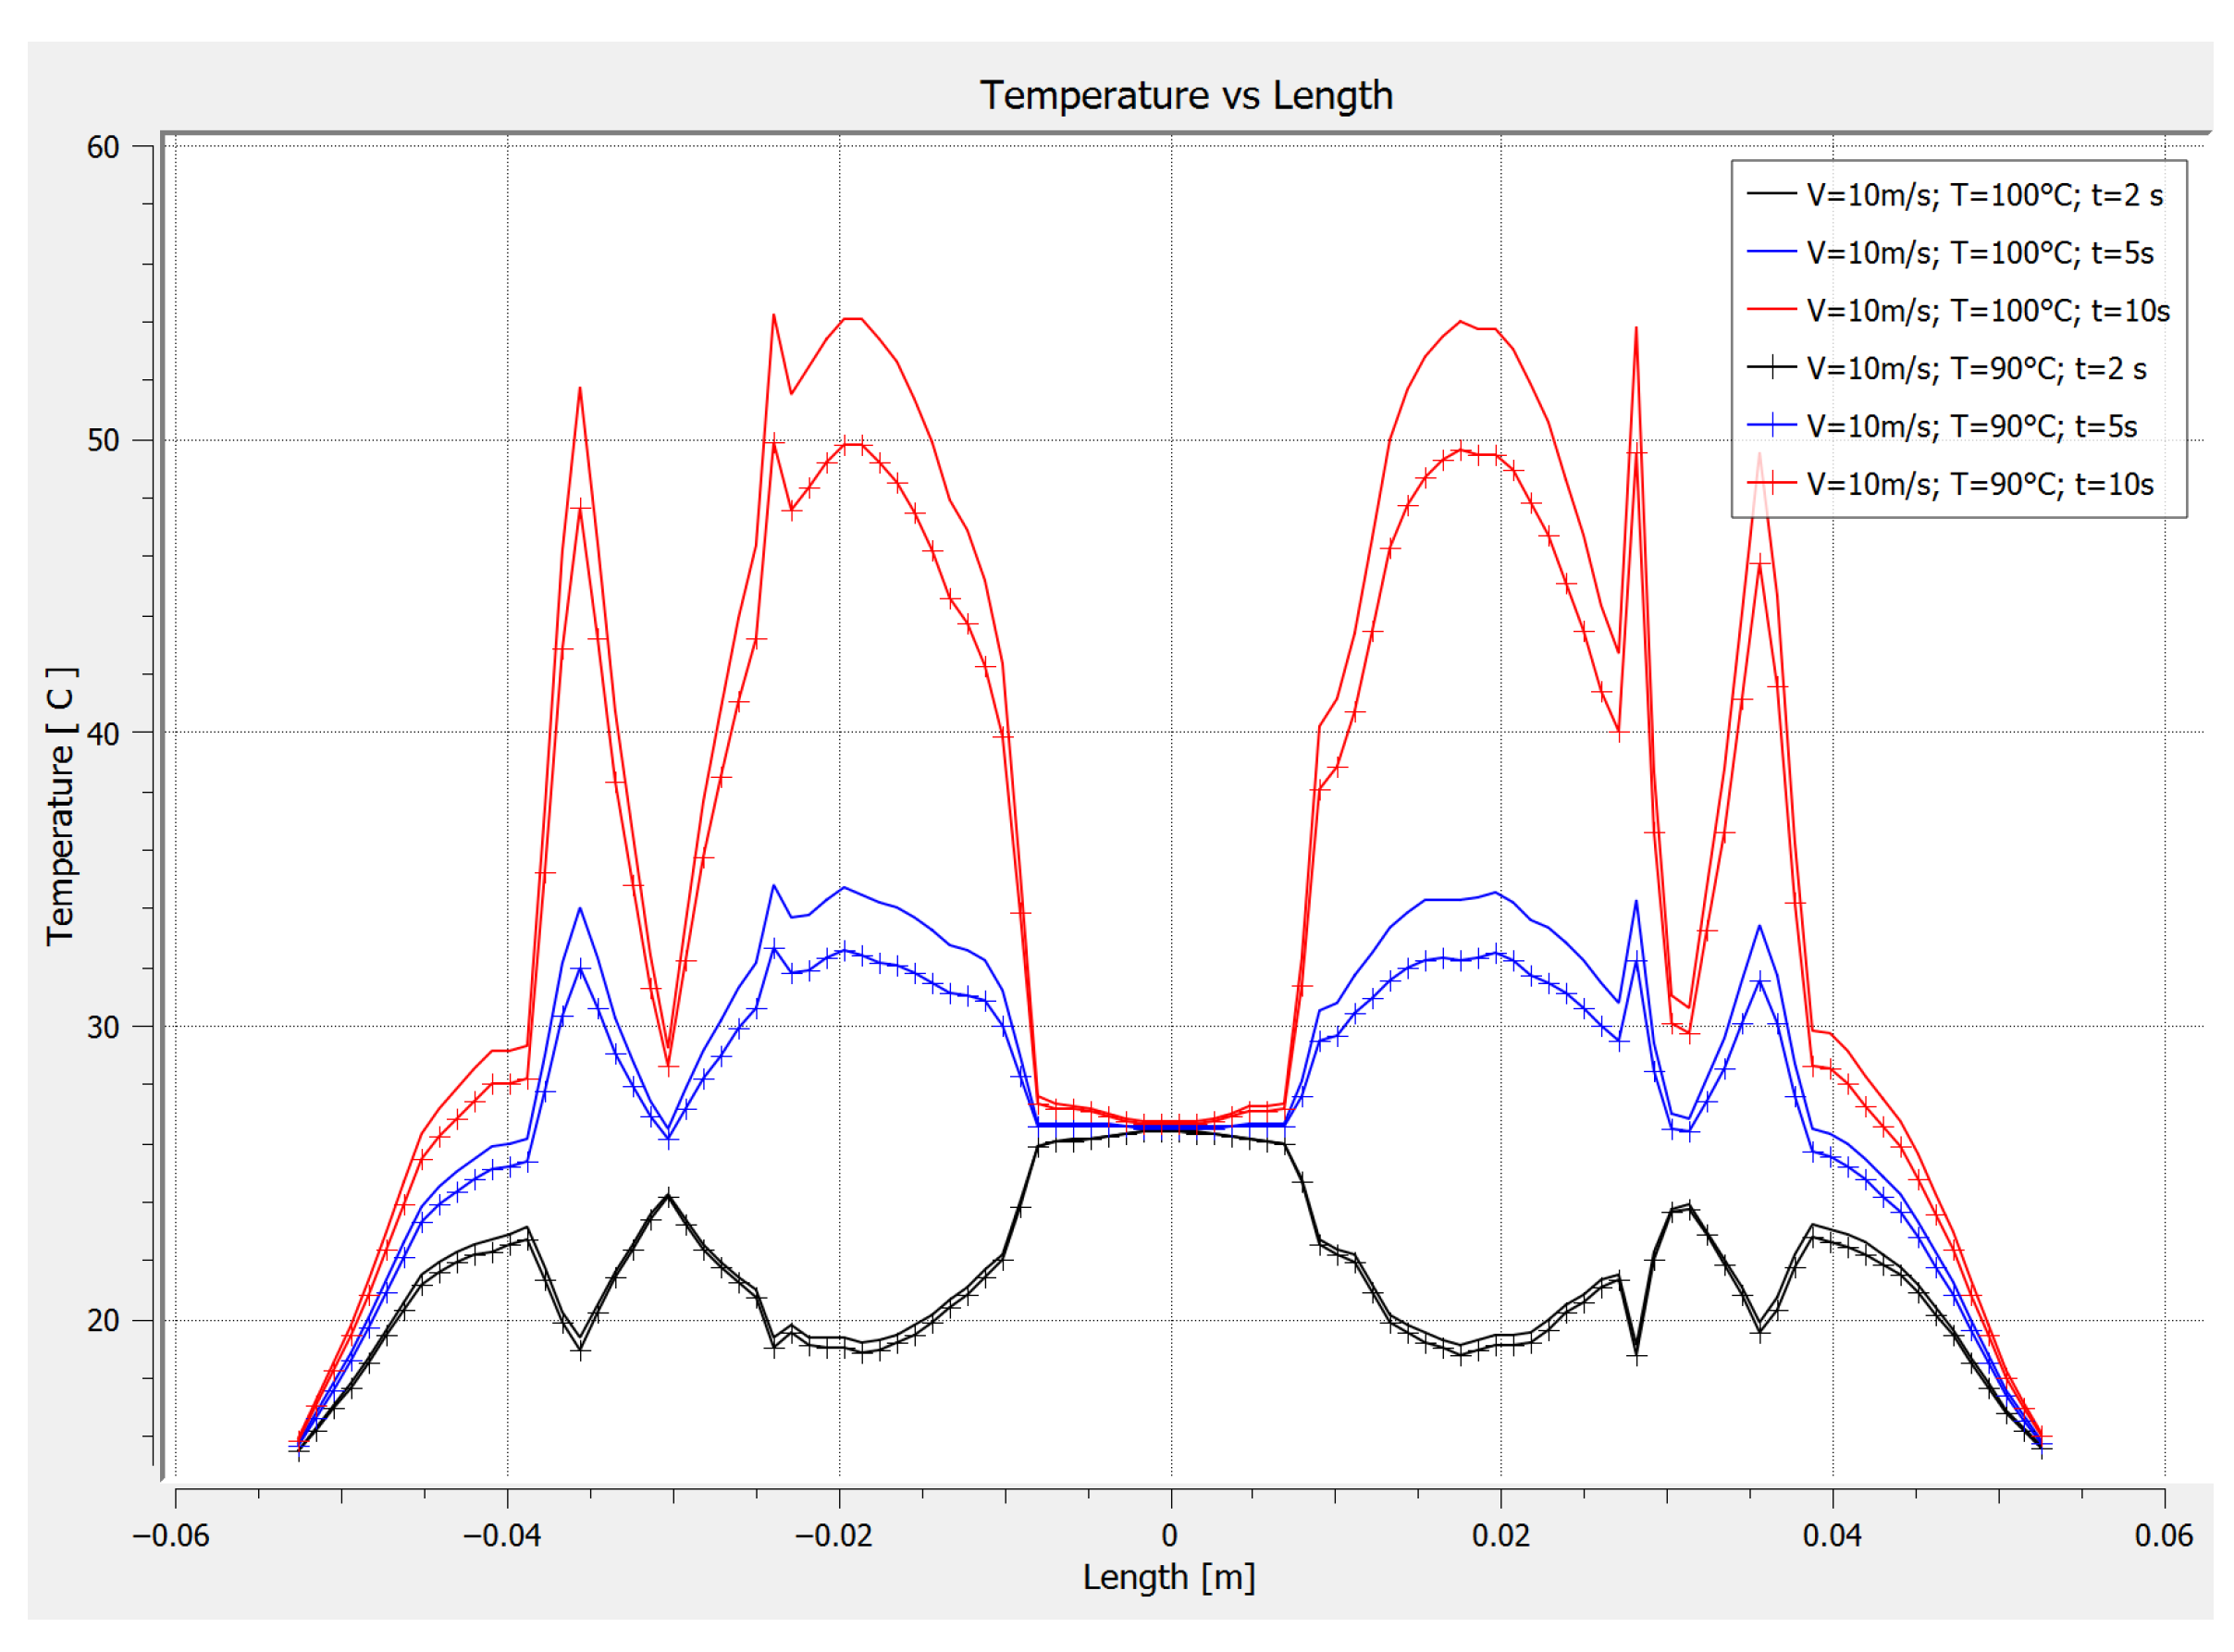
Figure 7, shows a graph showing the temperature change between the fins and the surrounding air in the heat sink. This takes into account the temperature change at the base and the simulation time, with the air temperature circulating at a constant speed of 10 m/s.
In Figure 7, two simulation cases are compared: base temperatures of 100 °C and 90 °C, at the three previously defined times. It can be observed that, for the 2 s time, the temperature does not reflect a significant change, despite the base temperature being 10 °C higher. The maximum temperature variation is 0.3 °C. However, when the analysis is performed at 5 s, a more significant variation in the heat sink temperature is observed; this change reaches 1.99 °C. In addition, for the 10 s time, the upward trend continues, with temperature values reflecting an increase of 3.59 °C. The percentage increases in temperature indicate that heat is dissipated by the fins.
Similarly, this figure shows the significant changes in temperature that occur as the exposure time to the base temperature increases. For a base temperature of 90 °C, the maximum temperatures at the heat sink are 23.37 °C, 32.19 °C, and 49.42 °C, for times of 2 s, 5 s, and 10 s, respectively.
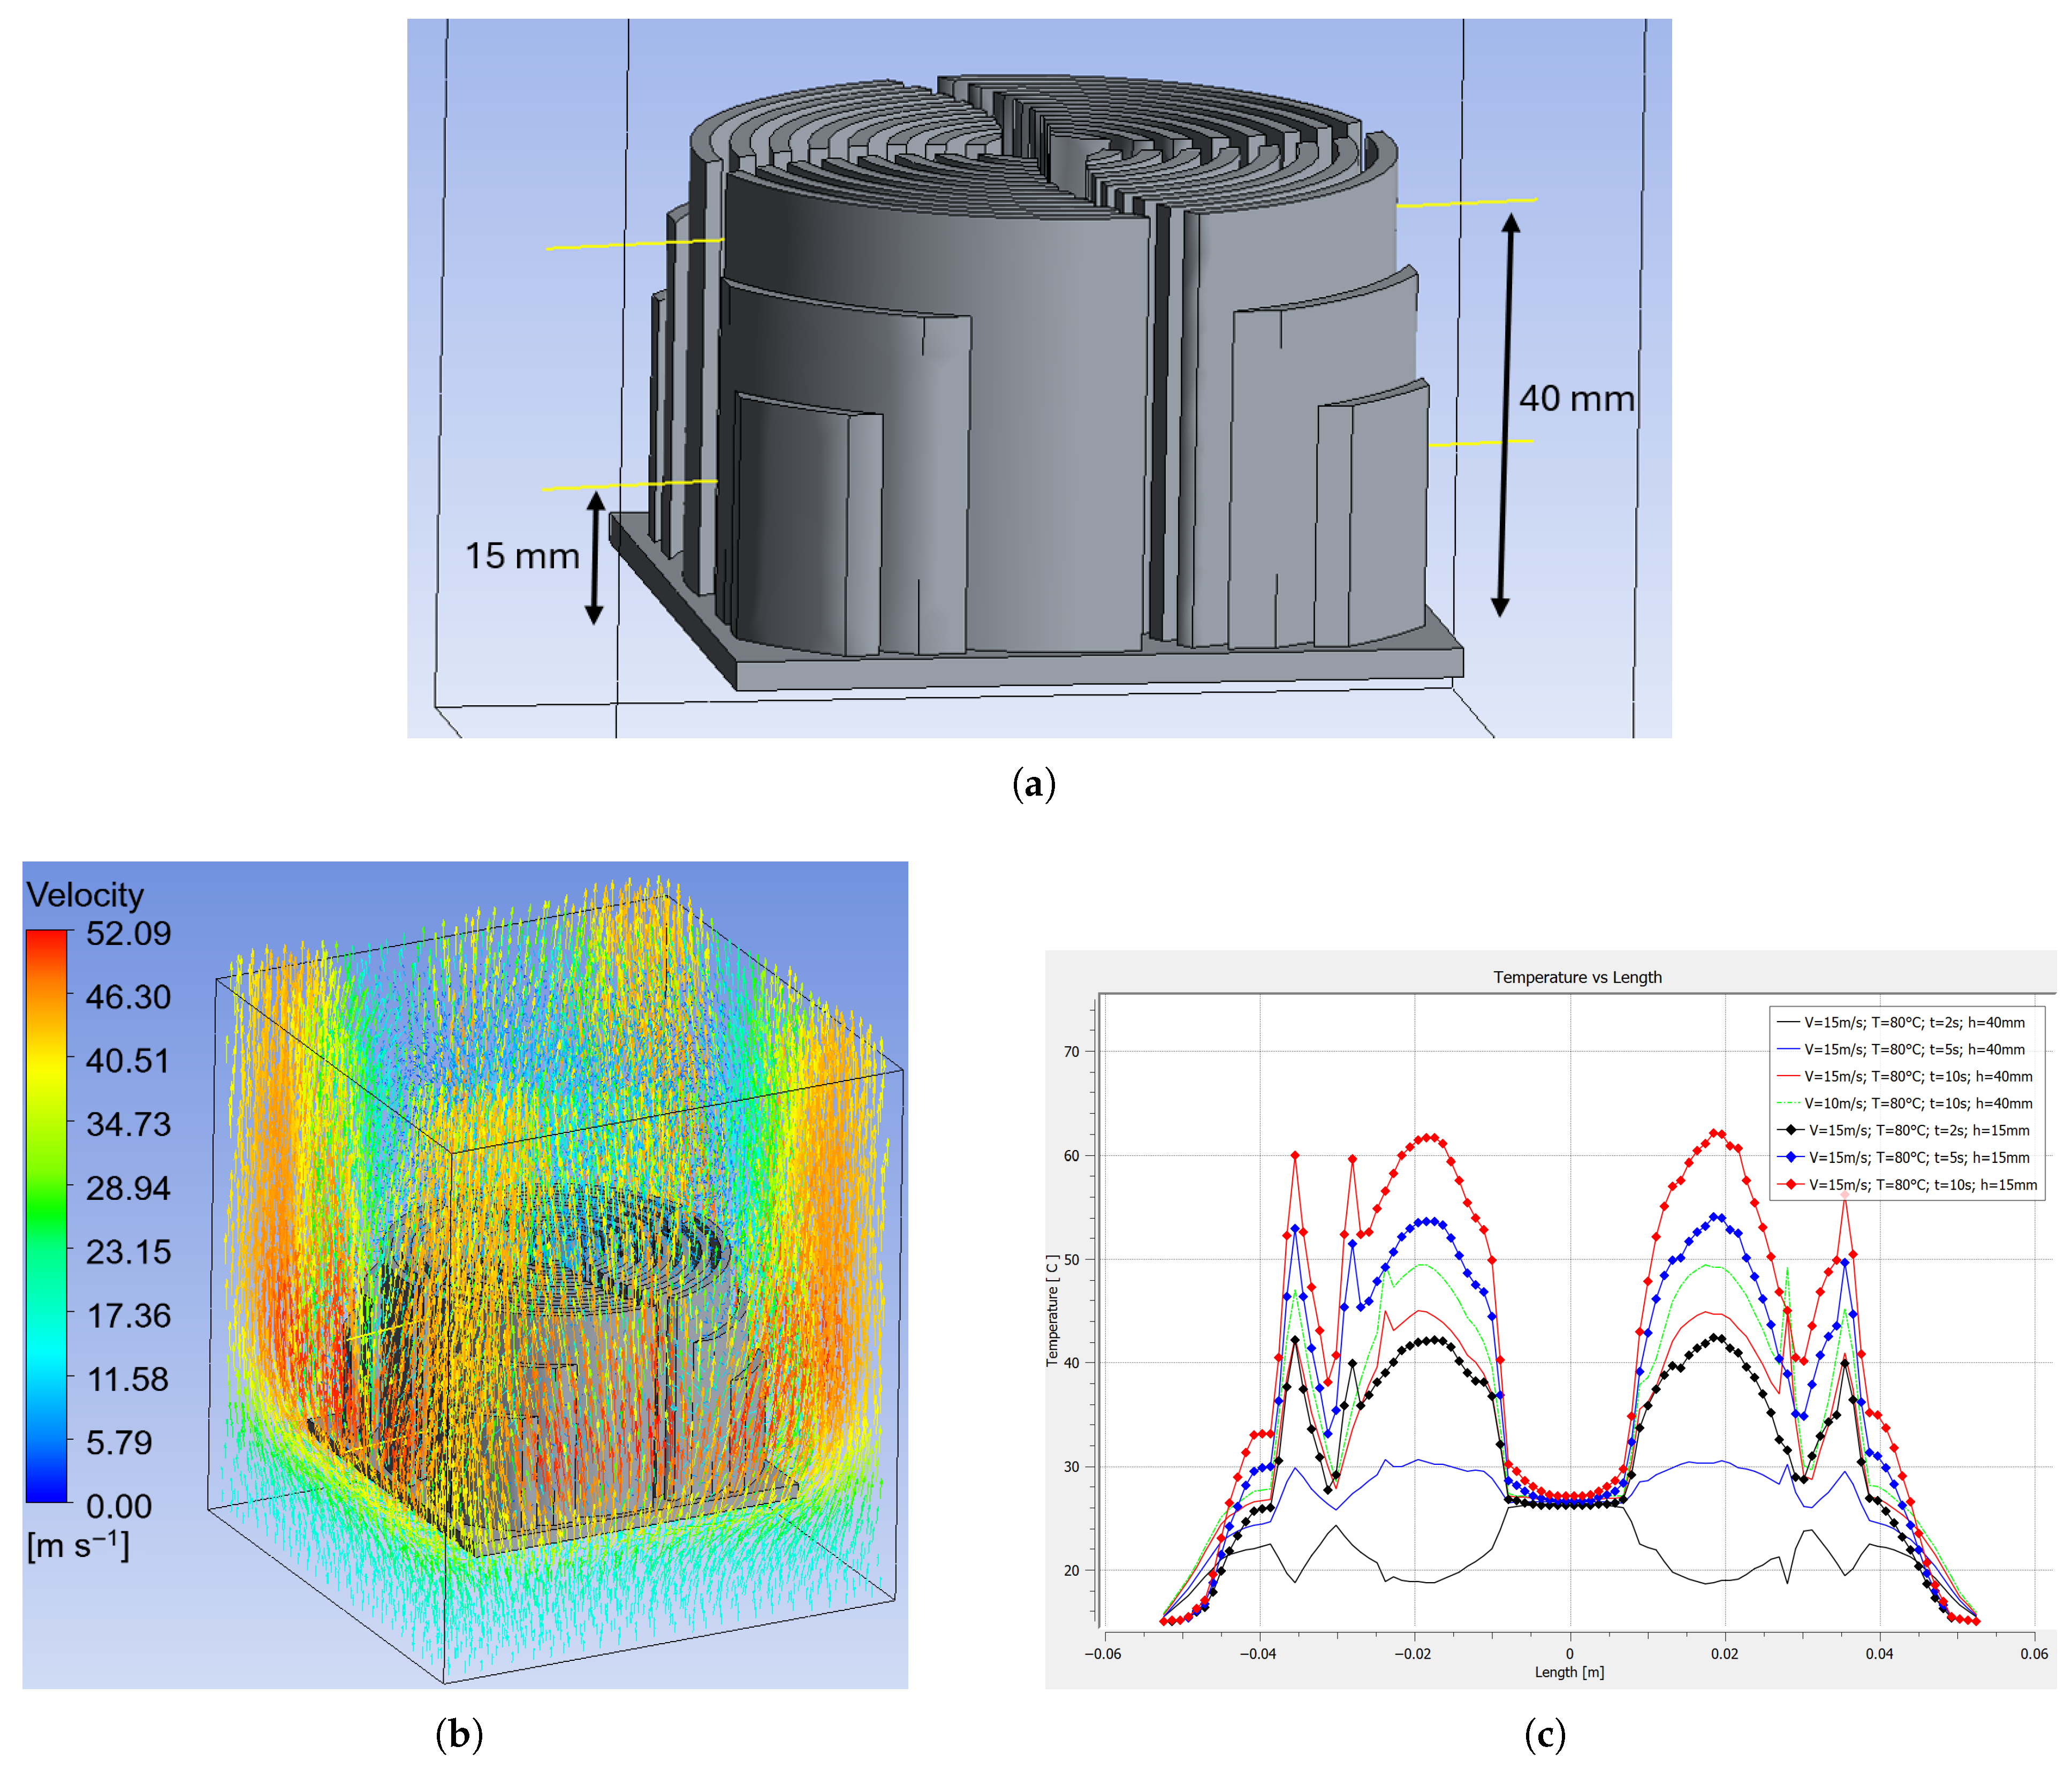
For Figure 8, other very useful results are presented to understand how air velocity, base temperature, and time affect heat dissipation. First, Figure 8a shows two lines, that pass through the heat sink, one at 15 mm from the base and the other at 40 mm, measured from the same position. Figure 8b represents the velocity vectors surrounding the heat sink. The initial air velocity and temperature are 15 m/s and 15 °C, while the temperature at the base is 80 °C at a time of 10 s. These vectors indicate how the velocity flows through the heat sink. The maximum velocity for this case is 52.09 m/s in the surroundings, while in the middle of the heat sink it is 10.89 m/s.
On the other hand, Figure 8 shows how the temperature in the heat sink air changes depending on the height and the simulation time. This figure shows the temperature values for a speed of 15 m/s, a base temperature of 80 °C, the same times as those analyzed, and the two heights mentioned above, also compares with the speed of 10 m/s. Therefore, when the height is closest to the base, 15 mm, the temperatures are greater and decrease as they move away from the base of the heat sink. At 2 s, the maximum temperatures are 26.41 °C and 43.11°C, for heights of 40 mm and 15 mm, respectively. If the analysis time is varied to 5 s, there is a change in temperature, similar to the previous case, indicating values in its temperature of 30.53 °C and 54.99 °C, for the heights of 40 mm and 15 mm, in this comparison the highest value of variation in temperature seemed, with an value of 24.46 °C. In 10 s, the temperature is 45.80 °C at the height of 40 mm, while, for the height of 15 mm the temperature of 63.17 °C is reached. However, when making a comparison with the velocity of 10 m/s, speed and temperature described above and height of 40 mm, there is a variation of 4.78 °C in increase for the lowest velocity.
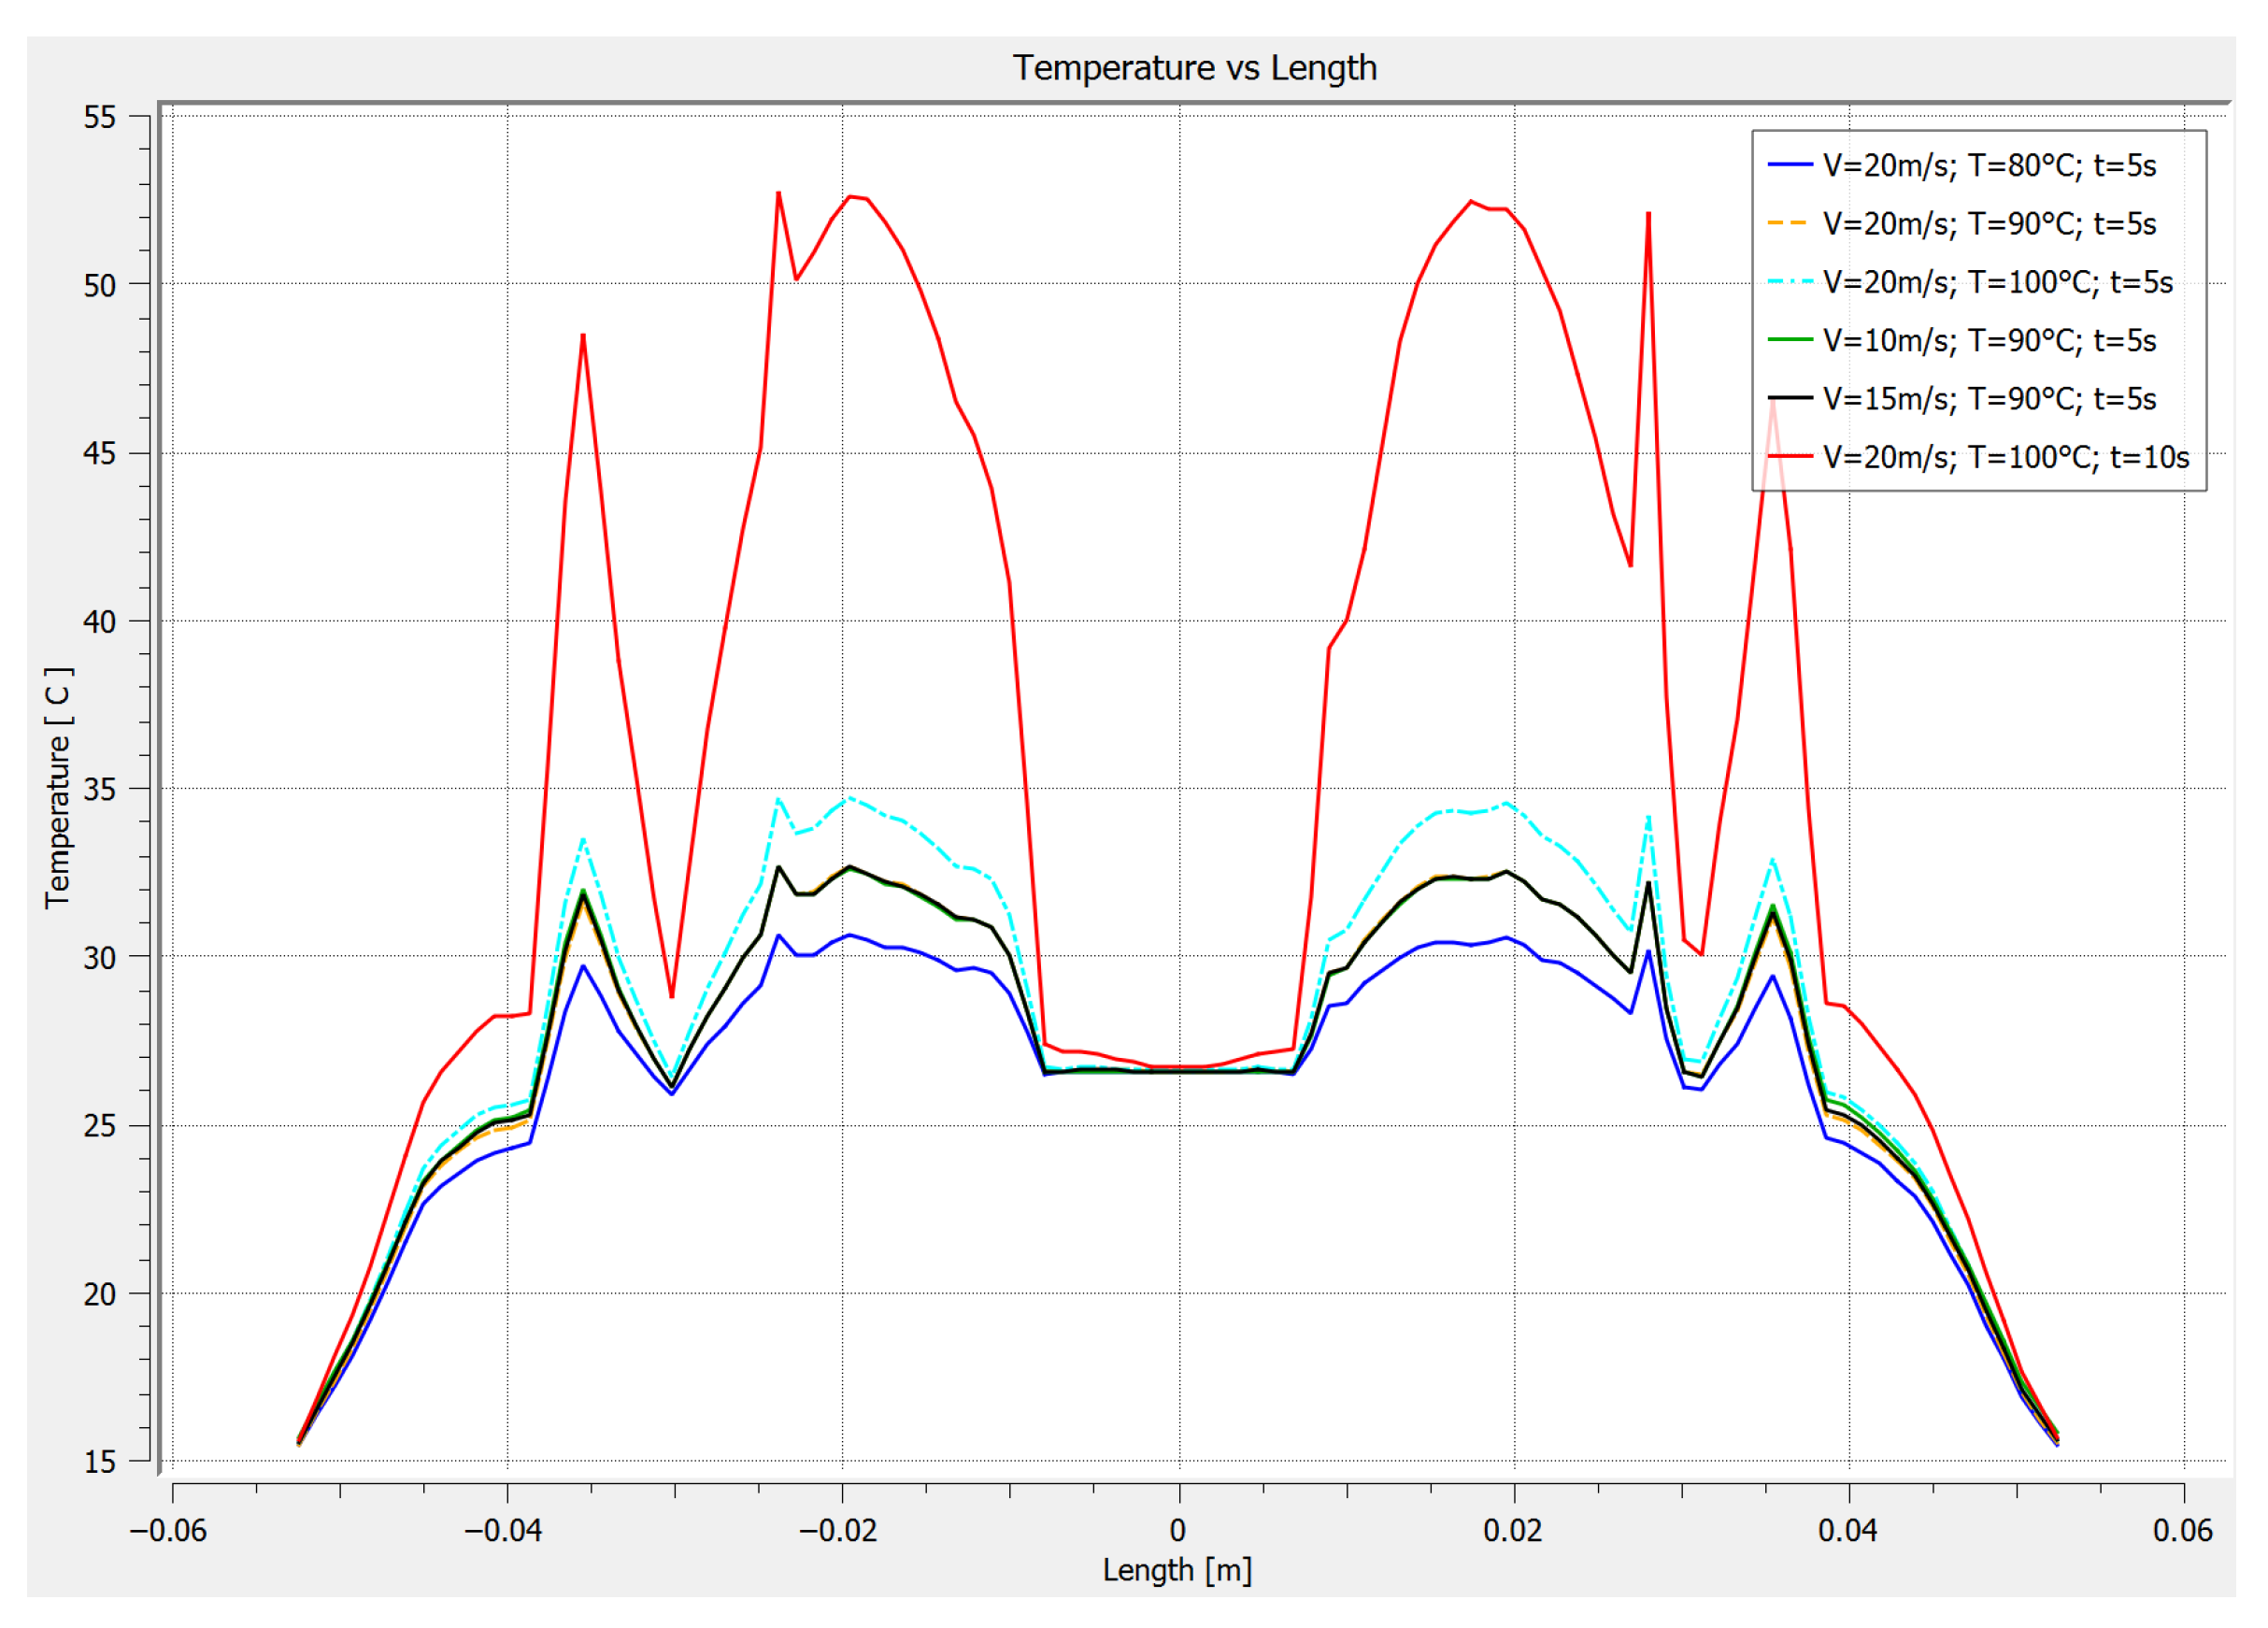
Finally, in Figure 9, the temperature changes are observed for several analysis cases, six in total; the three speeds are compared at a height of 40 mm, also the three temperatures at the base, while the time remains constant in most of the results, the last behavior corresponds to a time of 10 s.
It can be seen that for a time of 5 s and a base temperature of 90 °C, for a height of 40 mm, the temperature does not change, despite the velocity changing from 10 m/s to 15 m/s and 20 m/s. However, when the base temperature changed to 80 °C and 100 °C, the maximum temperatures were 30.59 °C and 34.77 °C, respectively, for the aforementioned height and velocity of 20 m/s. This change represents a 13.66% increase in just 5 s. On the other hand, when analyzed at twice the time, there is an increase of 54.55%, since the temperature reaches 53.74 °C.

4. Conclusions

This study presents a 3D model of a circular heat sink, widely used in computer systems to reject heat generated by motherboards or video cards. However, the velocities and temperatures used are for critical processes, where the system’s lifespan is compromised. ANSYS FLUENT—CFD was used to perform the simulations, using the existing models of the software. The main models used included κ ϵ turbulence and conservation of momentum and energy equations.
The results showed that the exposure time of the heat sink fins to an air stream helped to dissipate heat and temperature more effectively. This was confirmed by simulations at various times, such as 2 s, 5 s, and 10 s. The latter always yielded promising results for heat dissipation.
Because it is a heat sink with circular fins and spaces between them for airflow, the temperature at the center of the heat sink does not change despite prolonged exposure or lower or higher temperatures at the base. However, as the temperature moves away from the center of the heat sink, it begins to change, increasing by up to 54.55%. This concludes that heat rejection with an extended surface area is being achieved.
On the other hand, when dealing with the Velocity of the air that circulates around the heat sink, it can be concluded that it tends to increase on the outside of the fins; however, in the center of the heat sink, the Velocity is reduced, having a maximum value close to 57 m/s and a minimum of 10 m/s. A large difference is noted between these values; this is analyzed as the air flows through a narrow cross section, increasing its velocity.
Finally, it is concluded that the temperature in the heat sink depends on the time and temperature at the base, since it is noted that the temperatures are different as the height of the fins rises; however, the air velocity does not have much influence in the first 5 s. After that, it begins to dissipate heat better when modifying the velocity. However, it is recommended that this study be extended to other forms of fins or that perforations be placed in the fins; the turbulent flow is strengthened and heat dissipation could be improved.
It should be noted that the performance analysis was based on temperature distributions, and the evaluation using normalized parameters such as the Nusselt number or thermal resistance was not included in this computational phase. The implementation of these standard performance metrics is an immediate objective and forms an integral part of the experimental validation phase that follows this work.

Author Contributions

Conceptualization, F.T.-R.; Investigation F.T.-R. and M.G.R.; Data curation, W.D. and F.O.-L.; Formal analysis, F.T.-R. and M.G.R.; Software, F.T.-R.; Validation, F.T.-R. and M.G.R.; Visualization, F.T.-R., F.O.-L. and W.D.; and Writing—original draft, F.T.-R. and M.G.R. All authors have read and agreed to the published version of the manuscript.

Funding

This research received no external funding.

Data Availability Statement

The original contributions presented in this study are included in the article. Further inquiries can be directed to the corresponding author.

Acknowledgments

The authors thank the Salesian Polytechnic University, mechanical engineering major, for the research group Research Group in Engineering, Productivity and Industrial Simulation (GIIPSI) and for the ASHRAE-UPS Branch group for the technical and administrative support provided to the development of this studio.

Conflicts of Interest

The authors declare no conflicts of interest.

References

  1. Haghighi, S.S.; Goshayeshi, H.R.; Safaei, M.R. Natural convection heat transfer enhancement in new designs of plate-fin based heat sinks. Int. J. Heat Mass Transf. 2018, 125, 640–647. [Google Scholar] [CrossRef]
  2. Khalaf-Allah, R.A.; Eid, E.I.; Ellithy, A.E.H.A.; Easa, A.S. Experimental investigation of the influence of modifying the inner tube outer surface on free convection in a concentrated double pipe. Exp. Heat Transf. 2024, 37, 335–355. [Google Scholar] [CrossRef]
  3. Shakeri, H.; Moghadasi, H.; Saffari, H. Experimental parametric study of hierarchical micro/nano electrodeposited (six-step) pattern with respect to volcano-shape morphology in pool boiling performance augmentation. Exp. Heat Transf. 2023, 36, 210–233. [Google Scholar] [CrossRef]
  4. Fuse, H.; Oe, S.; Haga, T. Effects of Fin Height, Base Thickness, Blackening, Emissivity and Thermal Conductivity on Heat Dissipation of Die-Cast Aluminum Alloy Heat Sink. Metals 2025, 15, 696. [Google Scholar] [CrossRef]
  5. Şevik, S.; Özdilli, Ö.; Akbulut, F. Numerical investigation of the effect of different heat sink fin structures on the thermal performance of automotive LED headlights. Int. J. Automot. Sci. Technol. 2022, 6, 17–26. [Google Scholar] [CrossRef]
  6. Mallikarjuna, V.; Rajesh, K.; Ramesh, K.; Reddy, B.R.B. Modeling and Optimization of shape of a Heat Sink Fins on Motherboard. J. Comput. Math. Sci. 2015, 65, 228–251. [Google Scholar]
  7. Zhong, L.; Shi, J.; Li, Y.; Wang, Z. Thermo-Hydrodynamic Features of Grooved Heat Sink with Droplet-Shaped Fins Based on Taguchi Optimization and Field Synergy Analysis. Energies 2025, 18, 3396. [Google Scholar] [CrossRef]
  8. Moustafa, S.; Wei, G.; Hamid, H.; Abd El-Hamid, M. Thermal management of cascaded finned heat sink incorporating phase change material using optimization with multiple objectives approach. Appl. Therm. Eng. 2025, 279, 127735. [Google Scholar] [CrossRef]
  9. Xiong, M.; Wang, N.; Li, W.; Garg, A.; Gao, L. Study on the Heat Dissipation Performance of a Liquid Cooling Battery Pack with Different Pin-Fins. Batteries 2023, 9, 44. [Google Scholar] [CrossRef]
  10. Nilpueng, K.; Ahn, H.S.; Jerng, D.W.; Wongwises, S. Heat transfer and flow characteristics of sinusoidal wavy plate fin heat sink with and without crosscut flow control. Int. J. Heat Mass Transf. 2019, 137, 565–572. [Google Scholar] [CrossRef]
  11. Ebere, I.E.; Khan, A.A.; Ogundahunsi, S.; Ugwuemeaju, E.; Khan, U.A.; Ahmed, S. Design and Optimization of the Heatsink of a Level 1 Electric Vehicle Charger. Energies 2025, 18, 180. [Google Scholar] [CrossRef]
  12. Li, M.; Gao, X.; Li, H.; Ma, Y.; Sang, J.; Xu, T. Effect of curvature ratio on curved microchannel heat sinks. Int. J. Thermofluids 2024, 22, 100635. [Google Scholar] [CrossRef]
  13. Kahbandeh, F.; Azarifar, M.; Arik, M.; Harris, D.K. Numerical simulation of thermal performance of radial manifold microchannel heat sink for electronics thermal management. Therm. Sci. Eng. Prog. 2025, 65, 103930. [Google Scholar] [CrossRef]
  14. Chatterjee, R.; Duryodhan, V.S.; Agrawal, A. Impact of aspect ratio and thermophysical properties on heat transfer behavior in spiral microchannel. Int. J. Therm. Sci. 2022, 172, 107335. [Google Scholar] [CrossRef]
  15. Narendran, G.; Mallikarjuna, B.; Nagesha, B.K.; Gnanasekaran, N. Experimental investigation on additive manufactured single and curved double layered microchannel heat sink with nanofluids. Heat Mass Transf. 2023, 59, 1311–1332. [Google Scholar] [CrossRef]
  16. Singh, A.; Singh, V.; Trivedi, V. Optimization and numerical simulation of heat sink for cooling electronic chip. Int. J. Energy Water Resour. 2025, 9, 1317–1338. [Google Scholar] [CrossRef]
  17. Fattahi, R.; Saidi, M. Numerical investigation of curved shape fins height effect on heat transfer and flow characteristics in open microchannel heat sink. Int. J. Therm. Sci. 2023, 185, 108060. [Google Scholar] [CrossRef]
  18. Ashrafi, M.M.A.; Hosseini, S.M.J.; Ranjbar, A.A.; Pahamli, Y.; Bahrampoury, R. Innovative Disk and Helical Fin Designs for Thermohydrodynamic Enhancement of Minichannel Heat Sinks. Case Stud. Therm. Eng. 2025, 73, 106613. [Google Scholar] [CrossRef]
  19. Mohsen, H.K.; Hamza, N. Investigation of laminar forced convection using a different shape of a heat sink. Al-Qadisiyah J. Eng. Sci. 2022, 15, 73–80. [Google Scholar] [CrossRef]
  20. Yildirim, O.G.; Ozkan, G.M. Enhancement of heat transfer by inclined holes through perforated heat sinks. Int. J. Therm. Sci. 2025, 213, 109810. [Google Scholar] [CrossRef]
  21. Gupta, D.; Saha, P.; Roy, S. Computational analysis of perforation effect on the thermo-hydraulic performance of micro pin-fin heat sink. Int. J. Therm. Sci. 2021, 163, 106857. [Google Scholar] [CrossRef]
  22. Jasim, A.A.; Fazlizan, A.; Azeez, H.L.; Ibrahim, A.; Almaawi, R.; Sopian, K. Enhancing PV Module Performance Through a Novel Fin Heat Sink Design: A Numerical and Experimental Study. Case Stud. Therm. Eng. 2025, 74, 106842. [Google Scholar] [CrossRef]
  23. Djebara, A.; Bessanane, N.; Si-Ameur, M.; Ibrahim, A.; Al-Tarabsheh, A.; Noui, Z.; Azeez, H.L.; Imad ud din, S.; Ishak, A.A. Performance evaluation of a Folded heat sink designs for solar cell Cooling: Numerical study. Therm. Sci. Eng. Prog. 2025, 63, 103724. [Google Scholar] [CrossRef]
  24. Nazzal, I.T.; Salem, T.K.; Al Doury, R.R.J. Theoretical investigation of a pin fin heat sink performance for electronic cooling using different alloys materials. Iop Conf. Ser. Mater. Sci. Eng. 2021, 1094, 012087. [Google Scholar] [CrossRef]
  25. ANSYS. Ansys Fluent Theory Guide; ANSYS Inc.: Canonsburg, PA, USA, 2011; Volume 15317, pp. 724–746. [Google Scholar]
  26. Kosdere, O.; Sert, Z.; Altun, O. Investigation of thermal performance at forced convection in plate-fin heat sink. Energy 2024, 307, 132621. [Google Scholar] [CrossRef]
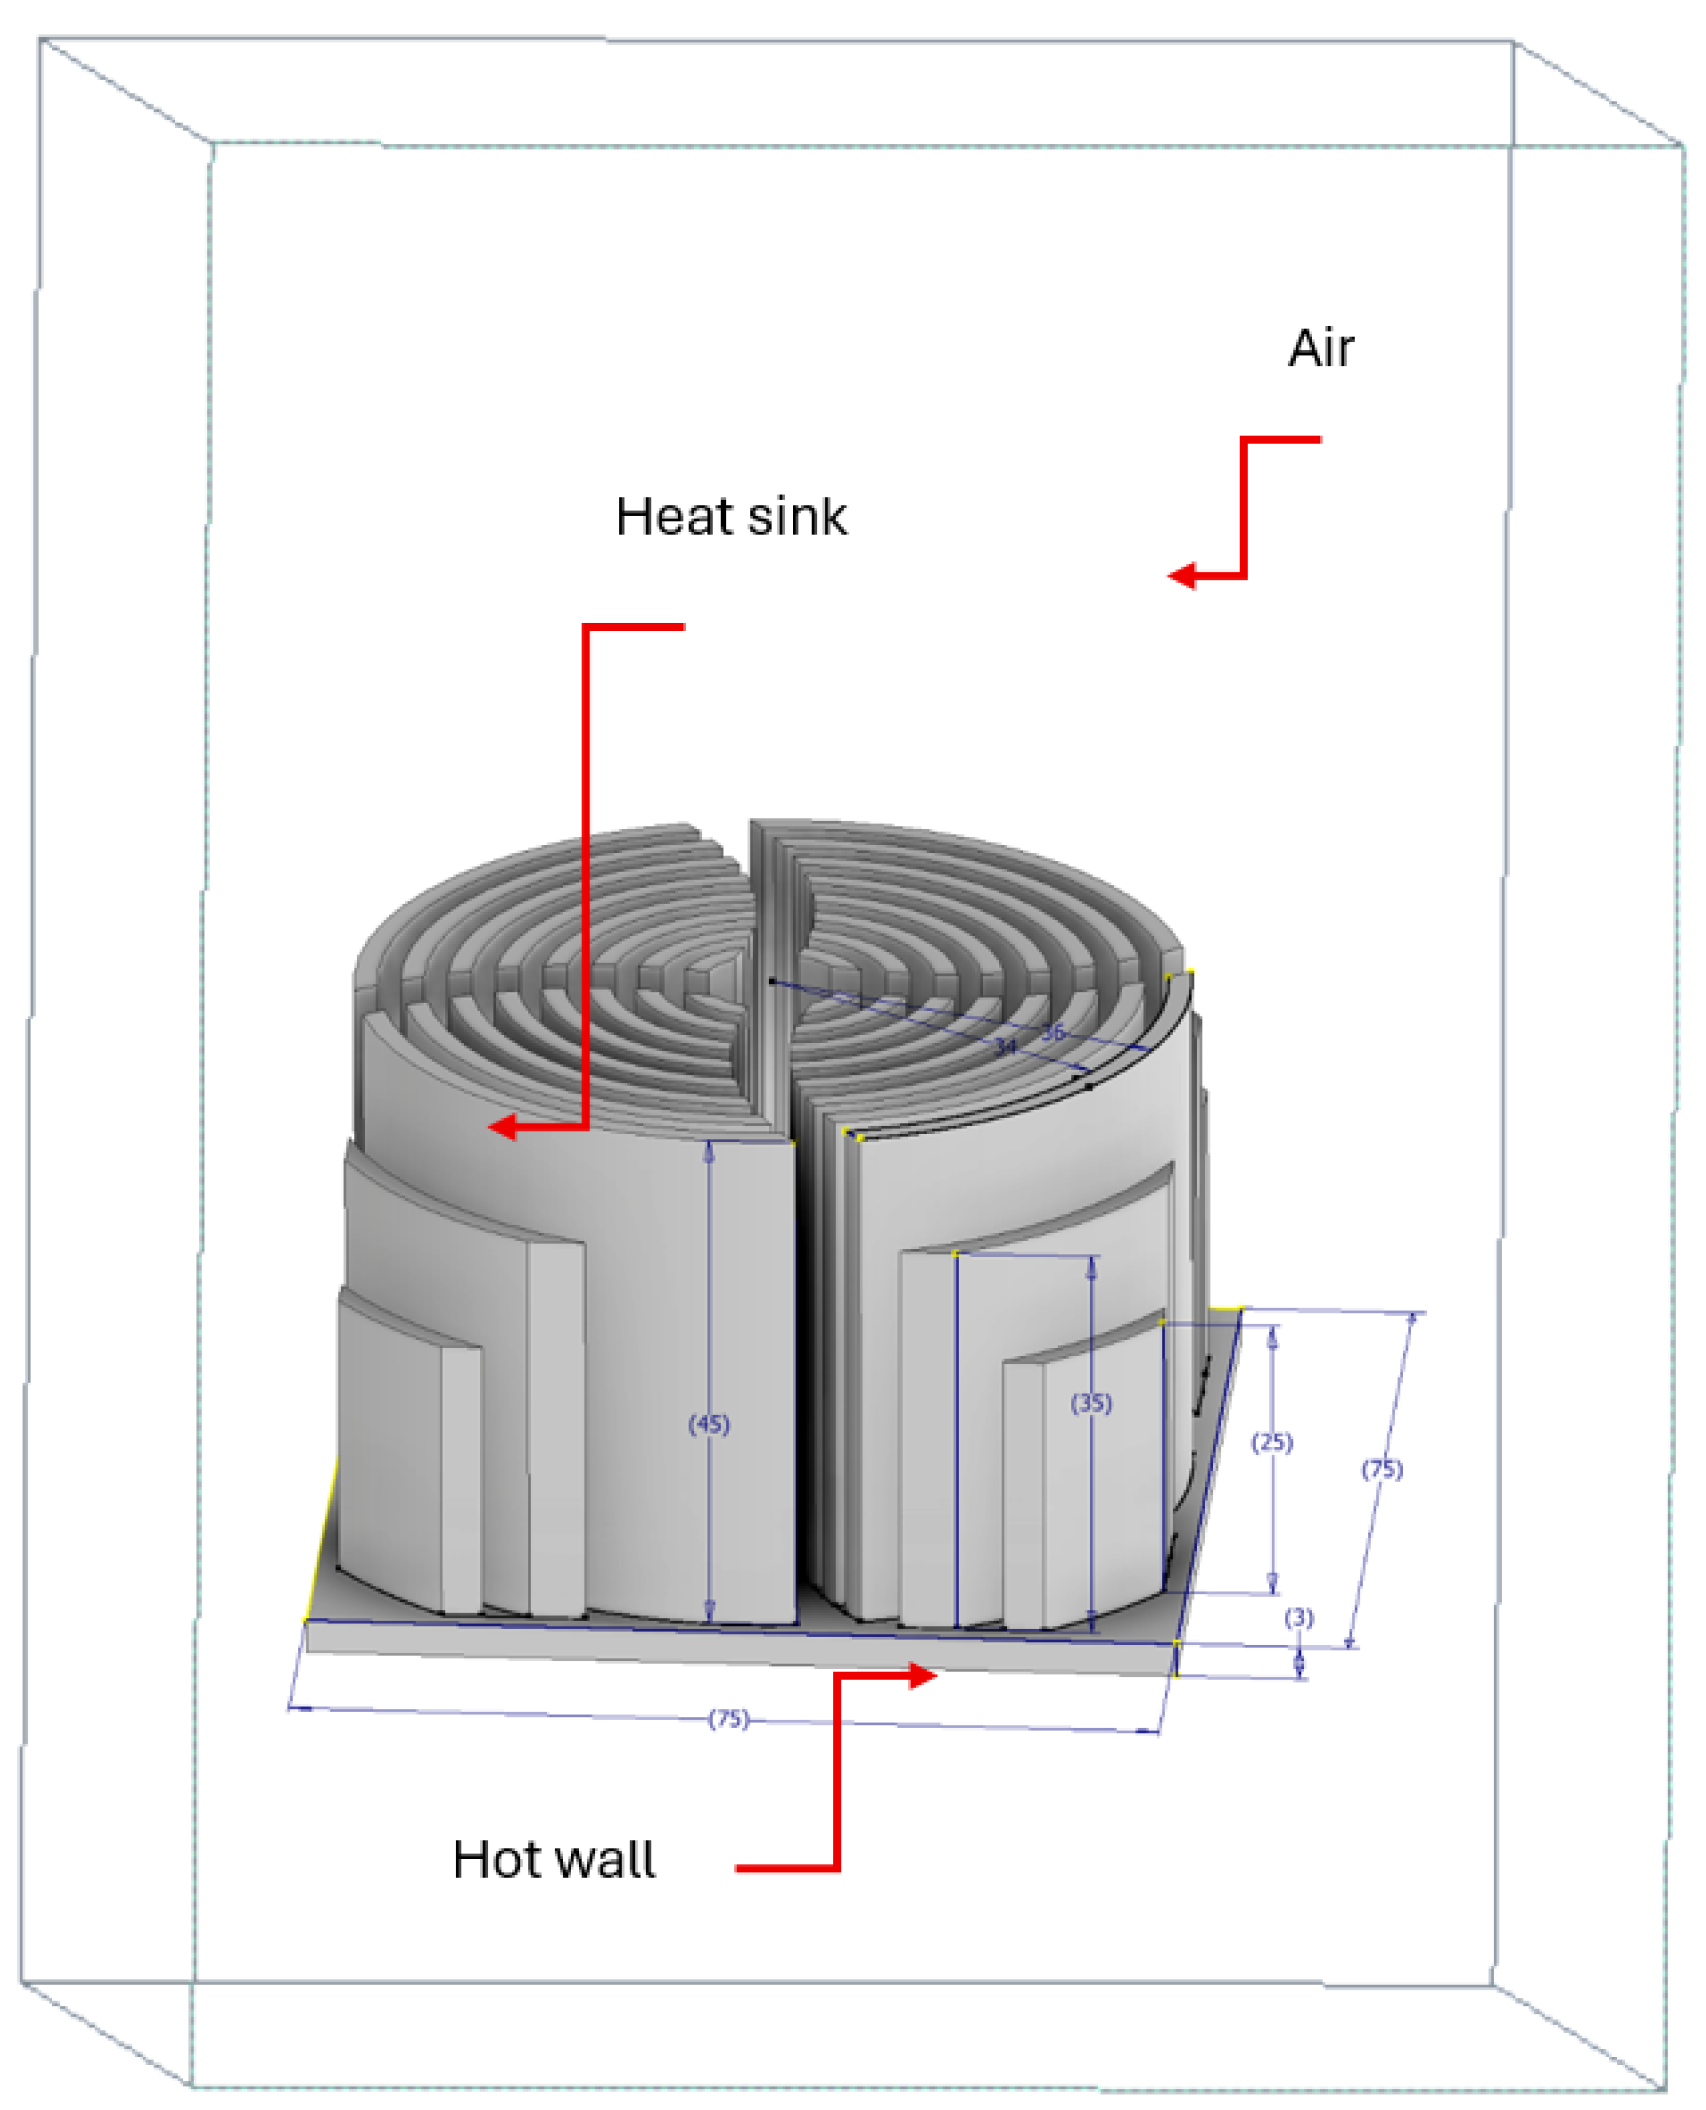
Figure 1. Heat sink with circular fins.
Processes 13 03199 g001
Figure 2. Meshing the heat sink with the surrounding air.
Processes 13 03199 g002
Figure 3. Air velocity around the heat sink, with a base temperature of 80 °C: (a) 10 m/s. (b) 15 m/s. (c) 20 m/s.
Processes 13 03199 g003
Figure 4. Temperature contours at the heat sink: (a) 10 m/s. (b) 15 m/s. (c) 20 m/s (d) Temperature vs. distance graph.
Processes 13 03199 g004
Figure 5. Temperature contours at the heat sink, at 10 s: (a) Temperature of 90 °C and velocity of 10 m/s. (b) Velocity of 15 m/s and a temperature of 90 °C. (c) Velocity of 20 m/s and a temperature of 90 °C. (d) Temperature of 100 °C and a velocity of 10 m/s. (e) Temperature of 100 °C and a velocity of 15 m/s. (f) Temperature of 100 °C and a velocity of 20 m/s.
Processes 13 03199 g005
Figure 6. Temperature are extracted from electronic devices: (a) Temperature of 80 °C and velocity of 10 m/s at 2 s. (b) Temperature of 80 °C and velocity of 10 m/s at 5 s. (c) Temperature of 80 °C and velocity of 10 m/s at 10 s. (d) Temperature across the heat sink distance for the three analysis times.
Processes 13 03199 g006
Figure 7. Temperature change across the circular heat sink, with base temperatures of 90 °C and 100 °C.
Processes 13 03199 g007
Figure 8. Analysis lines, velocity vector and temperature distribution in the heat sink: (a) Analysis heights on the heat sink. (b) Velocity vectors around the heat sink. (c) Hea tsink temperature at two heights and different times.
Processes 13 03199 g008
Figure 9. Temperature at the heat sink at a velocity of 20 m/s, time of 5 s and the three temperatures at the base.
Processes 13 03199 g009
Table 1. Thermal and physical properties of the heat sink.
PropertiesAluminumAir (15 °C)Unit
Density27191.225kg/m3
Specific heat Cp8711006J/kg·K
Thermal conductivity202.40.0247W/m·k
Viscosity-1.082 × 10⁻⁵Pa·s
Table 2. Mesh convergence with number of elements and nodes.
Mesh No.Max. Element Size (mm)Node ElementsAverage (Skewness)
1865,6240.35245
25128,4150.28346
34209,8230.25009
43441,0030.21811
Table 3. Variables used in the study.
Temperature (°C)Velocity (m/s)Time (s)
80102
90155
1002010
Disclaimer/Publisher’s Note: The statements, opinions and data contained in all publications are solely those of the individual author(s) and contributor(s) and not of MDPI and/or the editor(s). MDPI and/or the editor(s) disclaim responsibility for any injury to people or property resulting from any ideas, methods, instructions or products referred to in the content.