Article

Statistical Analysis of Heat Transfer Effects on Flow Patterns Maps in a Flat-Plate Collector/Evaporator with R600a Under Variable Tilt Angles

by
William Quitiaquez
1,*,
Isaac Simbaña
2,
Alex Herrera
1,
Patricio Quitiaquez
1,
César Nieto-Londoño
3,*,
Erika Pilataxi
1,
Anthony Xavier Andrade
4 and
Yoalbys Retirado-Mediaceja
5
1
Productivity and Industrial Simulation Research Group (GIIPSI), Universidad Politécnica Salesiana, Quito 170525, Ecuador
2
Electromechanical Career’s Mechanical Engineering and Pedagogy Research Group (GIIMPCEM), Instituto Superior Universitario Sucre, Quito 170601, Ecuador
3
Grupo de Energía y Termodinámica, Escuela de Ingenierías, Universidad Pontificia Bolivariana, Medellin 050026, Colombia
4
Department of Energy and Refrigerating Air-Conditioning Engineering, National Taipei University of Technology, Taipei 886100, Taiwan
5
Energy Study Center, Universidad de Moa, Holguin 83310, Cuba
*
Authors to whom correspondence should be addressed.
Processes 2025, 13(11), 3419; https://doi.org/10.3390/pr13113419 (registering DOI)
Submission received: 22 September 2025 / Revised: 15 October 2025 / Accepted: 22 October 2025 / Published: 24 October 2025
(This article belongs to the Special Issue Numerical Simulation of Flow and Heat Transfer Processes)

Abstract

This present investigative work proceeds with the statistical study of the heat transfer coefficient (CTC) in the different flow transitions that are formed in a horizontal pipe with variation in the angles of inclination in a collector/evaporator component of a heat pump of solar assisted direct expansion (DX-SAHP) by using R600a refrigerant as working fluid in Quito - Ecuador. The dimensions of the collector/evaporator are 3.8 and 1000 mm inside diameter and length, respectively. To determine the results obtained, five practical tests are carried out with inclination angles of 10, 20, 30, 40 and 45°, with speeds or mass flows that vary between 203.24 and 222.28 kg·m−2·s−1, the heat fluxes reached values between 200.58 and 507.23 W·m−2. The correlations proposed by Kattan, Kundu, and Mohseni, and the experimental data were considered for the analysis of the effects of heat transfer on flow patterns. The results obtained from the investigation show that the maximum CTC is 6163.83 W·m−2·K−1 with an inclination angle of 45°. Statistical analysis was performed considering the direction of Pearson presented results that for the angle of inclination of 10° a greater inverse direction of −0.316 is obtained.

1. Introduction

Refrigerants containing chlorine atoms in their chemical composition have the effect of weakening the ozone layer. In recent decades, hydrofluorocarbon (HFC) refrigerants have been gradually phased out, and initiatives have been launched to replace HFCs with hydrocarbons or other more environmentally friendly fluids [1]. The refrigerant R600a is a hydrocarbon that has been used as an alternative refrigerant in recent years [2]. Mota et al. [3] state in their research that European Union (EU) Regulation 517/2014 of the European Parliament and of the Council banned the use of HFCs in the most widely used types of heat pumps, refrigeration, and air conditioning, because recent research shows that refrigerants of this class are harmful to the planet and to living beings. In recent years, there has been a growing need to improve inefficient methods of obtaining thermal energy from renewable sources to meet industrial and typical heat transfer system needs, which can be addressed by DX-SAHP due to its adequate performance in the thermal energy transfer process [4].
Research on the effect of inclination angles on CTC in two-phase fluids in horizontal pipes has been conducted over the last few years, as in the case of Adelaja et al. [5], Isakhani Zakaria et al. [6], Cao et al. [7], Shah [8], Dong and Hibiki [9], and Mohseni and Akhavan-Behabadi [10], have presented correlations for determining CTC in their research. In the experimental study conducted by Mohseni and Akhavan-Behabadi [10] on the CTC of boiling R134a in a horizontal pipe with an internal diameter of 8.9 mm, with a mass velocity between 53 and 170 kg·m−2·s–1 and with angle variations between −90 and +90°. They observed that with a mass velocity of 107 kg·m−2·s–1, quality of 0.7, and an inclination angle of 60°, the CTC reaches values of 2100 W·m−2·K−1.
Mohseni and Akhavan-Behabadi [10] present the results obtained in the analysis of the CTC of an R134a refrigerant, with variations in the angles of inclination between −90 and +90° at intervals of 30°, during the boiling process inside a smooth pipe with an inner diameter of 8.9 mm, refrigerant mass velocities between 53 and 170 kg·m−2·s–1, heat fluxes between 2.1 and 5.3 kW·m−2, vapor quality between 0.1 and 0.9, the results indicate that with an inclination angle of 60°, a CTC of 1800 W·m−2·K−1 is obtaining, and with an angle of 30°, a CTC of 1600 W·m−2·K−1 is obtaining.
In the analysis carried out by Allymehr et al. [11] on local CTC and flow patterns during the boiling of R600a inside a small horizontal tube with an internal diameter of 1.0 mm, with a mass velocity between 240 and 480 kg·m−2·s−1, a saturation temperature of 25 °C, and heat fluxes between 5 and 60 kW·m−2, observed that the flow patterns are related to the CTC. As the mass velocity increases from 250 to 480 kg·m−2·s−1, the CTC increases from 3 to 11 kW·m−2·K−1, in addition to the modification of the type of flow transition that is generated in this case, giving rise to the appearance of annular flow.
Dong and Hibiki [9] study heat transfer modeling for upward two-phase flow in inclined pipes, through a compilation of information and based on a concept of analogy by Chilton -Colburn analogy concept, they were able to corroborate that when comparing the correlations, none could satisfactorily predict the information gathered, and they proposed a new CTC correlation, which could predict 95% of the experimental data within an error of ±30%, with a mean absolute relative deviation of 12.9%.
Akhavan-Sun et al. [12], in their research on heat transfer during the evaporation of refrigerant R134a inside a microfine helical tube for seven angles of inclination in a range between −90° and +90° and four mass velocities between 25 and 136 kg·m−2·s−1, with a vapor quality of 0.95, the CTCs of the inclined tube considering an inclination angle of −30° are 24% and 13% higher than those of the tube inclined at −90°, respectively. Furthermore, for all inclination angles, the CTC increases with increasing quality, up to a steam quality close to 85% when it begins to decrease due to drying.
Fazelnia et al. [13] presented research on CTC by two-phase flow evaporation of refrigerants R134a and R407C in a smooth copper tube with inclination angles between 0 and 90°, mass velocities between 100 and 300 kg·m−2·s−1, heat flux range between 3 and 10 kW·m−2, inlet temperature between 5 and 9 °C, and vapor quality between 0.1 and 0.9. They observed that the CTC of the R134a fluid, with a mass velocity of 100 kg·m−2·s−1, an inclination angle of 60°, a heat flux of 4.5 kW·m−2, and a quality of 0.7, is 3300 W·m−2·K−1, higher than the R407C refrigerant mixture, which under the same conditions has a CTC of 800 W·m−2·K−1, noting that the heat coefficient of R134a is higher than that of R407C for all the heat flows per unit area mentioned above.
Anandakumar & Palaniradja [14] present the results of an experimental study on heat transfer during the evaporation of R134a refrigerant inside a corrugated tube with different angles of inclination between −90 and +90° and four mass velocities of 6, 81, 110, and 136 kg·m−2·s−1, observed that in the low vapor quality region between 0.2 and 0.4, the CTC for the +90° inclined tube is approximately 2300 W·m−2·K−1 and for an inclination angle of −90° it is 2000 W·m−2·K−1. Adelaja et al. [5] analyzed the transfer of heat energy during the boiling of refrigerant R245fa in a circular pipe with an internal diameter of 1.6 mm. The results obtained indicate that with an inclination of 45° and a quality of 0.54, the heat transfer coefficient is 3400 W·m−2·K−1. Furthermore, under these conditions, the predominant flow is annular.
In their research, Jalajakshi and Myna [15] describe numerous potential data analysis approaches that help examine the influence of quantitative statistical measures on data collection and optimization, data interpretation, data processing, and data modeling. They suggest that the total data to be analyzed should be provided as follows: 60% in preparation, 20% in evaluation, and 20% in research, to achieve better research results. Datasets are created daily with relevant characteristics and more accurate information about the human environment [16]. Although machine learning algorithms have existed since the 1950s, their initial impact has been insignificant. With the increase in data availability and computing power since 2000, machine learning tools and algorithms have been making advances in a wide variety of areas [17].
Ritvik Voleti [18] highlights that, because of his research, data processing is one of the most important steps and that it consumes between 50 and 80% of data analysis time. In addition, Faiz et al. [19] mention that care must be taken with data quality, as it has become increasingly important since 2008. In the research conducted by Jaeger and Rasmussen [20], in which they analyze the importance of data preparation in written responses to open-ended questions in an empirical evaluation and comparison with manual coding, the sample sizes are 500, 1000, 2000, and 4341. Using the parametric test (ANOVA), they determined that the sample with the highest level of significance is n = 500 with 39.3%. Rodríguez [21] states that the normality test in the study of a data set involves specific statistical tests to verify that the data follow a normal distribution, the best known tests being the Shapiro–Wilk test and the Kolmogorov–Smirnov test. In addition, box plots show the distribution of the data analyzed in quartiles of 25, 50, and 75%. In his research, he shows that his data analysis is between 68 and 73%.
Significance and hypothesis testing are tools used in inference, where if the p value is small, Fisher suggests modifying the statements about the truth of H (Hypothesis). The hypothesis is a decision-making tool that allows us to limit the risks of taking the wrong actions. In the significance test process, the exact value of p must be reported and compared with a significance level of 0.05, with a 95% confidence level [22]. In the research conducted by Carazo-Díaz & Prieto-Valiente [23] on the importance of the hypothesis in the p-value of a proportion of analyzed data, with a significance level of 0.05, they obtained a value of 98% between the actual data and the significant results.
The objective of this research is to analyze the heat transfer effects on flow pattern maps in a flat-plate collector/evaporator with R600a under variable tilt angles. This paper presents the results obtained from both descriptive and inferential statistical analysis of a hydrocarbon refrigerant, which is used as the working fluid in a DX-SAHP with tilt angles of 10, 20, 30, 40, and 45°. In addition, Mohseni et al. [24] show the effect of inclination angles, mass velocities, and heat fluxes on CTC using the proposed correlation. It also shows the effect of tilt angles, mass velocities, and heat fluxes on the CTC using the correlation proposed.

2. Materials and Methods

In the quest for continuous improvement of different industrial processes, the study of data through statistical science currently plays a very important role in the evolution of processes, as well as in the search for new, environmentally friendly energy sources. Flat plate collectors/evaporators with natural refrigerant as the working fluid are a clear example of this and have been introduced into industry as replacements for conventional ones. The working fluid in these collectors undergoes a transformation from liquid to vapor, and the collected solar energy manifests itself as the latent heat of vaporization. Figure 1 shows a schematic diagram of a DX-SAHP system, considering the pressure (P) and temperature (T). DX-SAHP systems mainly consist of an evaporator, compressor, condenser, and expansion device. In the equipment, a flat-plate solar collector is integrated into a heat pump. The refrigerant flows through the solar collector, where it changes from liquid to vapor as it absorbs solar thermal energy [25].

2.1. Collector/Evaporator

In the statistical study of the influence of CTC on flow zones, a collector/evaporator that is part of a DX-SAHP [25] is used. The main characteristics of the collector/evaporator used for the respective tests are: 3.8 mm inner diameter, 1000 mm pipe length, 223,400 mm2 collector cross-sectional area, 223.4 mm collector width, and 1000 mm collector length [26]. Variations in the angle of inclination between 10 and 45°, and the angle of 10° was considered as the base. Five tests are planned with different angles of inclination and their respective quantitative variables, as can be seen in Table 1. The data will serve as a basis for obtaining the CTC and the flow maps with their transition zones.
It should be noted that one of the limitations encountered during the research was the variation in solar radiation due to the location.

2.2. Correlation

For the numerical analysis of the CTC, this research adopts the correlation proposed by Mohseni and Behabadi [10]. In addition, the correlations presented by Kattan et al. [27], Wojtan et al. [28] and Rajabi et al. [29] propose sets of equations to determine the different limits of flow zone transitions in horizontal pipes with varying angles of inclination. Quitiaquez et al. [25] demonstrates the application of the equations and the results of the flow pattern maps.

2.2.1. Mohseni and Behabadi

Mohseni and Behabadi [10] present the CTC analysis in a smooth pipe with R134a refrigerant, with a variation in the angle of inclination between −90 and +90°. They present the result that with a quality of 0.65 and an angle of inclination of 60°, the CTC is 2500 W·m−2·K−1. The correlation by Mohseni and Behabadi [10] presents a set of equations for determining the CTC in a pipe with varying inclination angles, which is detailed below.

2.2.2. Equation for Heat Transfer Coefficient

The CTC is determined using Equation (1), which shows that quality and density are factors that influence the CTC [30,31].
h = 0.55 · h f m · 1 + 3000 · B o 0.86 + 1.12 · x 1 x 0.7 · ρ L ρ v 0.41 · F α 0.48
To find the internal CTC value, several variables are involved, such as the CTC film (hfm), boiling number (Bo), condition factor (Fα), liquid density ( ρ L ), vapor density ( ρ v ), and quality (x). Equation (2) shows that determining the value of hfm depends on several fluid properties, such as thermal conductivity (kL), diameter (D), mass velocity (GA), quality, and Prandtl number (PrL) [31].
h f m = 0.023 · G A · 1 x · D i u L 0.9 · Pr L 0.4 · k L D
However, to determine the condition factors, Equations (3) and (4) can be used. To apply Equation (3), the condition that the quality must be less than 0.7 must be considered [32].
F α = 1 + 0.5 · 1 x 0.6 · s e n α f o r x 0.7
Conversely, if the quality is greater than 0.7, the following equation should be applied [32].
F α = 1 + 0.2 · x 1.2 · cos α + 15 f o r x > 0.7
The boiling number is determined by the mass velocity, heat flux (q), and enthalpy of vaporization (Δhv) and is calculated as follows [33].
B o = q G A · Δ h v

2.3. Statistical Analysis

Statistical analysis involves scientific methods that enable the collection and organization of data sets, which are then analyzed to draw legitimate conclusions for reasonable decision-making based on the analysis. These conclusions can be compared using statistical tests, as well as measures of central tendency, measures of distribution, graphical methods, and other techniques [34].

Statistical Tests

One of the fundamental parts of decision theory is the analysis of statistical tests, which use a sample to estimate the characteristics of a defined population. There are several types of statistical tests, including three types: conformity, homogeneity, and relationship [35,36]. In this research, the Pearson statistical test will be used to determine whether the variation in the angle of the pipe has an impact or is significant in determining the CTC (View Table 2).

3. Results and Discussion

3.1. Heat Transfer Coefficient

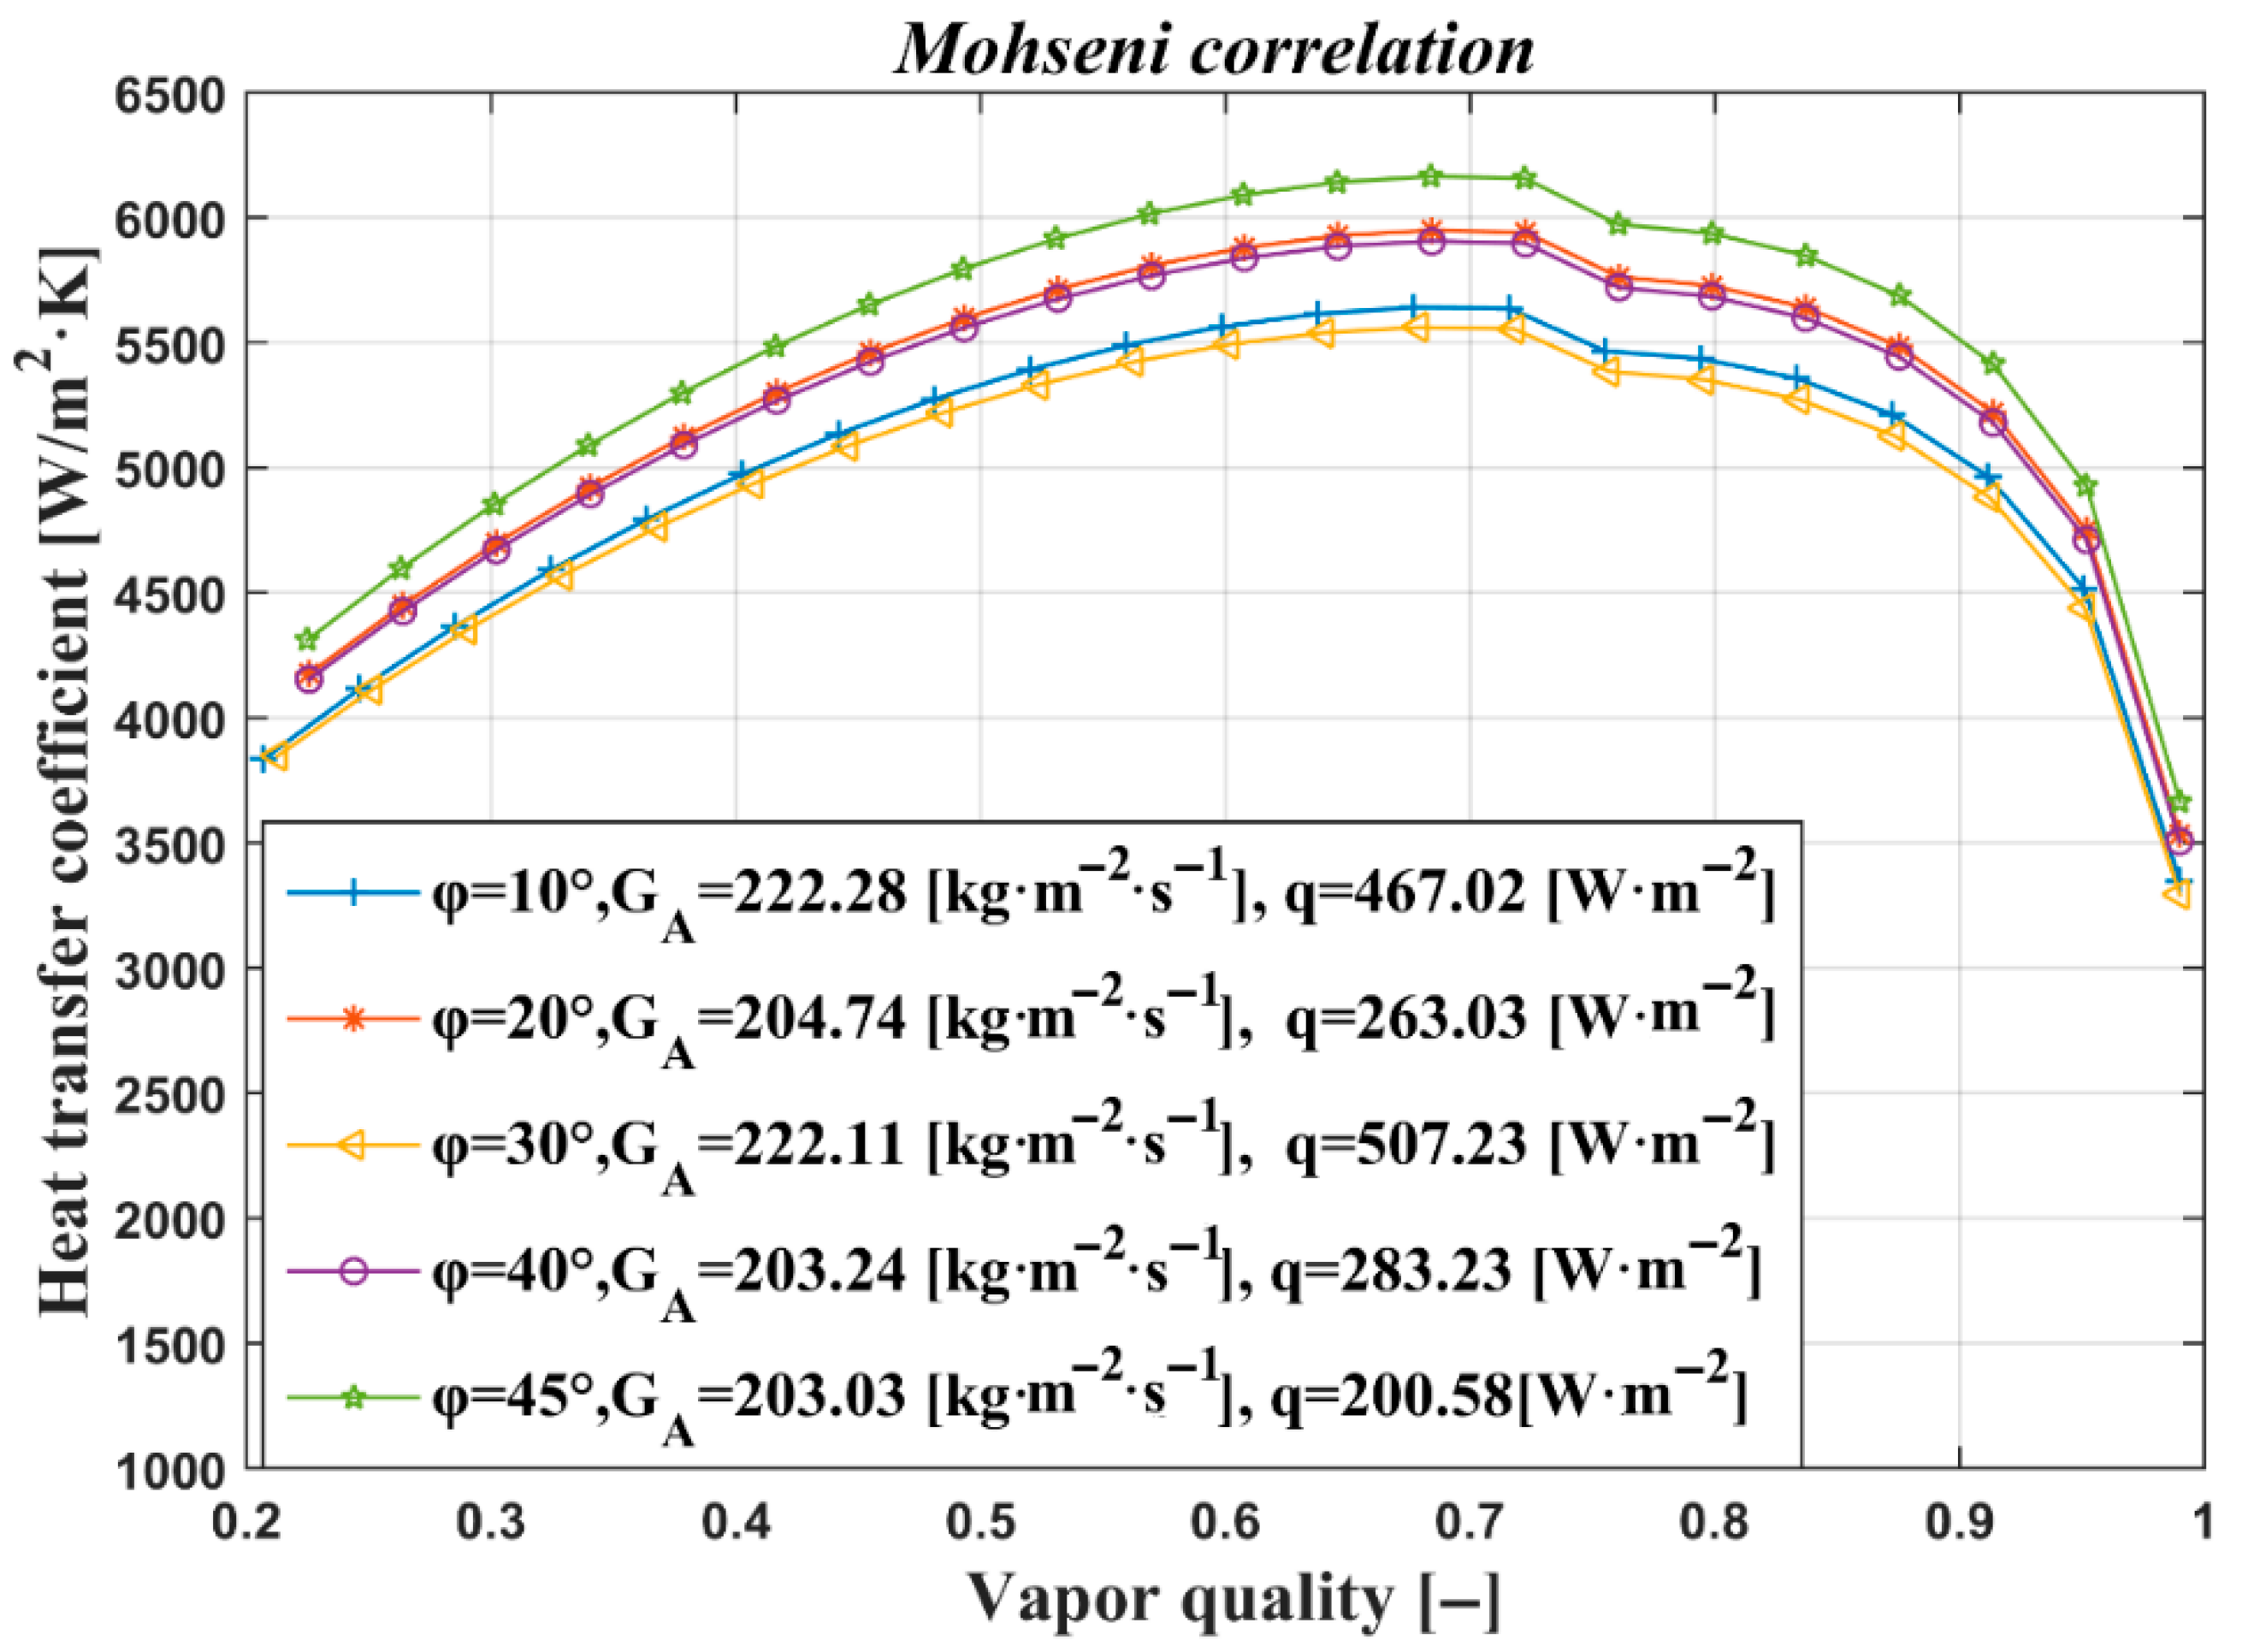
The effect of inclination angles, saturation temperature, and mass velocities on the CTC using the correlation of Moghadam et al. [24] is shown in Figure 2, it should be noted that the calculations were performed using EES: Engineering Equation Solver; where the line of the highest CTC is at an angle of 45°, with a mass velocity of 203.03 kg·m−2·s−1 and a heat flux of 200.58 W·m−2, the highest peak of the CTC line is between values of 6000 and 6300 W·m−2·K−1. On the other hand, the peak of the lowest curve occurs between values of 5500 and 5700 W·m−2·K−1 with an angle of 30°, which has a high heat flux of 507.23 W·m−2 and a mass velocity of 222.11 kg·m−2·s−1. For all curves, the CTC increases as the steam quality increases, reaching approximate values between 70 and 73%. From this point, the curve begins to fall until it reaches values lower than the initial ones: approximately 3700 and 3300 W·m−2·K−1 for angles of 45 and 30°, respectively.
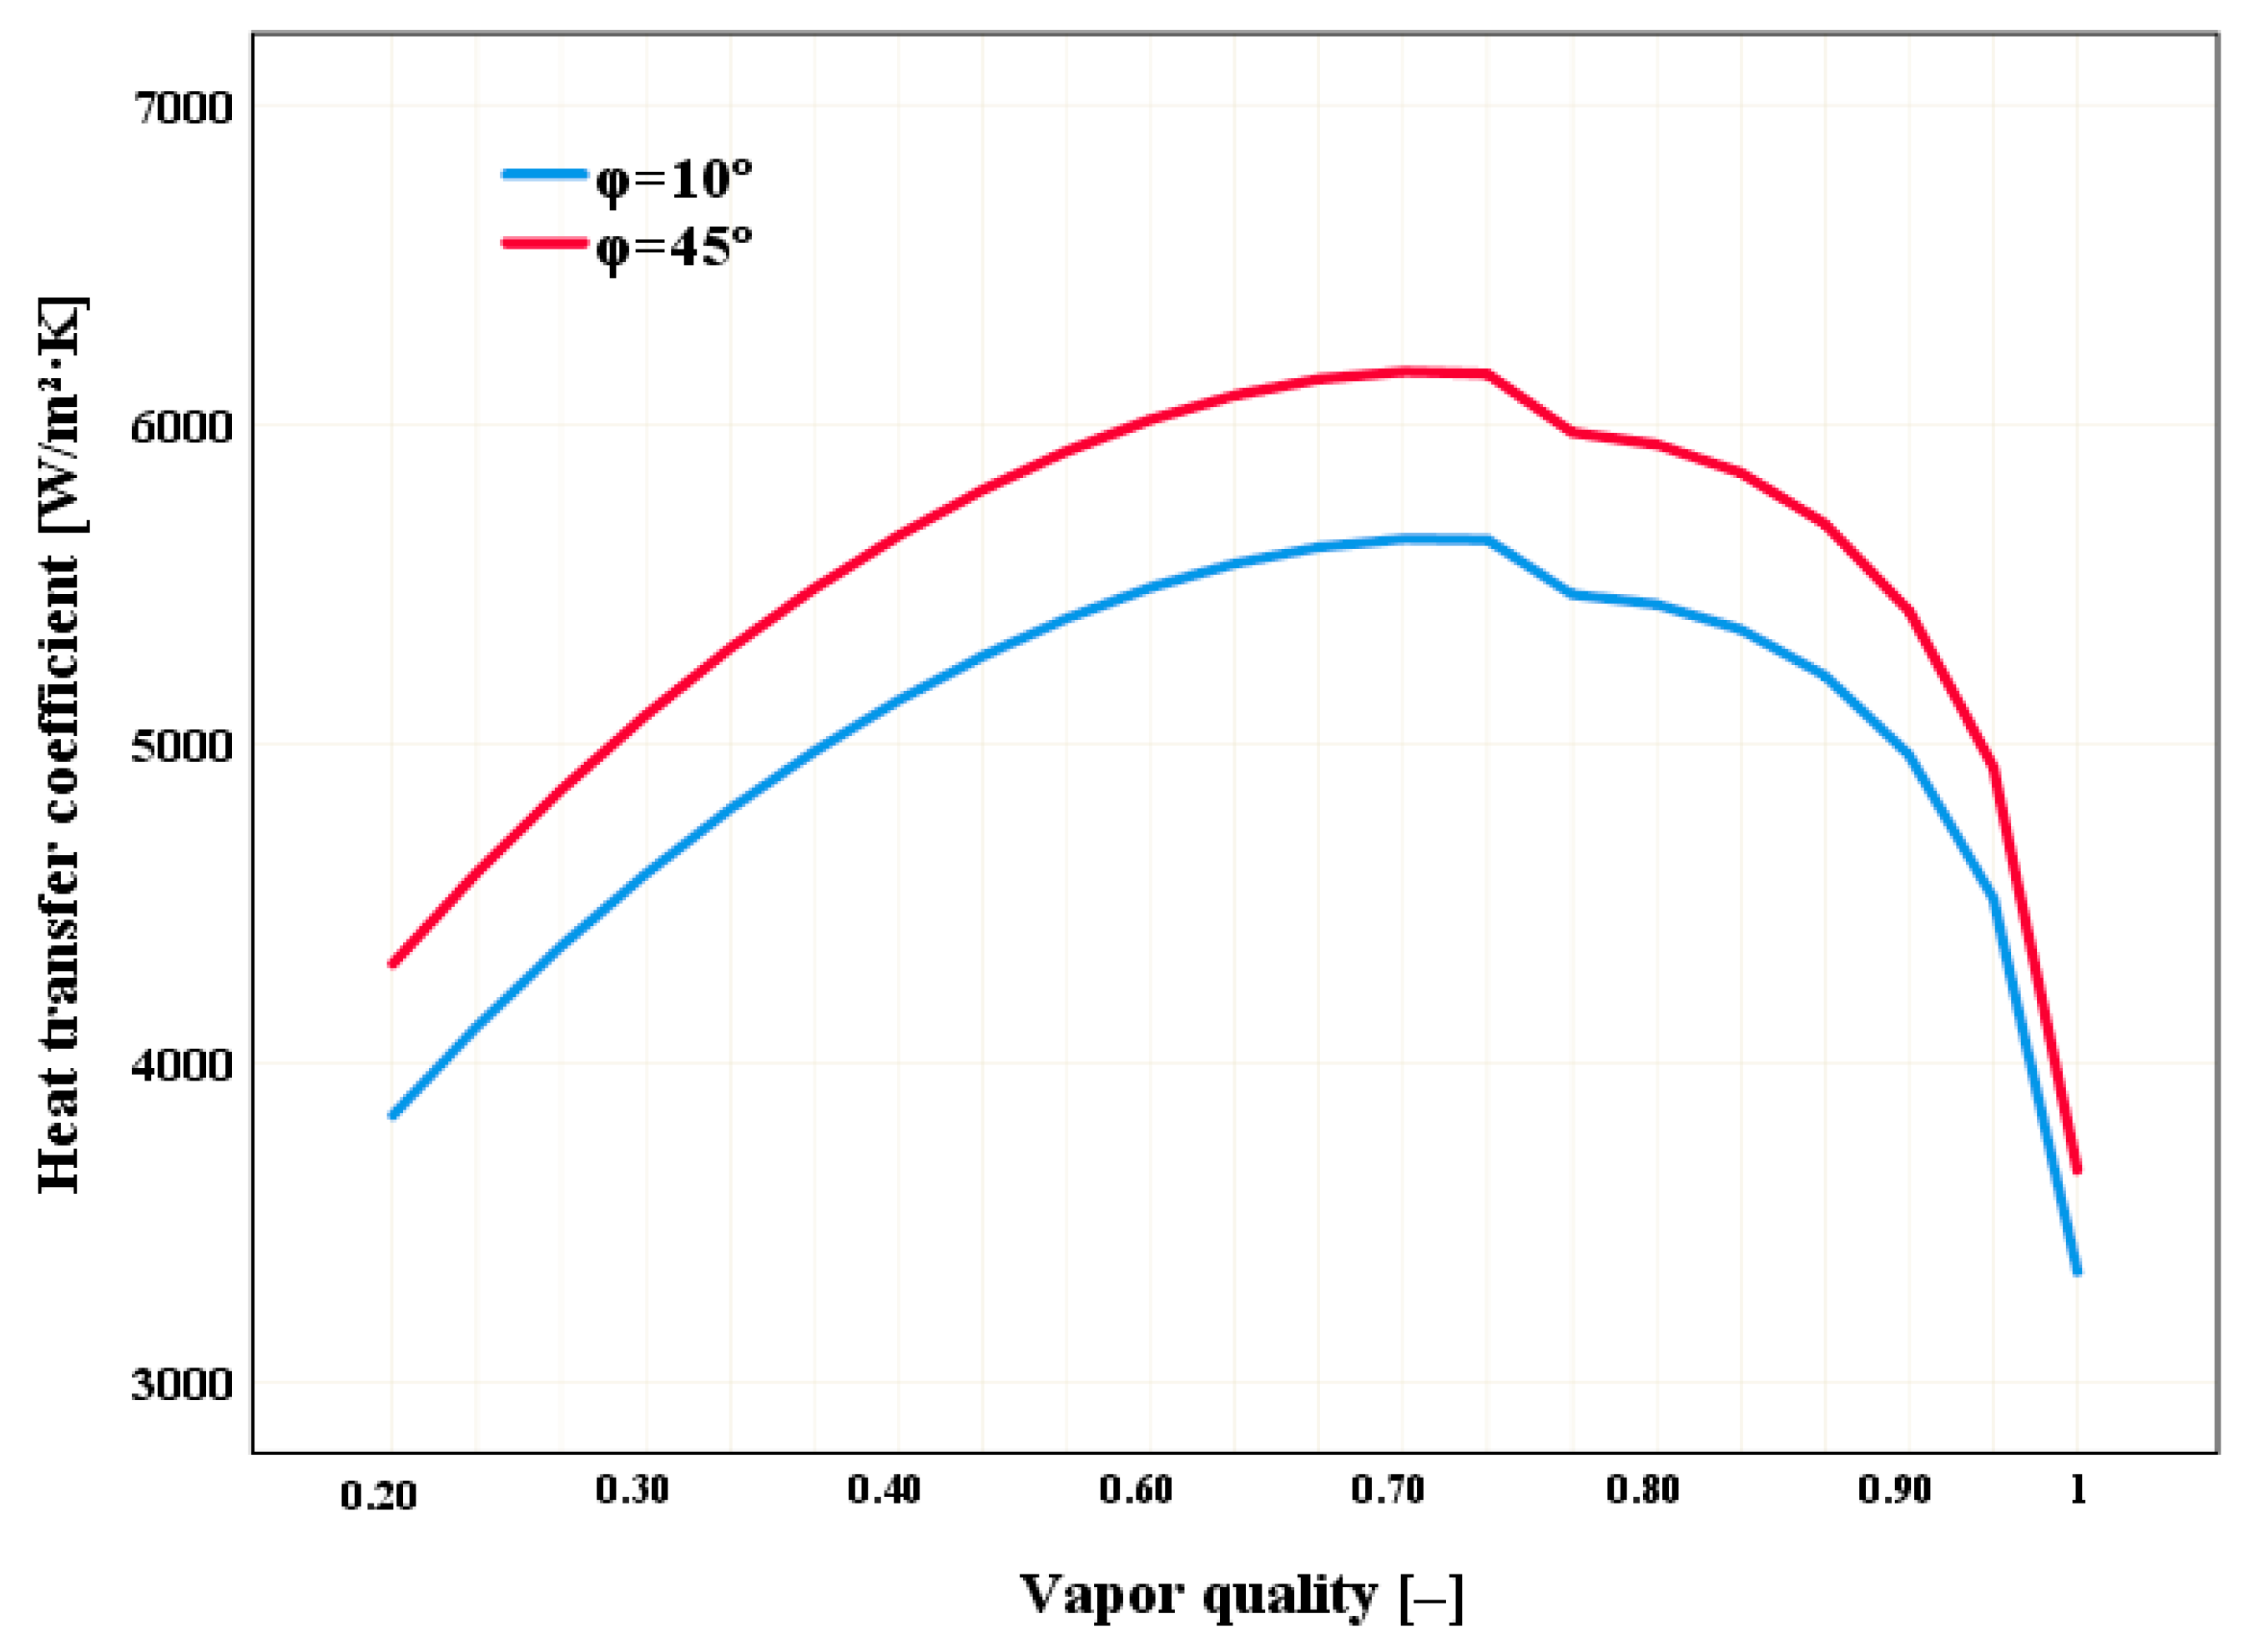
To identify the variation produced by the effect of inclination angles on the CTC, curves are plotted with angles of 10 and 45°, which are the minimum and maximum values, respectively, presented in this research and shown in Figure 3, where the CTC with an angle of 45° is greater than the angle of 10° throughout the entire steam quality line and has an approximate peak of 6200 W·m−2·K−1. For both angles, the CTC lines show the same trends, and it can be observed that the angles influence the increase in CTC. This analysis emphasizes how important it is to take inclination into account when designing and optimizing thermal systems since geometrical variations can have a significant impact on the coefficient of transference of heat. Furthermore, the similarity in curves suggests that, even while the angle affects the CTC magnitude, the system’s overall behavior remains consistent, which could make it easier to predict and model under various operating conditions.
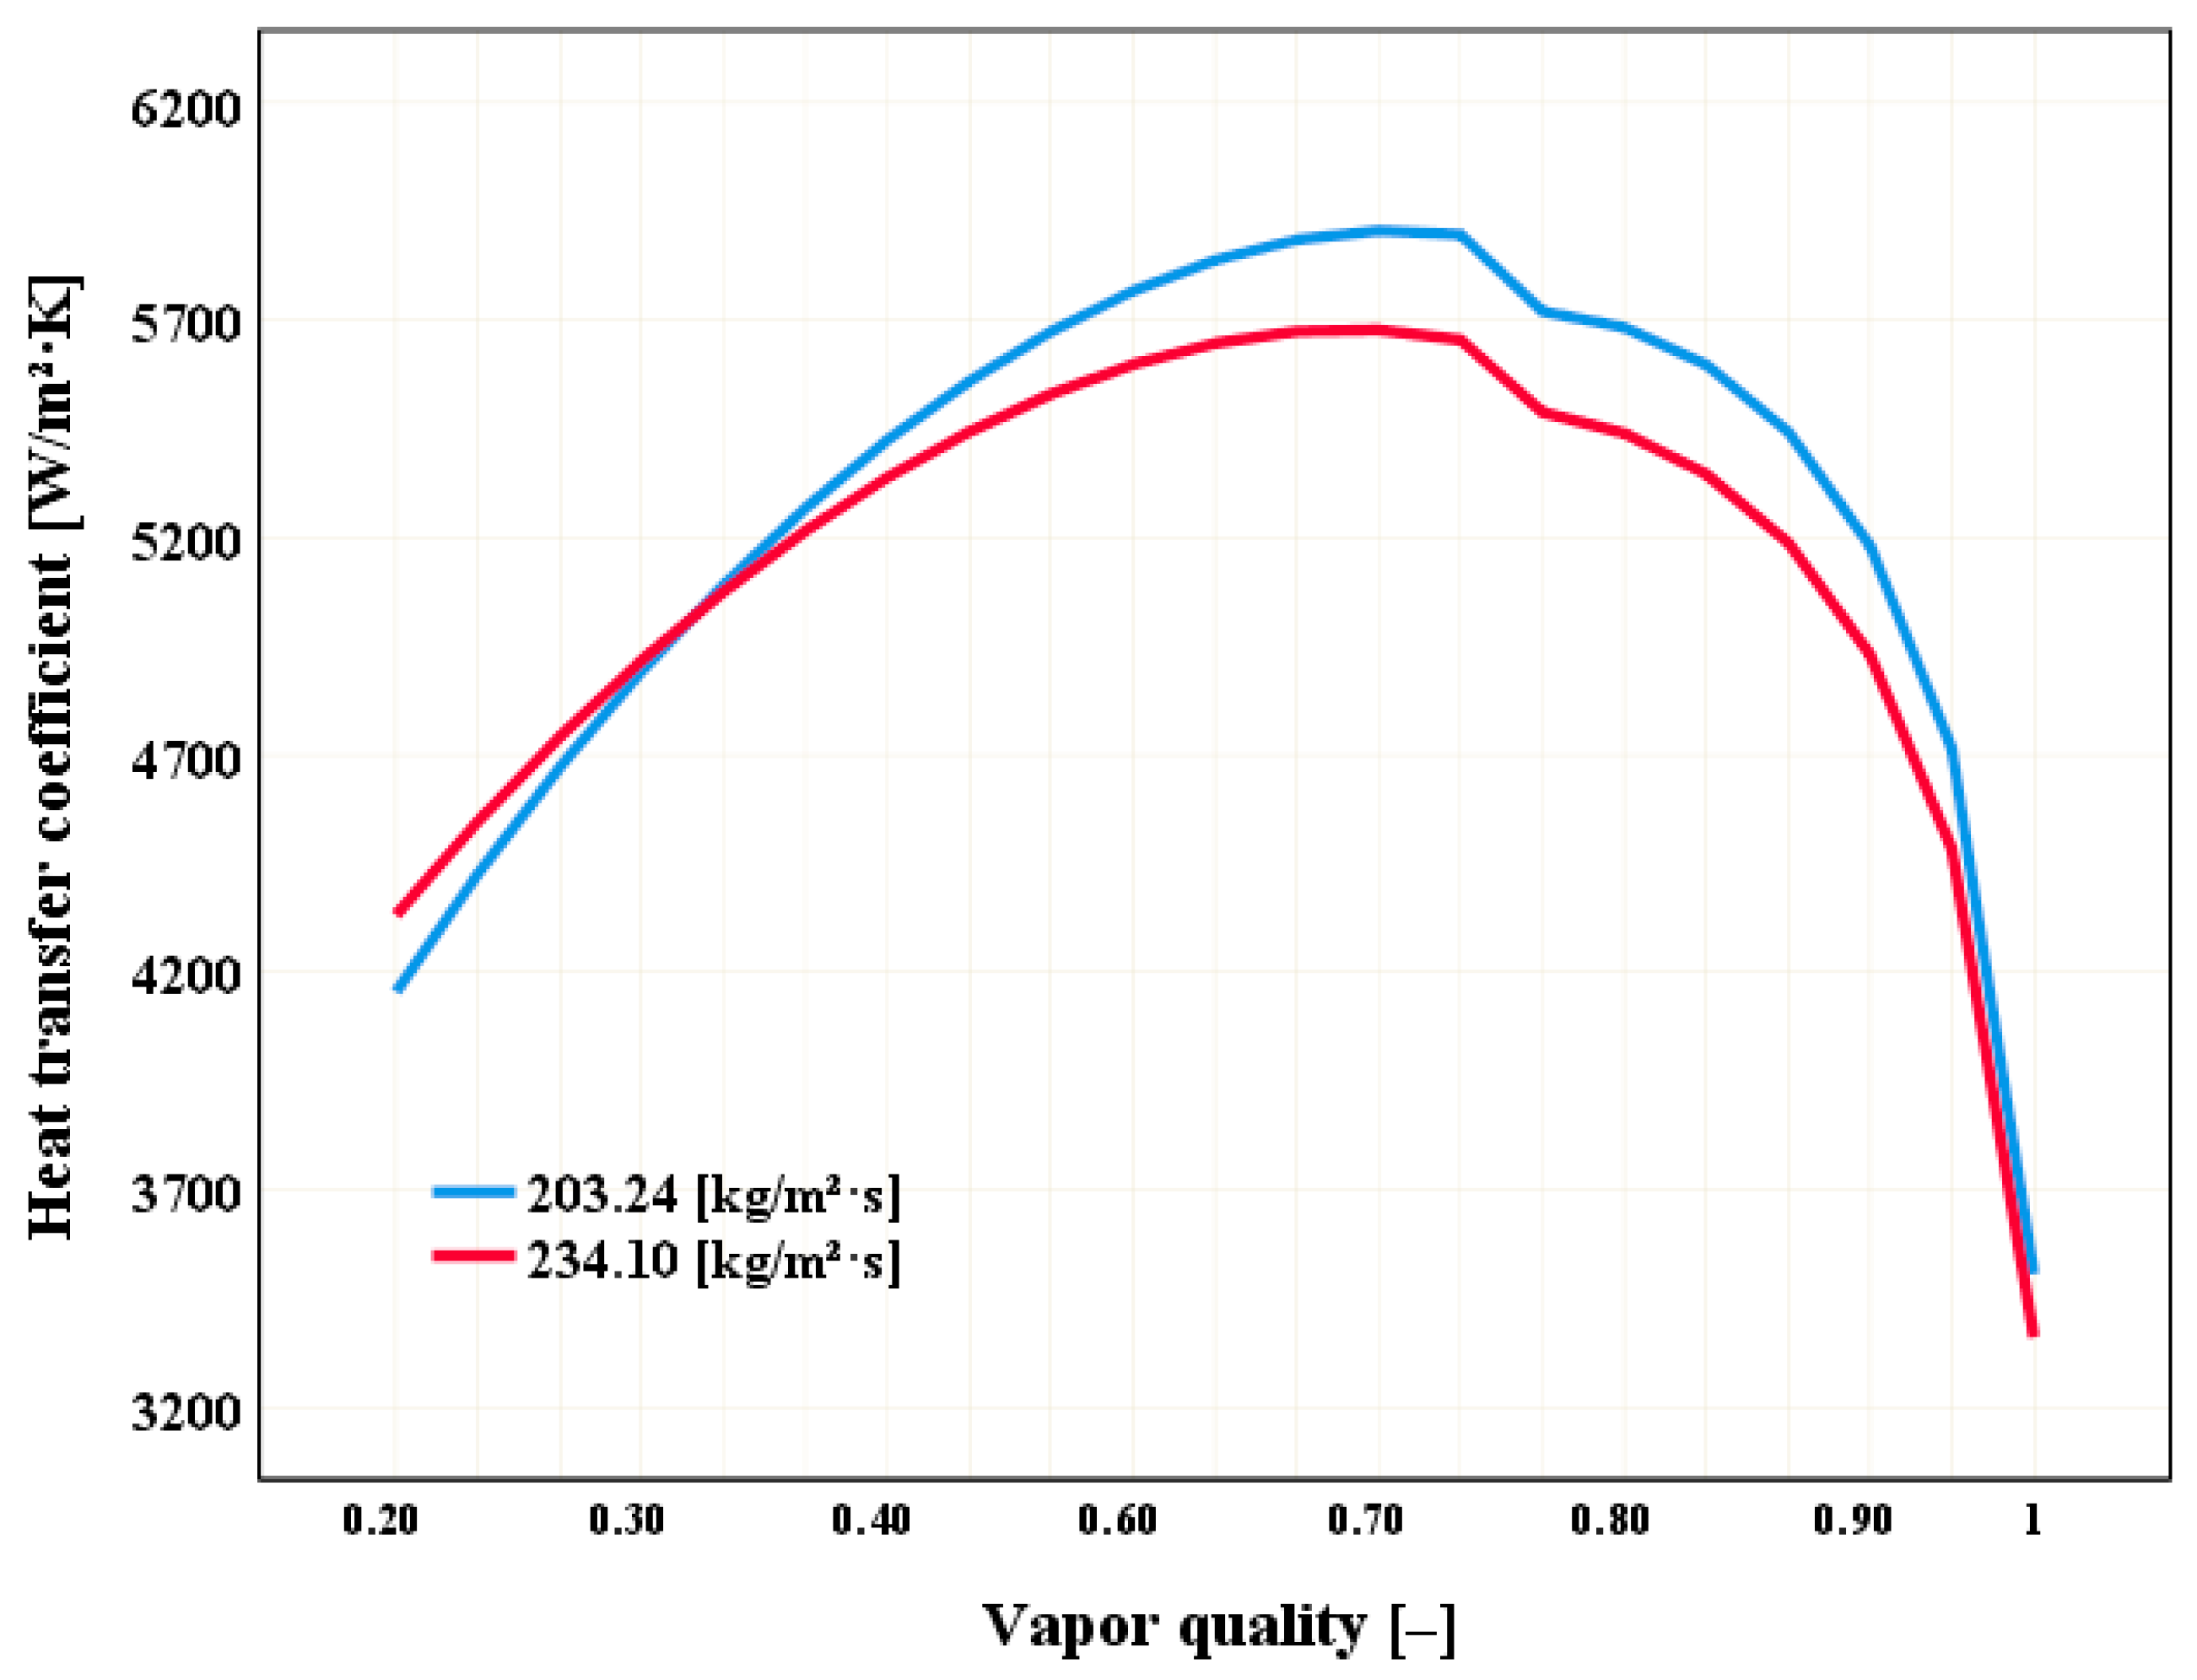
The influence produced by mass velocities of 234.10 and 203.24 kg·m−2·s−1 on the heat transfer coefficient using an angle of 40° is shown in Figure 4, where the largest heat transfer curve occurs with the mass velocity of 234.10 kg·m−2·s−1, which is the highest and has a peak of approximately 6500 W·m−2·K−1. The increase in mass velocities indicates an increase in the CTC coefficient, as shown in Figure 4.
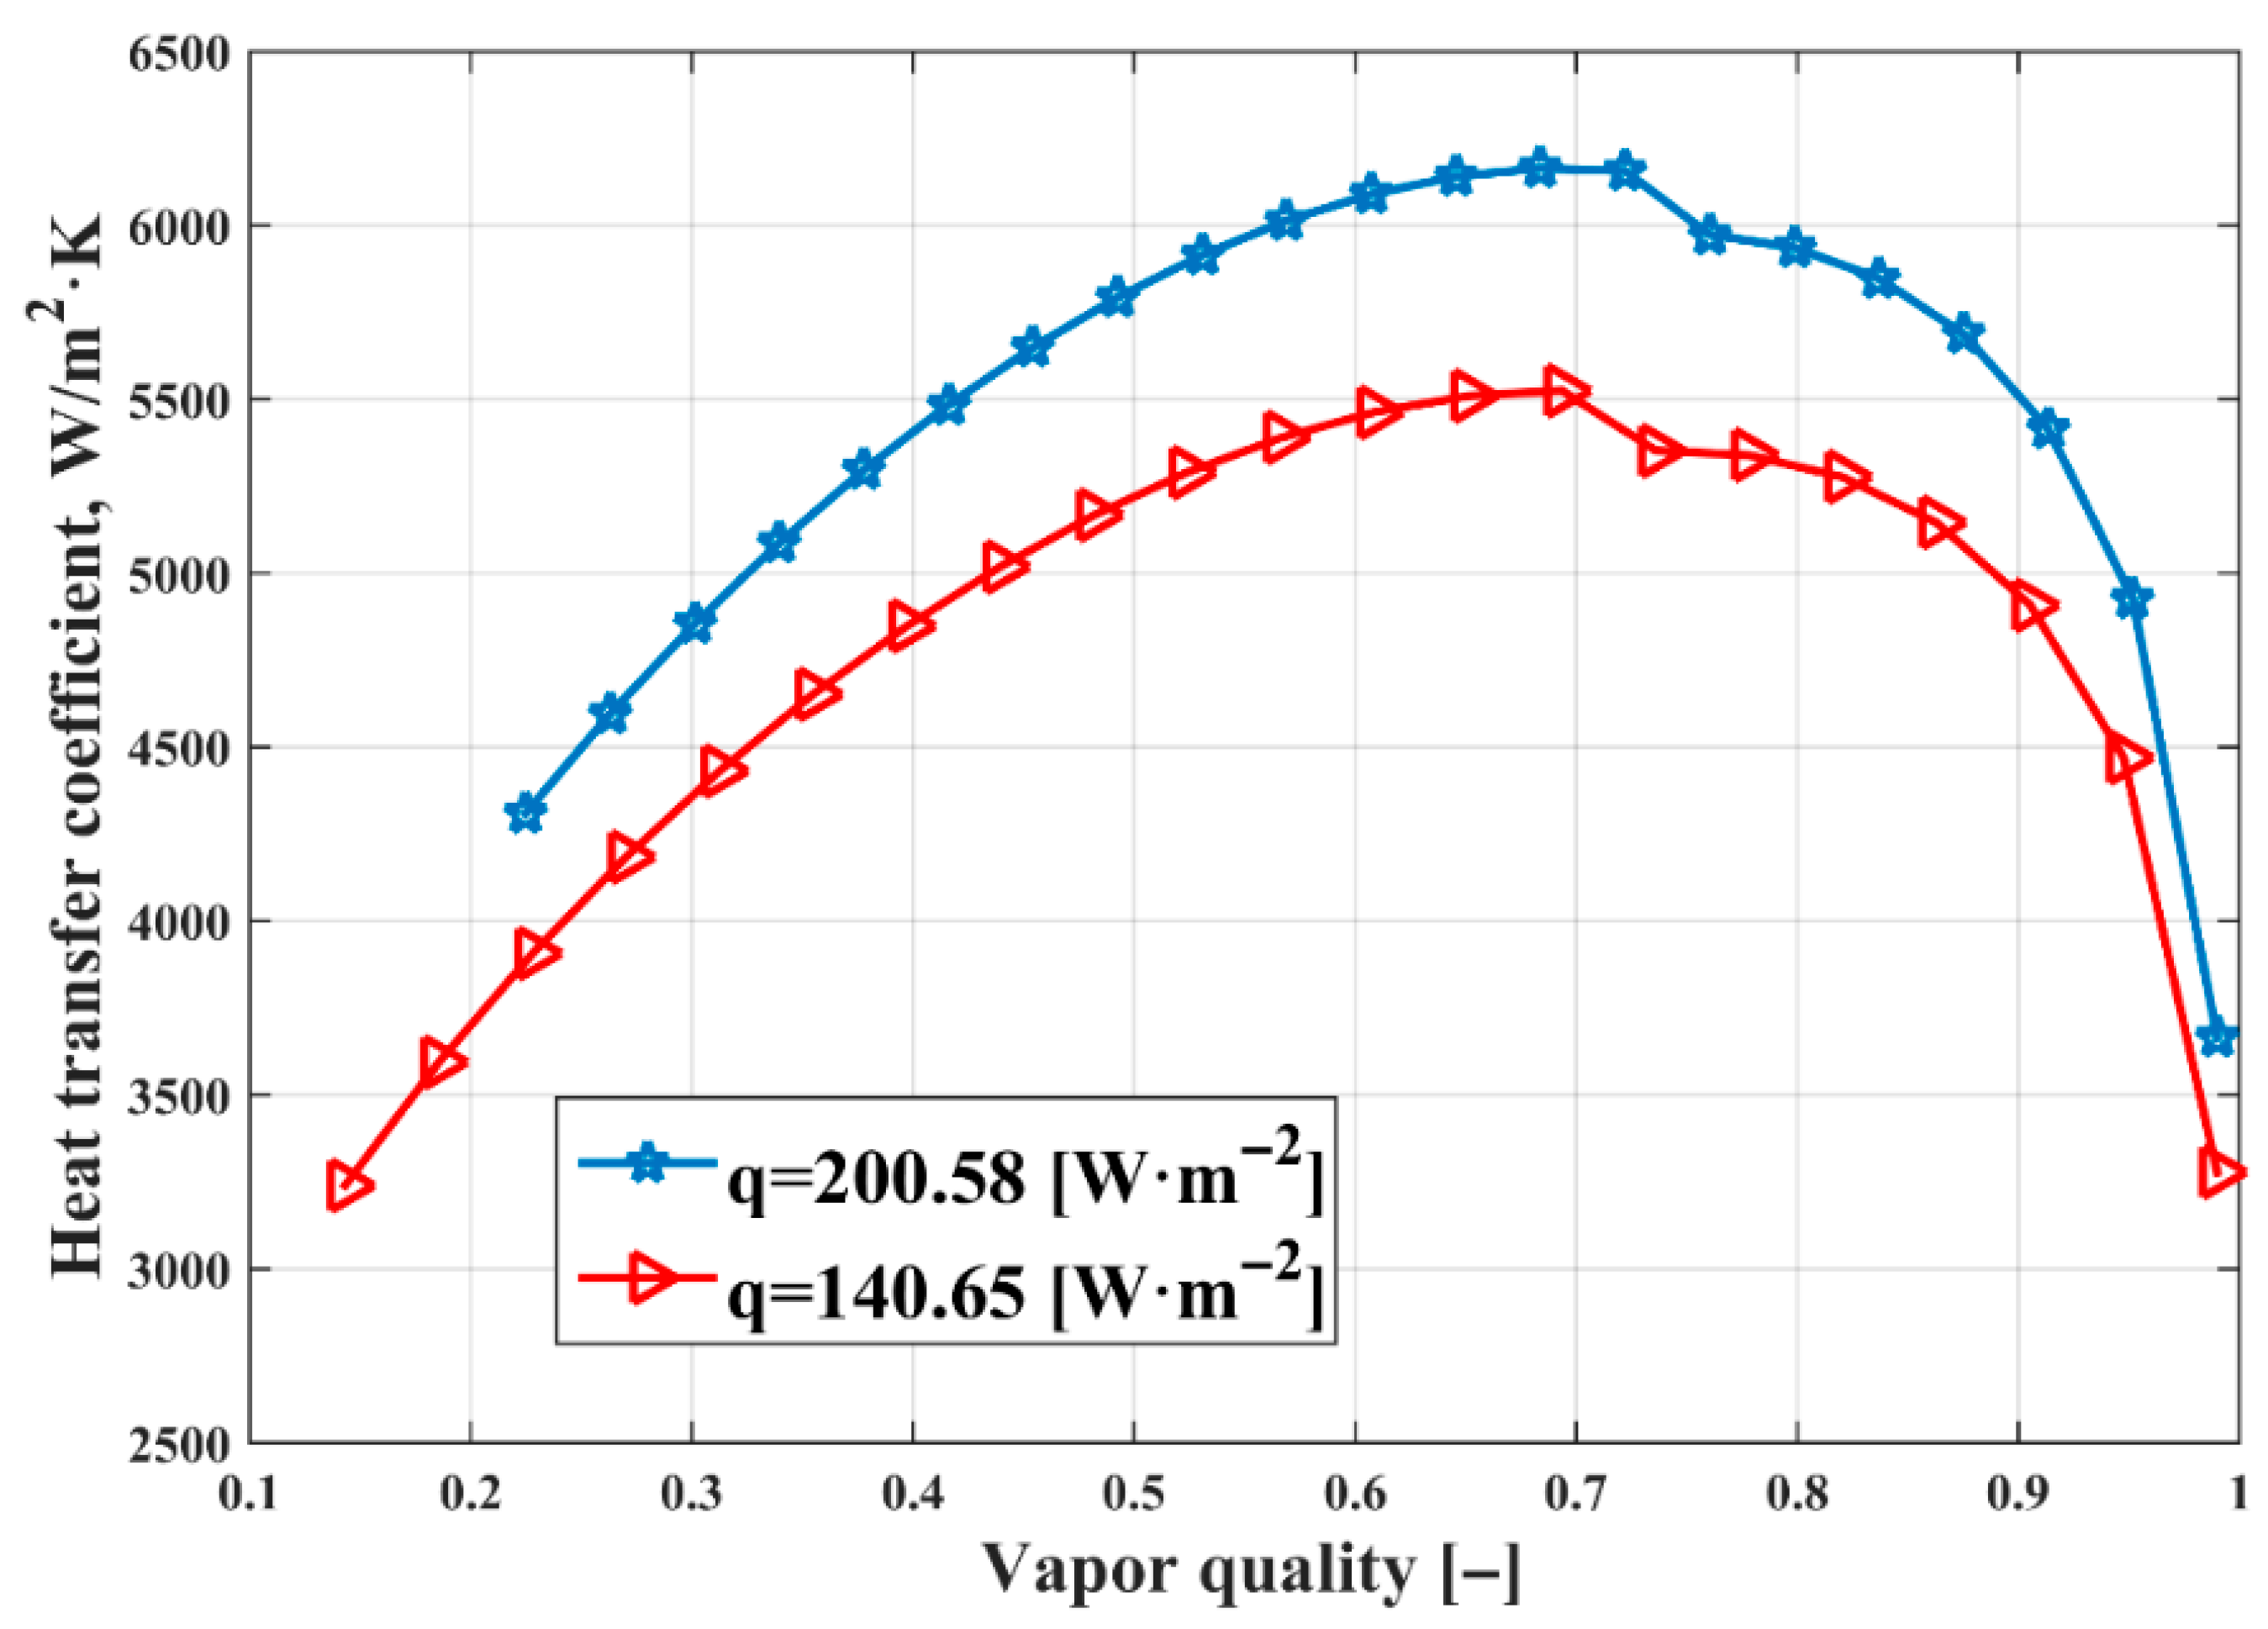
Figure 5 shows two CTCs with different heat fluxes of 200.58 and 140.65 W·m−2 for a pipe inclination angle of 45°. It can be observed how the CTC increases with the increase in heat flow. In the case of a heat flux of 200.58 W·m−2, the maximum peak is approximately 6200 W·m−2·K−1. This study confirms that a higher thermal flux increases the system’s capacity to transmit heat, demonstrating a direct relationship between thermal flux and heat transfer coefficient.

3.2. Statistical Analysis Results

3.2.1. Descriptive Statistics

The results obtained from the descriptive analysis of the CTC are shown below and can be seen in Table 3, which shows that at an inclination of 45°, the maximum heat transfer coefficient value is obtained with a value of 6163.8 W·m−2·K−1; however, the minimum heat transfer coefficient value is 3292.3 W·m−2·K−1, which is obtained with an inclination angle of 30°.
Figure 6 shows a graphical representation of the results obtained from the CTC with variations in the angle of inclination of 10, 20, 30, 40, and 45°, where for the angle of 45°, the maximum CTC is obtained with an average value of 5476.4 W·m−2·K−1. It can also be seen that the angles of inclination of 10 and 30° have a very small difference between them of approximately 60 W·m−2·K−1, while the maximum value is found between the angles of inclination of 30 and 45° with an approximate value of 550 W·m−2·K−1. The slight difference between 10 and 30° angles shows that the impact is limited in low angles, while the significant difference between 30 and 45° highlights the significance of carefully taking into account high angles to maximize heat transmission in thermal system design.

3.2.2. Statistical Tests Results

For the statistical analysis of this study, Pearson’s correlation will be applied to determine the degree of relationship between the heat CTC and the angle of inclination. Table 4 shows the results of the normality test for the different angles of inclination, obtaining the results that all the values obtained follow a normal distribution because the Sig value is greater than 0.05, with a Shapiro–Wilk statistic for data sets with fewer than 50 data points and a significance level of 0.05.
Table 5 shows the results obtained from Pearson’s statistical test for the correlation between the CTC and the inclination angle of 10°, where it is determined that the r value (Pearson correlation) is −0.316, allowing us to infer that the existing relationship is inversely proportional.
Table 6 shows that for all angles of inclination, there is a low correlation value between the CTC and the angle of inclination. However, for the inclination angle of 10°, the Pearson value is the highest compared to the others, with an estimate of −0.316, meaning that the existing correlation is inversely proportional. On the contrary, for the inclination angle of 40°, its value is −0.266, which is the minimum Pearson correlation.

4. Conclusions

The heat transfer coefficient with variation in the angle of inclination has a minimum and maximum average value of 4930.03 and 5476.39 W·m−2·K−1, respectively. These results were found for angles of inclination of 30 and 45°, respectively. However, the maximum HTC is for the 45° angle, which has a value of 6163.83 W·m−2·K−1, and the minimum HTC value is 3292.35 W·m−2·K−1 with an inclination angle of 30°. Furthermore, the minimum difference between the minimum and maximum CTC values is for an inclination angle of 30°, with an approximate value of 2268.87 W·m−2·K−1. This is due to the geographical location of the place where the experimental performance tests were carried out. In the future, it is planned to carry out experimentation considering different locations, since solar radiation varies considerably in the country where the experimentation was carried out.
The maximum Pearson correlation is for the 10° angle of inclination, with a value of −0.316 between the angle of inclination and the CTC. However, this does not conclude that the relationship between the variables is good, as the values are lower. Pearson states that the range is from −1 to 1, with 1 being a perfect direct relationship and −1 being a perfect inverse relationship between the variables. In addition, the minimum inverse correlation value is −0.266 for an inclination angle of 40°, so it can be determined that the best angles for determining Pearson’s correlation are 10 and 30° with values of −0.316 and −0.286, respectively. Furthermore, the analysis of how the inclination angle and the flow of energy affect the coefficient of heat transfer reveals a connection between these factors and the system’s thermal performance. When compared to smaller angles like 10 or 30°, where the differences are less pronounced, the CTC reaches maximum values of about 6200 W·m−2·K−1 for larger angles, particularly 45°. Additionally, increasing thermal flux enhances the ability to transmit heat, highlighting the significance of assessing these conditions under various scenarios to improve thermal system design and efficiency.
The angle of inclination, according to the results of Pearson’s correlation, is not an influential variable in determining the CTC, as it has an average value of −0.2838 among all angles of inclination (10, 20, 30, 40, and 45°), which is very far from Pearson’s perfect inverse relationship. However, the angle of inclination with the highest Pearson’s correlation does not yield the maximum CTC of 6163.83 W·m−2·K−1, which is determined with an angle of inclination of 45°. At the end of the investigation, it can be concluded that the angle of inclination of 10, 20, 30, 40, and 45° is not such an influential factor in determining the CTC, since it was determined that its Pearson correlation has an average value of −0.2838. For the angle of inclination to be an incident variable in determining the CTC, its correlation should be approximately greater than 0.8 or −0.8. Based on these results, it could be considered that future research could be carried out with horizontal pipes without variation in the angles of inclination. It could also be suggested that future research could analyze the correlations of CTC between horizontal pipes [26] and pipes with varying angles of inclination to validate this research.

Author Contributions

Conceptualization, W.Q., I.S., C.N.-L., E.P. and A.X.A.; Methodology, W.Q., I.S., C.N.-L., E.P. and A.X.A.; Validation, W.Q., I.S., A.H., C.N.-L., E.P. and Y.R.-M.; Formal analysis, P.Q.; Data curation, P.Q.; Writing—review & editing, W.Q., I.S., A.H., C.N.-L., E.P., A.X.A. and Y.R.-M. All authors have read and agreed to the published version of the manuscript.

Funding

This research received no external funding.

Data Availability Statement

The original contributions presented in this study are included in the article. Further inquiries can be directed to the corresponding authors.

Conflicts of Interest

The authors declare no conflicts of interest.

References

  1. Reddy, D.R.; Bhramara, P.; Govindarajulu, K. Experimental Evaluation of the Effect of Refrigerant Charge and Capillary Tube Length on the Performance of Household Refrigerator with Different Configurations of R290 and R600a. Mater. Today Proc. 2018, 5, 11845–11852. [Google Scholar] [CrossRef]
  2. Yelishala, S.C.; Kannaiyan, K.; Wang, Z.; Metghalchi, H.; Levendis, Y.A.; Sadr, R. Thermodynamic Study on Blends of Hydrocarbons and Carbon Dioxide as Zeotropic Refrigerants. J. Energy Resour. Technol. 2020, 142, 82304. [Google Scholar] [CrossRef]
  3. Mota-Babiloni, A.; Joybari, M.M.; Navarro-Esbrí, J.; Mateu-Royo, C.; Barragán-Cervera, Á.; Amat-Albuixech, M.; Molés, F. Ultralow-temperature refrigeration systems: Configurations and refrigerants to reduce the environmental impact. Int. J. Refrig. 2020, 111, 147–158. [Google Scholar] [CrossRef]
  4. Quitiaquez, W.; Estupinán-Campos, J.; Nieto-Londoño, C.; Isaza-Roldán, C.; Quitiaquez, P.; Toapanta-Ramos, F. CFD Analysis of Heat Transfer Enhancement in a Flat-Plate Solar Collector with Different Geometric Variations in the Superficial Section. Int. J. Adv. Sci. Eng. Inf. Technol. 2021, 11, 2039–2045. [Google Scholar] [CrossRef]
  5. Adelaja, A.O.; Ewim, D.R.; Dirker, J.; Meyer, J.P. An improved heat transfer correlation for condensation inside inclined smooth tubes. Int. Commun. Heat Mass Transf. 2020, 117, 104746. [Google Scholar] [CrossRef]
  6. Zakaria, M.I.; Akhavan-Behabadi, M.; Sajadi, B.; Moghadam, M.T. An empirical investigation on flow pattern, heat transfer, and pressure drop during flow boiling of R1234yf in an inclined plain tube. Int. J. Therm. Sci. 2021, 170, 107100. [Google Scholar] [CrossRef]
  7. Cao, S.; Wang, G.; Wu, X.; Yang, W.; Hu, C. An experimental investigation of R245fa flow boiling heat transfer performance in horizontal and vertical tubes. Int. J. Refrig. 2024, 160, 229–245. [Google Scholar] [CrossRef]
  8. Shah, M.M. Improved correlation for heat transfer during condensation in inclined tubes. Int. J. Heat Mass Transf. 2023, 216, 124607. [Google Scholar] [CrossRef]
  9. Dong, C.; Hibiki, T. Modeling of heat transfer coefficient for upward no-phase-change two-phase flow in inclined pipes. Appl. Therm. Eng. 2020, 169, 114921. [Google Scholar] [CrossRef]
  10. Mohseni, S.; Akhavan-Behabadi, M. Flow pattern visualization and heat transfer characteristics of R-134a during evaporation inside a smooth tube with different tube inclinations. Int. Commun. Heat Mass Transf. 2014, 59, 39–45. [Google Scholar] [CrossRef]
  11. Allymehr, E.; Pardiñas, Á.Á.; Eikevik, T.M.; Hafner, A. Comparative analysis of evaporation of isobutane (R600a) and propylene (R1270) in compact smooth and microfinned tubes. Appl. Therm. Eng. 2021, 188, 116606. [Google Scholar] [CrossRef]
  12. Sun, D.; Li, R.; Wang, C.; Liu, Z.; Qin, J.; Liu, Z. Experimental study on boiling heat transfer characteristics of RDR-1, R134a, and R1234yf over a wide temperature range and comparative analysis of their system performance. Appl. Therm. Eng. 2024, 245, 122809. [Google Scholar] [CrossRef]
  13. Fazelnia, H.; Azarhazin, S.; Sajadi, B.; Behabadi, M.A.A.; Zakeralhoseini, S.; Rafieinejad, M.V. Two-phase R1234yf flow inside horizontal smooth circular tubes: Heat transfer, pressure drop, and flow pattern. Int. J. Multiph. Flow 2021, 140, 103668. [Google Scholar] [CrossRef]
  14. Anandakumar, J.; Palaniradja, K. Performance enhancement of a modified corrugated tube in tube condenser in a refrigeration system. AIP Conf. Proc. 2023, 2548, 30016. [Google Scholar] [CrossRef]
  15. Jalajakshi, V.; Myna, A.N. Importance of statistics to data science. Glob. Transit. Proc. 2022, 3, 326–331. [Google Scholar] [CrossRef]
  16. Huang, F.; No, W.G.; Vasarhelyi, M.A.; Yan, Z. Audit data analytics, machine learning, and full population testing. J. Financ. Data Sci. 2022, 8, 138–144. [Google Scholar] [CrossRef]
  17. Melinda, M.; Muttaqin, M.I.; Nurdin, Y.; Bahri, A. Implementation of Word Recommendation System Using Hybrid Method for Speed Typing Website. J. RESTI 2023, 7, 7–14. [Google Scholar] [CrossRef]
  18. Voleti, R.; Itm, K. Data Wrangling- A Goliath of Data Industry. Int. J. Eng. Res. 2020, V9, 273–276. [Google Scholar] [CrossRef]
  19. Faiz, H.; Al-Amin, M.F.; Mundiri, A.; Fahmi, A. Transforming Organizational Quality Through Effective Administrative Training. Communaut. J. Community Serv. 2023, 2, 157–167. [Google Scholar] [CrossRef]
  20. Jaeger, S.R.; Rasmussen, M.A. Importance of data preparation when analysing written responses to open-ended questions: An empirical assessment and comparison with manual coding. Food Qual. Prefer. 2021, 93, 104270. [Google Scholar] [CrossRef]
  21. Rodriguez, A. Know your data: Evaluation of normality for continuous variables and tools to deal with non-normal distributions. Med. Clínica (Engl. Ed.) 2020, 154, 142–145. [Google Scholar] [CrossRef]
  22. Lugo-Armenta, J.G.; Pino-Fan, L.R. Inferential Reasoning Levels for t-Student Statistical. Bolema Math. Educ. Bull. 2021, 35, 1776–1802. [Google Scholar] [CrossRef]
  23. Carazo-Díaz, C.; Prieto-Valiente, L. The p-value of a test is not the probability that the null hypothesis is true or false. Rev. Neurol. 2024, 79, 289–291. [Google Scholar] [CrossRef] [PubMed]
  24. Moghadam, M.T.; Behabadi, M.A.A.; Sajadi, B.; Razi, P.; Zakaria, M.I. Experimental study of heat transfer coefficient, pressure drop and flow pattern of R1234yf condensing flow in inclined plain tubes. Int. J. Heat Mass Transf. 2020, 160, 120199. [Google Scholar] [CrossRef]
  25. Quitiaquez, W.; Herrera, A.; Isaza-Roldán, C.A.; Mena, M.; Nieto-Londoño, C.; Toapanta-Ramos, F. Numerical analysis of flow patterns maps in horizontal pipes with variation of inclination angles in a collector/evaporator of a DX-SAHP. Mater. Today Proc. 2022, 49, 194–201. [Google Scholar] [CrossRef]
  26. Quitiaquez, W.; Anchapaxi, K.; Cortez, E.; Isaza-Roldán, C.; Nieto-Londoño, C.; Toapanta-Ramos, F. Evaluation of Correlations of Flow Boiling Heat Transfer of R600a in a Flat-Plate Solar Collector/Evaporator. Int. J. Adv. Sci. Eng. Inf. Technol. 2021, 11, 1273–1280. [Google Scholar] [CrossRef]
  27. Kattan, N.; Thome, J.R.; Favrat, D. Flow Boiling in Horizontal Tubes: Part 1—Development of a Diabatic Two-Phase Flow Pattern Map. J. Heat Transf. 1998, 120, 140–147. [Google Scholar] [CrossRef]
  28. Rajabi, V.; Mansoori, Z.; Rahimzadeh, H.; Nasrfard, H.; Ahmadi, G. Experimental study of refrigerant condensation heat transfer and pressure drop in horizontal tubes with full and partial coiled wire inserts (CWIs). Int. J. Heat Mass Transf. 2023, 216, 124577. [Google Scholar] [CrossRef]
  29. Wojtan, L.; Ursenbacher, T.; Thome, J.R. Investigation of flow boiling in horizontal tubes: Part I—A new diabatic two-phase flow pattern map. Int. J. Heat Mass Transf. 2005, 48, 2955–2969. [Google Scholar] [CrossRef]
  30. Faghri, A.; Zhang, Y. Fundamentals of Multiphase Heat Transfer and Flow; Springer Nature: Durham, NC, USA, 2019. [Google Scholar] [CrossRef]
  31. Shah, M.M. New general correlation for heat transfer during saturated boiling in mini and macro channels. Int. J. Refrig. 2022, 137, 103–116. [Google Scholar] [CrossRef]
  32. Estupiñán-Campos, J.; Quitiaquez, W.; Nieto-Londoño, C.; Quitiaquez, P. Numerical Simulation of the Heat Transfer Inside a Shell and Tube Heat Exchanger Considering Different Variations in the Geometric Parameters of the Design. Energies 2024, 17, 691. [Google Scholar] [CrossRef]
  33. Zhang, J.; Mondejar, M.E.; Haglind, F. General heat transfer correlations for flow boiling of zeotropic mixtures in horizontal plain tubes. Appl. Therm. Eng. 2019, 150, 824–839. [Google Scholar] [CrossRef]
  34. Ponce, R.B.M.; Palma, K.S.; Alamilla, A.M.; Valdez, D.S.; Velázquez, U.I.M. Cuadro comparativo ‘Estadistica inferencial y descriptive. Educ. Salud Boletín Científico Inst. Ciencias Salud Univ. Autónoma Estado Hidalgo 2020, 8, 93–95. [Google Scholar] [CrossRef]
  35. Hernando, Á.-T.J.; Vargas-Delgado, L.; Jiménez-Yejas, C.; Ortiz-Mejía, D. Accesibilidad estadística en artículos publicados en revistas científicas de educación (Europa-Latinoamérica) incluidas en Scimago Journal Ranking. Eco Matemático 2022, 13, 81–92. [Google Scholar] [CrossRef]
  36. Retirado-Mediaceja, Y.; Legrá-Lobaina, A.A.; Camaraza-Medina, Y.; Laurencio-Alfonso, H.L.; Salazar-Corrales, M.F.; Quitiaquez-Sarzosa, W.G. Validación experimental de modelos físico-matemáticos del secado natural de mena laterítica. Minería Geol. 2025, 41, 134–156. [Google Scholar]
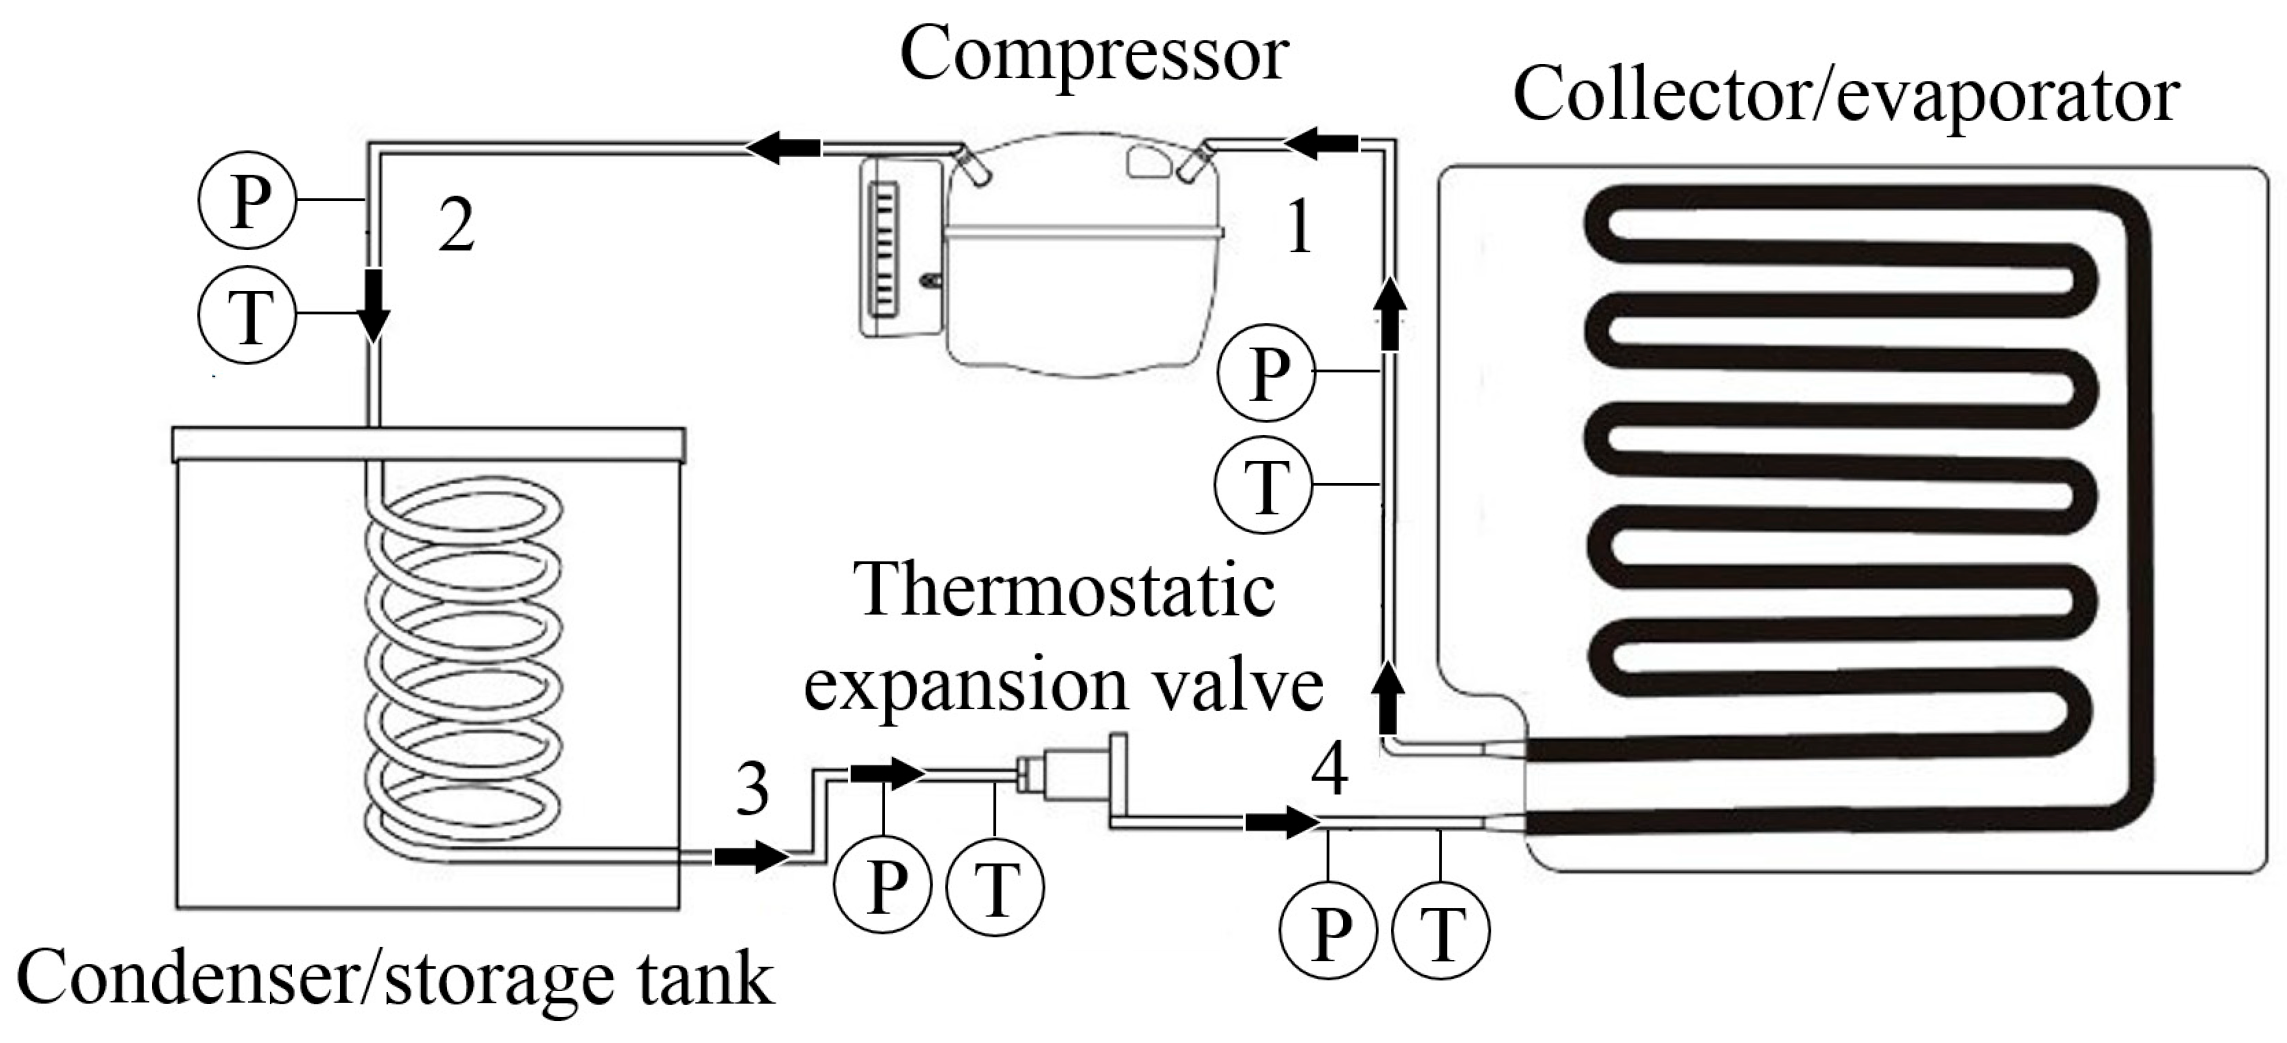
Figure 1. DX-SAHP equipment used to obtain experimental data [25].
Processes 13 03419 g001
Figure 2. Heat transfer coefficient with different angles of inclination and different mass flow per unit area.
Processes 13 03419 g002
Figure 3. Heat transfer coefficient with inclination angles of 10 and 45°.
Processes 13 03419 g003
Figure 4. Heat transfer coefficients with an angle of 40° and different mass velocities.
Processes 13 03419 g004
Figure 5. Heat transfer coefficients at a 45° angle and different heat flows.
Processes 13 03419 g005
Figure 6. Heat transfer coefficient with different angles of inclination using SPSS Statistics 24.
Processes 13 03419 g006
Table 1. Variables.
Table 1. Variables.
Angle of Inclination (°)
Variables1020304045
Ambient temperature [°C]17.817.416.918.318.1
Average incident solar radiation [W·m−2]541.3251.6649.2301.6139.2
Quality [dimensionless]0.20690.22570.21250.22570.2248
Surface temperature [°C]13.512111413.7
Vapor phase density [kg·m−3]4.5414.6934.8484.7234.677
Thermal conductivity
[W·m−1·K−1]
0.095830.09710.096240.09710.0971
Boiling number (Bo)6.03 × 10−63.65 × 10−66.53 × 10−64.28 × 10−62.67 × 10⁻⁶
Table 2. Examples of statistical tests.
Independent Variable (x)Dependent Variable (y)
NominalOrdinalDiscrete or Continuous
Qualitative (nominal)Independent samples
- Z test
- Chi-square test
- Fisher’s test
Test U de Mann–WhitneyTest de la t de Student
Qualitative (nominal)Dependent samples
- Test de McNermar
- Test Z
Test de WilcoxonTest de la t de Student
Quantitative (discrete or continuous)Student’s t-testSpearman’s correlation coefficientPearson’s correlation coefficient
Table 3. Descriptive statistics with SPSS Statistics 24.
NMinimumMaximumAverage
Heat transfer coefficient 10°213347.85640.04986.4
Heat transfer coefficient 20°213533.35948.55288.8
Heat transfer coefficient 30°213292.35560.64930.0
Heat transfer coefficient 40°213505.75905.65252.2
Heat transfer coefficient 45°213665.66163.85476.4
N valid (by list)21
Table 4. Normality test of the heat transfer coefficient with variation in the angles of inclination.
Kolmogorov-SmimovShapiro–Wilk
StatisticianglSigStatisticianglSig
Heat transfer coefficient 10°0.162 210.1540.878210.013
Heat transfer coefficient 20°0.171 210.1120.877210.013
Heat transfer coefficient 30°0.174210.0960.875210.012
Heat transfer coefficient 40°0.176210.0900.874210.011
Heat transfer coefficient 45°0.172210.1070.876210.012
Table 5. Pearson correlation in SPSS Statistics 24.
Factor 10°Heat Transfer Coefficient 10°
Factor 10°Pearson correlation1−0.316
Sig. (bilaterally) 0.162
N2121
Heat transfer coefficient 10°Pearson correlation−0.3161
Sig. (bilaterally)0.162
N2121
Table 6. Results of all Pearson correlations of heat transfer coefficients with respect to their angles of inclination.
Pearson Correlation
Factor for 10° angle of inclination−0.316
Factor for 20° angle of inclination−0.271
Factor for 30° angle of inclination−0.286
Factor for 40° angle of inclination−0.266
Factor for 45° angle of inclination−0.280
Disclaimer/Publisher’s Note: The statements, opinions and data contained in all publications are solely those of the individual author(s) and contributor(s) and not of MDPI and/or the editor(s). MDPI and/or the editor(s) disclaim responsibility for any injury to people or property resulting from any ideas, methods, instructions or products referred to in the content.