1. Introduction
In recent decades, urban air pollution has gained increasing interest due to its prevalence and the severity of its effects. According to research carried out by M. Ścibor et al. (2019) [
1], outdoor air laden with above-average concentrations of particulate matter (PM), namely PM
10 and PM
2.5, is related to indoor air quality. Despite the noticeably large difference between outdoor and indoor dust concentrations, the effects of typical sources of pollution, which in this case affect human health, are therefore noticeable. Currently, in densely populated areas, several complications caused by PM are respiratory and cardiovascular diseases [
2]. Furthermore, according to the Clean Air for Europe (CAFE) directive, road traffic contributes to the resuspension of PM
2.5 and PM
10, where the finer particles are to a great extent product of the exhaust gases [
3]. In the urban area, the size of road dust grains varies from 0.01 μm to 5 μm, and its concentration in air ranges from 0.01 mg/m
3 to 0.1 mg/m
3 depending on the region [
4]. Acceptable concentrations for the PM group of air pollutants, as reported by the World Health Organization (WHO), are much narrower than those dedicated to road dust. The global guidelines for average daily concentrations of PM
2.5 and PM
10 in ambient air are 15 μg/m
3 and 45 μg/m
3, respectively [
5].
As a popular, effective, and easily accessible solution for preventing indoor air pollution, air purifiers can reduce the health effects caused by PM
2.5 with up to 87% efficiency [
6]. Among the solutions that prevent the transport of pollutants in the form of particulates to the indoor environment, one can mention the filtration in HVAC systems. Currently, filters developed with electret technology are gaining popularity, whose PM
2.5 filtration efficiency in comparison to non-electret counterparts shows an average 20% improvement [
7], in the category of filters with minimum efficiency reporting value (MERV) classification [
8]. This trend in the development of filtering technologies indicates the need for research into the phenomenon of filtration. In times of stringent emission requirements for power plants, such as the Medium Combustion Plants Directive (MCP) of the European Union [
9], flue-gas filtration and its methods are of great importance for the protection of sectors at risk of air pollution. Looking for an example in the improvement of filtration systems based on filter media, it is worth noting the research carried out by A. Jaworek et al. (2021) [
10], where the authors in their analyses confirmed an increase in filtration efficiency of submicron particles and nanoparticles of the combination of electrostatic precipitator, kinematic electrostatic agglomerator and bag filter system.
The development of highly efficient air filtration methods is also of great importance in the automotive industry. Protecting human health is analogous to the function of cabin filters in motor vehicles, similar to how domestic air purifiers work. They guarantee important protection from road dust present on paved roads, and especially from mineral dust stirred up by vehicles when driving on unpaved roads. In the composition of dust present in cities, two groups can be distinguished, the dust of natural origin and artificial dust, which is a product of anthropological activity [
4]. Natural dust is mainly the result of atmospheric phenomena such as precipitation or wind blowing dust from the ground. It also includes mineral dust, which is one of the main components of road dust. Artificial dust is an industrial product, as well as a product of transport emissions. The exact composition of this pollutant includes gases (e.g., SO
2, CO, N
2, and NO
x), liquids (hydrocarbons and aldehydes) and the considered dust, mainly PM, soot, lead compounds and heavy hydrocarbons [
4]. In addition, the components resulting from the abrasion of motor vehicle wear and tear, mainly tires and brake pads, as well as the abrasion of the surfaces on which cars run, cannot be ignored [
11].
Mentioning mineral dust in the composition of road dust, it is necessary to point out the predominance of corundum, which is characterized by a very high hardness value of 9 on the Mohs’ scale. Internal combustion engine components have a much lower hardness and are therefore susceptible to severe damage, especially from particles smaller than 5 µm. When particles with a similar granulometric distribution enter the cylinders, they form an abrasive substance with the engine oil, penetrating between the working surfaces in relation to each other. The complications of such a process are usually furrowing, micro-cutting or scratching of the surface, which result in the destruction of the drive unit in question [
11].
Tests and performance analyses of air filters, performed empirically, can be successfully supported by numerical simulations. Air filters belong to a wide group of materials called saturated porous materials, which are defined as a two-phase material build of solid matrix and fluid filling completely its voids or pores. There are two main strategies of mathematical modeling of flow through such materials. The first method relies on the volume or assemble averaged flow equations, which for isothermal incompressible flow and neglecting dispersion, take the following form [
12,
13]:
where
is fluid velocity vector,
and
are fluid density and viscosity appropriately,
stands for pressure, and
refers to porosity, defined as fraction of void in the material under investigation:
where
stands for volume of the Representative Elementary Volume (REV) over which averaging procedure takes place and which contains void volume equal to
. The volume averaged pressure
and velocity
are defined as [
12,
13]
The last term on the right hand of Equation (2), which arises from averaging procedure, describes the interaction between solid matrix and fluid. Closing the set of governing Equations (1) and (2) requires the constitutive model that describes the interaction term as a function of averaged flow variables and parameters of porous material. There are wide number of closing equations, like Darcy law, Carman-Kozeny equation, Forchheimer equation, Ergun equation and so on [
14,
15]. Each of the abovementioned closing formulations has limited accuracy and needs some data describing porous material geometry, hence not always can be applied. The second method of modeling flow through porous material relies on the direct modeling of flow though microchannels formed in porous material by connected pore. This approach offers better accuracy, but it requires exact geometry of pores that for an arbitrary porous material can be obtained only by Computed Tomography (CT). Akolkar and Petrasch presented methodology of flow simulation through the porous material based on the CT derived geometry of porous material, moreover they applied developed model to estimate parameters of Dupit–Forchheimer volume averaged model [
16]. Breugem at al. presented results of application of the Immersed Boundary Method to model flow through porous material, pore geometry was built based on the X-ray CT scans [
17]. Shah et al. studied influence of the voxel resolution of CT scans on the accuracy of flow simulation through porous medium [
18]. Abishek et al. presented application of high-resolution flow simulation method for optimization of the microstructure of porous material geometries [
19]. Pan et al. applied X-ray CT and FIB-SEM techniques to retrieve highly accurate representation of porous material geometry for flow simulation [
20]. Wang et al. presented heat and mass flow through microstructure of porous material [
21]. Chen et al. studies investigated the influence of porous material microstructure on the mechanical properties of porous material [
22]. Buchele et al. developed method of development of porous material geometry based on the values of crucial parameters, the technique has been applied to optimize thermal conductivity of the resulting material [
23].
As is shown above, the porous material simulation methodology based on the detailed pore geometry has huge potential in investigation material itself but also in optimization and designing its physical properties. However, direct simulation of the pore scale flow is extremely time and resources consuming. The paper addresses the problem of decreasing necessary time and resources for effective and reliable pore scale modeling of flow through porous material by verification of the influence of geometry representation, mesh density and the choice of Representative Elementary Volume of investigated porous material. For this purpose, a set of computations for two types of filters were carried out paper filter (example of random porous material) and mesh filter (example of ordered porous material). The first geometry was obtained from micro-CT scan, while the second was modeled using CAD tools. Computational results were compared with experiments.
2. Experimental Setup
The numerical model was validated using experimental results obtained from real filtration materials whose microscopic geometries served as domains for the numerical simulations. To empirically determine the most penetrating particle size (MPPS), a flat section of the filter material was tested according to the ISO5011 standard for high-efficiency air filter testing, see
Figure 1 [
24]. The filter performance was assessed by replicating real-world particulate exposure through the generation of a standardized test aerosol, designed to simulate the typical dust composition encountered in the material’s intended operating environment. The aerosol was introduced at a controlled face velocity corresponding to nominal filter operating conditions. During the test the air flow rate was measured with uncertainty within ±2%, gauge pressure with uncertainty within ±1%. Moreover, thermodynamic parameters of air flowing through the filter were measured: temperature with an uncertainty of 0.5 °C, relative humidity (RH) with an uncertainty of ±2% RH and barometric pressure with an uncertainty of 0.3 kPa.
The experimental test rig consisted of several key components including an aerosol generator producing a stable and well-characterized aerosol stream, a clean air supply system supplying particle-free air to the aerosol generator, and a mixing chamber ensuring homogeneous distribution of the aerosol prior to contact with the filter sample (
Figure 1). The filter was secured in a precise flat sheet holder mounting a 100 mm by 100 mm filter sample, providing an exposed filtration area of approximately 100 cm
2 while preventing any air bypass.
Aerosol concentrations were measured using upstream and downstream sampling ports connected to optical particle counters that measured particle number concentration and size distribution before and after the filter. Face velocity was regulated at 7.5 cm/s using a mass flow controller to replicate operating conditions. Pressure drop across the sample was recorded continuously by a differential pressure gauge connected to taps placed upstream and downstream of the filter medium. Tests were conducted under stable environmental conditions and repeated several times to verify the reproducibility of results. At the start of testing, the baseline pressure drop across the filter material was recorded and used as a boundary condition for numerical simulations. For the paper filter tested, the initial measured pressure drop, and face velocity were 37 Pa and 7.5 cm/s, respectively.
3. Geometry
The geometries under study are representative of two types of filters used in a wide range of industrial applications. The first geometry which was used in the study was the paper filter. The filter material of paper filters is processed cellulose, which properties, such as fiber diameter, depend primarily on its origin. The filtering properties are very much influenced by the production process of the material. An example of the manufacturing method can be the pneumothermal (meltblowing) technique, which makes it possible to control the parameters of the obtained nonwoven fabric, in particular the thickness of fibers and the size of pores. In the case in question, an increasing fiber packing density can be seen to regulate the filtration of particles of specific diameters.
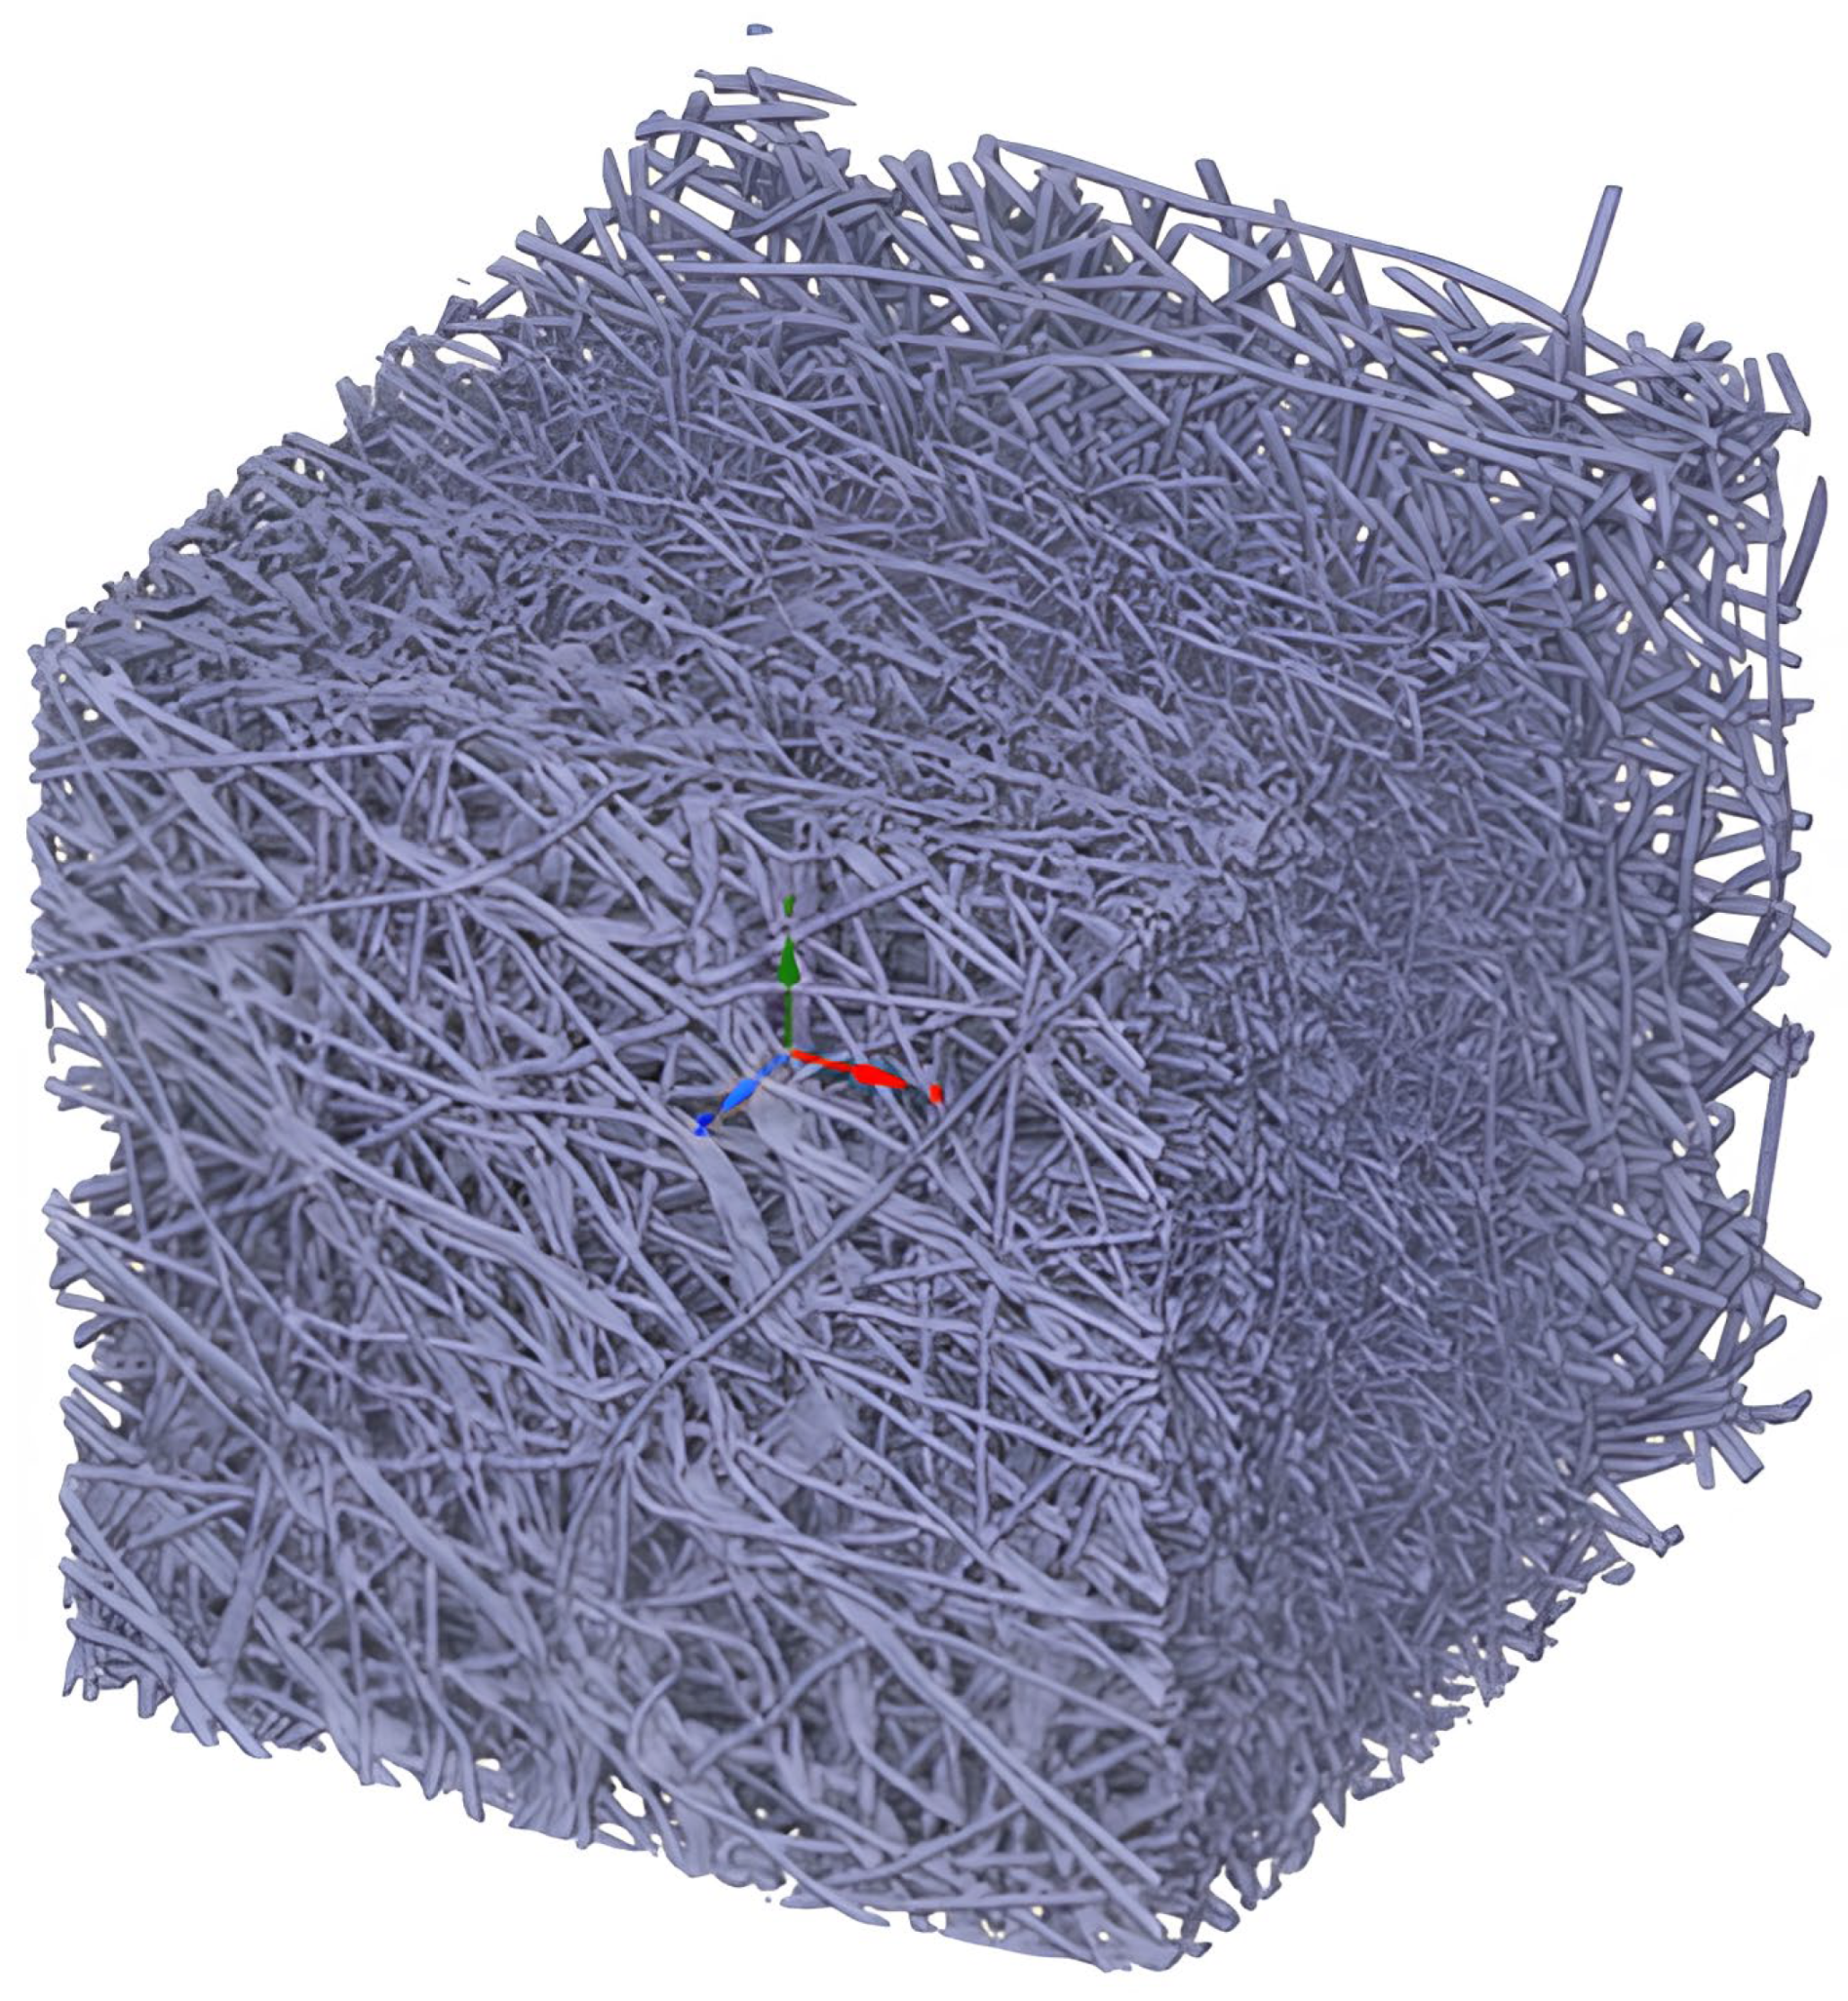
Model presented in
Figure 2 is a three-dimensional (3D) microscopic geometry of a paper filter. This geometry was obtained through the application of computed tomography. The method provided us with a detailed model of the cut-out in the form of a cube with sides of 1024 μm. The filter sample was scanned with Bruker SkyScan 1272 μCT, which offers voxel resolution not worse than 0.75 μm, investigated sample had dimensions 2 × 2 × 2 mm. This relatively large model requires significant computational resources for its processing and preparation prior to CFD analysis.
Generation of numerical mesh and carrying out numerical computations of the entire object that is the product of a CT scan would need huge compute resources and would be very time consuming. For this reason, the original model was divided into smaller sections; however, this approach raises the issue of selecting an appropriate representative elementary volume (REV). Consequently, four geometries with a common center were extracted from the base model. These geometries differ from each other in their cross-sectional areas. Maintaining the original depth of the model, cutouts were made with side lengths of 80 μm, 140 μm, 220 μm and 300 μm.
Figure 3 presents the obtained geometries.
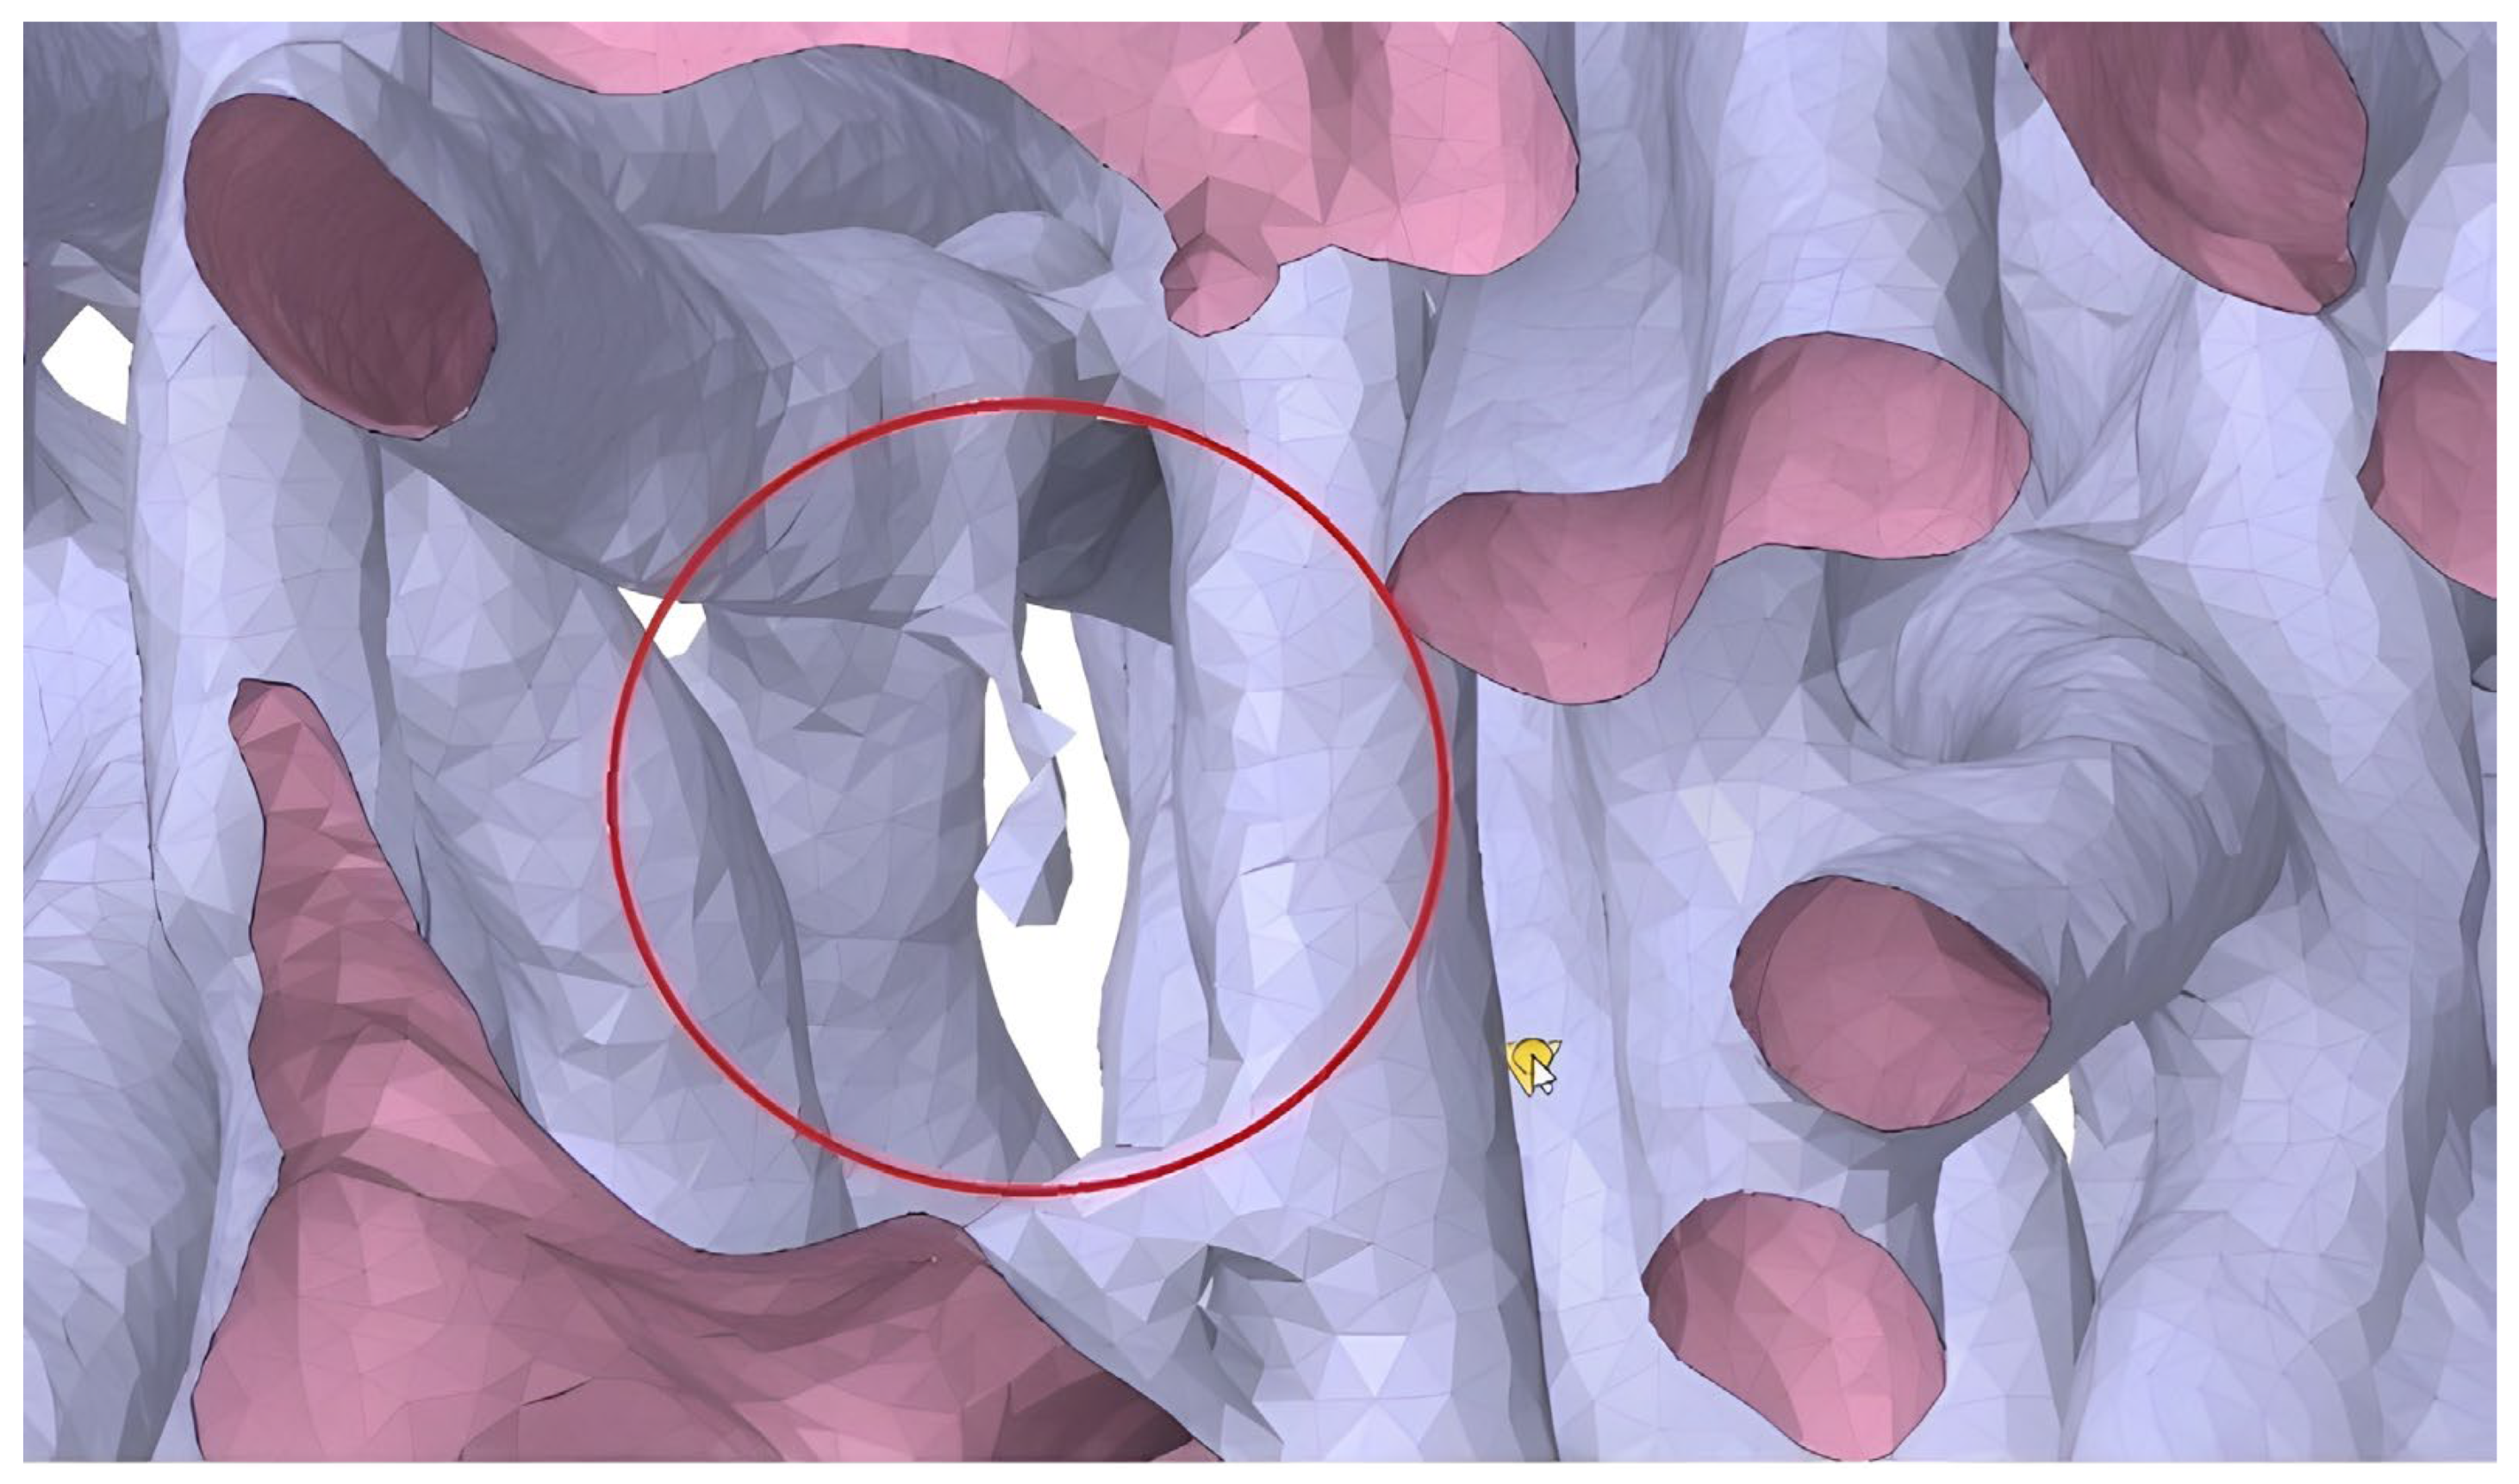
In preparing the geometry for computational analysis, it was necessary to remove defects such as small holes, suspended fragments, and free faces (see
Figure 4).
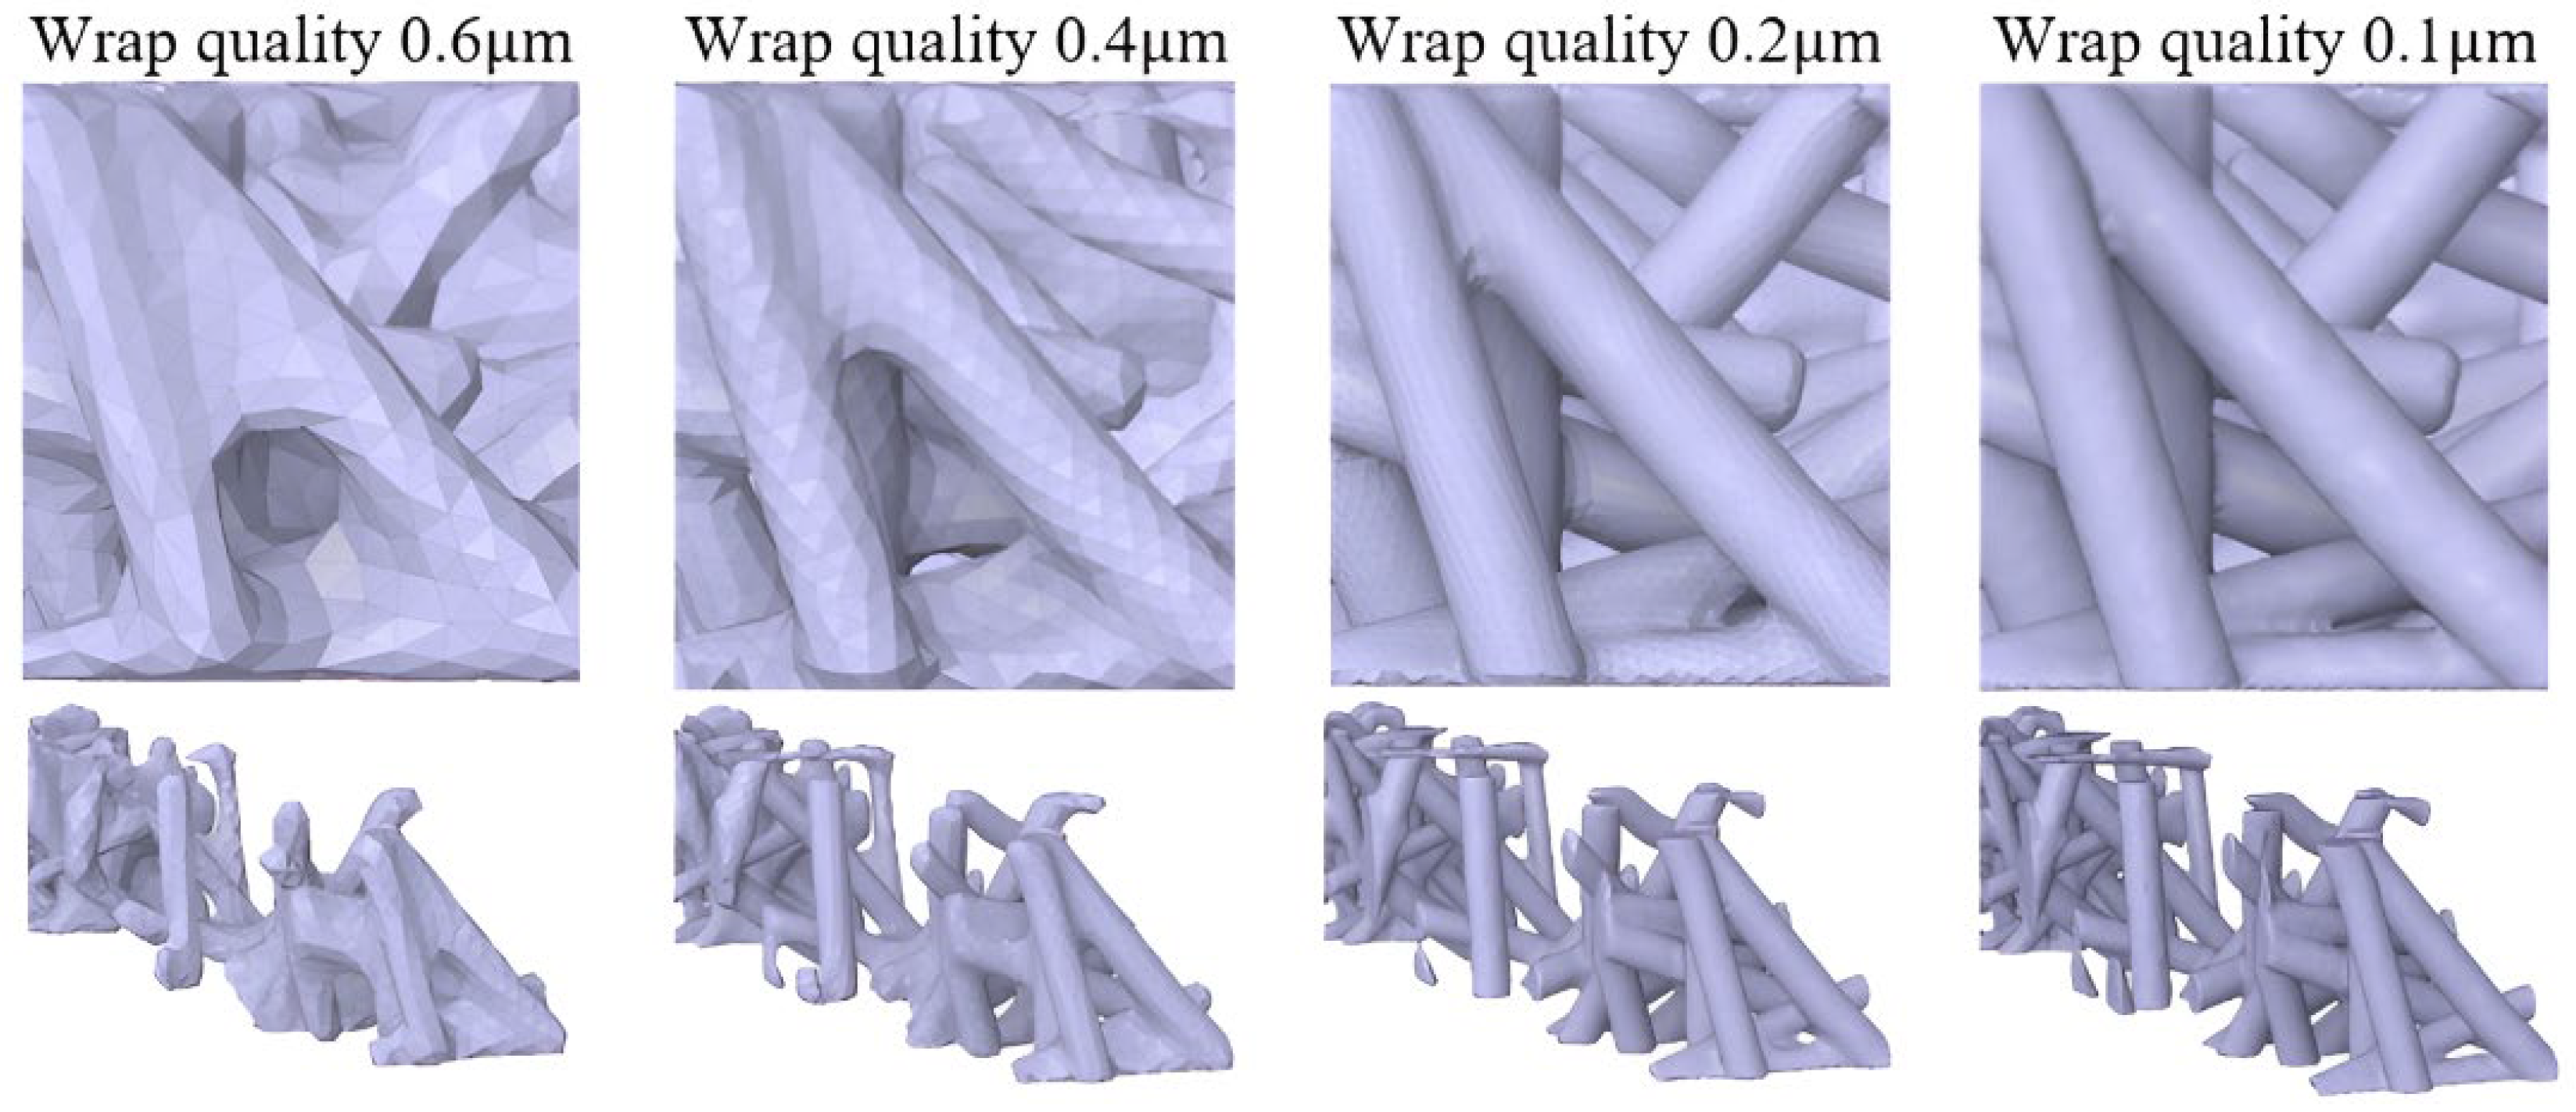
In addition to removing excess material and sealing unwanted holes, SpaceClaim version 2021 was employed, utilizing its shrinkwrap function to simplify and prepare the geometry for computational analysis. It is important to note that, during the geometry correction process, the accuracy of the model may decrease due to the approximation inherent in shrinkwrapping. Therefore, the impact of wrap quality was systematically investigated to determine the maximum allowable size of wrap elements that still ensures reliable results. This assessment included both a qualitative visual inspection of the wrapped geometry (see
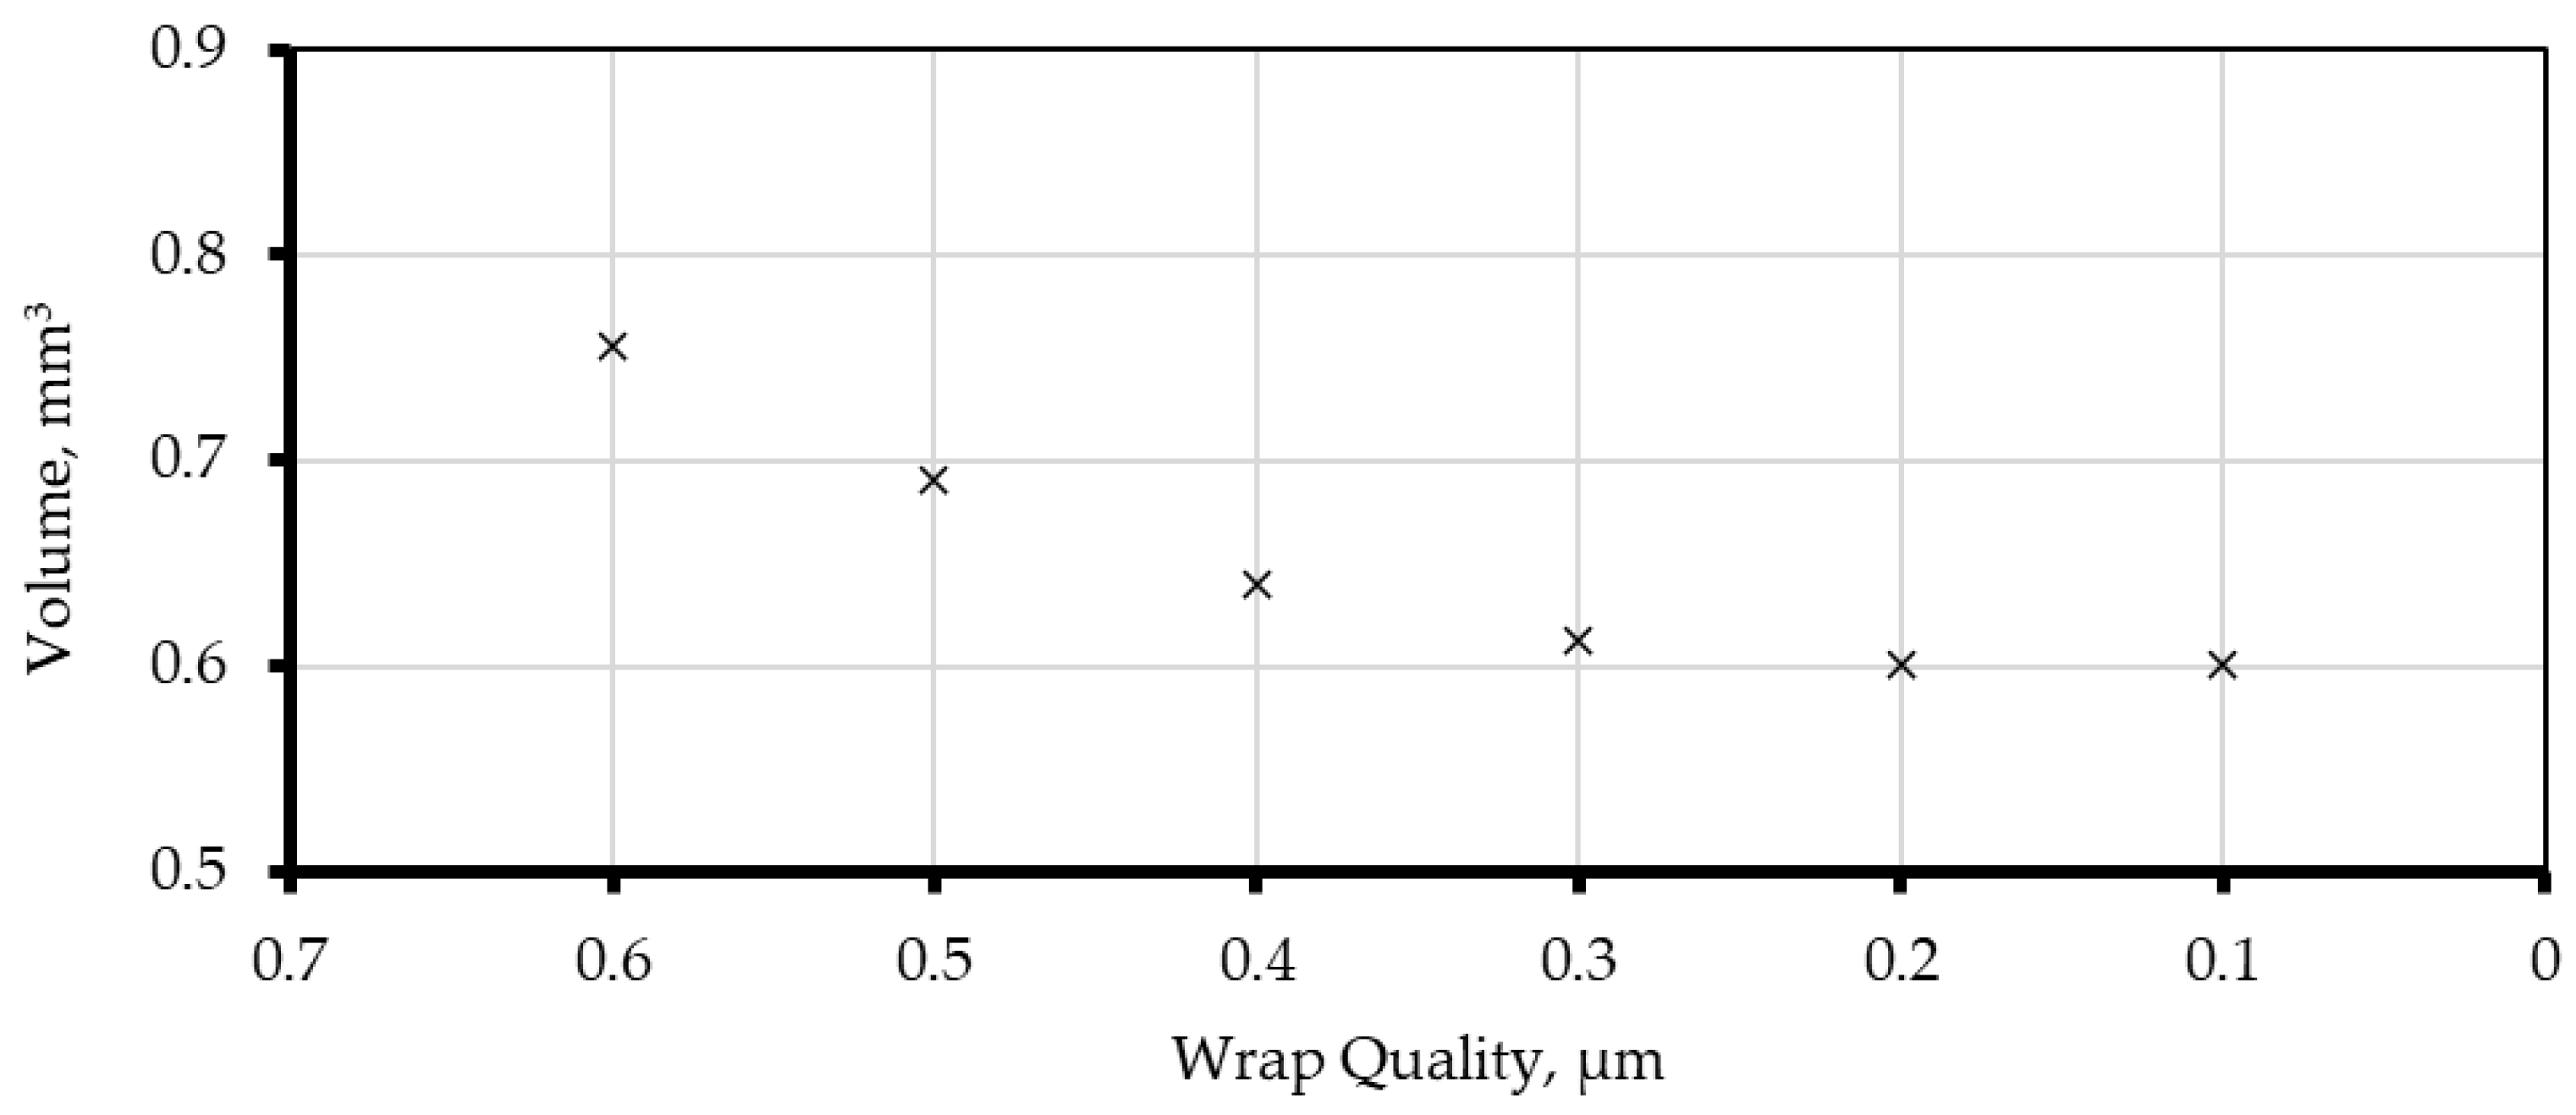
Figure 5) and a quantitative evaluation of the wrapping performance. The latter involved calculating the fiber volume as a metric for shrinkwrap quality. It was observed that as the shrinkwrap quality parameter is decreased (i.e., allowing coarser wrapping), the surface reconstruction of the fibers initially improves, resulting in a more continuous and smooth surface representation. However, this also leads to changes in the computed total fiber volume, highlighting a trade-off between geometric fidelity and smoothing. The study aimed to identify an optimal balance where the reconstructed geometry achieves a smooth surface without significant loss of volumetric accuracy.
Beyond this point, further reductions in the shrinkwrap quality parameter do not lead to improvements in surface quality or changes in the total fiber volume.
Figure 6 illustrates the relationship between shrinkwrap quality and total volume of fibers in the sample, showing that the total volume asymptotically approaches a constant value as the surface reconstruction quality improves (i.e., as the shrinkwrap quality parameter decreases).
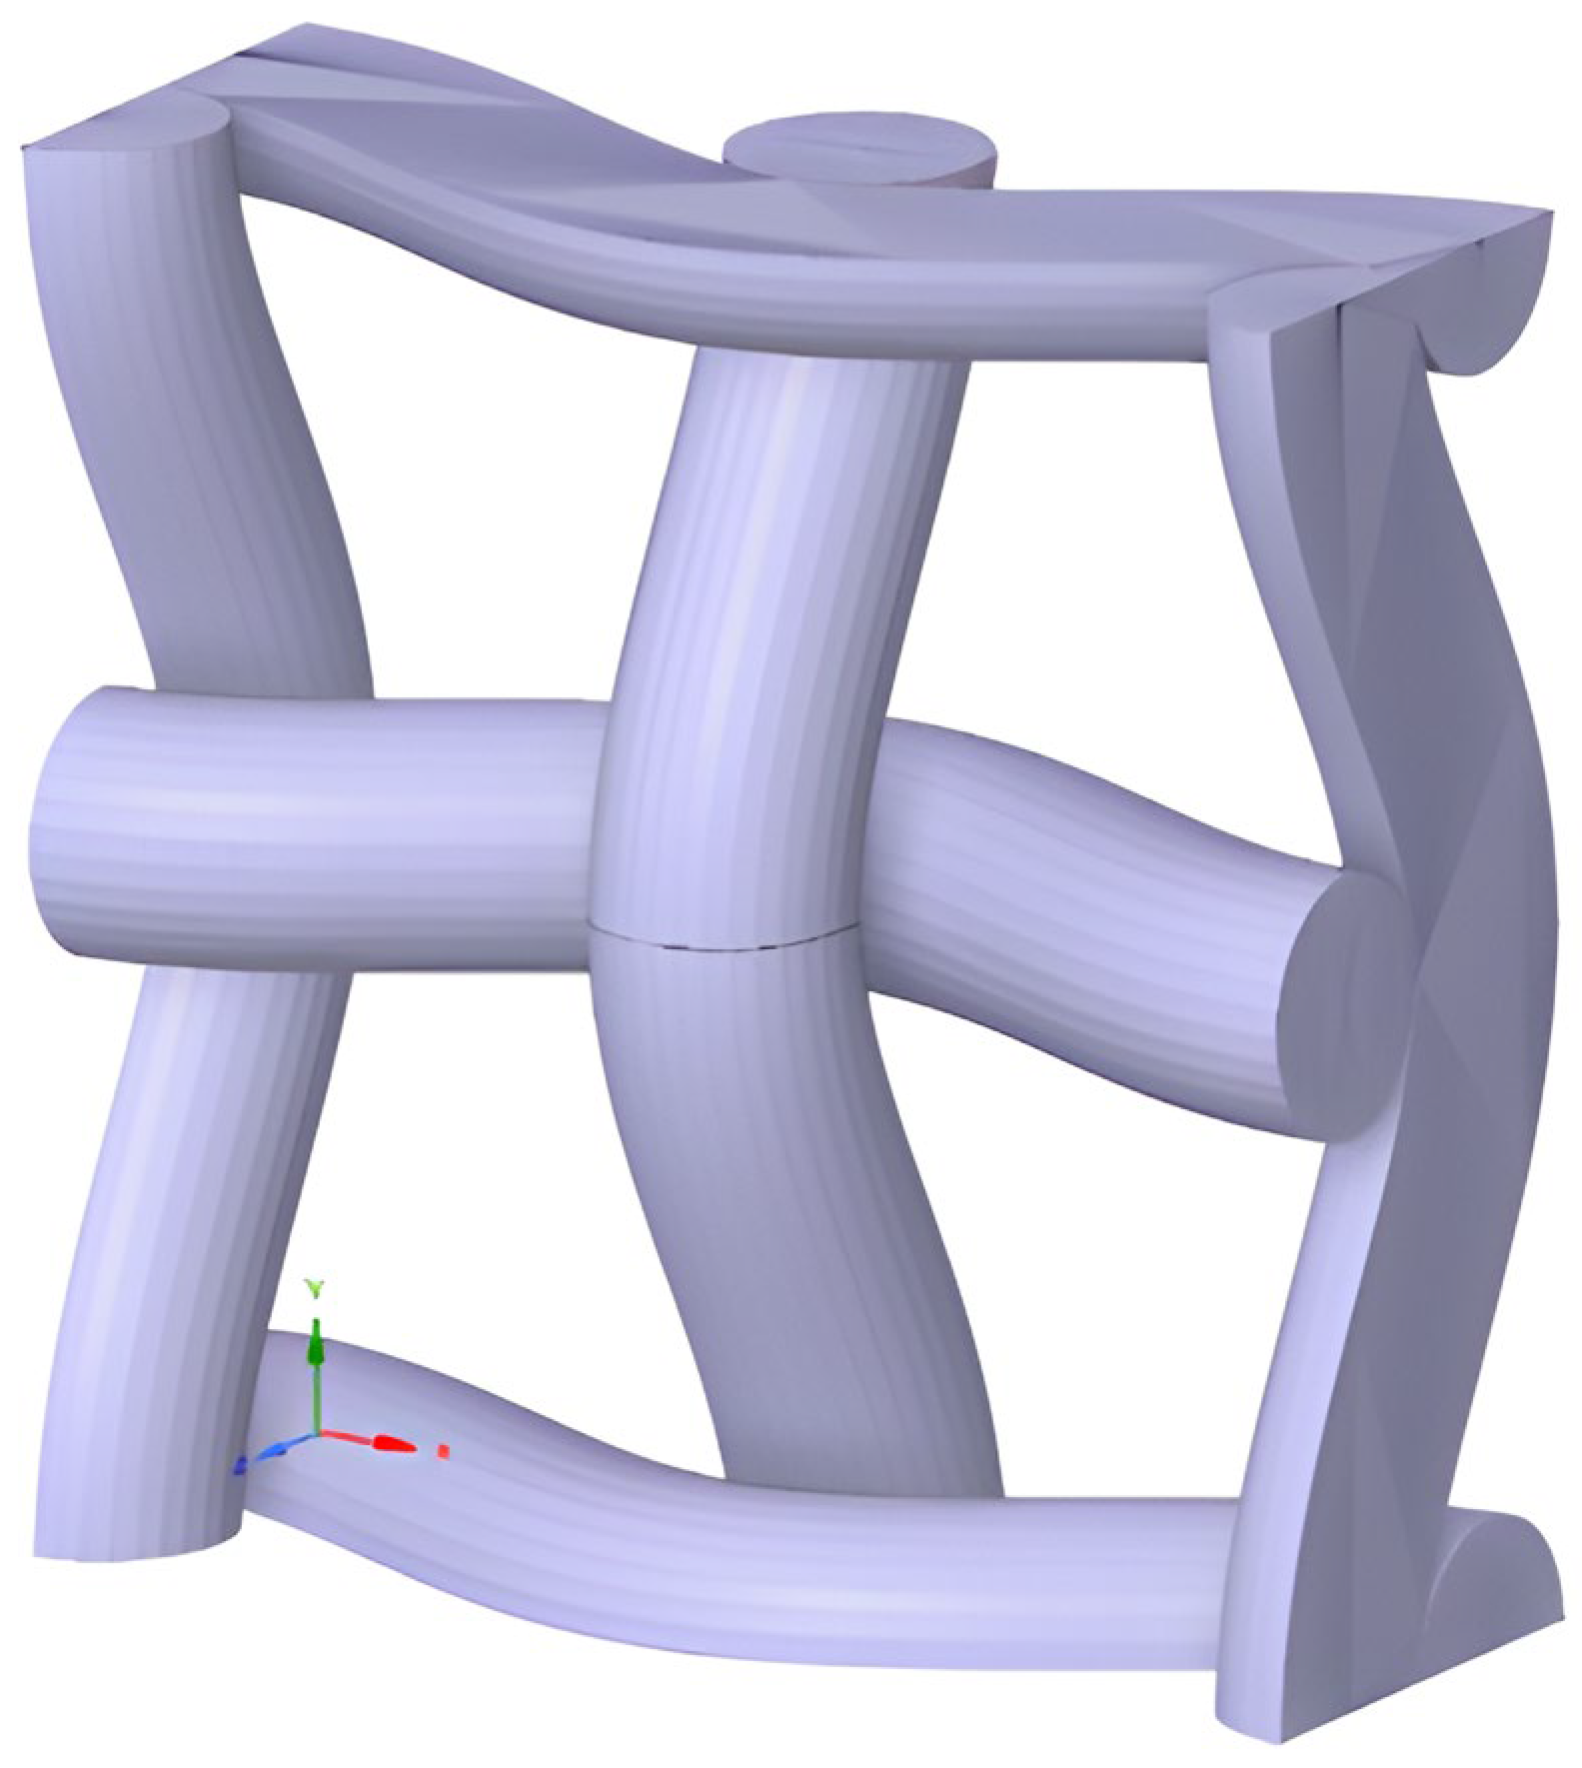
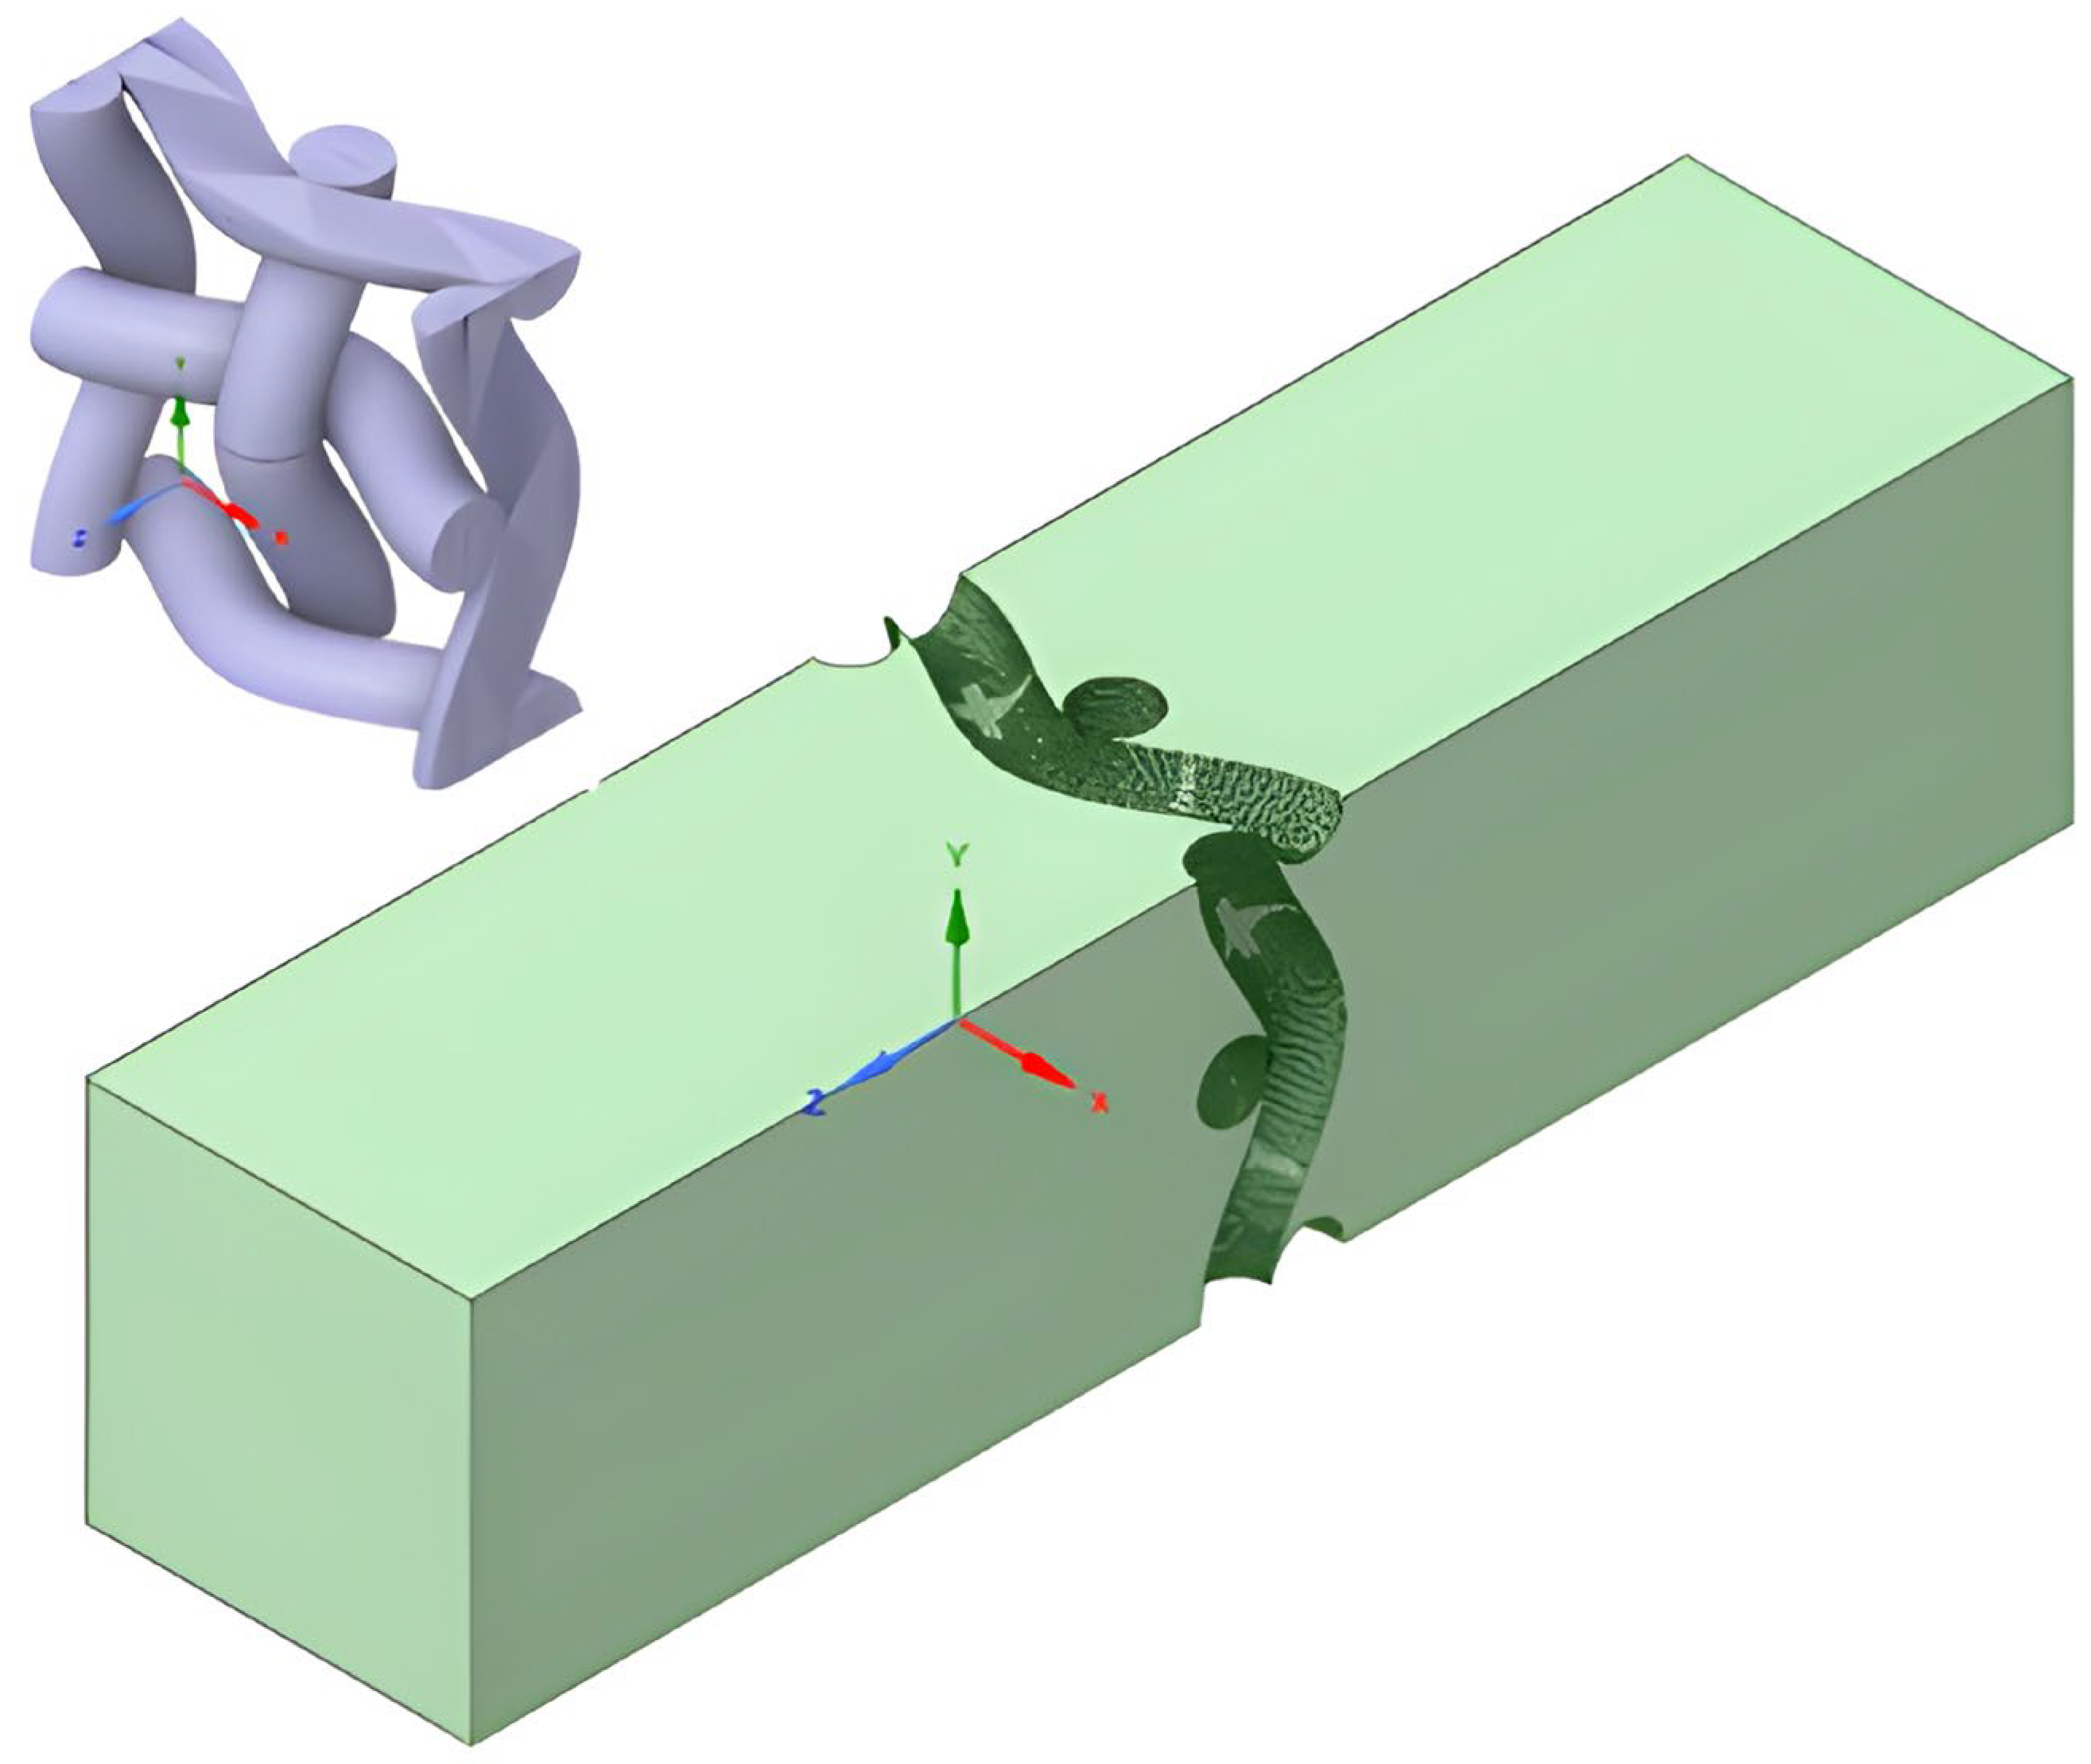
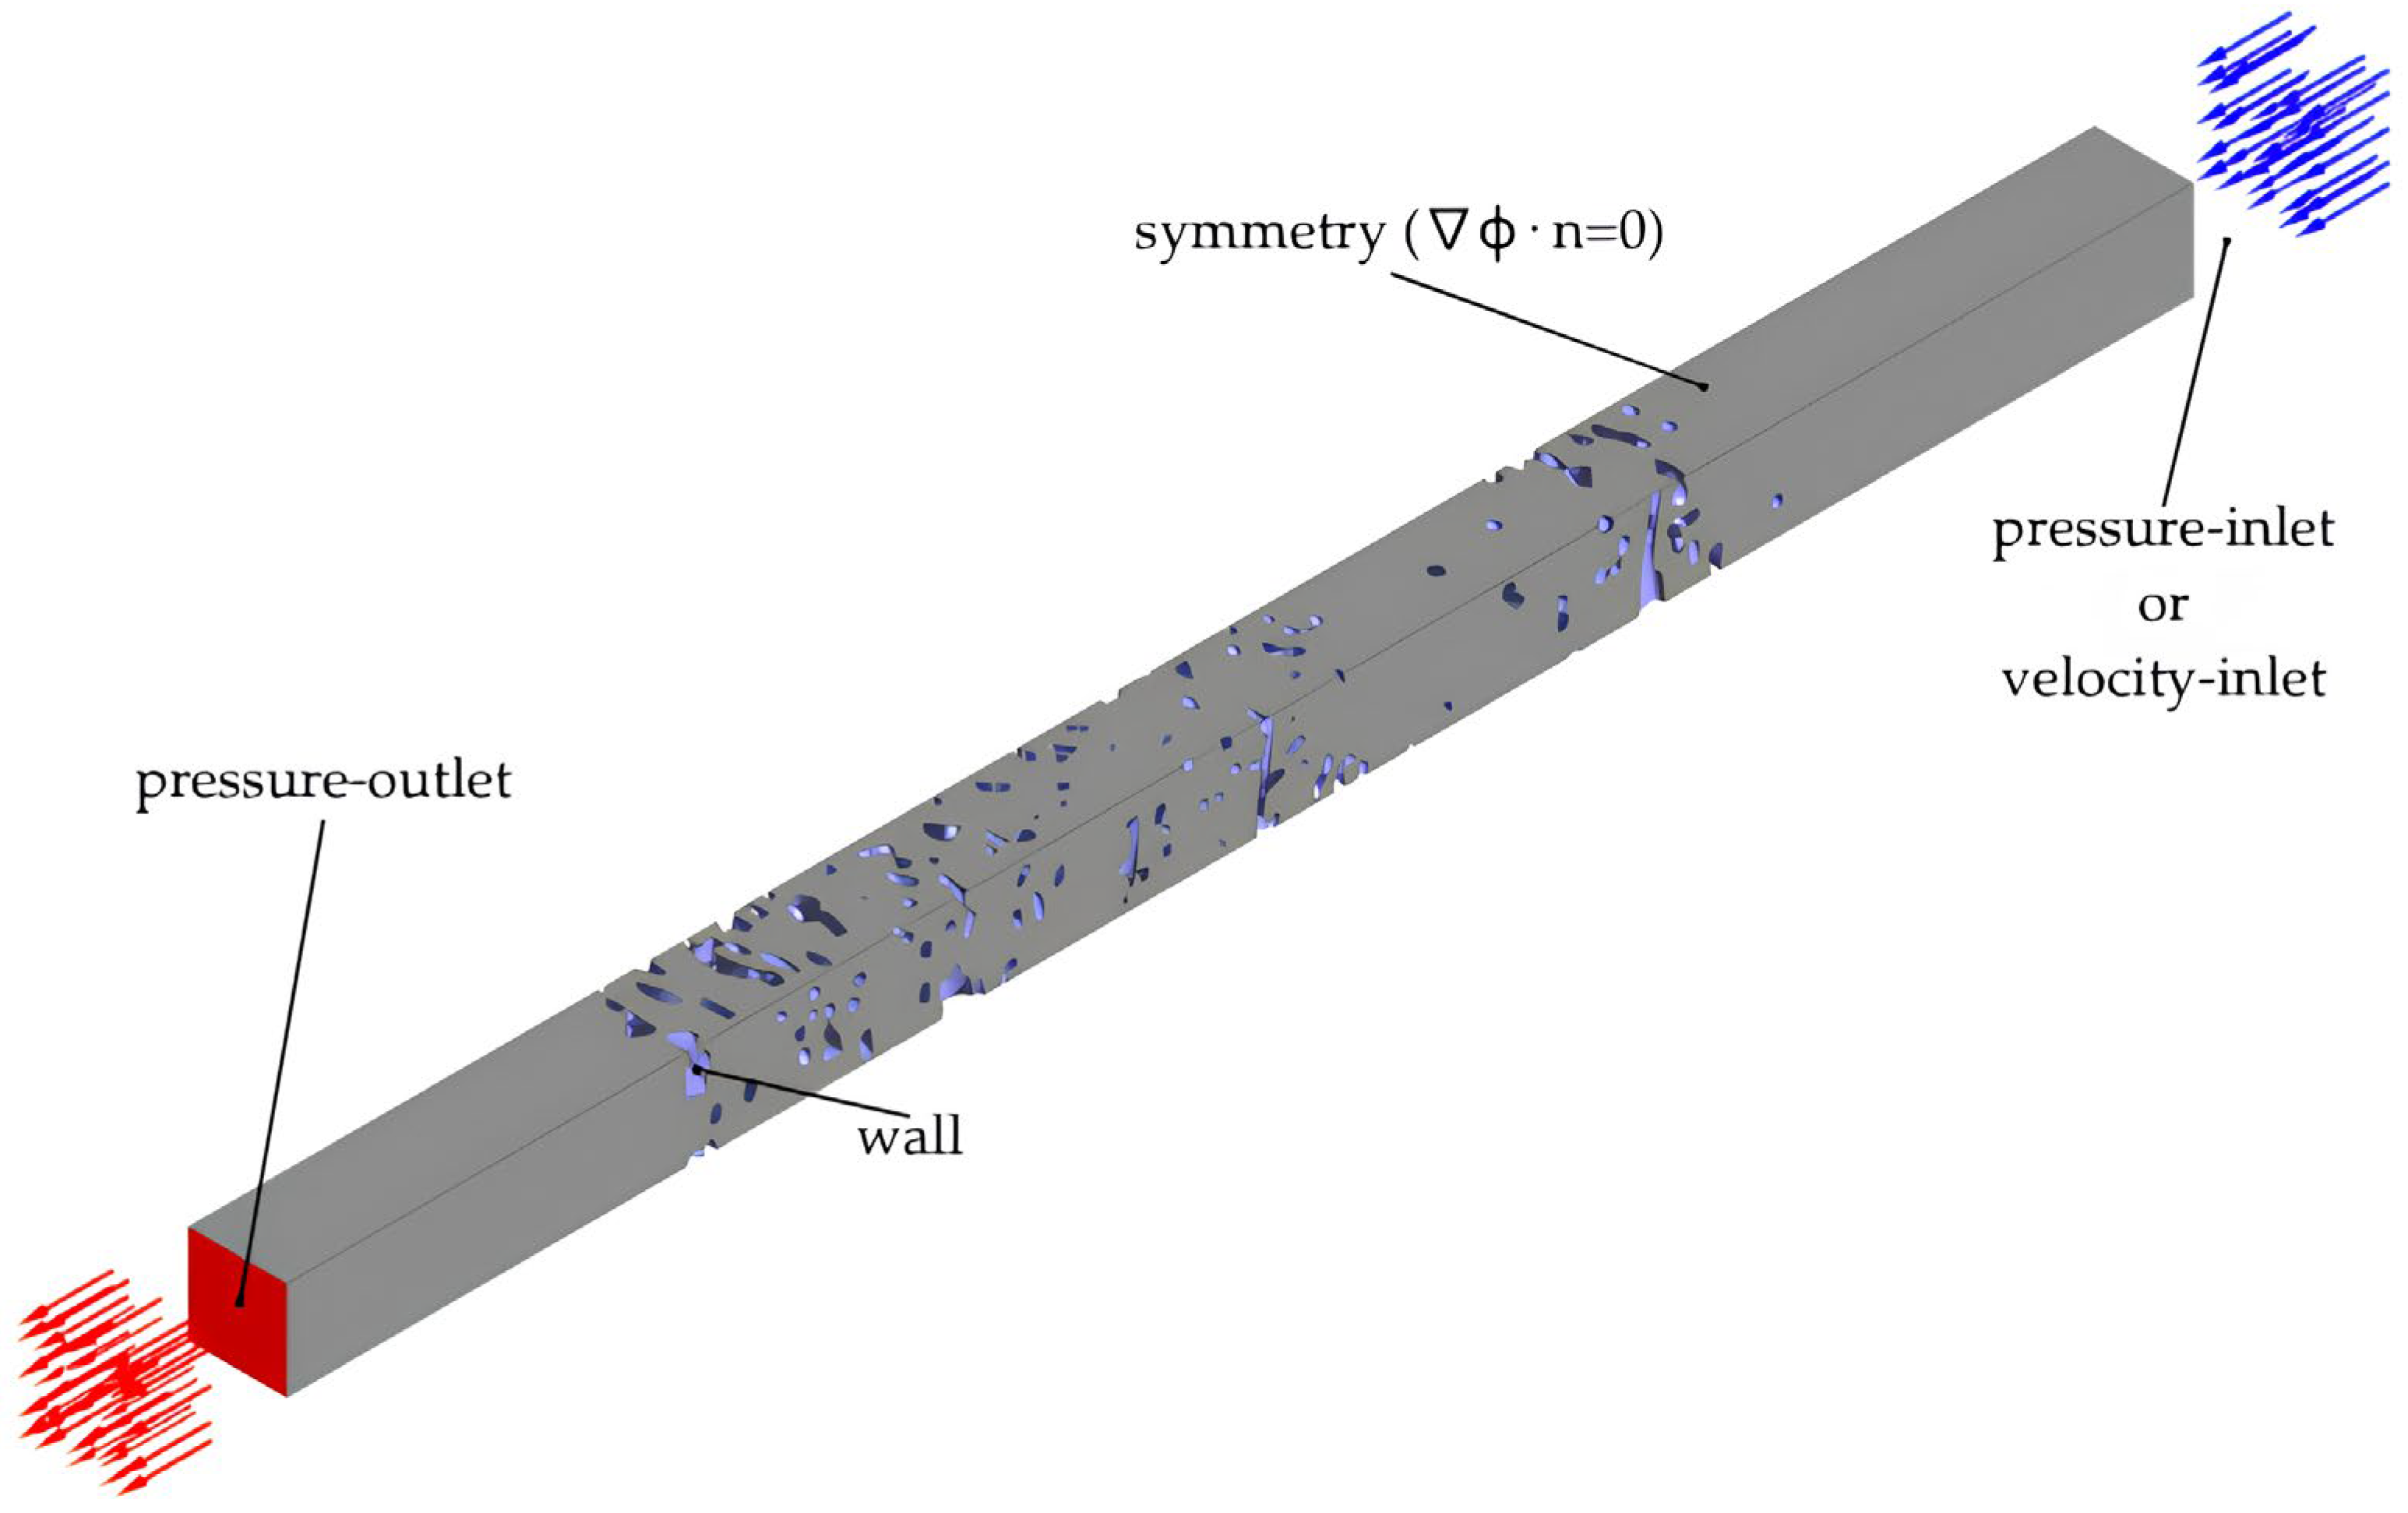
A similar analysis was conducted on a mesh filter, extending the study to include another type of filter material. The geometry of the material and the computational domains are presented in
Figure 7 and
Figure 8. In this case, the model was not derived from a CT scan; due to its simple microscopic geometry, it was possible to represent the porous medium quite faithfully using basic CAD tools.
The geometry did not require repairs as was necessary in the case of CT scans. However, its characteristics led to the presence of sharp edges during later stages of geometry preparation, an effect that became evident during surface mesh generation. As in the paper filter model, inlet and outlet run-up sections were implemented in the mesh filter. To prevent reverse flow, the lengths of both sections were set to 300 µm.
4. Numerical Mesh
A distinct challenge associated with geometries exhibiting highly irregular shapes, sharp angles, and complex edges—particularly those derived from 3D scanning techniques—is the frequent occurrence of difficulties during numerical mesh generation. Accurately representing real-world objects with high geometric fidelity often complicates the preparation of computationally suitable geometries. Inherent imperfections such as small holes, sharp edges, disconnected surfaces, and noise artifacts are common in scanned porous media geometries, which adversely affect the robustness and quality of mesh generation. To address these issues, a Fault-Tolerant meshing workflow is employed. This workflow is specifically designed to accommodate and correct such geometric defects during preprocessing, allowing for the generation of high-quality meshes despite irregularities and imperfections. By integrating automated defect detection, geometry repair methods, and adaptive meshing strategies, the Fault-Tolerant workflow ensures reliable mesh creation, thereby enhancing the stability and accuracy of subsequent numerical simulations.
By carefully following the settings and tools available in the environment used, it was possible to apply them effectively in obtaining optimized and appropriate meshes. As the Fault-tolerant type is dedicated to geometries with leaks, its use proved to have a significant impact on the study. Extract edge features allowed to improve the representation of sharp edges in the mesh generated and reduce the spreading of the surface mesh into the model. In the case of the real filter material model, a visual evaluation of the generated mesh indicated the need to limit the effects of imperfections in the geometry. Extracting the edges had a significant effect on the quality of the mesh in terms of surface mesh irregularities (see
Figure 9).
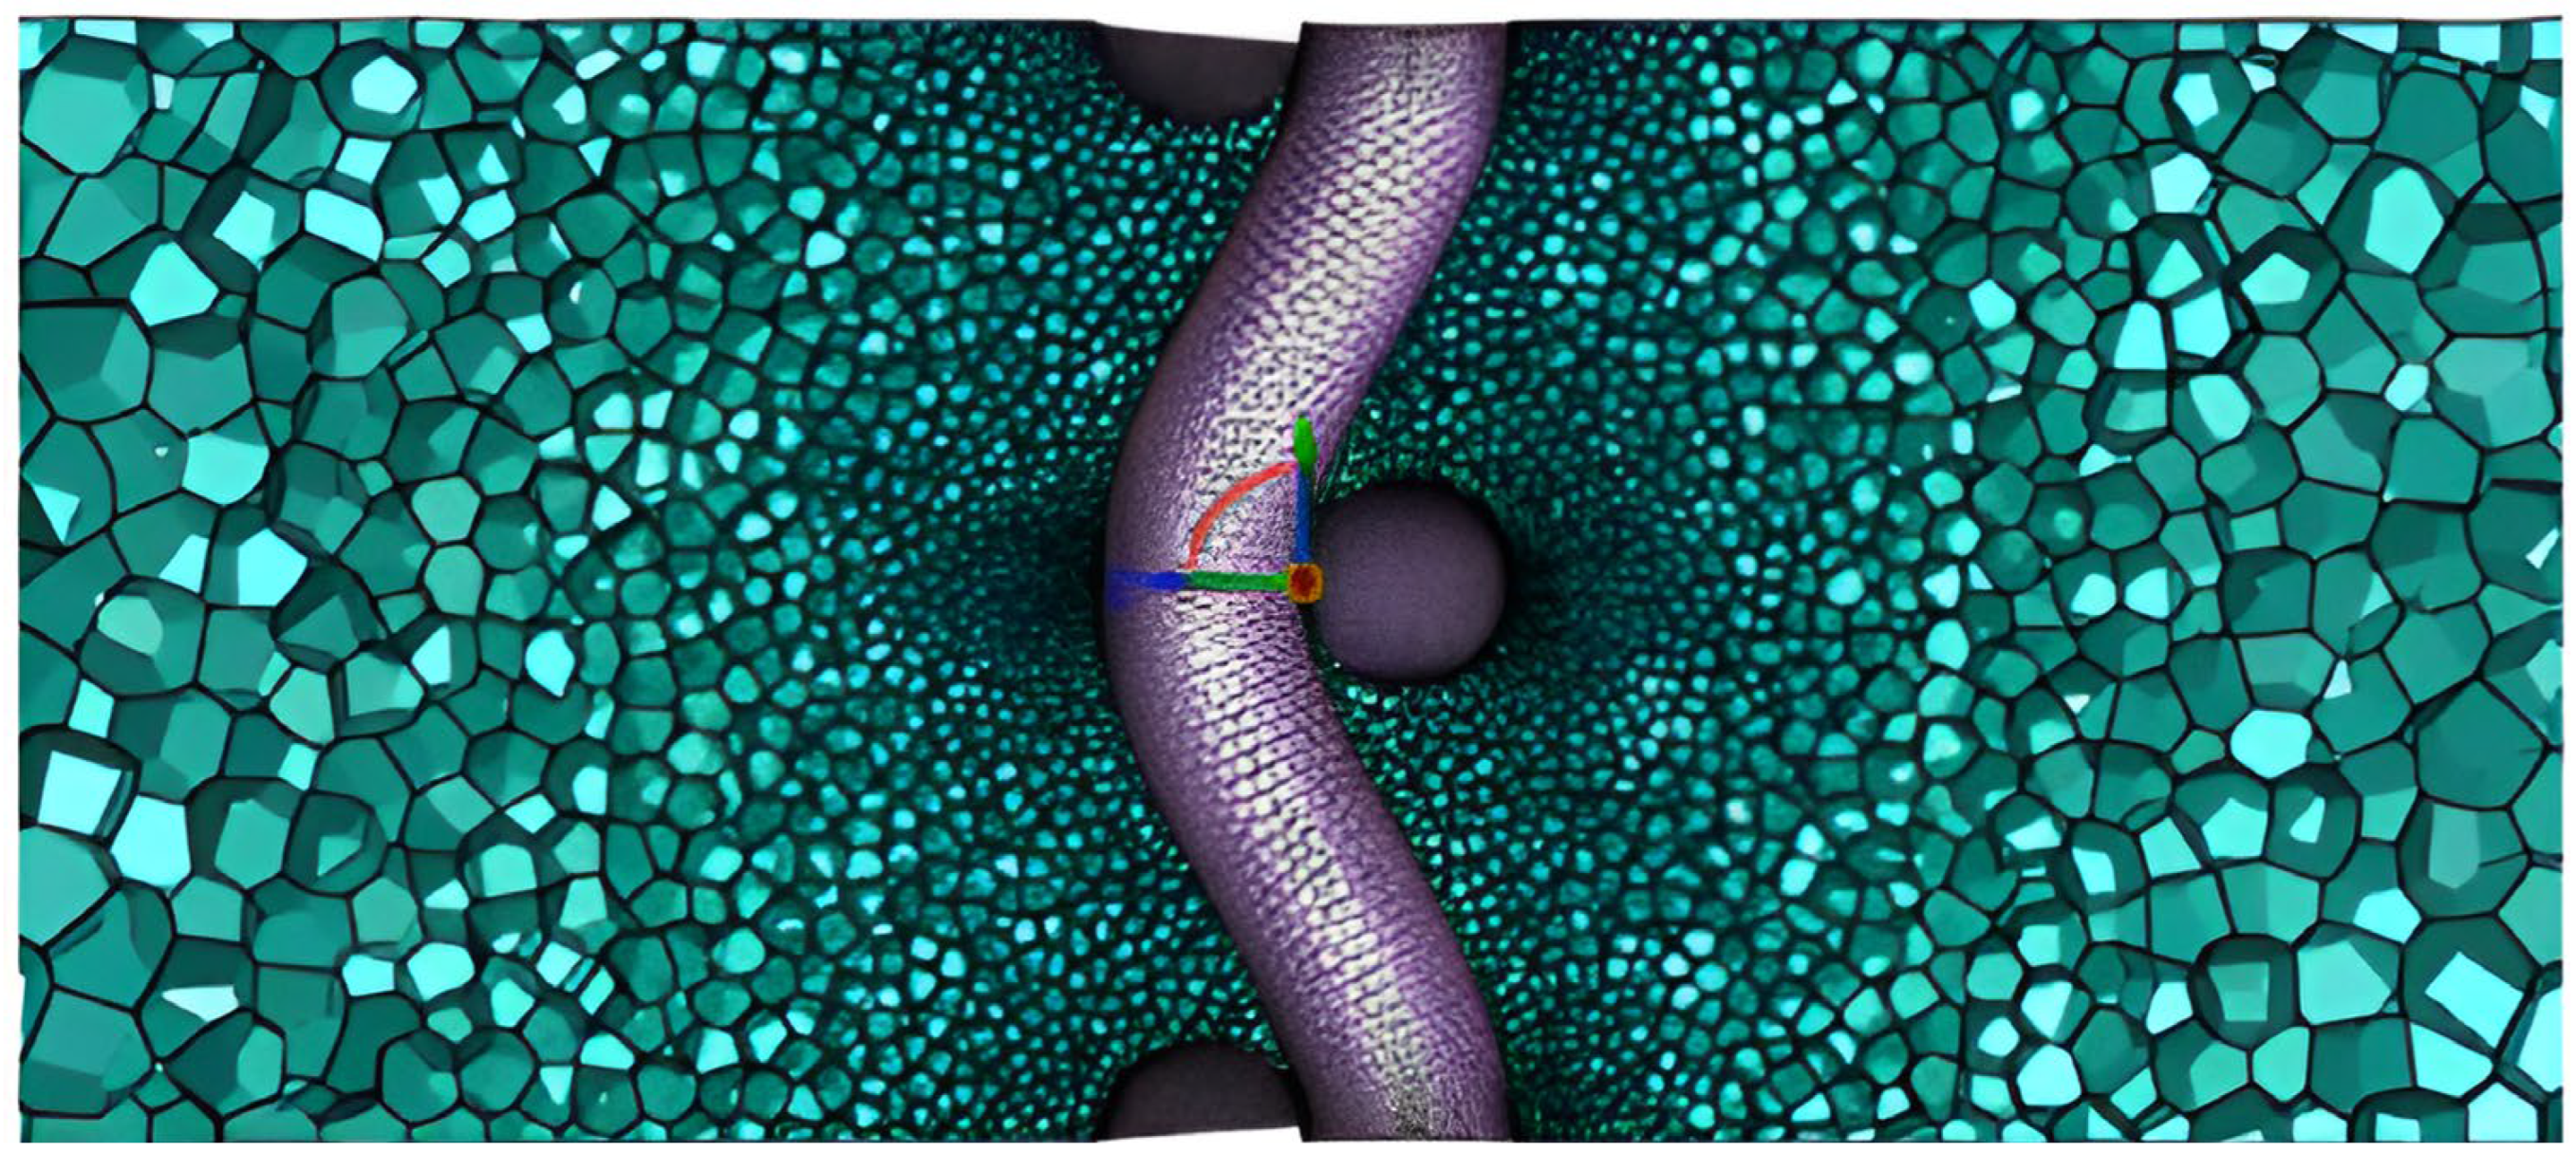
To evaluate airflow through porous media structures, local mesh refinement was applied in both models, allowing different mesh quality values to be determined at different locations in the geometry, see
Figure 10 and
Figure 11.
The concentration of smaller cell sizes can therefore be seen in the areas occupied by the filter fibers. A gradual increase in cell size in the outlet and inlet directions of the model is implemented by controlling the growth ratio. The quality of the generated meshes on the models that later took part in the calculations did not exceed the minimum threshold of 0.8 orthogonal quality, which indicates satisfactory correctness of the shape of the elements.
Assessment of the influence of the number and size of cells in the paper filter domain allowed to determine numerical values of approximate cell sizes, both maximum and minimum, in the local sizing settings. Test domains with larger sizes, i.e., 300 × 300 μm, were characterized by favorable mesh quality at maximum size settings of 40 μm and minimum size of about 0.4 μm. These settings, applied to the specific model tested, result in approximately 26 million cells. Smaller geometries, cut from the tomographic scan, retained adequate quality with the same maximum cell size as in the previous case. However, the minimum cell size had to be adjusted to the domain dimensions by implementing a value of 0.1. Average values for the number of cells for meshes with these settings reached 3.5 million, depending on the test sample.
6. Results
An evaluation of the sensitivity of the simulation results in relation to the mesh size was performed for a medium sized geometry of 140 × 140 μm. The resulting graph shown in
Figure 13, based on the calculations performed, shows an acceptable convergence of results for mesh sizes larger than 6 million cells, which also guarantees a reasonable level of quality. The size of the element that is considered to provide reliable results with the reasonable computational cost is 1 μm and 0.1 μm for maximum and minimum cell size, respectively.
In the case of wire filter, the study of the effect of maximum size was carried out for a size range from 20 to less than 2 μm with a fixed minimum size of 0.001 μm. The minimum size of the mesh element is an order of magnitude lower than the accuracy of the geometry representation and its further decrement does not affect the results. Analyzing the effect of maximum element size on the numerical study was conducted.
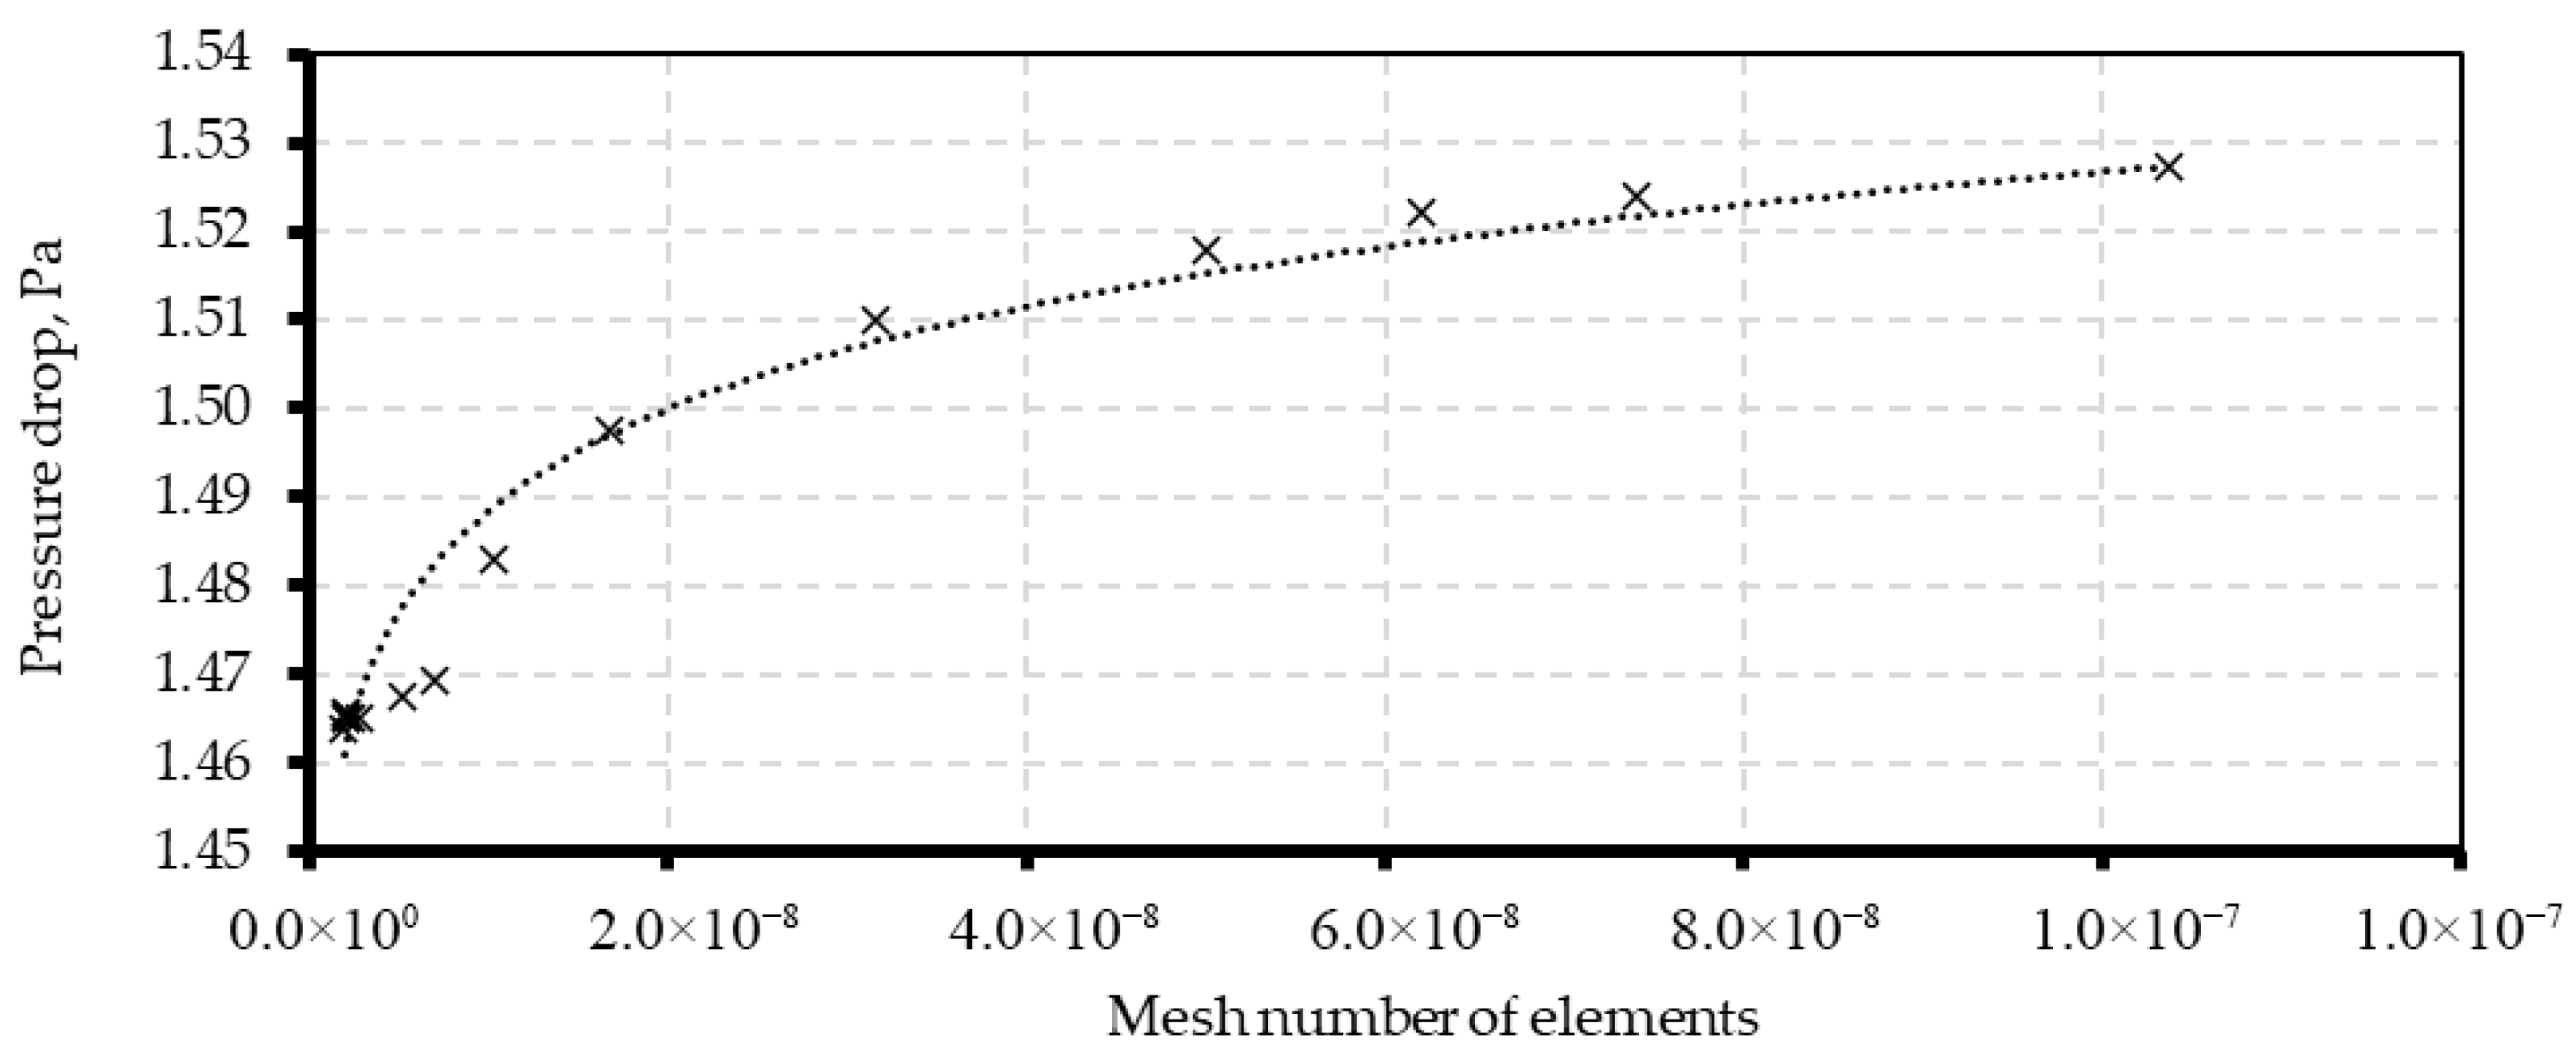
Figure 14 illustrates the effect of the number of elements on the pressure drop, demonstrating an asymptotic convergence of the results. The size of the element that is considered to provide reliable results with the reasonable computational cost is 0.01 μm minimum and 10 μm maximum what corresponds with the mesh of over 10
5 elements.
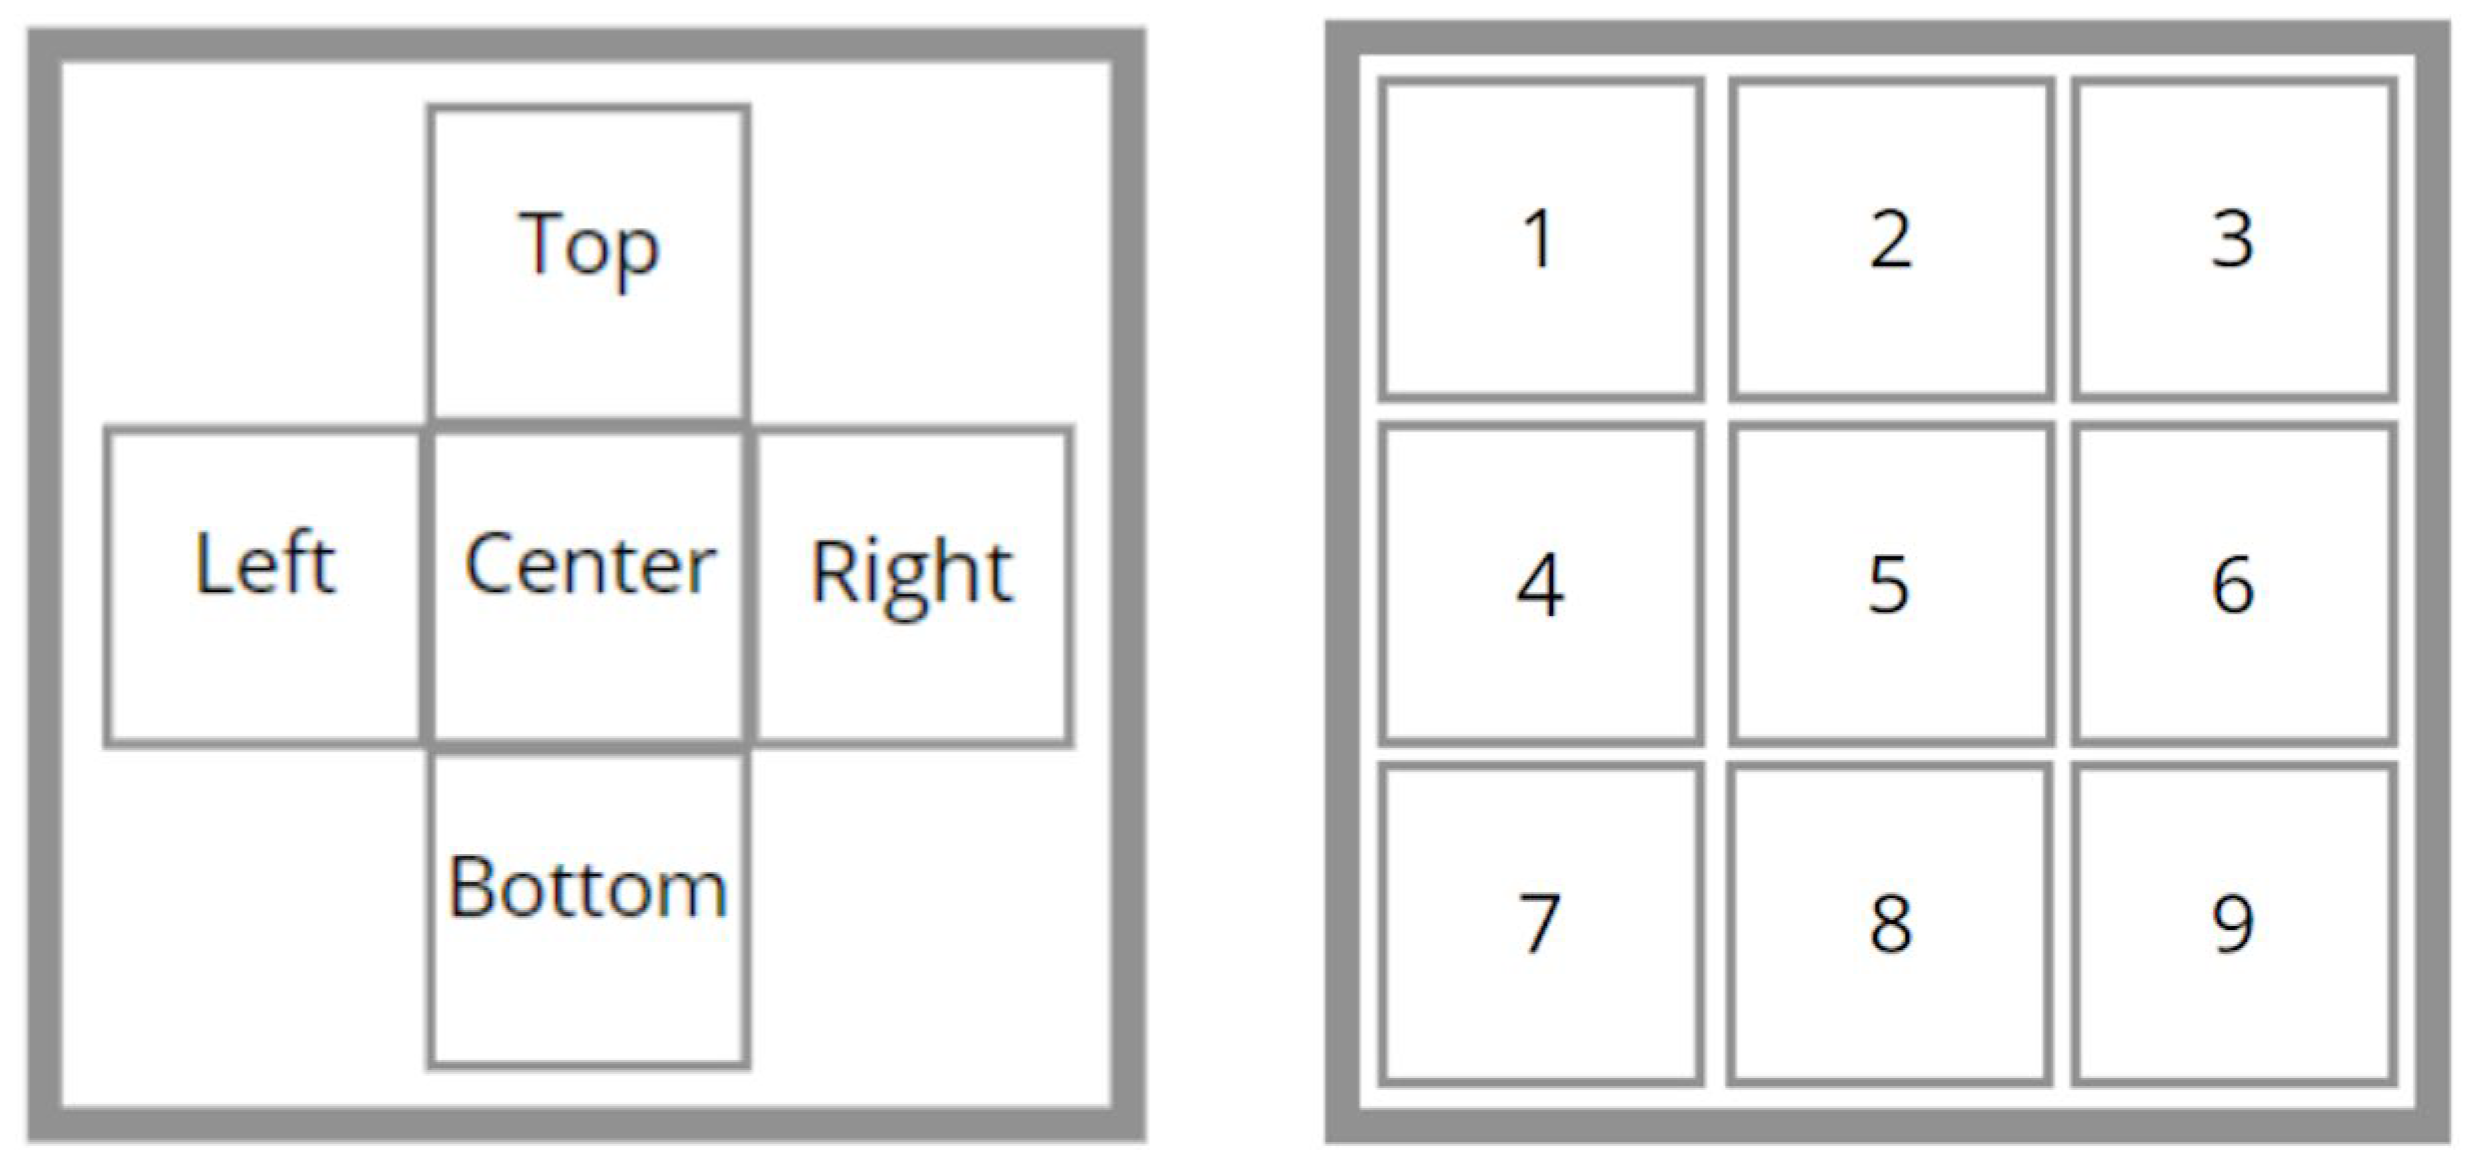
Numerical calculations of the pressure drop through the filter geometry, reconstructed from the original scan, were validated against experimental data. Because the full geometry (1024 × 1024 µm) would have required prohibitively high computational resources, the analysis was restricted to five 300 × 300 µm slices extracted from the center as well as the upper, lower, left, and right regions. To further resolve local variations, the central slice was subdivided into nine equal regions of 100 × 100 µm each. The specific areas of all geometries analyzed are shown in
Figure 15.
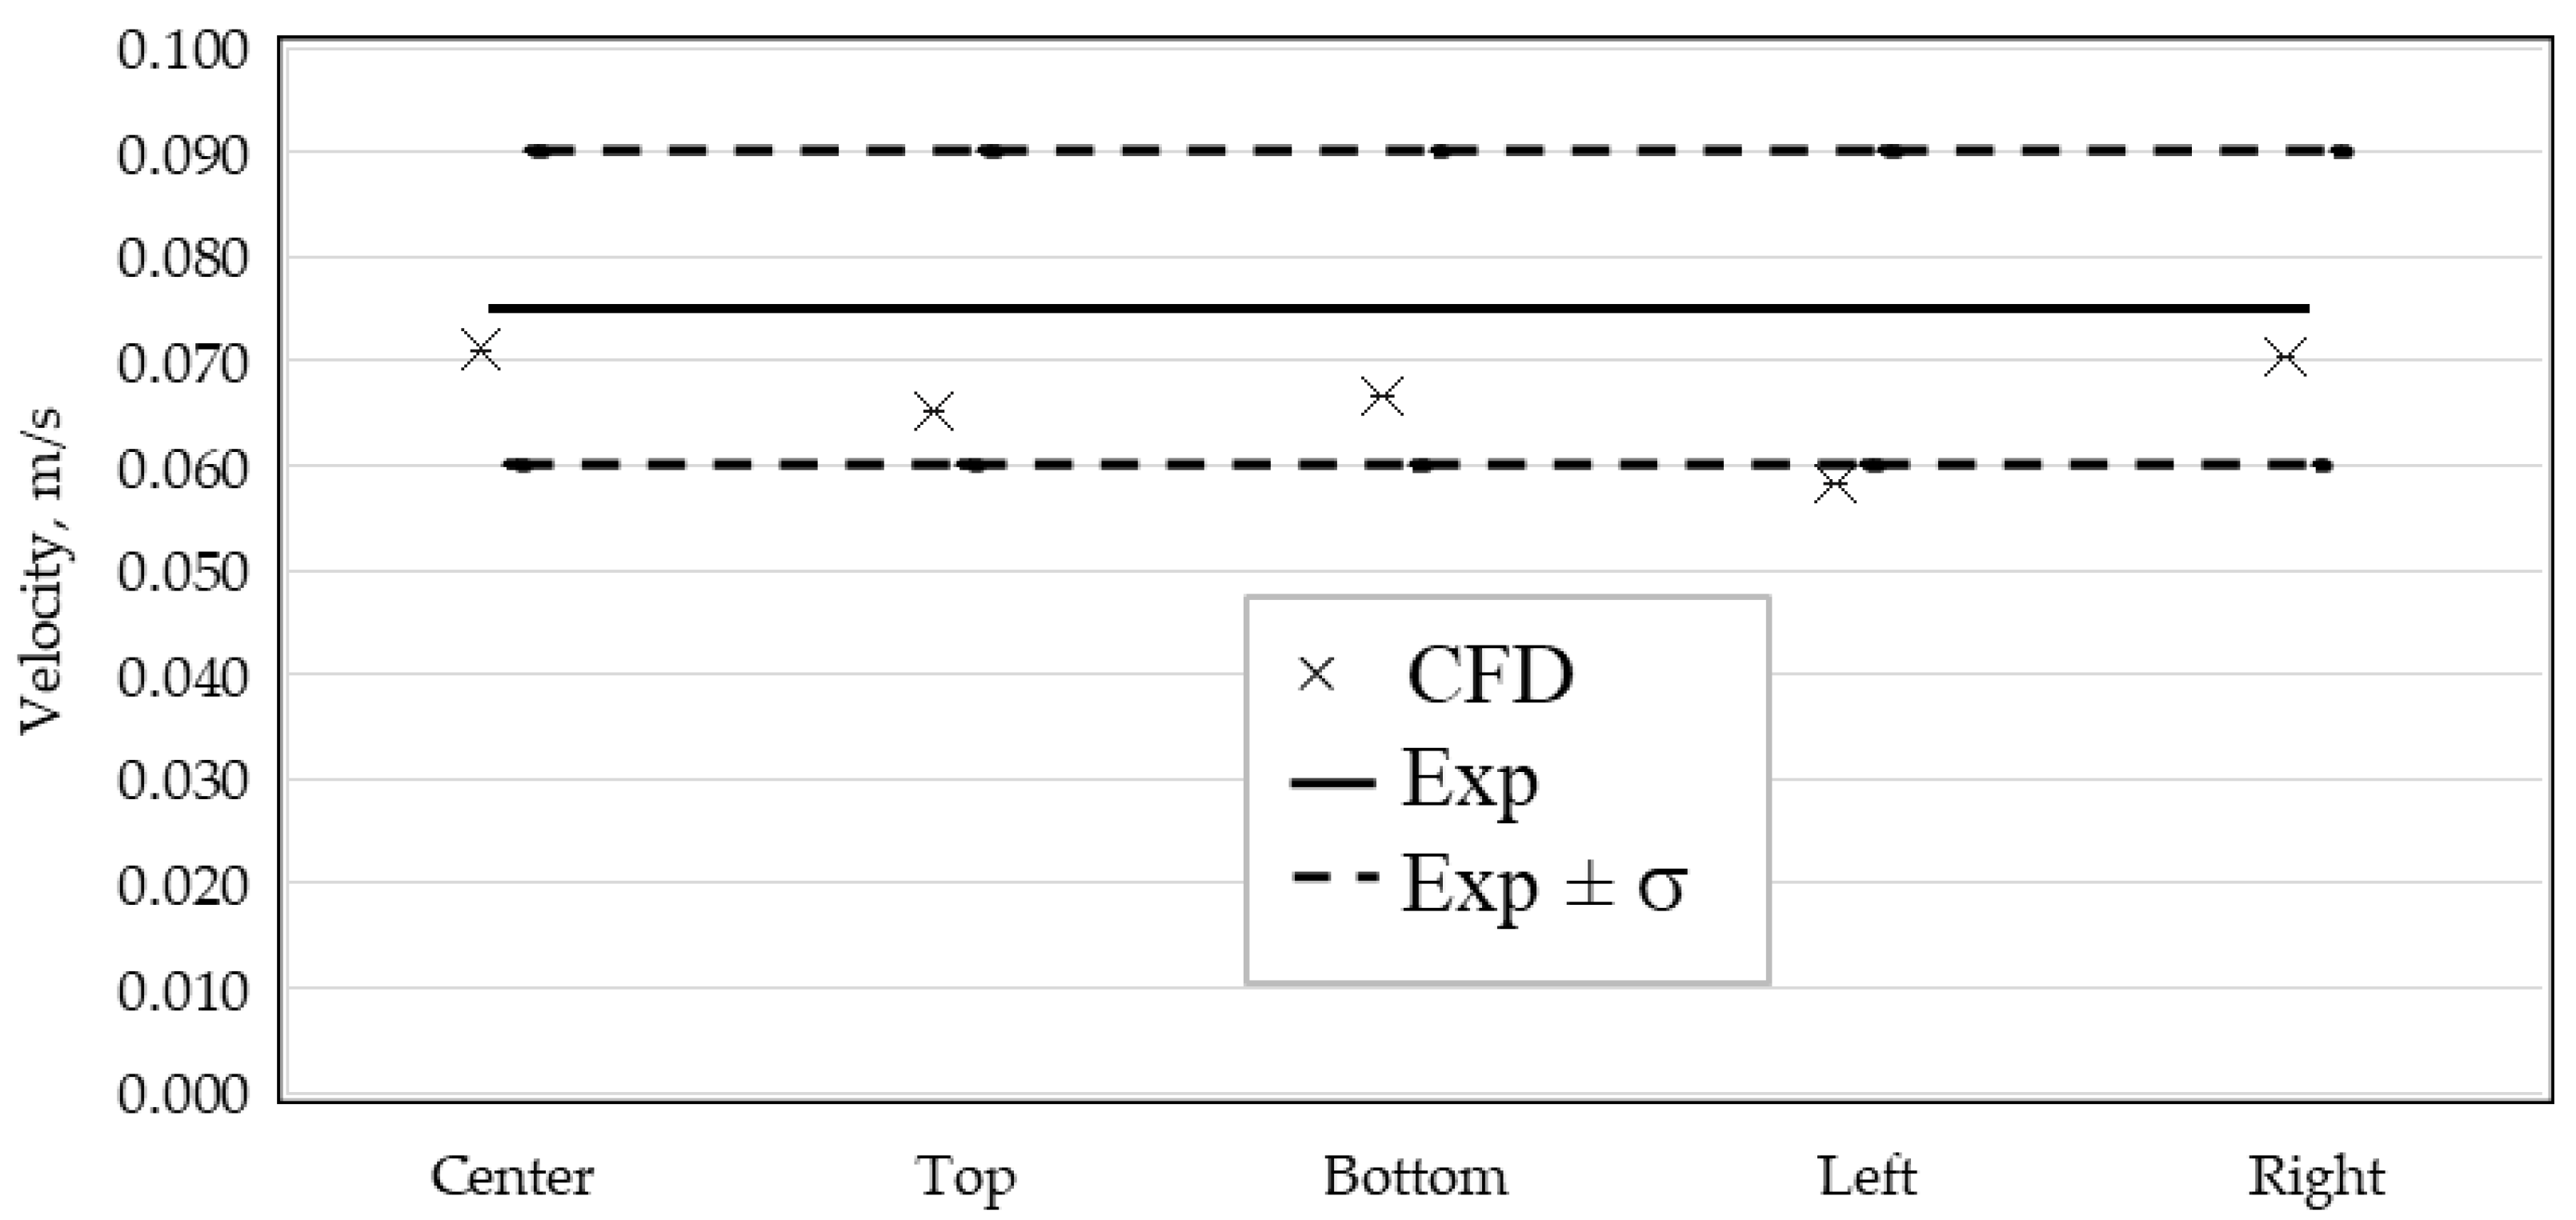
Differences in simulation results were observed between the individual subregions of the same geometry (
Figure 16). Since the central slice produced results most consistent with the experimental measurements, nine additional subregions were extracted from this area for further analysis.
Figure 17 presents the outcomes of these nine simulations compared with the experimental reference. Notably, subregion 9 yielded a result in close and satisfactory agreement with the empirical data.
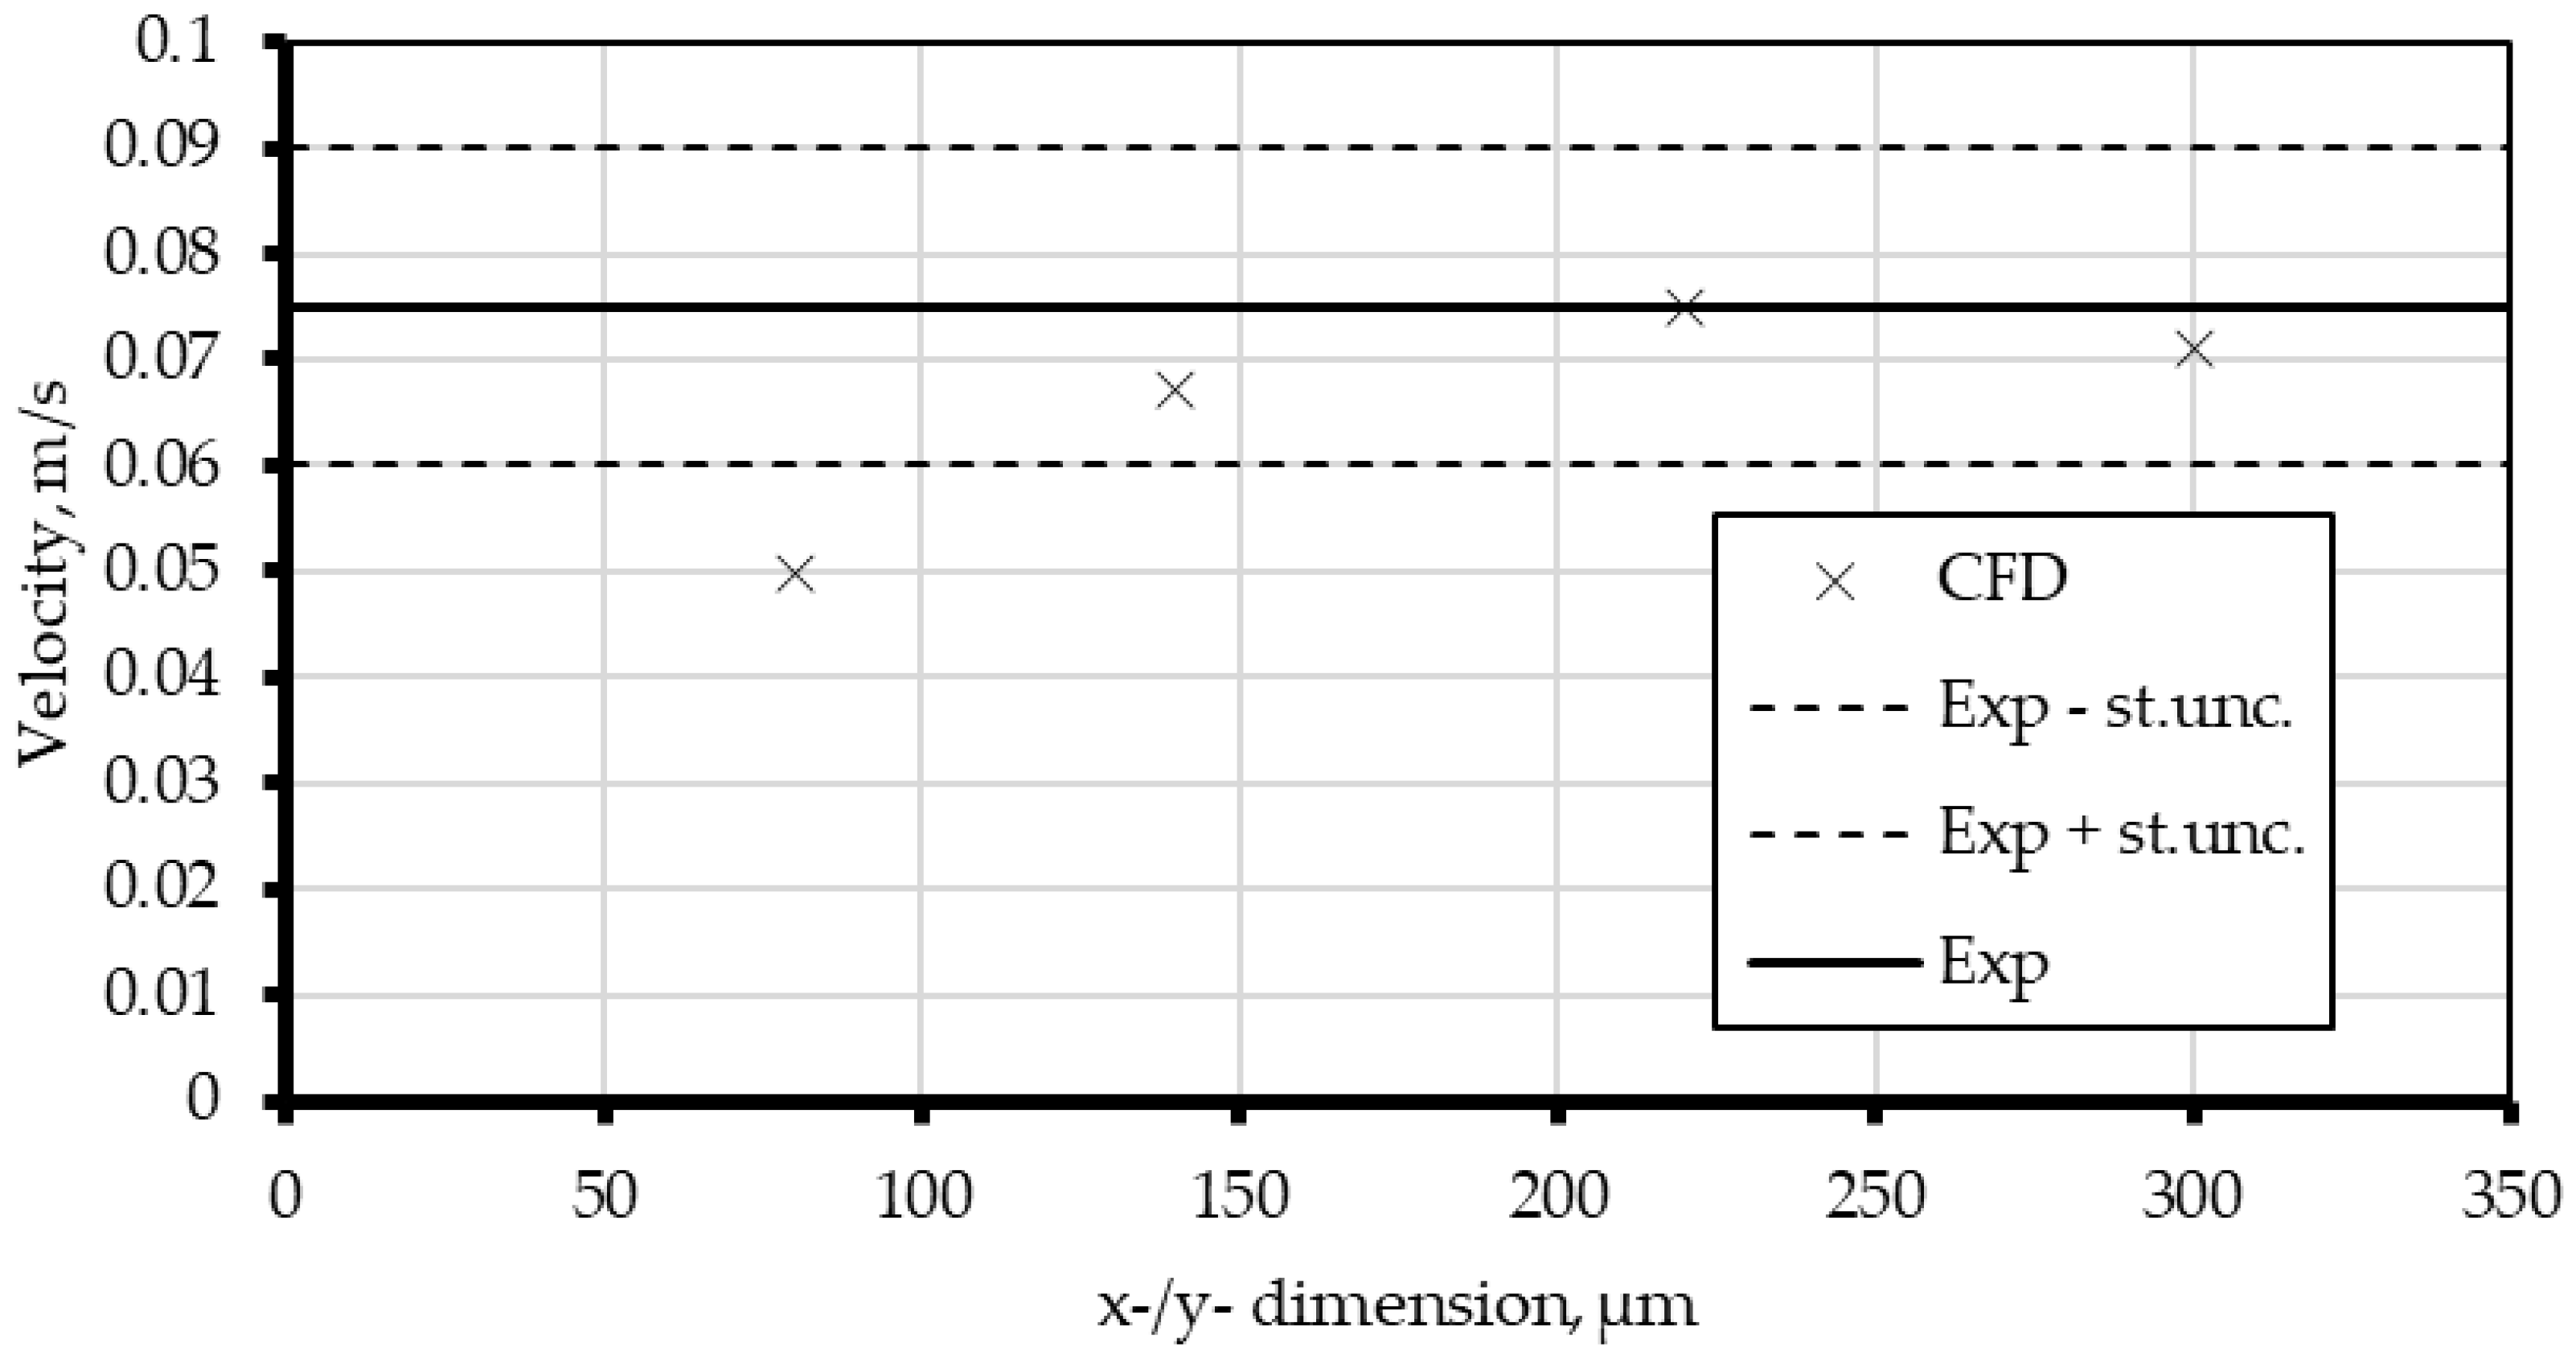
The shrinkwrap function, which determines the fidelity of the reconstructed geometry and its correspondence to the actual filter material, significantly influences the simulation outcomes. In this study, a shrinkwrap resolution of 0.3 μm was selected as it provides reliable results within reasonable computational time. The primary parameter evaluated was domain size, with additional subdomains extracted from available geometries specifically for this assessment. As shown in
Figure 18, a subdomain with an edge length of 300 μm offers a satisfactory approximation of flow phenomena through the filter medium.
A sensitivity analysis of the simulation results in a change in the maximum element size at a constant minimum size showed significant discrepancies from the expected results. With decreasing element size the number of elements rises significantly, see
Table 1, however with decreasing size of mesh elements there is an observable tendency to reach a pressure drop limit.
7. Conclusions
The presented study of the methodology of using real geometries in numerical analyses showed the need for high accuracy in preparing models used later in CFD calculations. According to the research performed, when using the shrinkwrap tool, one should not use an accuracy lower than that which faithfully represents the shapes of the geometry under study, which in the case of a 3D model of paper filter is in the range of 0.2–0.3. As shown by the graph in
Figure 5, the volume occupied by the fibers is dependent on the quality of the wrapping, which also affects the calculation results.
The analysis of the influence of the element size indicated a high correlation with the quality of the mesh and therefore the numerical simulation results. From observing the process of assessing the influence of the minimum element, it was also demonstrated that using a size below the accuracy of the mesh is unnecessary and does not improve the quality of the mesh or the calculation results.
Geometries with regular shapes show less sensitivity to the correction of element sizes when generating the mesh, as highlighted by the wire filter study. In contrast to this type of geometry, a paper filter model built from irregularly spaced fibers of different diameters is more susceptible to cell size adjustments in the mesh generation process. A good practice, which has been implemented in the presented work, is to analyze a cut-out much smaller than the target domain size and to check the cut-outs selected from different locations of the original geometry. These measures make it possible to obtain information about the influence of local differences in the structure of the filter material on the computational results.
The importance of using run-up sections in flow calculations has been evaluated and found to have negligible influence on the results; however, in the absence of particularly short length of run-up sections the model is prone to turbulence and backflow effects.
The methodologies discussed in the presented paper show great potential for effectiveness in the study of real microscopic models of filter materials and other porous structures.
This analysis verified the possibility of using a smaller section of the original model to faithfully represent and capture the phenomena occurring in the flow. Owing to the research carried out and the methodology developed, further development of the presented study indicates the potential for obtaining useful and reliable results in the analysis of a wide range of pollutant filtration present in flows.

