1. Introduction
The continuous development of unmanned aerial vehicles (UAVs) and small-scale propulsion systems has led to a growing demand for compact, reliable, and efficient micro gas turbine engines [
1,
2]. These engines offer unique advantages over conventional piston-based propulsion, including high power-to-weight ratios, multi-fuel capability, and reduced vibration, making them suitable for both defense and civilian applications [
3,
4]. However, despite significant advances in micro gas turbine technology, detailed performance data across operating regimes remain scarce, particularly in terms of thrust, fuel consumption, exhaust gas temperature, and specific fuel consumption [
5]. Unlike piston engines, micro gas turbines deliver significantly higher power-to-weight ratios, operate with reduced vibration and mechanical complexity, and exhibit inherent flexibility to run on multiple fuel types. These features make them especially well-suited for UAV applications where the payload capacity, mission endurance, and adaptability to varied environments are critical [
6,
7].
Nevertheless, despite their increasing relevance, the availability of detailed performance data for micro gas turbines remains limited. While manufacturers typically provide specification sheets with baseline performance indicators such as maximum thrust or nominal fuel consumption, the evolution of these parameters across different operating regimes has been less documented. This knowledge gap restricts the ability of researchers and engineers to perform accurate gas-dynamic modeling, optimize engine operation for specific missions, or benchmark engines against one another in a normalized framework. Parameters such as thrust, fuel flow, exhaust gas temperature (EGT), and thrust specific fuel consumption (TSFC) are of particular importance, as they directly affect mission planning, endurance, fuel logistics, and system integration [
8,
9].
AMT Netherlands designs and manufactures micro gas turbine engines primarily used as propulsion power for UAVs, and also produces specially modified engines for experimental and research purposes, providing complete educational testing facilities [
10,
11,
12]. Currently, AMT Netherlands offers a range of five engines with different thrust ratings: Pegasus HP (167 N), Olympus HP (235 N), Titan (392 N), Nike (784 N), and Lynx (1569 N) [
10]. All engines are based on a complete in-house AMT design, featuring a single shaft, a centrifugal radial-flow compressor, an annular combustion chamber, an axial-flow turbine stage, and a convergent jet nozzle, delivering exceptional thrust-to-weight ratios with low fuel consumption [
10,
11]. Generally, the operating regimes of the engines are described using variation curves between certain performances and main parameters, since the actual parameter or performance values at different engine regimes are not provided [
13,
14,
15]. Usually, depending on the type of micro gas turbine, the main parameters used to describe the operating regimes are: thrust (for turbojets), shaft power (for turboshafts), specific fuel consumption, exhaust gas temperature, and engine speed, which is the essential parameter that defines an operating regime. For AMT engine models, gas temperature is defined by the exhaust gas temperature (EGT). The temperature sensor is mounted in the exhaust nozzle, positioned approximately 7–8 mm inside the nozzle [
16].
Several studies [
17,
18,
19] have investigated the evolution of microjet engine parameters across different engine speeds and presented various variation curve diagrams of the obtained parameters. However, none of these works employed percentage analysis to compare parameter variations as a function of engine speed.
While previous studies have reported characteristic performance curves for individual micro gas turbines, they often lack a rigorous comparative framework capable of quantifying the parameter variations across models and operating regimes. This study addresses this gap by assembling a curated and normalized dataset covering thrust, fuel flow, exhaust gas temperature (EGT), and thrust-specific fuel consumption (TSFC) for five AMT Netherlands engines. The originality of the approach lies not in generating entirely new data, but in providing a systematic, reproducible, and percentage-based comparative methodology that enables consistent evaluation across different engines.
By expressing key parameters in percentage form relative to reference values, the analysis aligns with common practice in both civil and military aviation, where rotational speed and exhaust gas temperature are routinely reported in normalized terms. This choice facilitates intuitive physical interpretation, reduces dependence on absolute scaling, and allows for meaningful cross-engine comparisons. The polynomial functions derived in this work formalize these percentage-based relationships, providing correlations that are easy to reproduce and extend.
The contribution of this study should therefore be understood as the development of a comparative framework and normalized dataset that readers can use to (i) reproduce the fitting procedure, (ii) benchmark additional micro gas turbine data as it becomes available, and (iii) apply the correlations as baseline inputs for UAV performance analysis, endurance estimation, and preliminary propulsion system design. In this way, the article offers both an immediate reference dataset and a methodological tool for future investigations.
The results presented here aim to enhance the understanding of microjet performance characteristics, offering a valuable reference for designers, researchers, and operators of UAV propulsion systems. Moreover, the findings provide practical insights that can support gas-dynamic modeling, predictive simulations, and experimental validation for future engine developments.
2. Materials and Methods
The study focused on the variation patterns from idle to maximum regimes of the main parameters of AMT Netherlands engine models, based on a series of reliable curve charts referenced to engine speed and/or throttle position, as shown in the official engine specification sheets provided by the manufacturer. The study continued with processing the charts to extract raw data, create a database, and then used the ratios of the raw values to obtain normalized calculated data in percentage form, which served as the basis for the analyses.
Based on the calculated data, polynomial functions were determined for each parameter as a function of engine speed. These polynomials were then applied across different engine speeds and models, and the results were compared with the raw chart data to verify the accuracy of the functions. As above-mentioned, the AMT engine models have different thrust classes, so they will obviously have a different air mass flow (Maf), overall pressure ratio (OPR), fuel flow (Ff), specific fuel consumption (TSFC) and engine speed (N). For a comprehensive comparison of the parameter and performance ranges,
Table 1 summarizes the engine data at maximum operating conditions for each AMT model [
20].
Table 1 highlights the main performance parameters of the five AMT engine models at the maximum operating conditions, providing a comparative perspective across different thrust classes. The data showed that thrust increased from 167 N (Pegasus) to 1569 N (Lynx), while the corresponding maximum rotational speed decreased from 117 krpm to 46 krpm, reflecting the inverse relationship between engine size and shaft speed. Idle regimes revealed consistent patterns, with thrust representing only about 3–5% of the maximum value, regardless of engine type, confirming that idle operation is primarily designed for stability rather than performance. Exhaust gas temperature (EGT) rose with engine class, from 750 °C for smaller models (Pegasus, Olympus) to 875 °C for larger ones (Titan, Nike, Lynx), indicating increased thermal loads that enhance efficiency but impose stricter material constraints. The overall pressure ratio (OPR) also increased gradually from 3.0 to 4.0, contributing to improved thermal efficiency. Similarly, the air mass flow and fuel flow scale increased proportionally with thrust, ranging from 398 g/s and 500 g/min in Pegasus to 2500 g/s and 3600 g/min in Lynx. Notably, the thrust specific fuel consumption (TSFC) decreased as engine size grew, from 1.762 kg/(kgf·h) in Pegasus to 1.351 kg/(kgf·h) in Lynx, underlining that larger engines are inherently more efficient, despite higher absolute fuel demands. Overall, these trends illustrate the typical scaling effects in gas turbines, where increased engine size leads to improved efficiency but requires advanced solutions for thermal management and material durability.
The specification sheets for the Pegasus HP, Olympus HP, and Titan models [
21,
22,
23] include a series of charts showing the variation curves of thrust (F), fuel flow (Ff), exhaust gas temperature (EGT), and specific fuel consumption (TSFC) as functions of engine speed (N). The charts are corrected to standard temperature and pressure (STP) conditions (T0 = 15 °C, p0 = 1.01325 bar a). Therefore, the correlations and percentage patterns identified in this study apply strictly to standard conditions, and their direct extrapolation to non-standard flight environments (e.g., high altitude, extreme temperatures, high humidity) should be approached with caution. For the Nike and Lynx models [
24,
25], similar charts are presented as for the previous models, showing variation curves of comparable parameters, but plotted against engine throttle position. The charts for the Nike and Lynx models are more detailed, and additionally include data values displayed on the curves.
The data were digitized by scanning the charts and importing them into CAD software v.5, which allowed for the precise extraction of numerical values and significantly reduced the subjectivity of manual reading. The residual differences between independent extractions were negligible, and did not affect the fitting or analysis results.
Considering that some parameters in the specification sheets are presented in different units across engine models, the raw data values were organized into tables using consistent units to provide a common reference. Therefore, the raw values for the Pegasus HP and Olympus HP models are presented in
Table 2, for the Titan model in
Table 3, and for the Nike and Lynx models in
Table 4. It should be noted that the engines’ operating regimes do not correspond to the exact same speeds.
Table 2 presents the raw performance data of the Pegasus HP and Olympus HP engines across operating regimes, showing how thrust, fuel flow, exhaust gas temperature, and TSFC varied with rotational speed. Both engines exhibited a steady increase in thrust and fuel flow as the speed rose, with Pegasus reaching 16.0 kgf and Olympus 23.78 kgf at maximum conditions. Exhaust gas temperature also increased with speed, from approximately 390–495 °C at low regimes to over 700 °C at maximum power. Meanwhile, TSFC decreased significantly with rising speed, illustrating the higher efficiency achieved at near-maximum operating conditions. Overall, the data confirm similar variation trends for both models, with Olympus providing a higher thrust output but comparable efficiency levels to Pegasus.
Table 3 summarizes the operating data of the Titan engine, illustrating its performance evolution with speed. Thrust increased sharply from 1.32 kgf at 30 krpm to 40.25 kgf at 96 krpm, accompanied by a proportional rise in fuel flow. Exhaust gas temperature remained relatively stable at low-to-medium regimes (around 430 °C) before increasing steeply to 688 °C at maximum power, indicating a higher thermal stress near full load. The TSFC decreased significantly from 8.306 kg/(kgf·h) at idle to about 1.698 at maximum speed, confirming the transition from inefficient fuel-to-thrust conversion at low regimes to higher efficiency at peak operation.
Table 4 presents the raw values for the Nike and Lynx engines, which represent the higher-thrust AMT models. For Nike, the thrust rose from 4.18 kgf at 21 krpm to 81.24 kgf at 61.5 krpm, while Lynx exhibited a significantly larger range, from 7.75 kgf at 15 krpm to 162.59 kgf at 46 krpm. Fuel flow followed a similar scaling, increasing proportionally with thrust, whereas the exhaust gas temperature grew steadily from around 538–630 °C at low regimes to over 720–768 °C at maximum power. Both engines showed a marked reduction in TSFC with increasing speed, dropping from values above 4.5 kg/(kgf·h) at idle to nearly 1.3 kg/(kgf·h) at maximum operation. These results underline that larger engines not only deliver considerably higher thrust, but also achieve superior fuel efficiency, albeit at the expense of higher thermal loads.
The available datasets represent the averaged performance curves published by the manufacturer, which do not include statistical variations or multiple test repetitions.
It should be noted that the present analysis was carried out exclusively on AMT micro-turbine engines, as this manufacturer is among the very few providing detailed multi-parameter performance data across different operating regimes. Therefore, the correlations identified here primarily apply to this family of engines, while generalization to other architectures (e.g., twin-shaft or axial compressor designs) should be approached with caution.
3. Results and Discussion
The results represent the post-processed data derived from the raw engine parameter values. These results are presented as percentage values to provide a clearer view of the data variations. The percentage values of the engine data were calculated by reporting the values from each operating regime to the corresponding values at the maximum regime [
26,
27,
28]. In civil and military aviation practice, parameters such as rotational speed and exhaust gas temperature are commonly expressed as percentages relative to the reference values, providing an intuitive physical interpretation and enabling comparisons across different engines. The polynomial fitting applied in this study served to formalize these observable percentage-based relationships and establish a reproducible comparative framework. It should be noted that the percentage-based methodology is not introduced solely in this study, but has been previously applied and validated in experimental research published in [
15,
27,
28] using turboshaft and turbojet engines. The present work extends the application of this method to micro gas turbines, based on the most detailed performance data currently available in the public domain, while future research will include additional validation through dedicated experiments or simulations. The following formulas define the percentage values of engine speed (
dN), thrust (
dF), fuel flow (
dFf), exhaust gas temperature (
dEGT), and specific fuel consumption (
dTSFC).
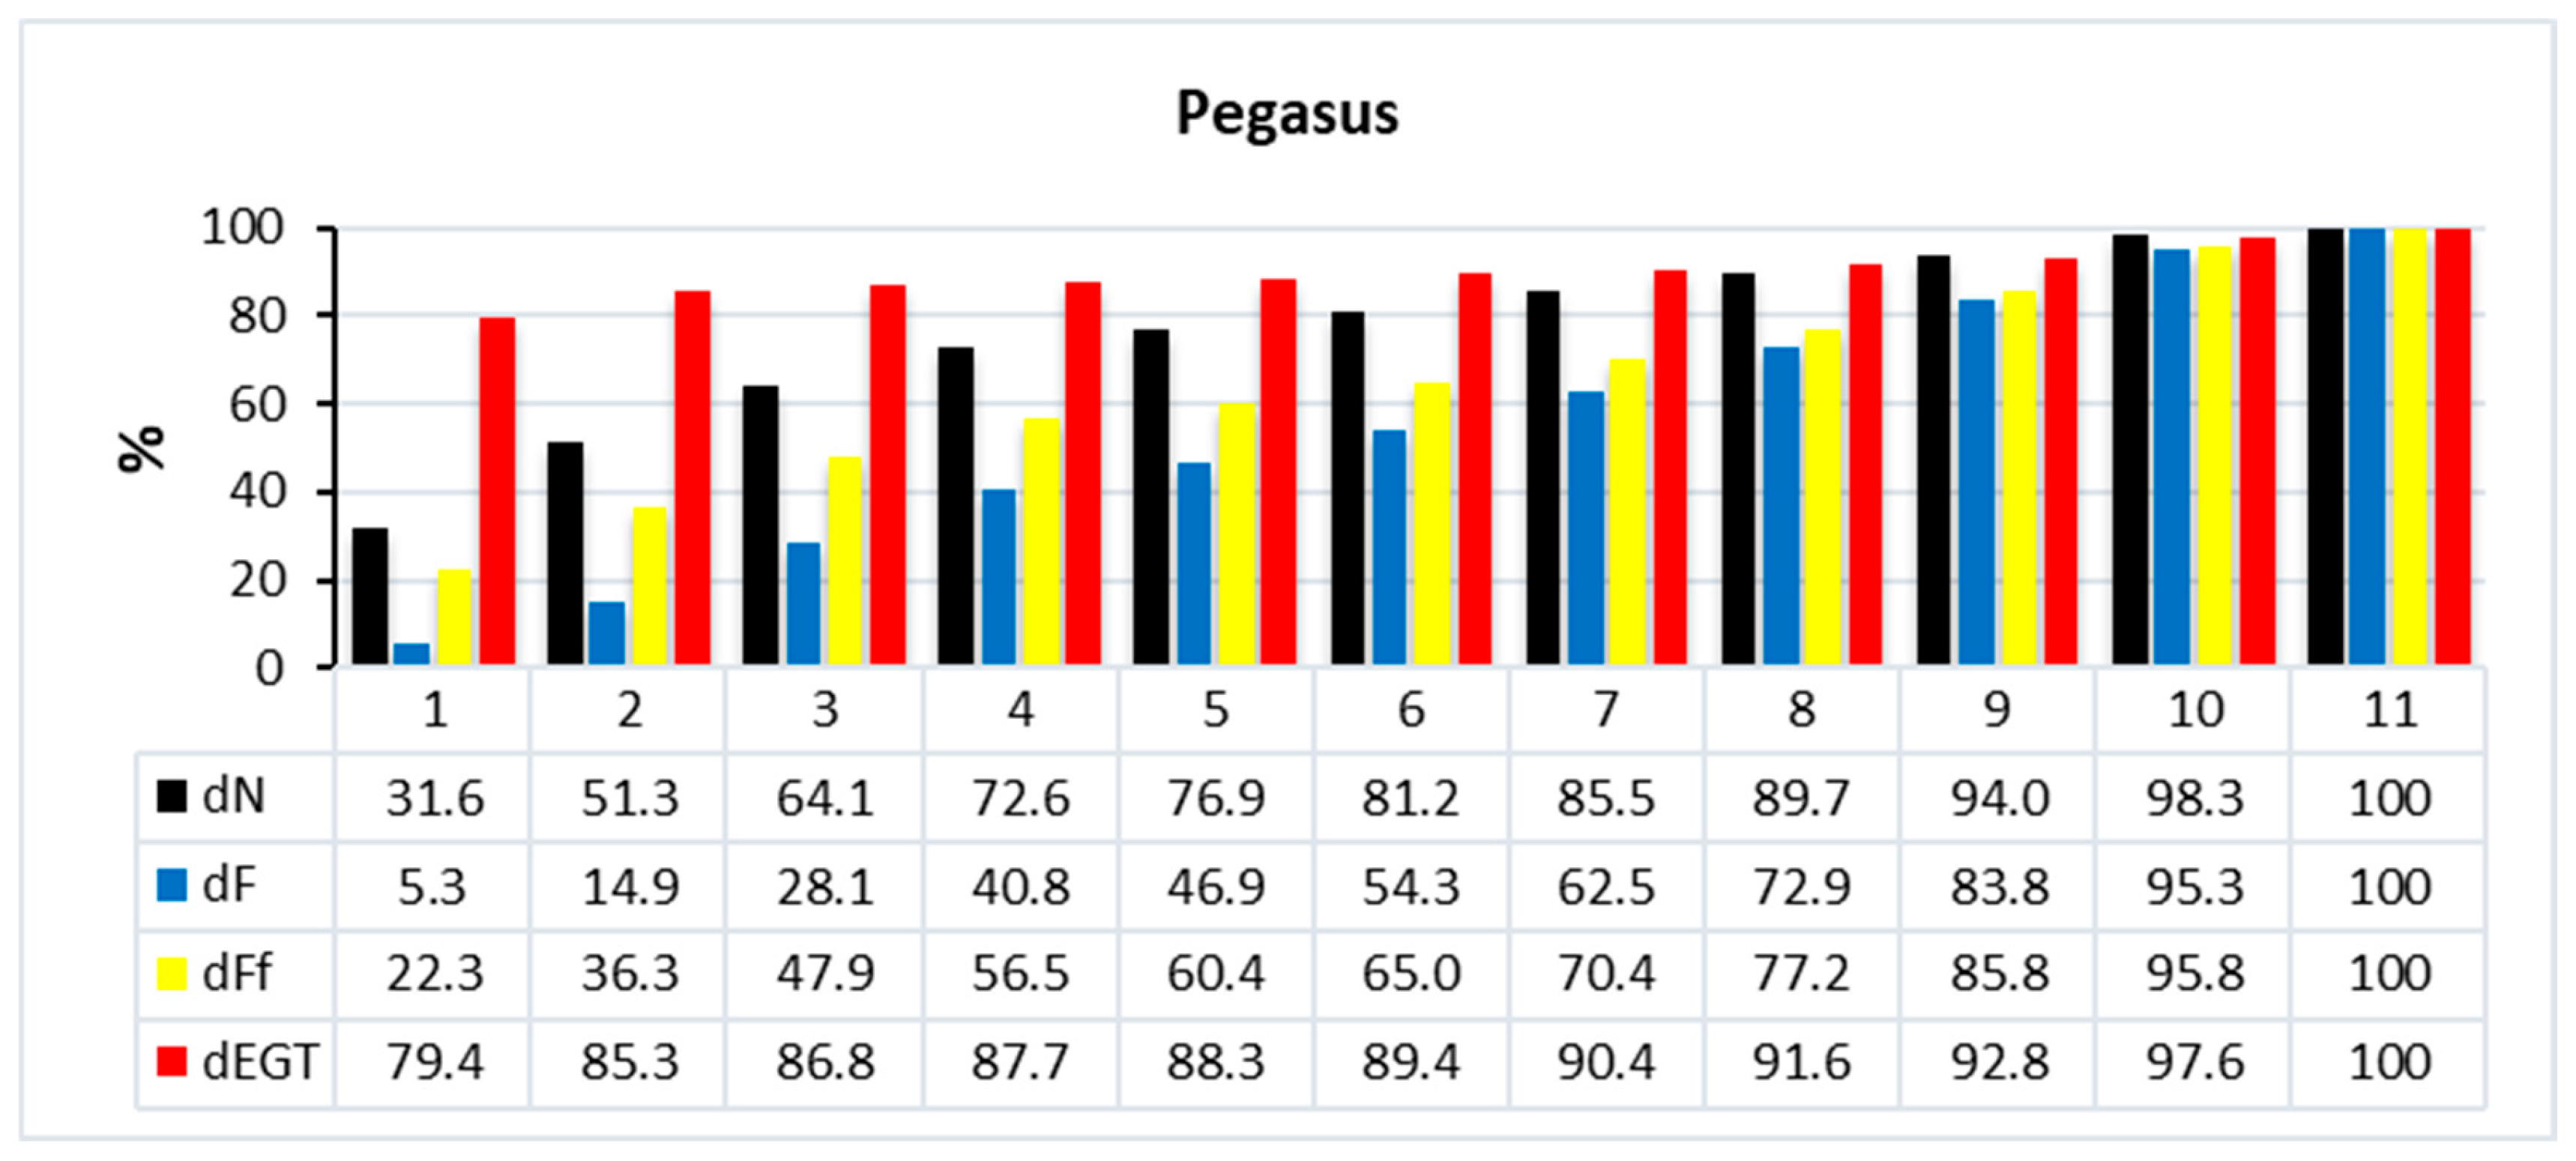
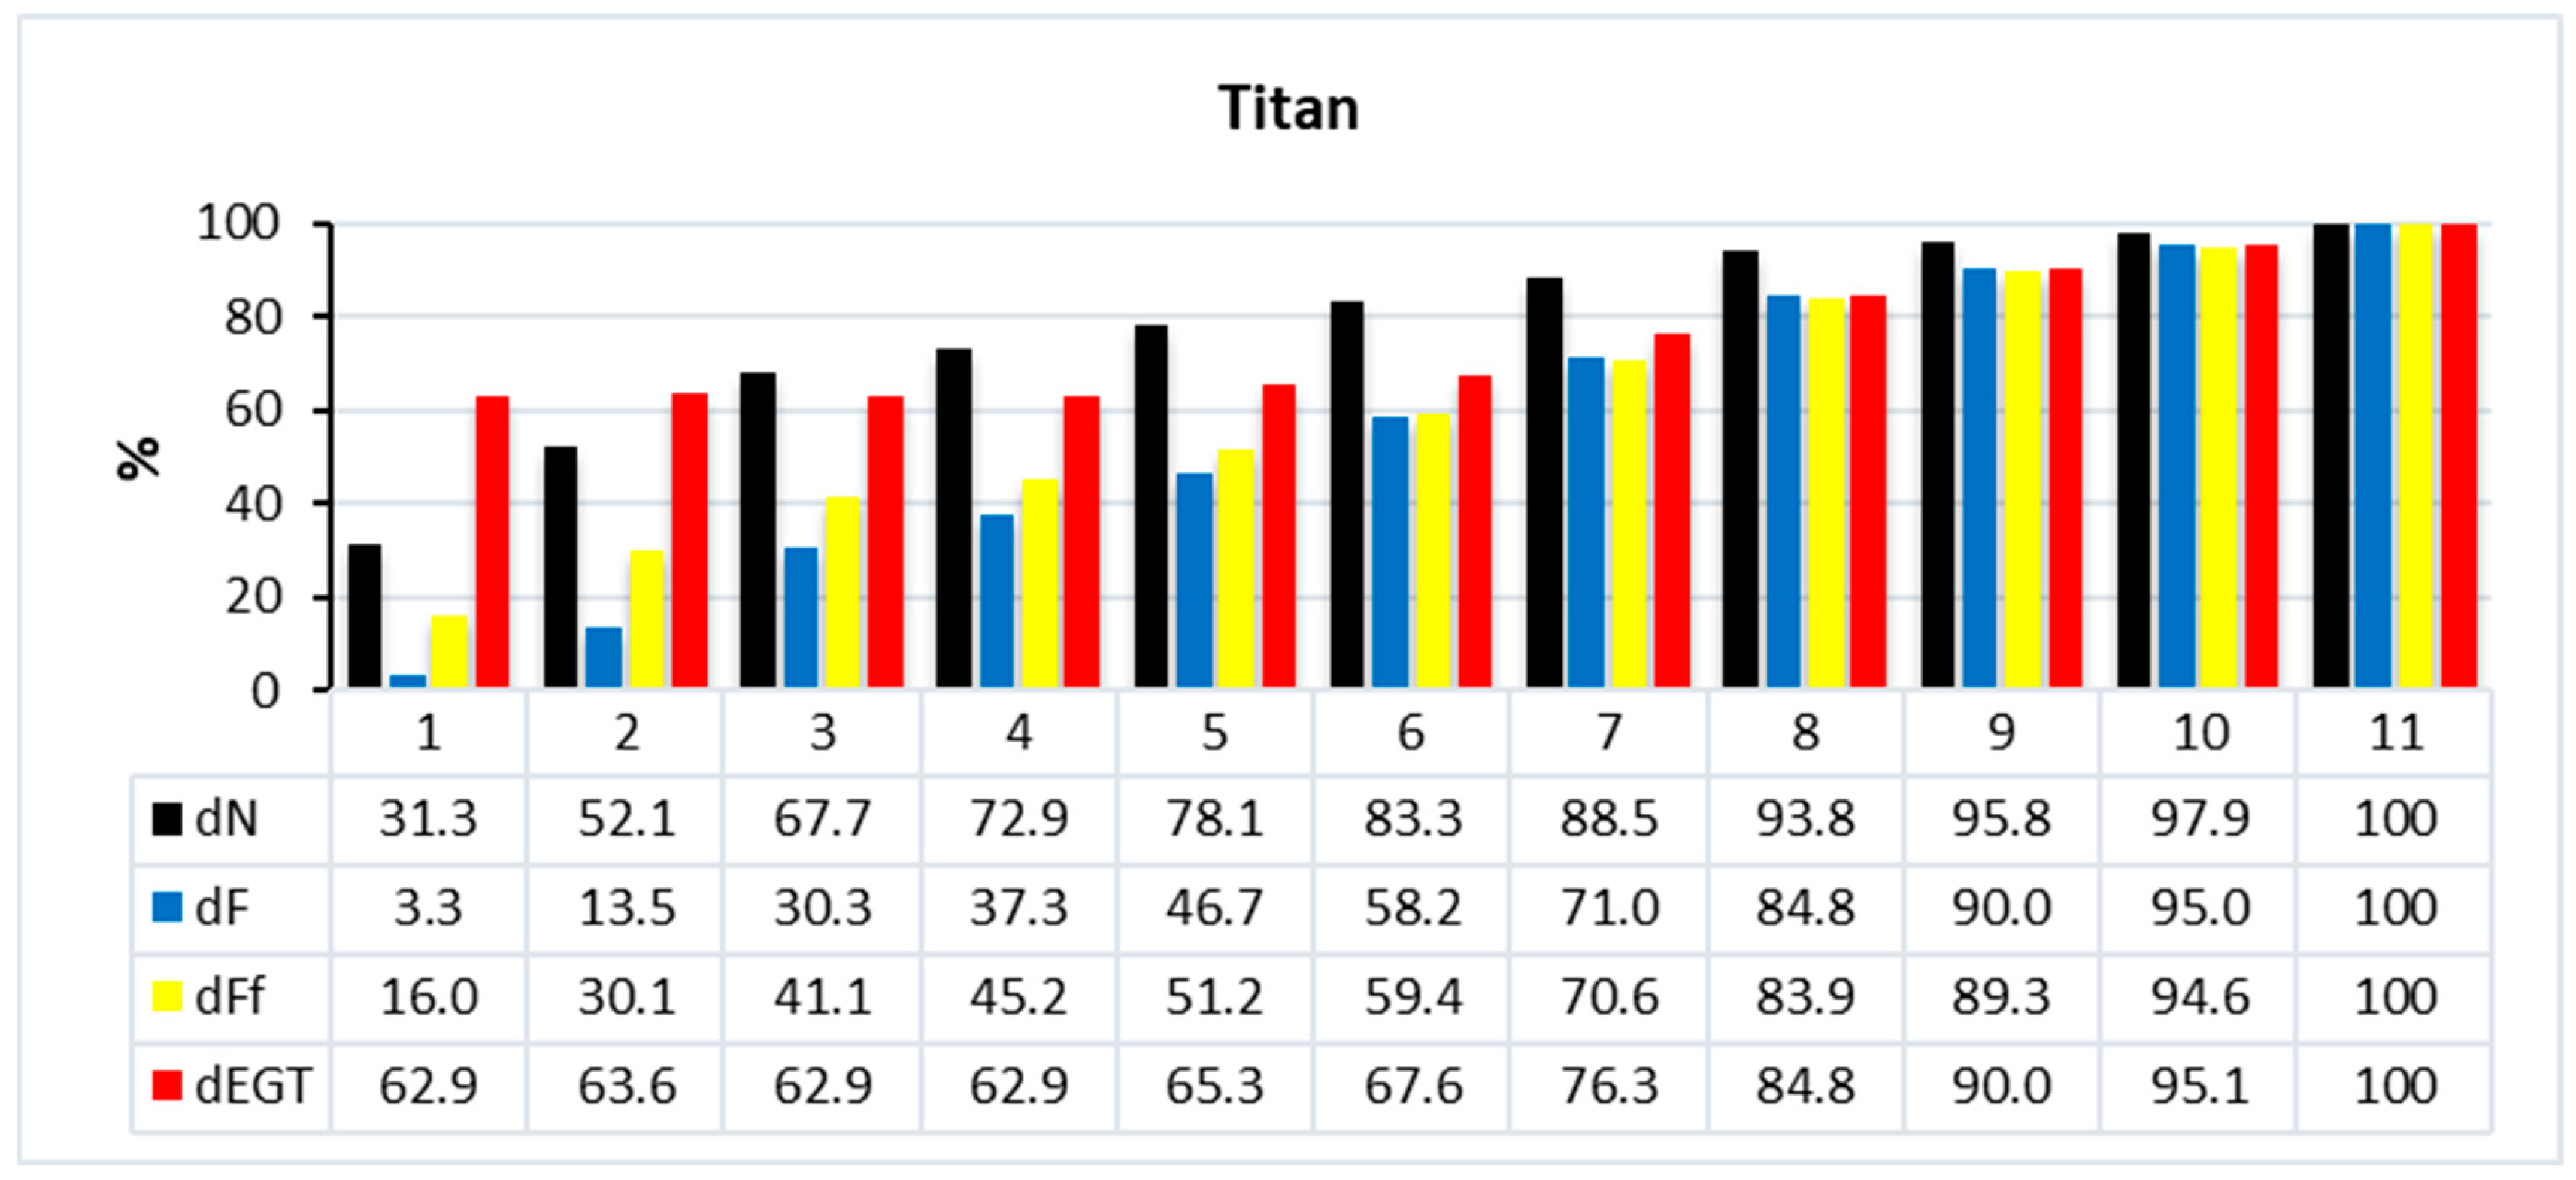
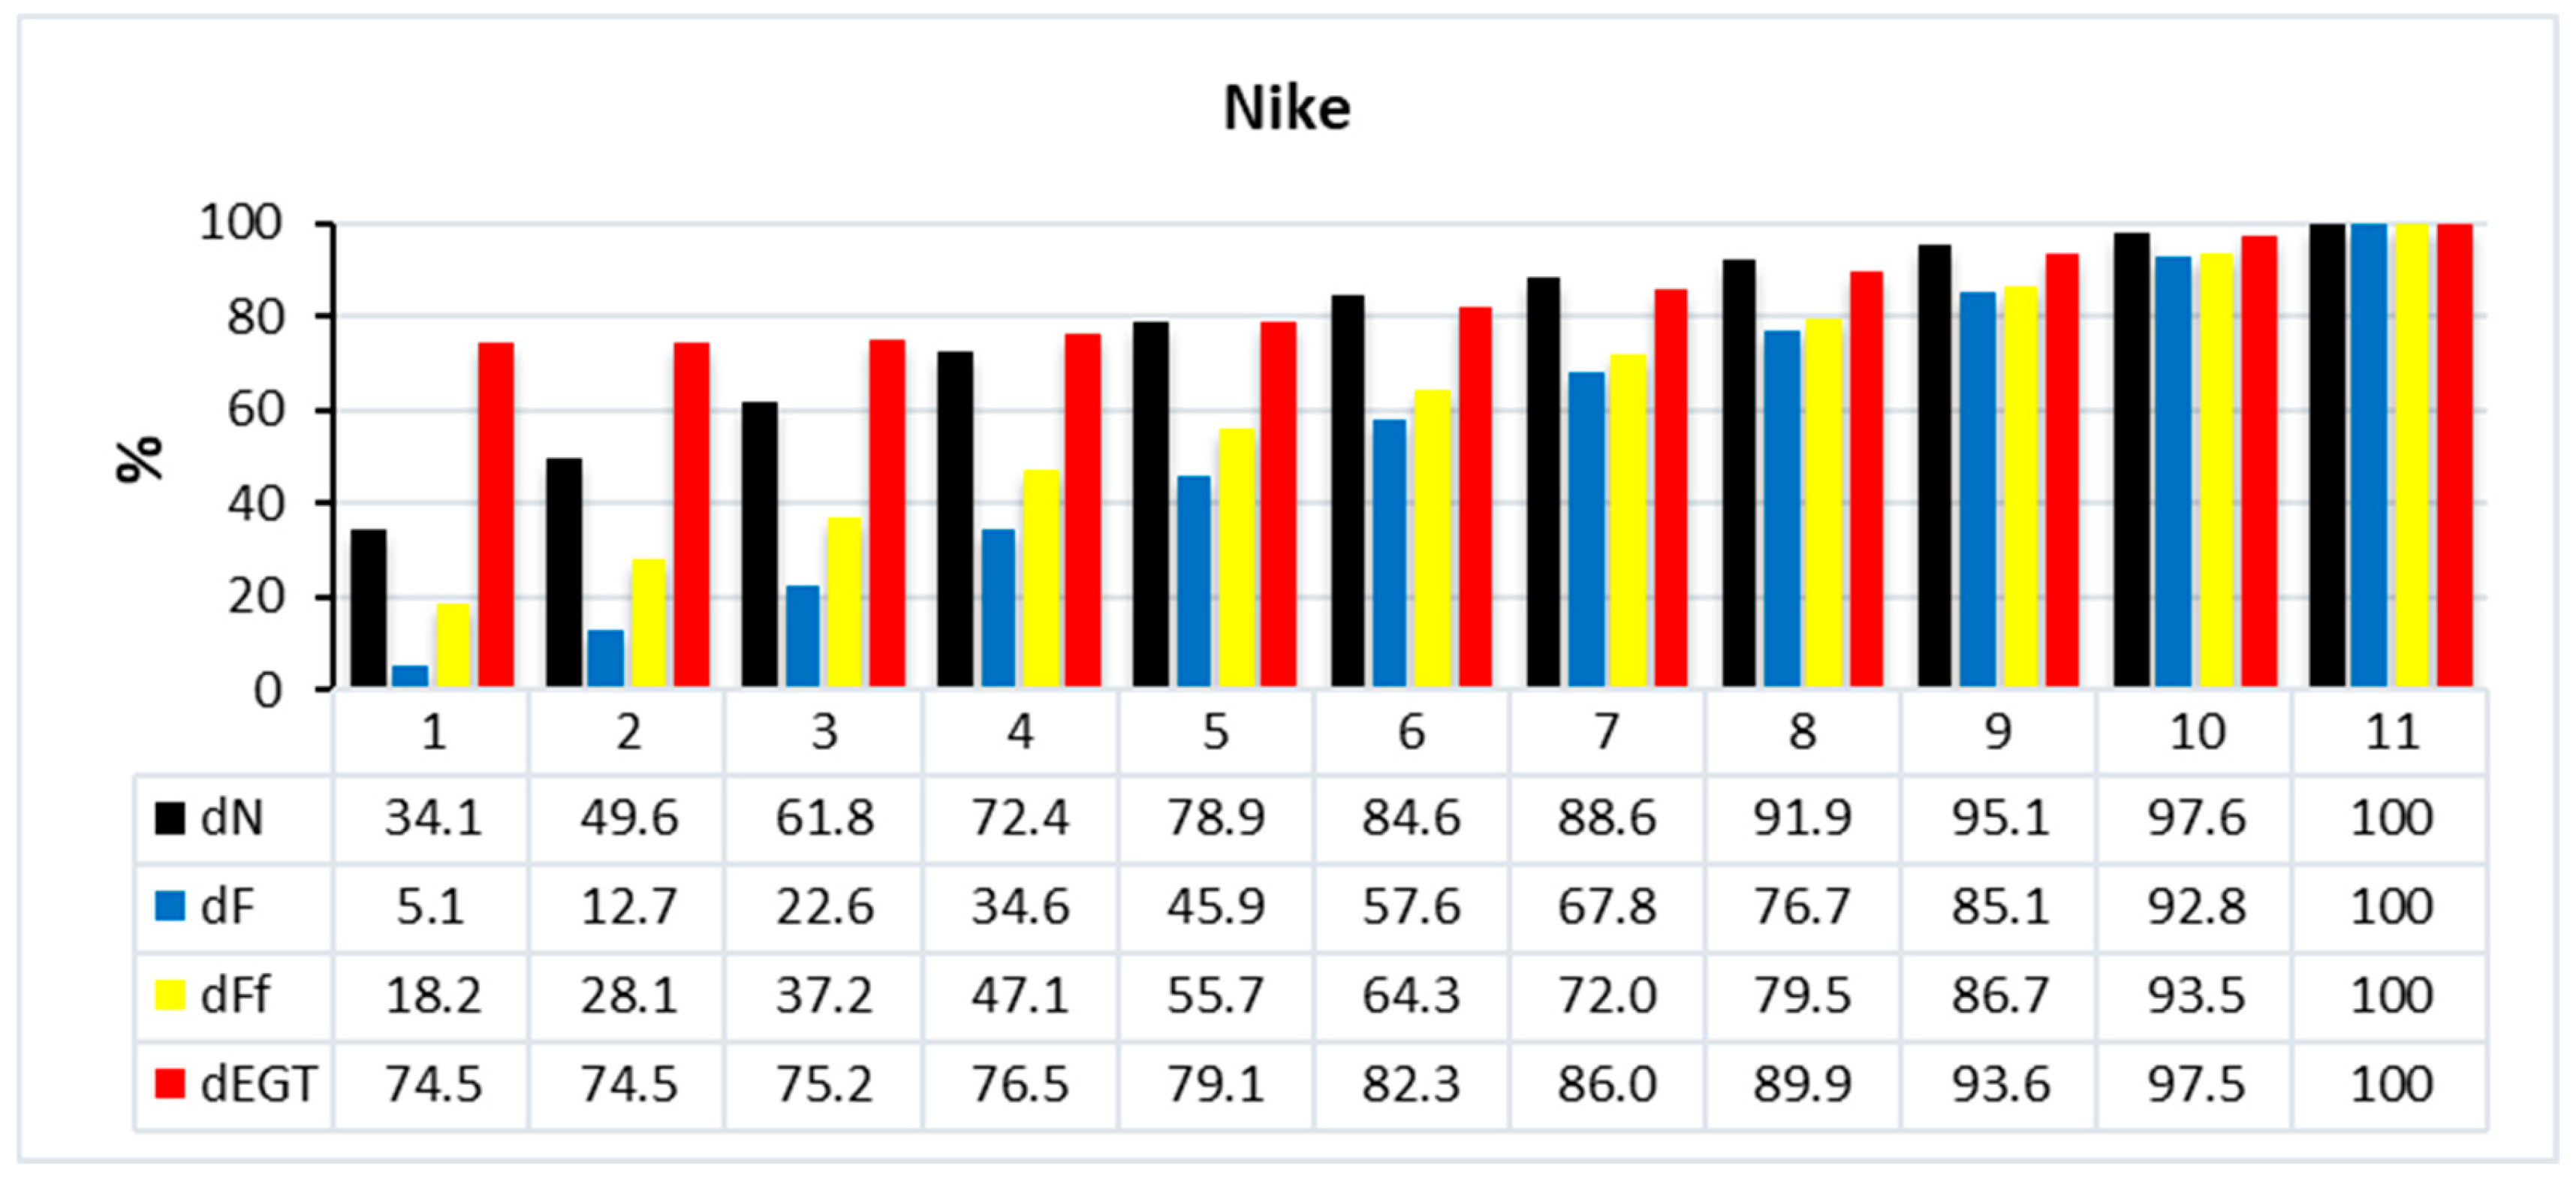
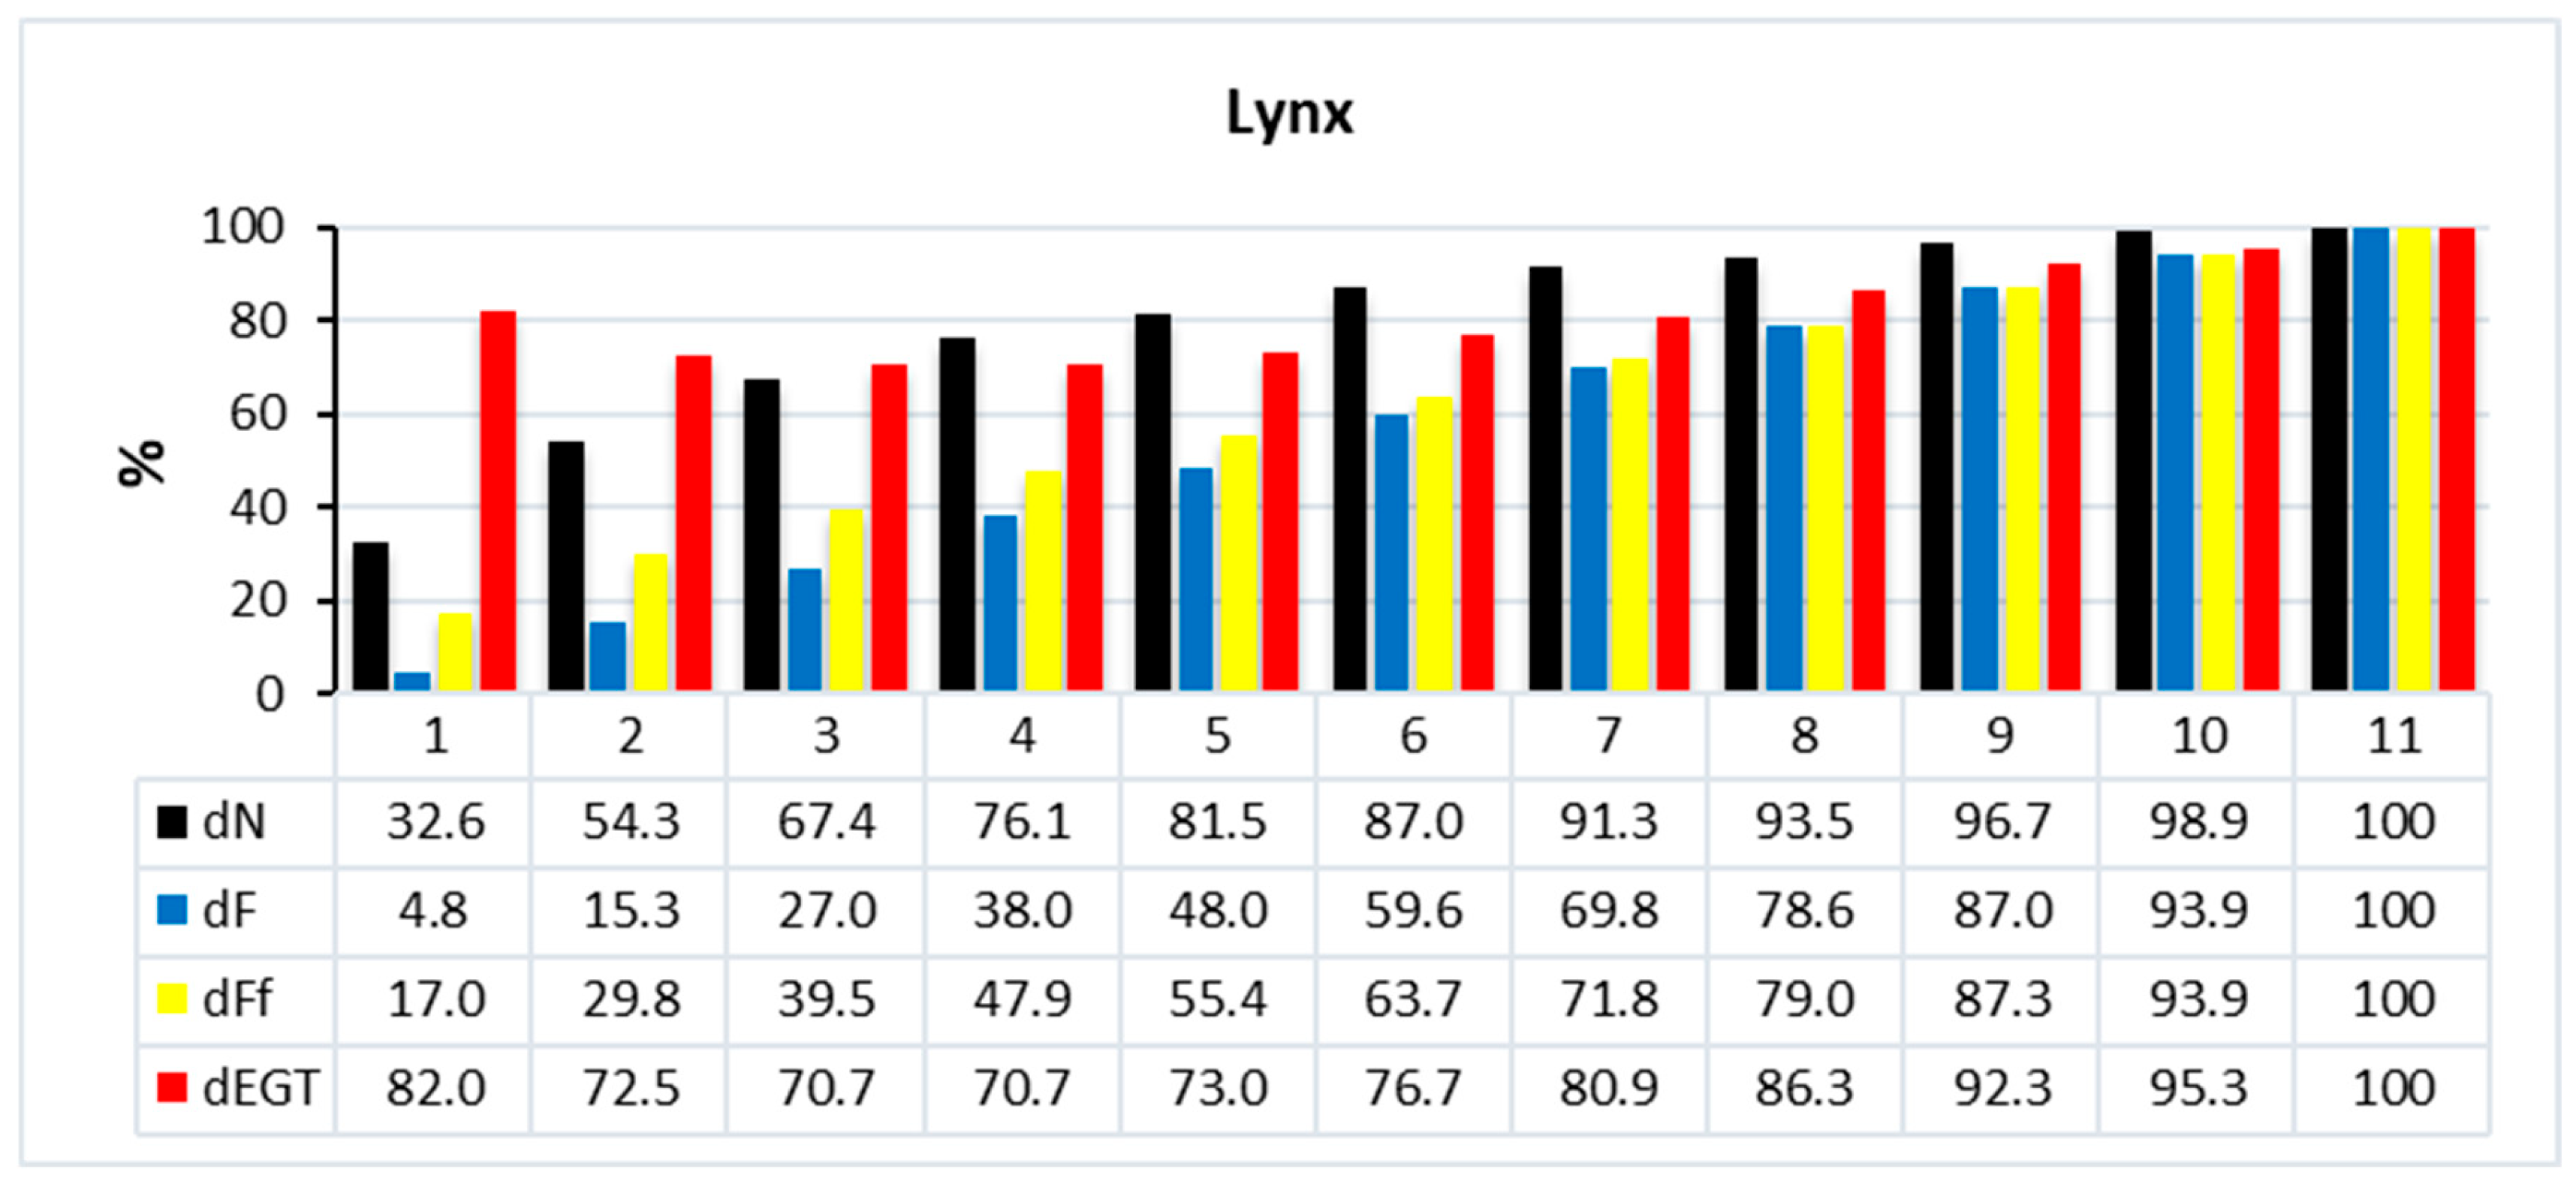
The percentage data for each engine model are displayed below the bar chart, as shown in the following figures:
Figure 1 for the Pegasus HP model,
Figure 2 for the Olympus HP model,
Figure 3 for the Titan model,
Figure 4 for the Nike model, and
Figure 5 for the Lynx model.
From the percentage values displayed in the charts,
Figure 1,
Figure 2,
Figure 3,
Figure 4 and
Figure 5, it can be observed that not all data exhibited the same variation patterns. In the case of the idle regime, all data started from different percentage values. As shown in
Figure 1, for the Pegasus model, at an idle regime speed of 31.6%, the thrust began to vary from 5.3%, the fuel flow varied from 22.3%, and the EGT varied from 79.4%. According to
Figure 2, for the Olympus model operating at an idle speed of 32.3%, thrust variation began at 3.8%, fuel flow variation started at 18.3%, and EGT variation started at 55.5%. As shown in
Figure 3, for the Titan model, at an idle regime speed of 31.3%, the thrust began to vary from 3.3%, the fuel flow varied from 16.0%, and the EGT varied from 62.9%. According to
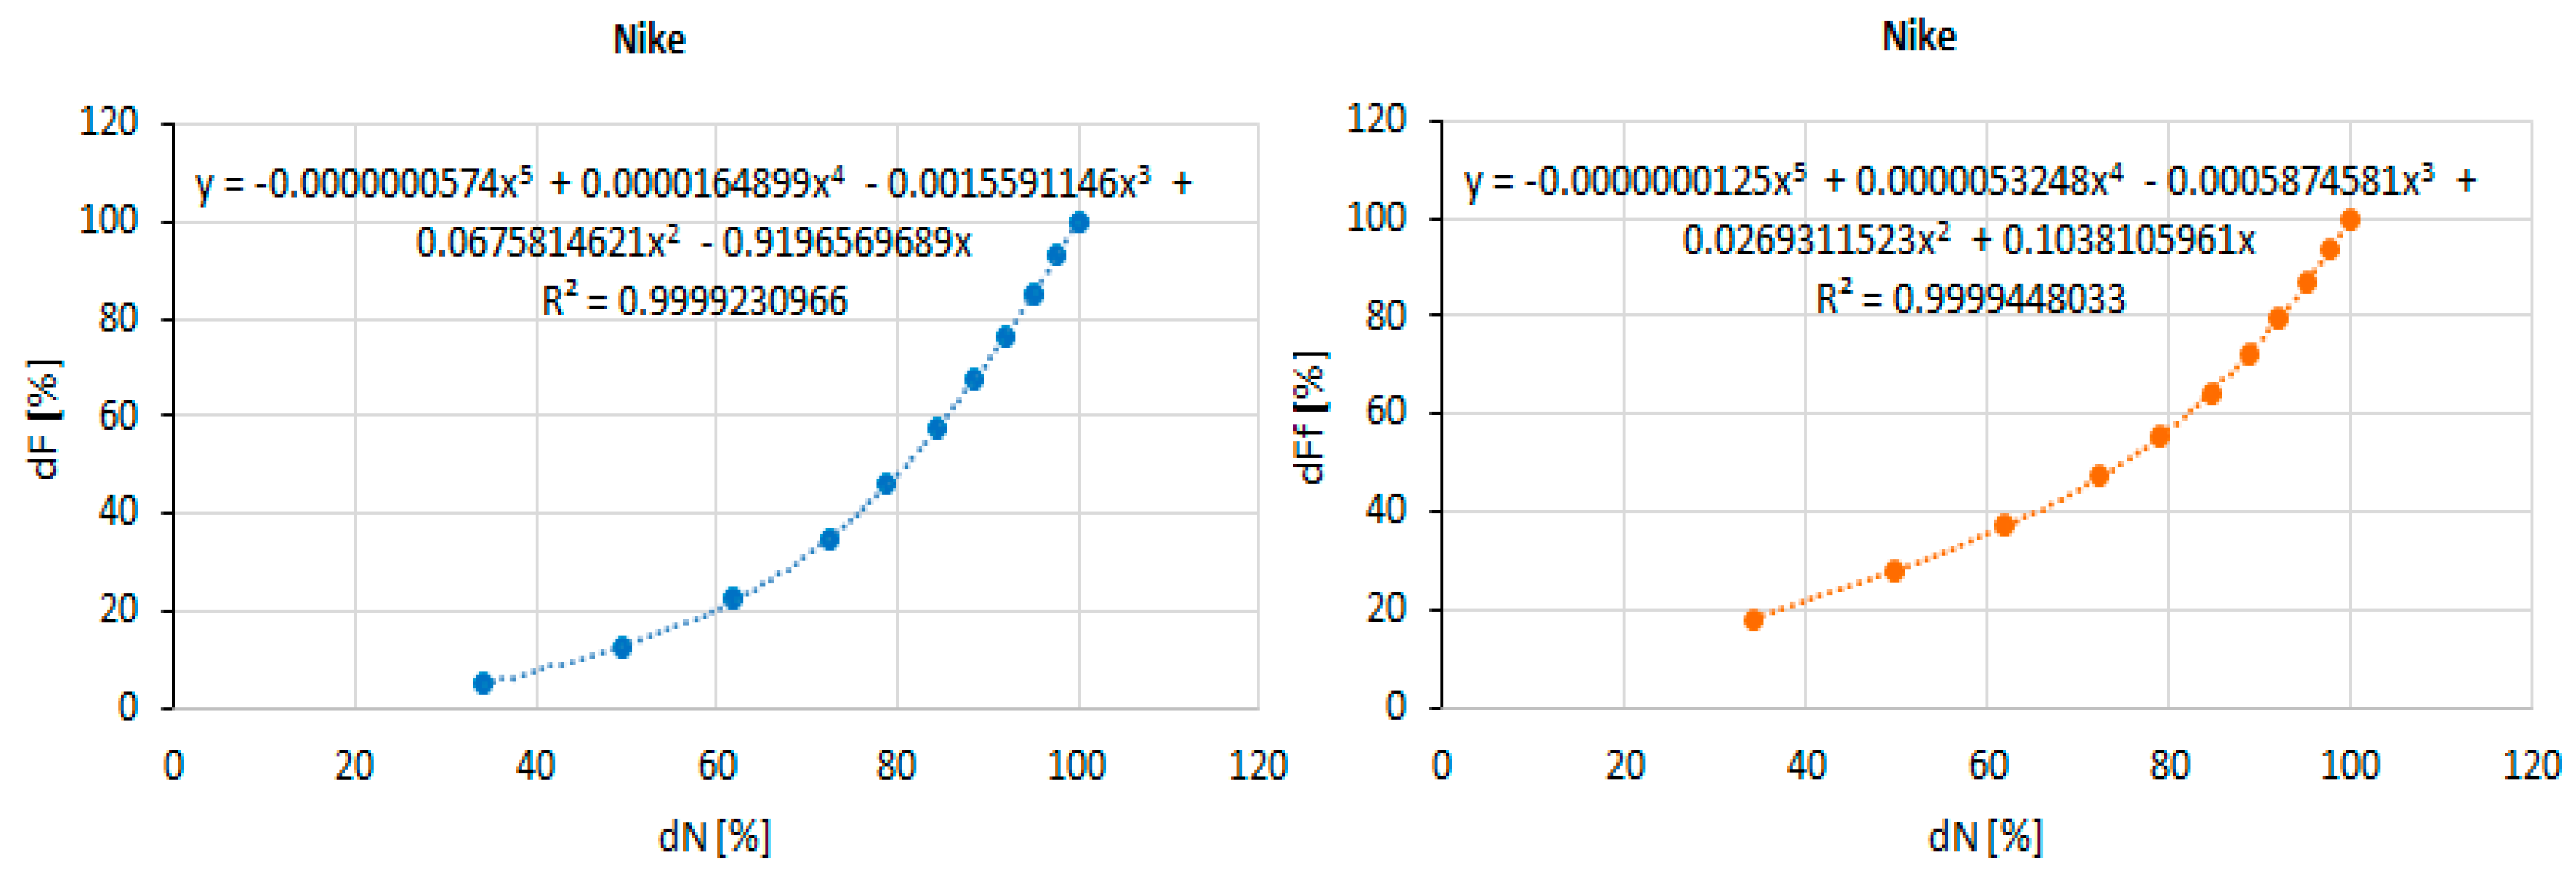
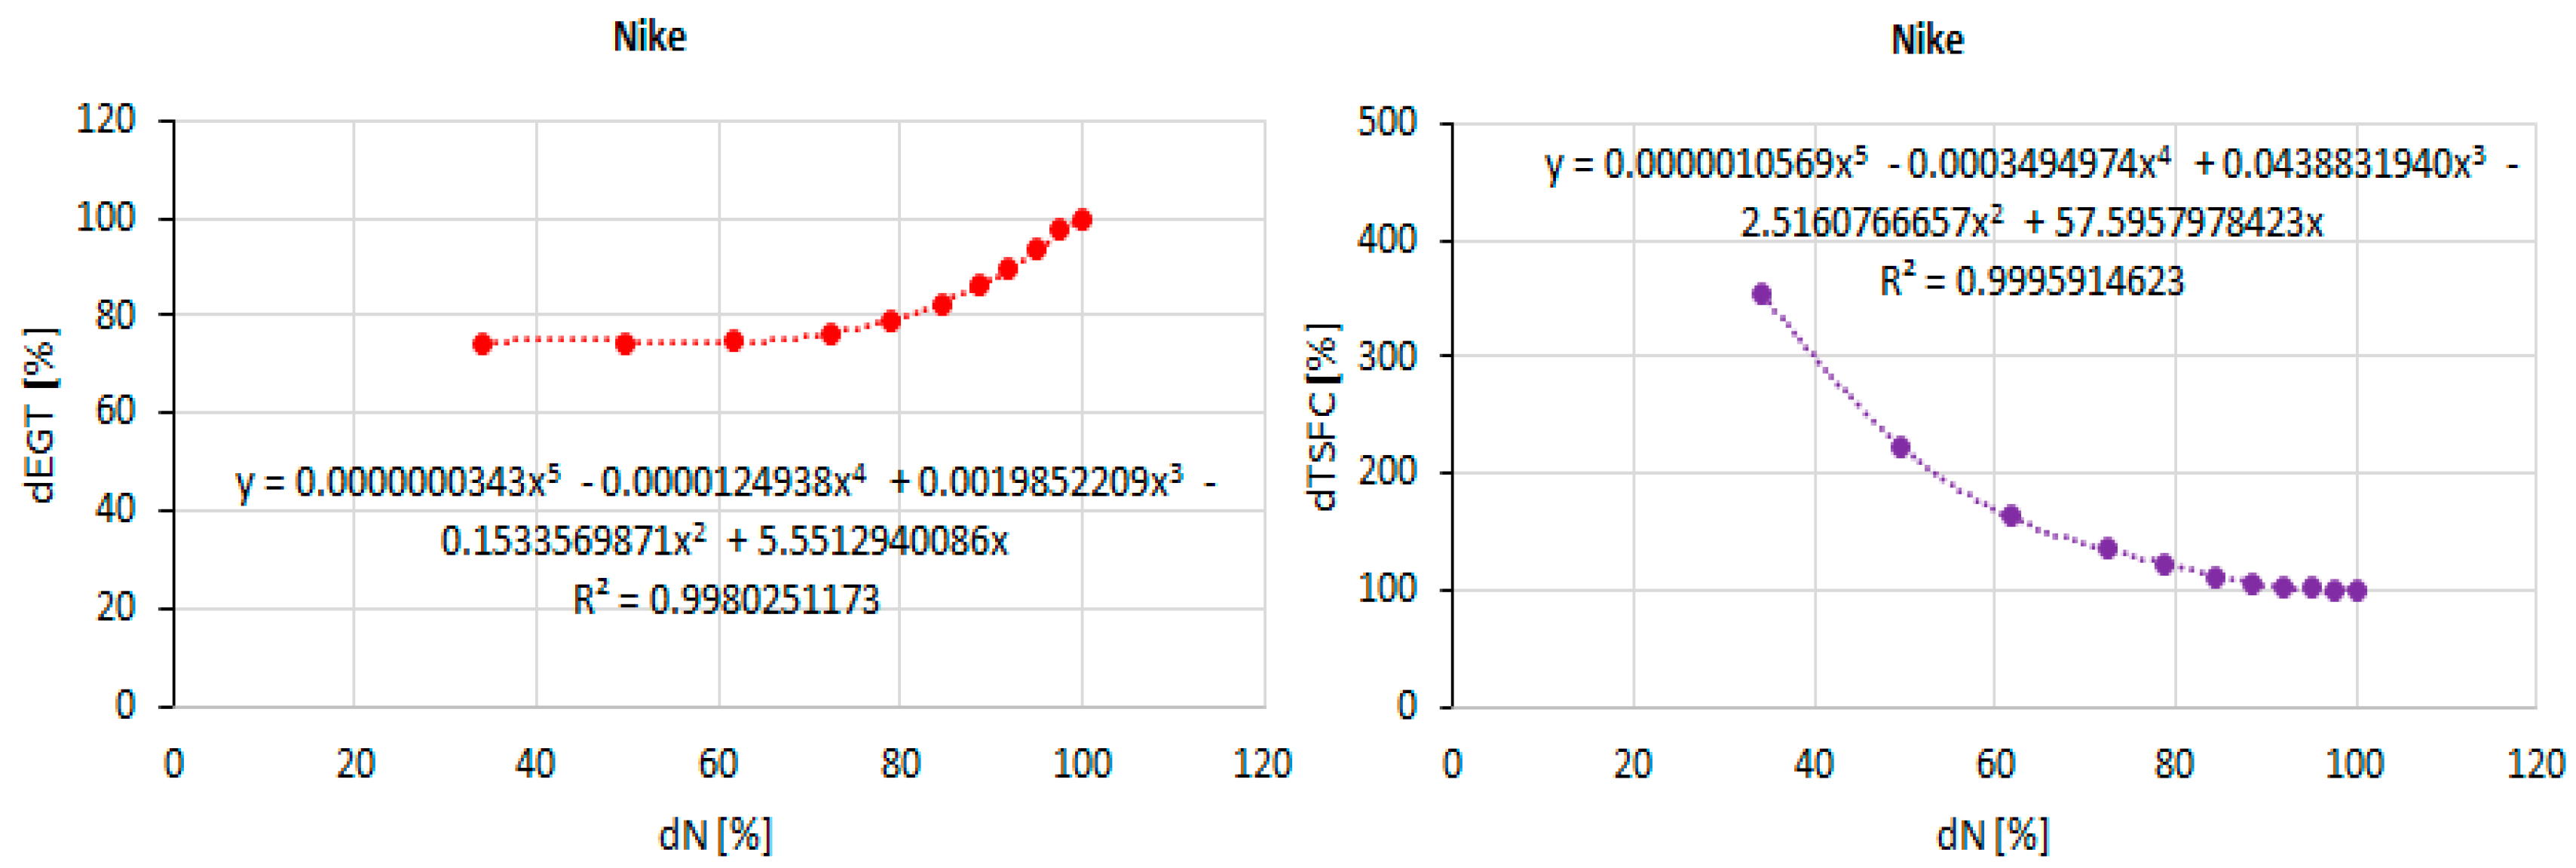
Figure 4, for the Nike model operating at an idle speed of 34.1%, thrust variation began at 5.1%, fuel flow variation started at 18.2%, and EGT variation started at 74.5%. As shown in
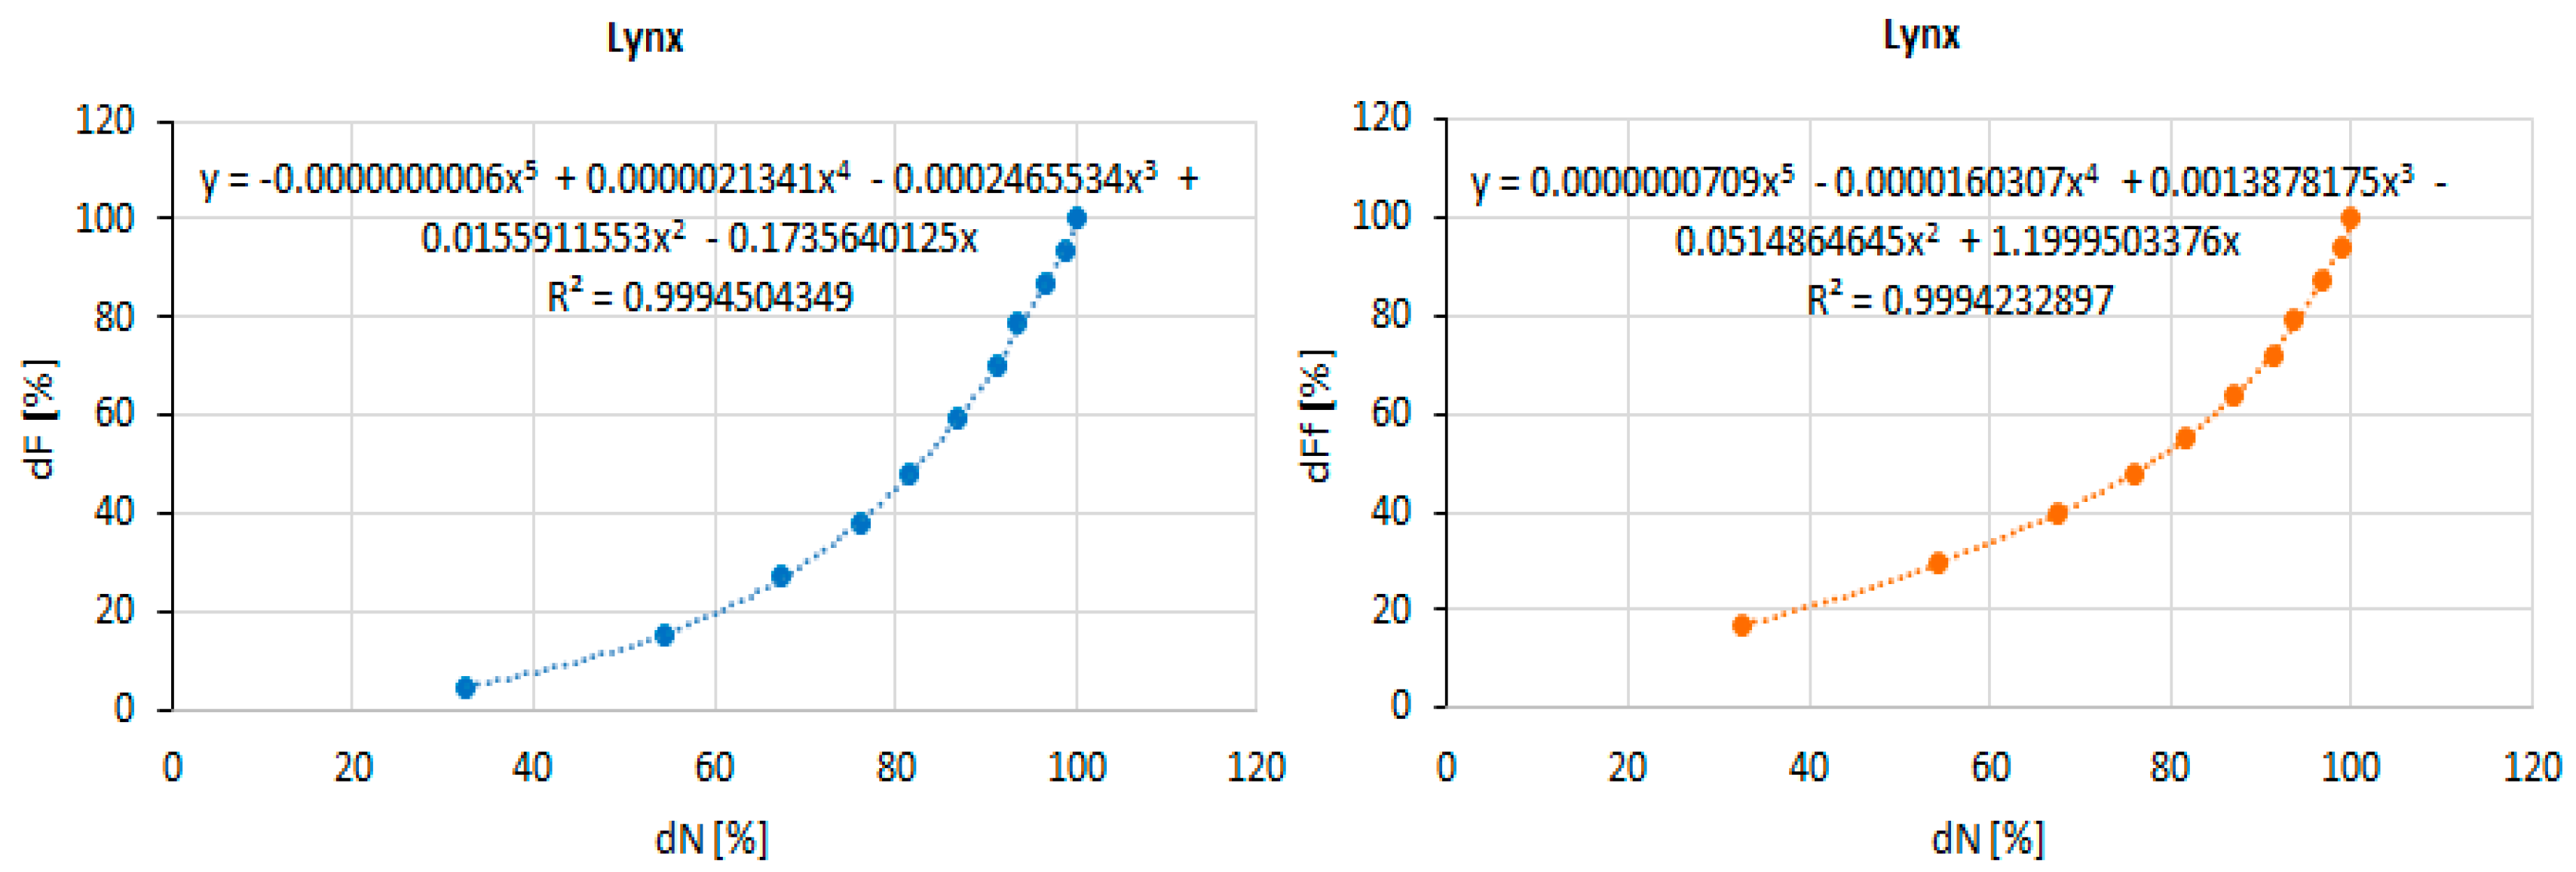
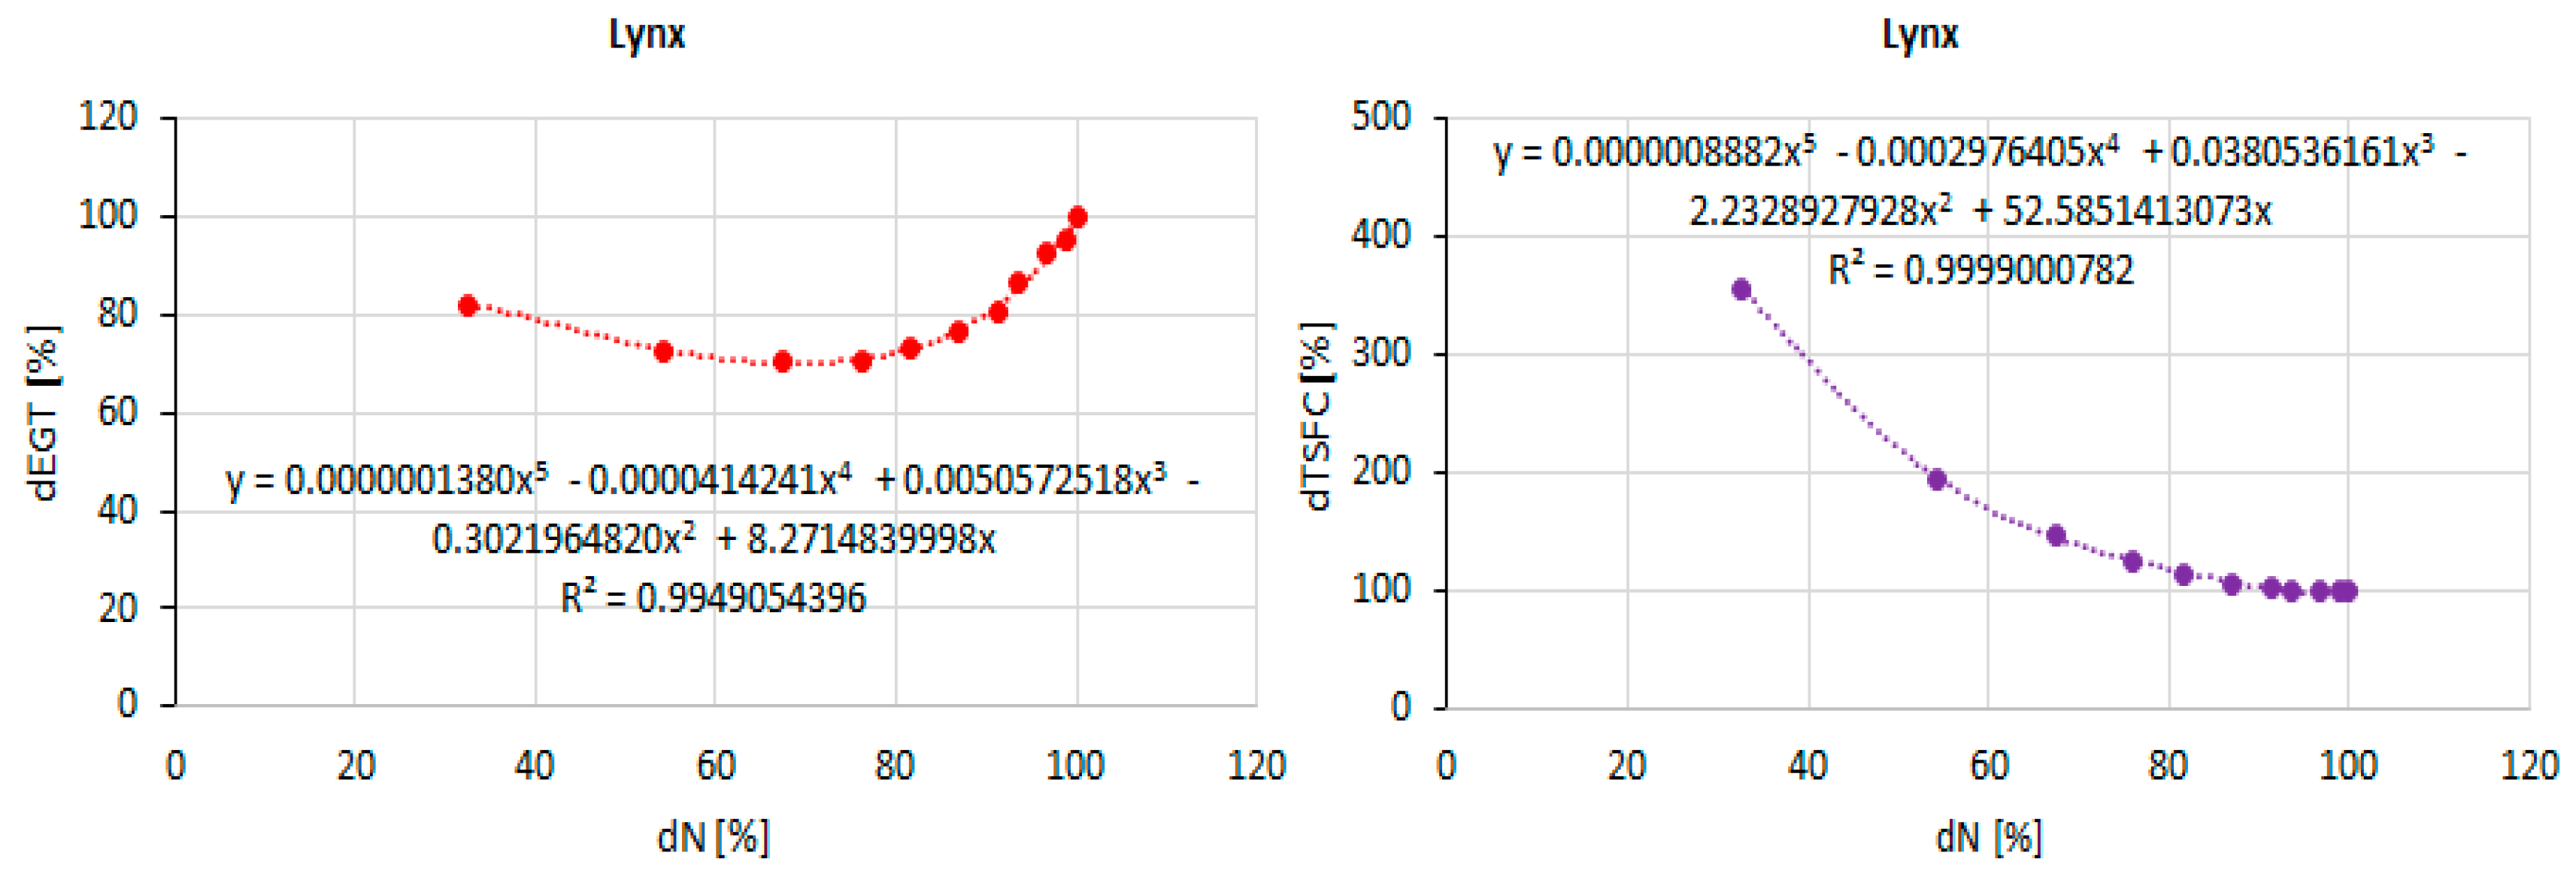
Figure 5, for the Lynx model, at an idle regime speed of 32.6%, the thrust began to vary from 4.8%, the fuel flow varied from 17.0%, and the EGT varied from 82.0%. In summary, under idle regime conditions, the thrust ranged from 3.3% (Titan) to 5.3% (Pegasus), fuel flow varied between 16.0% (Titan) and 22.3% (Pegasus), and EGT showed a variation from 55.5% (Olympus) to 82.0% (Lynx).
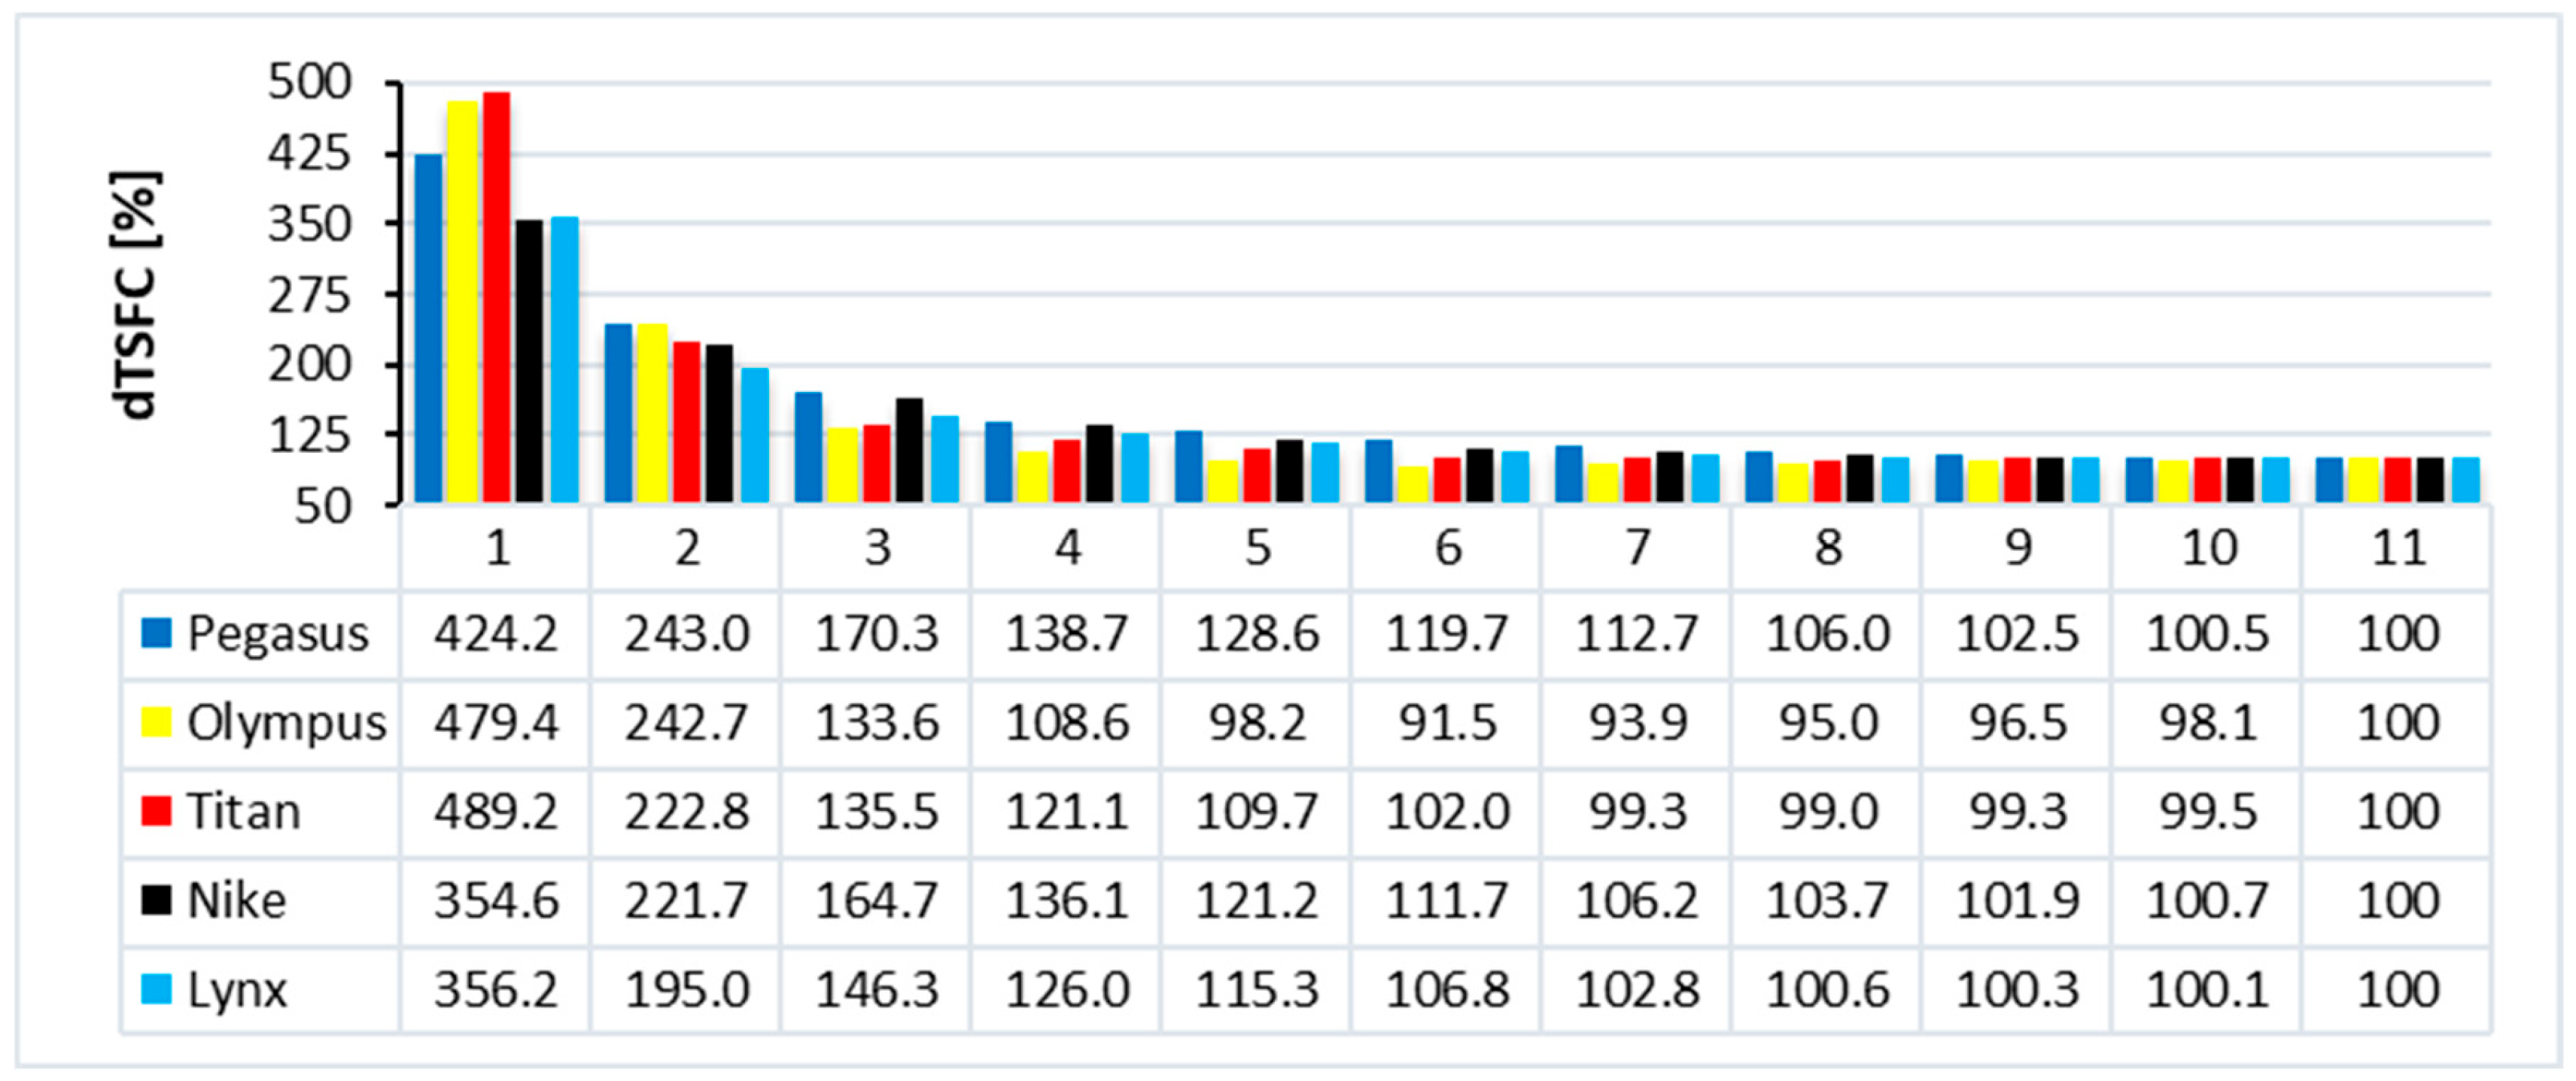
The smallest difference (2.0%) occurred in thrust (dF), indicating it as the parameter with the closest variation, while the largest difference (26.5%) was observed in exhaust gas temperature (dEGT). One reason for the percentage differences is that the idle regimes do not correspond exactly to the same engine speed (dN). Even if the regimes occur at identical engine speeds, variations still exist due to the different thrust classes of the engines. Considering that (dTSFC) decreases with increasing engine speed, its percentage values relative to the idle regime exceed 100% at all other regimes. Therefore, it is unsuitable to display (dTSFC) on the same chart with thrust (dF), fuel flow (dFf), and exhaust gas temperature (dEGT), which increase with engine speed and have percentage values below 100%. For this reason,
Figure 6 presents only the (dTSFC) percentage values for all engine models.
As shown in
Figure 6, at idle regime, (dTSFC) ranged from 489.2% (Titan) to 354.6% (Lynx), resulting in a percentage difference of 134.6%, which was higher than that observed for EGT. This value is justifiable given that TSFC is defined as the ratio of fuel flow to thrust, which are quantities with different values. At higher operating regimes, the values begin to converge.
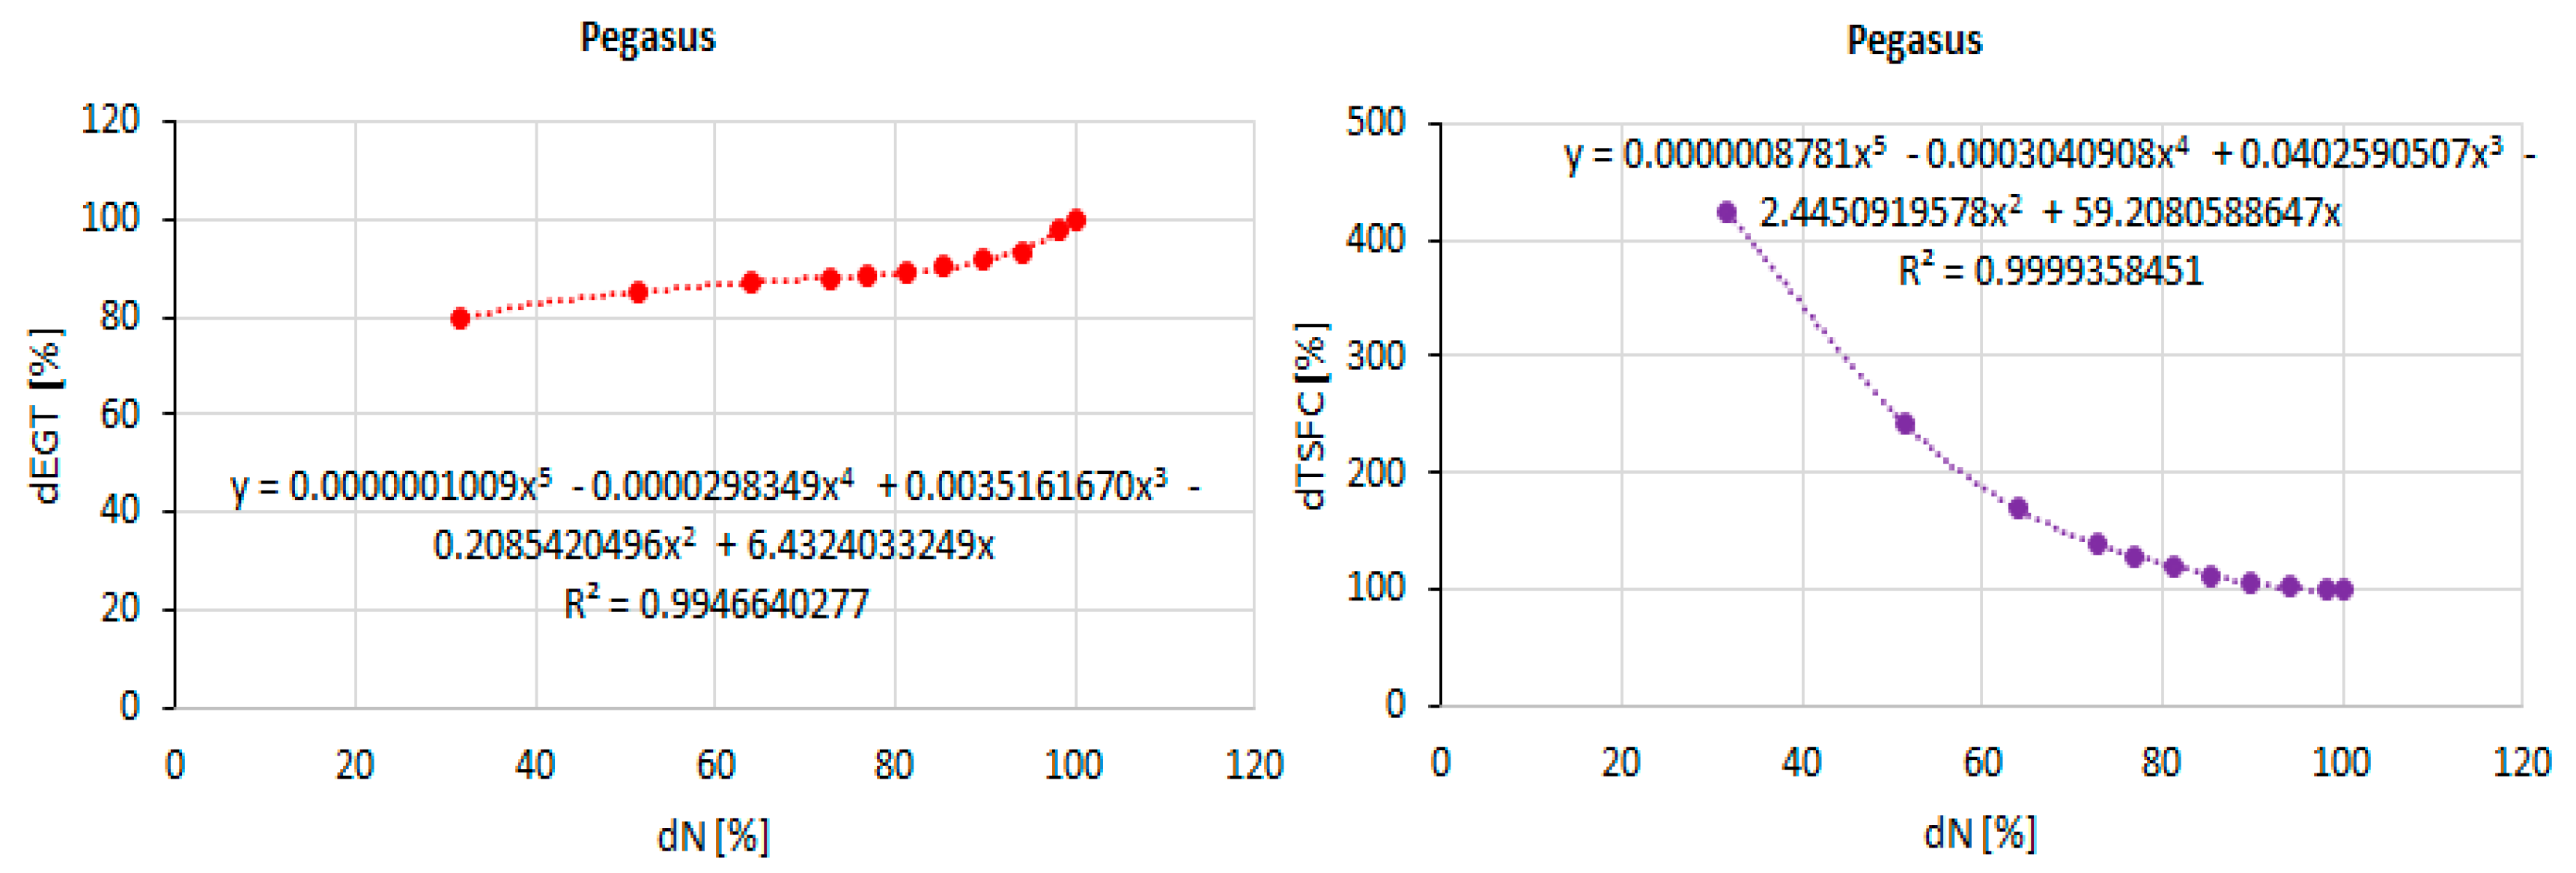
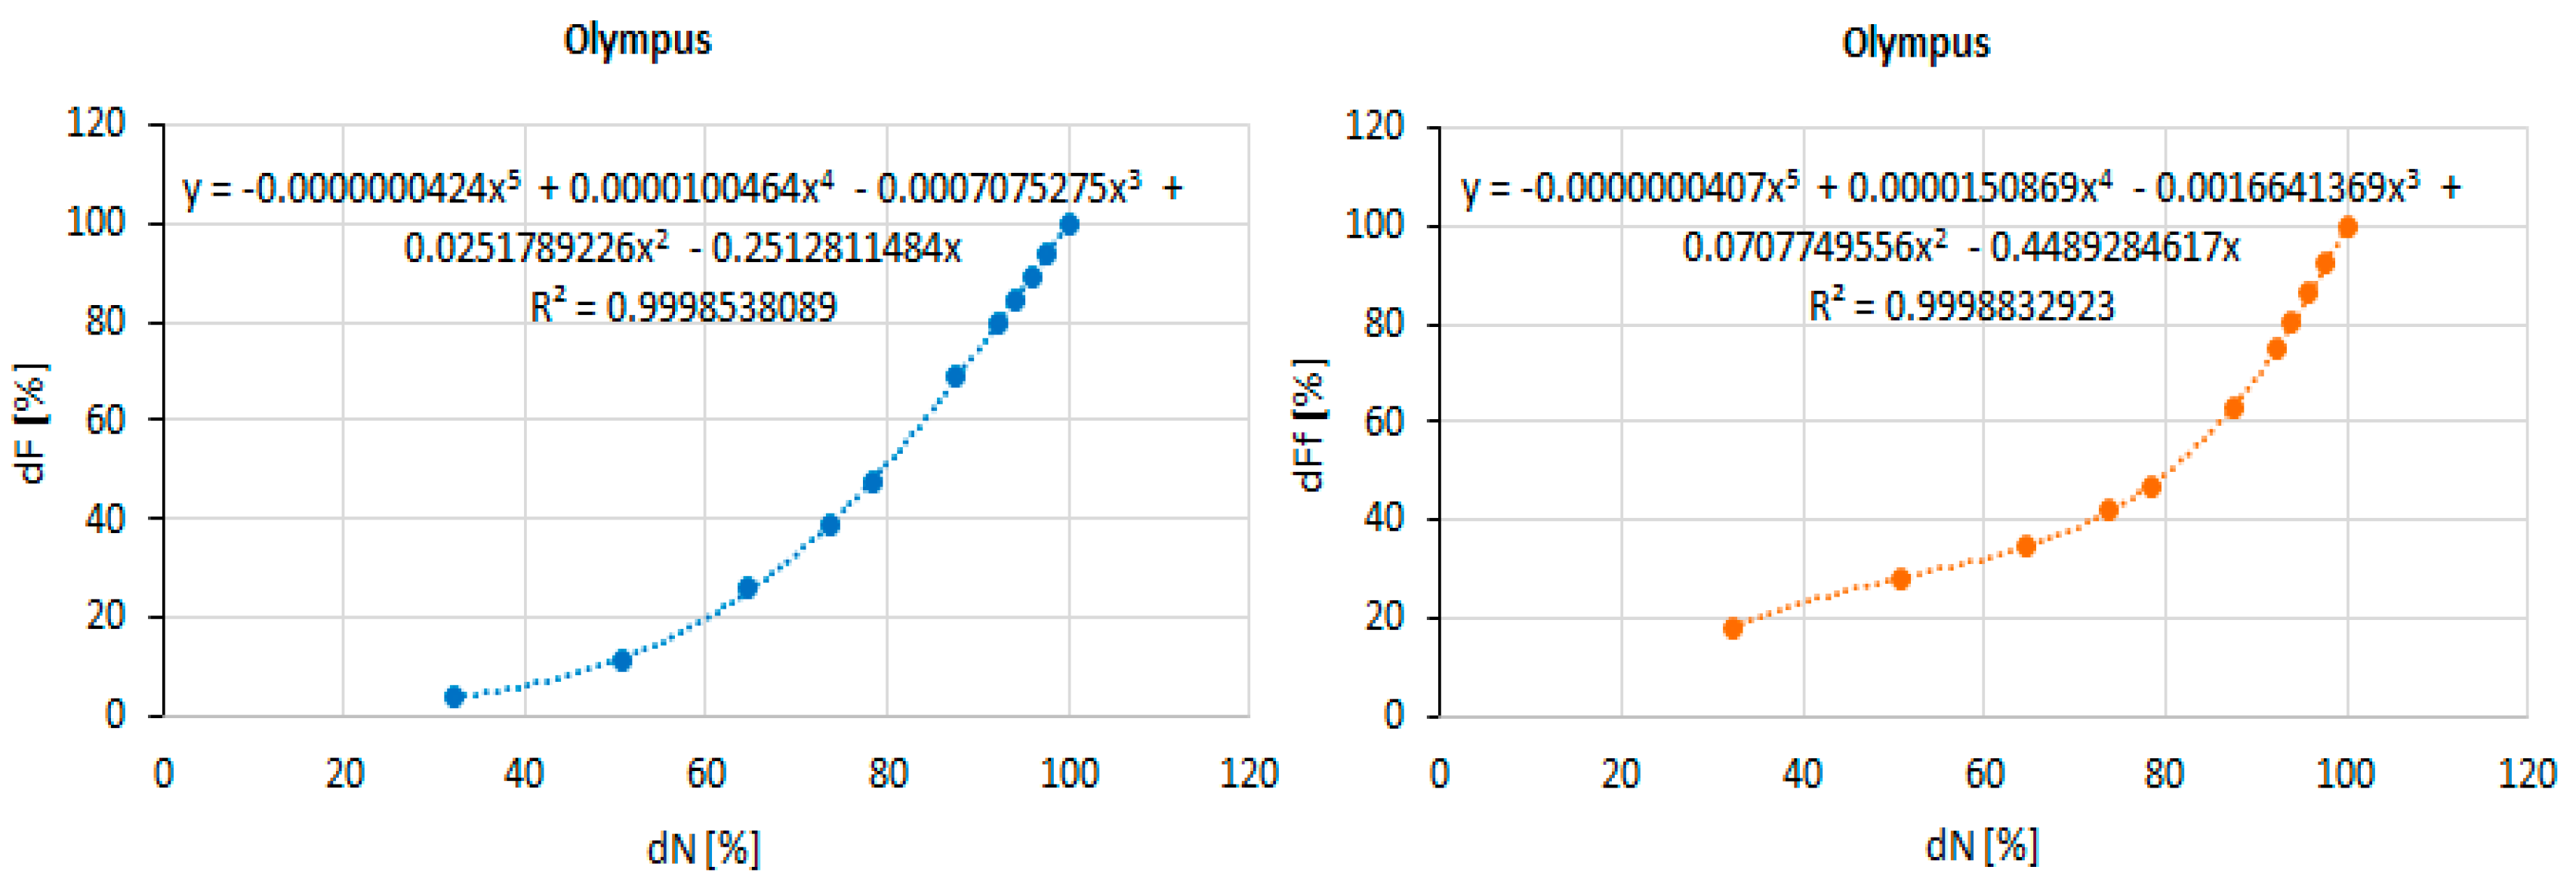
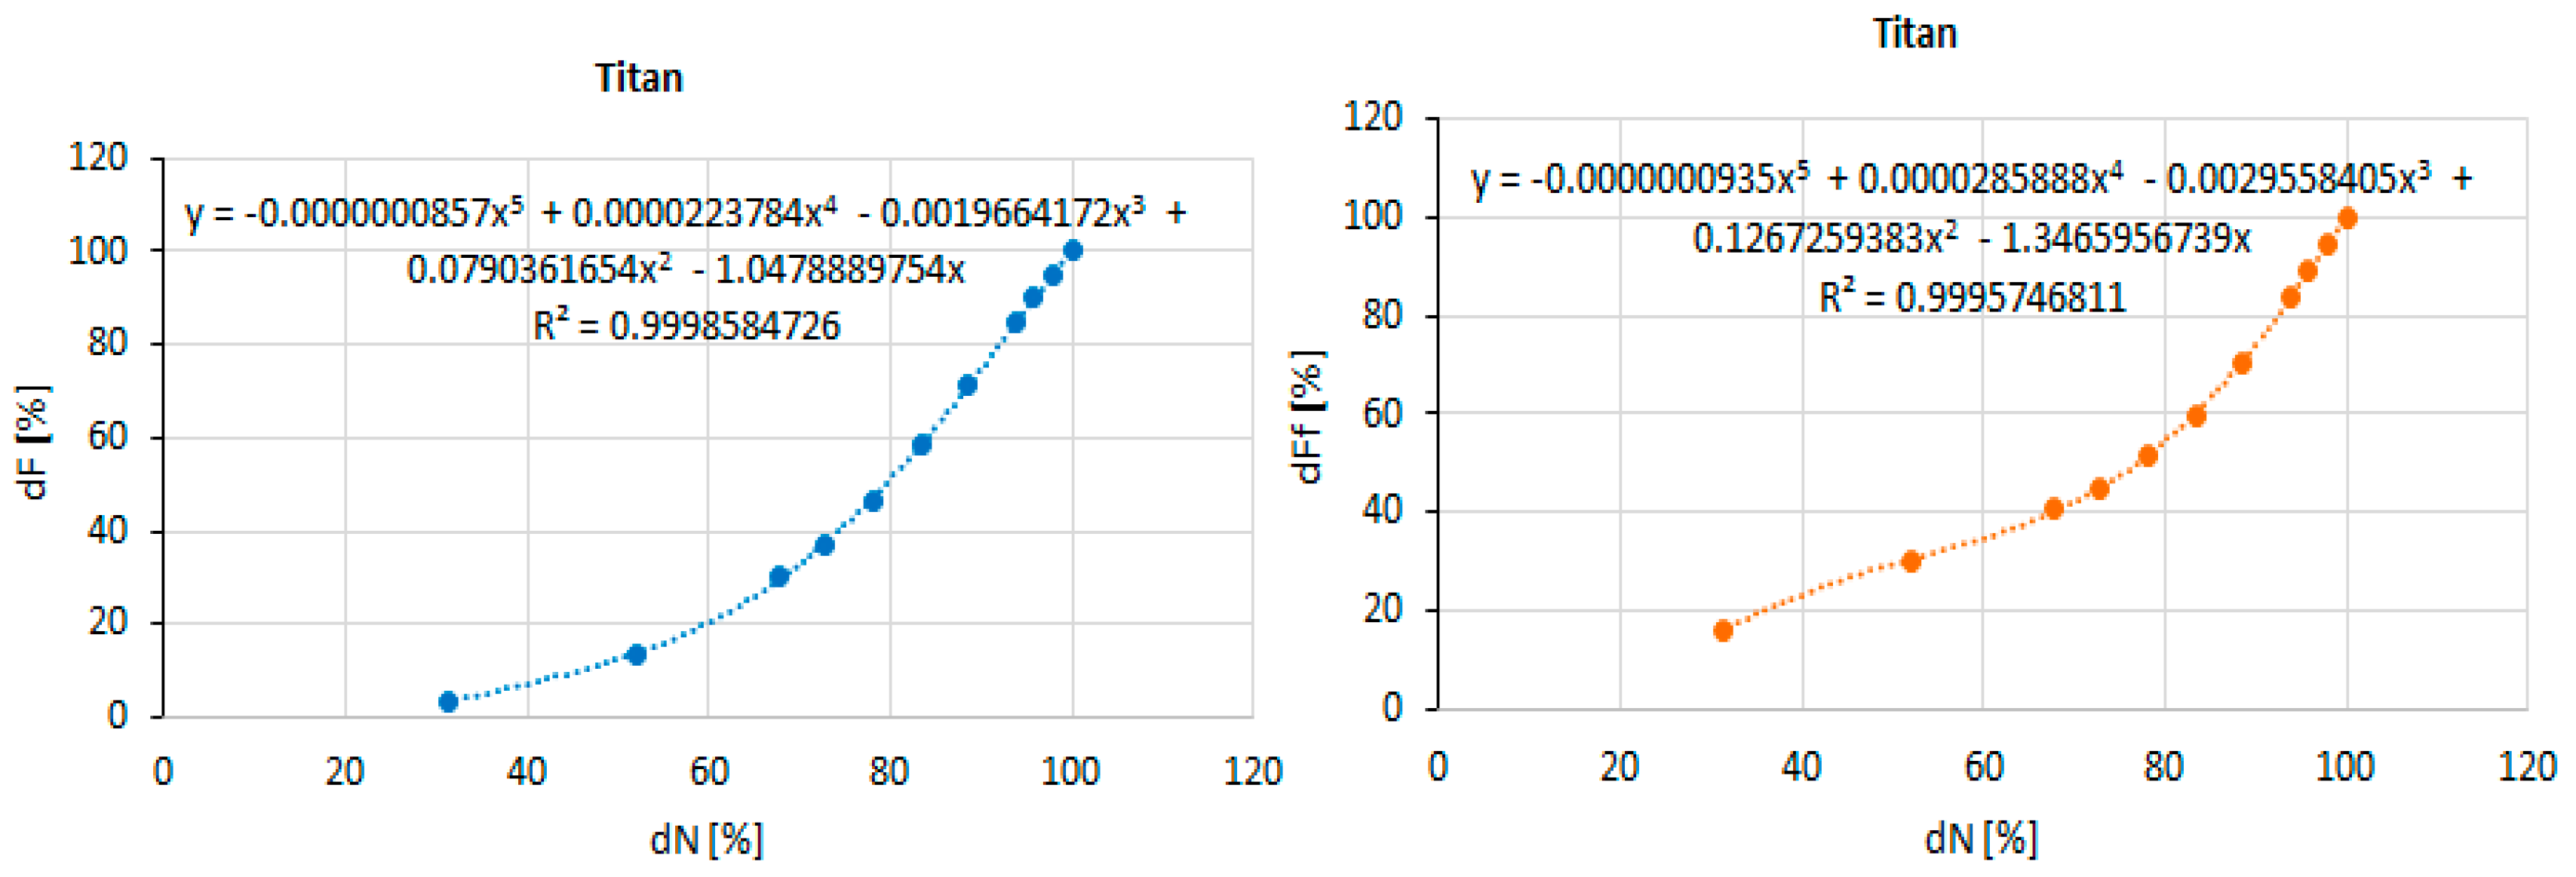
In addition, based on the percentage values, charts were generated to determine polynomial functions using trendlines that define the variation of engine percentage data as functions of engine speed (N) in the form:
To achieve high calculation accuracy, a 5th-degree polynomial function with coefficients specified to 10 decimal places was used, as shown in the following equation:
In the current analysis, an intercept function was used to calculate the y-intercept of a regression line based on a given set of x and y values.
The fifth-degree polynomial was adopted as it offered the best compromise between accuracy and generalization, with higher orders yielding only marginal improvements and increased risk of overfitting.
The polynomial functions of thrust (dF), fuel flow (dFf), exhaust gas temperature (dEGT), and specific fuel consumption (dTSFC) are displayed in the charts shown in
Figure 7,
Figure 8,
Figure 9,
Figure 10,
Figure 11,
Figure 12,
Figure 13,
Figure 14,
Figure 15 and
Figure 16.
A comprehensive examination of
Figure 7,
Figure 8,
Figure 9,
Figure 10,
Figure 11,
Figure 12,
Figure 13,
Figure 14,
Figure 15 and
Figure 16 revealed that the percentage variations of the main operating parameters (rotational speed
dN, fuel flow
dF, thrust
dT, and exhaust gas temperature
dEGT) displayed distinct behaviors depending on both the engine model and the operating regime. These differences were particularly pronounced at idle conditions, where each engine initiated parameter variations at markedly different values, reflecting their specific design characteristics and thermodynamic configurations.
For the Pegasus model, the onset of variation occurred at an idle rotational speed of 31.6%, with thrust variation starting at 5.3%, fuel flow at 22.3%, and exhaust gas temperature (EGT) already elevated at 79.4%. This indicates a relatively fuel-efficient idle operation, but with high thermal stress on turbine components. In the case of the Olympus engine, the idle values shifted slightly, with rotational speed at 32.3%, thrust variation beginning at 18.3%, fuel flow at 18.8%, and EGT at 55.5%. This comparatively lower EGT suggests reduced thermal loading but at the expense of a less efficient fuel-to-thrust ratio at idle.
The Titan model demonstrated a balanced performance, initiating variation at 31.3% rotational speed, with thrust changes from 3.8%, fuel flow at 16.0%, and EGT at 62.9%. This equilibrium highlights a more uniform trade-off between thermal efficiency and fuel demand. Conversely, the Nike engine presented the highest idle rotational speed at 34.1%, with thrust variation beginning at 5.1%, fuel flow at 18.2%, and EGT at 74.5%. Such values suggest a design philosophy prioritizing rapid responsiveness at the cost of elevated thermal stress. The Lynx engine stood out by displaying the highest idle EGT at 82.0%, coupled with 32.6% rotational speed, thrust variation from 4.8%, and fuel flow at 17.0%. This emphasizes its reliance on higher combustion temperatures, which may enhance the power density but imposes durability concerns.
Across all models, the relative variations in rotational speed (dN) remained tightly clustered between 31.3% and 34.1%, underlining a shared fundamental threshold for stable idle operation. However, the fuel flow variations (dF) exhibited significant discrepancies, ranging from 5.1% (Pegasus) to 22.3% (Pegasus upper bound), underscoring divergent fuel supply strategies and combustion efficiencies. EGT variation demonstrated the broadest dispersion, spanning from 55.5% (Olympus) to 82.0% (Lynx), indicating substantial differences in combustion chamber design, cooling strategies, and material resilience to thermal stress.
At higher operating regimes approaching full load, all parameters gradually converged toward values near 100%, confirming the engines’ capability to achieve comparable maximum performance. Nonetheless, the pronounced differences at idle have critical implications. Engines such as Pegasus and Lynx, with high idle EGT, face increased thermal wear risks, while Olympus demonstrates better thermal moderation but at the cost of higher fuel demand. These trade-offs directly influence fuel consumption, emission levels, and long-term component durability.
Overall,
Figure 7,
Figure 8,
Figure 9,
Figure 10,
Figure 11,
Figure 12,
Figure 13,
Figure 14,
Figure 15 and
Figure 16 demonstrate that while the maximum output performance converged across models, idle and intermediate regimes exhibited significant variation, providing essential insights into stability, efficiency, and operational resilience. Such comparative analysis is crucial for assessing engine suitability for diverse mission profiles: Pegasus appears optimal for fuel economy at the expense of higher EGT, Olympus favors thermal resilience, Titan achieves balanced performance, Nike prioritizes responsiveness, and Lynx maximizes power density with considerable thermal load implications.
To demonstrate the practical applicability of the polynomial functions, a thrust calculation example was performed by applying the thrust polynomial function of the Titan model to another engine, as shown in the equation above. The Titan model was selected due to its classification in the medium thrust range and its relatively low thrust percentage at idle regime.
As shown in
Figure 13, the thrust polynomial coefficients for the Titan model are presented in
Table 5.
To validate the applicability of the polynomial function, the obtained results were compared with the values derived from the processed raw data by calculating the percentage difference, as defined by the following formula:
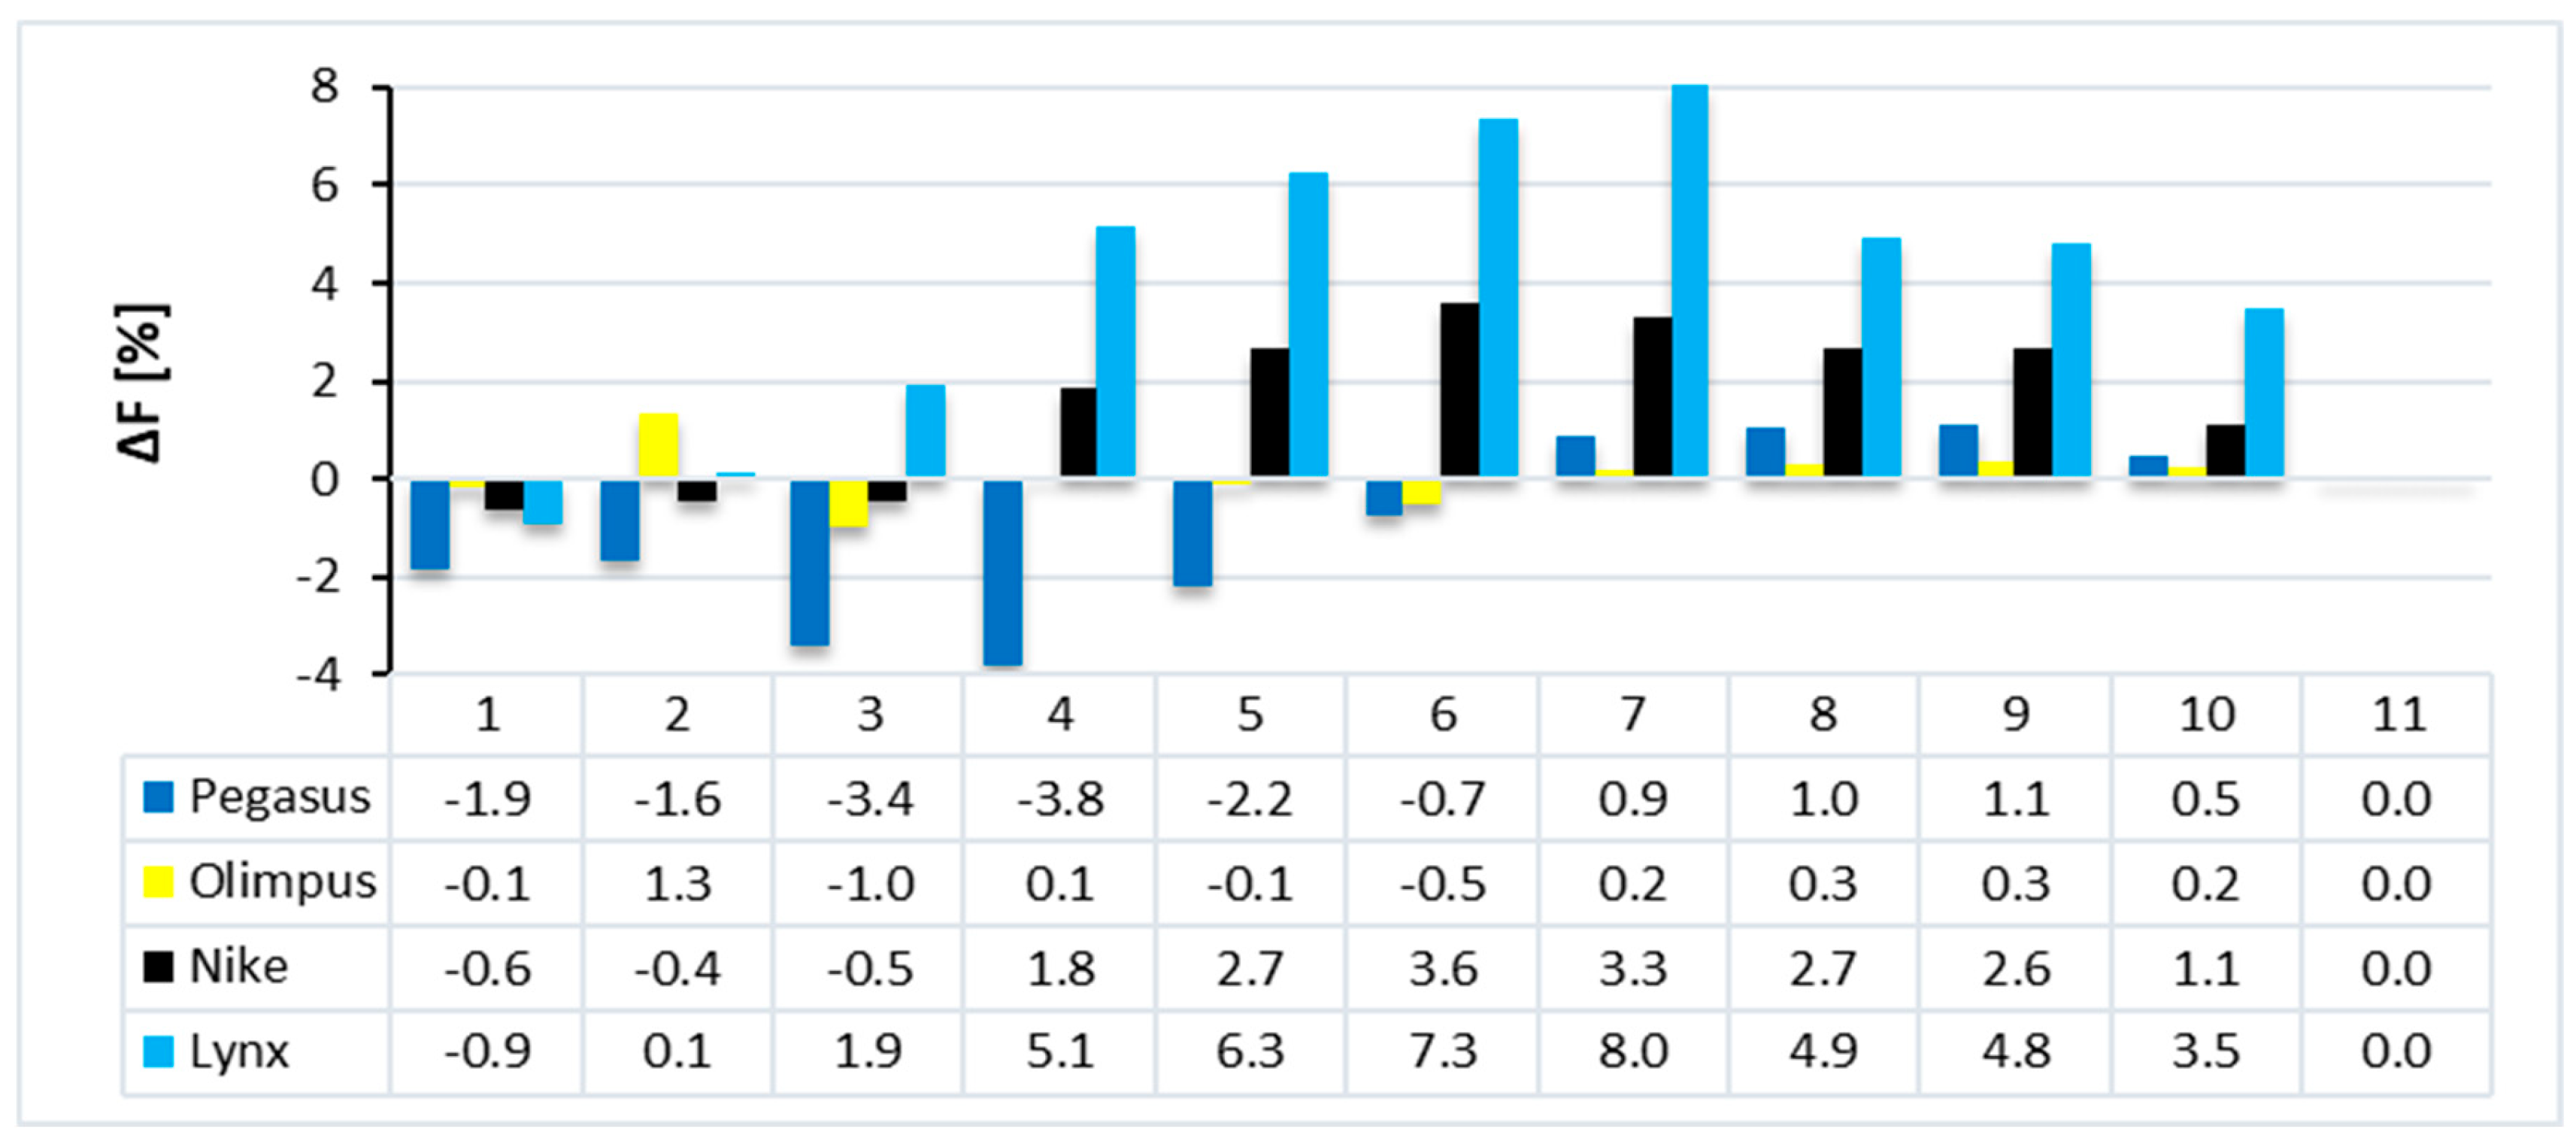
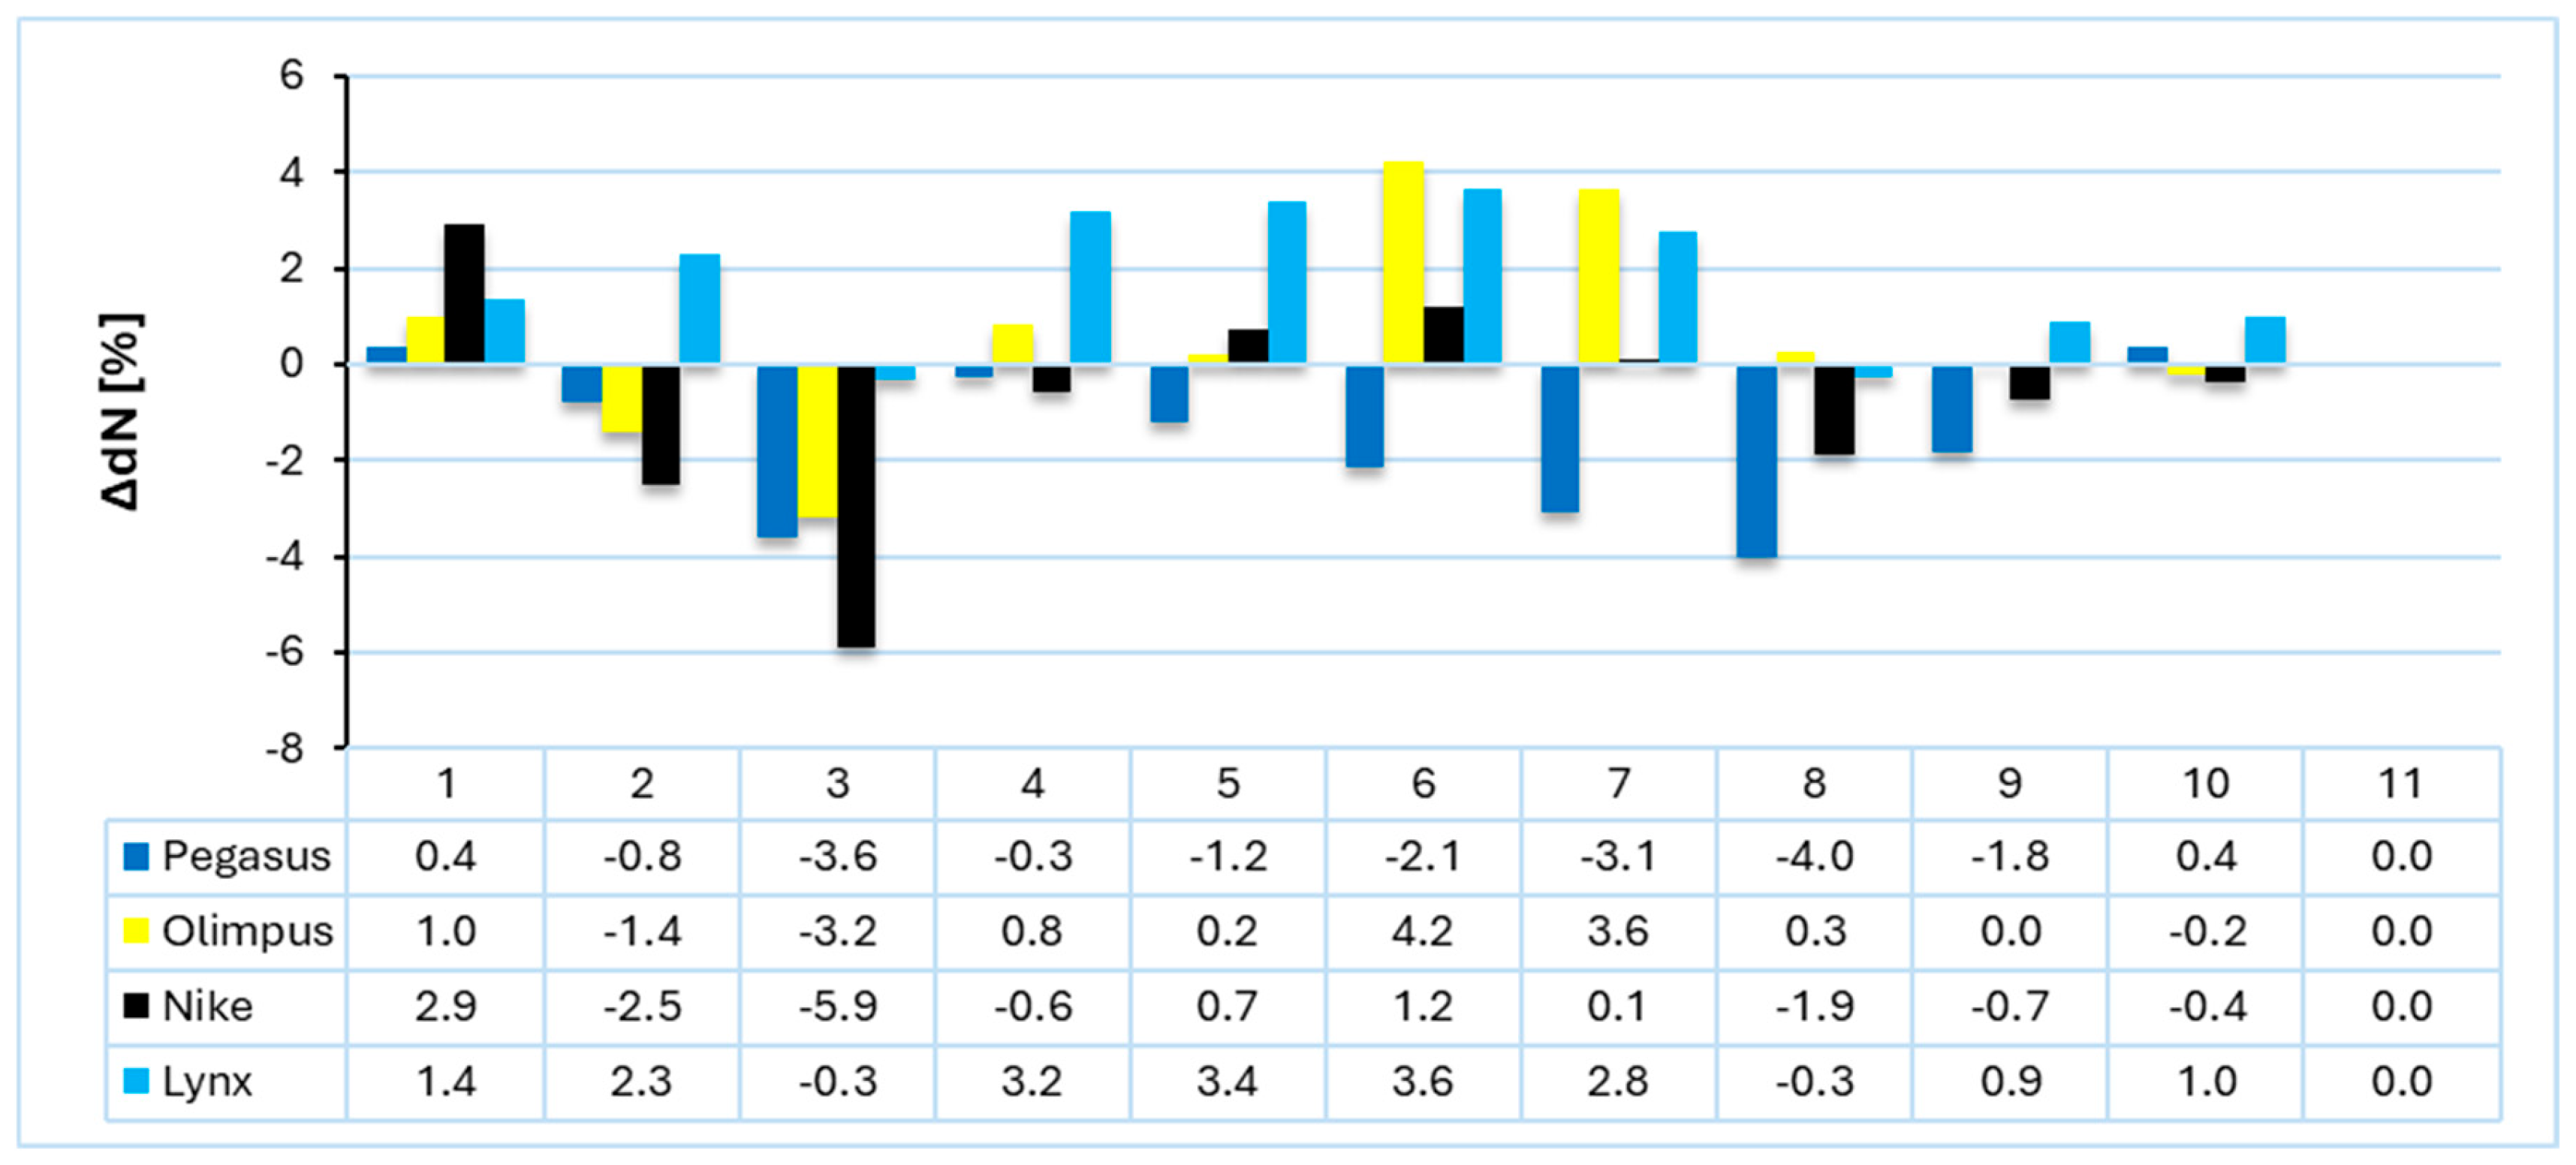
The percentage differences of each engine model relative to the Titan model are presented below the bar chart, as shown in
Figure 17 and
Figure 18.
Based on the percentage differences, the thrust polynomial function can potentially be applied from one engine to another, considering that the maximum average difference is approximately 4.5%, but its applicability is reliable for engines within comparable thrust ranges. The accuracy of the thrust polynomial function could be significantly improved if it were derived from a greater number of operating regimes. It should be noted that all percentage differences were calculated across a thrust range from 167 N (Pegasus) to 1569 N (Lynx). A similar calculation approach as that used for thrust can also be applied to fuel flow (Ff), exhaust gas temperature (EGT), and specific fuel consumption (TSFC) to evaluate the applicability of the corresponding polynomial functions.
Figure 18 shows the percentage differences of the rotational speed parameter (ΔN) for the Pegasus, Olympus, Nike, and Lynx engine models, relative to the Titan reference model. Deviations were generally within the ±4% range, indicating a good consistency among the analyzed engines. The most significant variations occurred for the Nike engine, where values lower than −5% were observed at operating points 2 and 3, highlighting a higher sensitivity in these regimes. Conversely, the Lynx and Pegasus models exhibited moderate positive deviations between operating points 4 and 7, suggesting a closer correlation with the Titan model. Overall, the results confirm that the polynomial function derived for the Titan model can be reliably applied to other engines, with deviations remaining within acceptable limits for comparative analyses.
It should be noted that this study does not provide constructive design explanations for the observed parameter variations, since manufacturers disclose very limited technical details of their micro-turbine engines. Therefore, the present work identified phenomenological patterns based on available performance data, while mechanistic interpretations would require access to proprietary design information.
The results obtained in this study, although presented in normalized percentage form, have direct implications for UAV propulsion system design and operation. For instance, variations observed in idle thrust or exhaust gas temperature (EGT) influence critical aspects such as endurance, payload capacity, and thermal management. A higher idle EGT, as identified in some of the analyzed engines, can increase the thermal load on surrounding structures, requiring either improved materials or more effective cooling systems. Conversely, a lower idle thrust level may reduce fuel consumption at loitering regimes but limit the engine’s ability to provide rapid throttle responses, highlighting an operational trade-off that UAV designers must carefully consider.
Beyond operational interpretation, the percentage-based methodology applied here can serve as a comparative tool for evaluating design trade-offs. For UAV applications, these trade-offs often involve balancing the thrust requirements against efficiency and thermal margins. The normalized data framework allows for different engines to be compared on the same scale, offering engineers a practical instrument to evaluate propulsion options even in the absence of complete design information. This approach aligns with the growing emphasis in the literature on comparative and phenomenological methodologies in micro gas turbine research (Weerakoon et al., 2023) [
1].
The present findings are also consistent with recent predictive modeling studies that highlight the importance of normalized input data for cross-engine performance evaluation. For example, Reale et al. (2022) [
29] demonstrated that combining experimental results with 0D/1D thermodynamic simulations can extend the analysis to off-design conditions, offering deeper insights into the endurance and thermal efficiency under varied flight scenarios. Similarly, Pamula (2025) [
30] underlined the role of optimal thermal management in UAV propulsion, showing that high temperature values directly affect mission duration and component life. By placing the current results in this broader research context, the comparative framework proposed here offers a baseline that can be integrated with more detailed numerical or experimental analyses.
At the same time, it must be emphasized that the discussion presented here has a phenomenological rather than mechanistic scope. The lack of access to detailed constructive data prevents the authors from linking observed differences (e.g., in EGT or thrust ratios) to specific design features such as combustor geometry or turbine materials. Nevertheless, the methodology proposed provides reproducible percentage-based relationships that can serve as input for further research. Future work should combine this framework with dedicated experimental campaigns or CFD simulations to validate and extend the trends identified, particularly for engines with different architectures (e.g., twin-shaft or axial compressor designs).
4. Conclusions
The comparative analysis of engine performance parameters across five distinct models (Pegasus, Olympus, Titan, Nike, and Lynx) has highlighted significant variations in fuel flow, thrust, rotational speed, and exhaust gas temperature (EGT), particularly in idle and intermediate regimes. Although all engines converged toward similar values at maximum operating conditions, their distinct behaviors at lower regimes revealed critical trade-offs that directly influence the operational efficiency, durability, and mission suitability.
Engines such as Pegasus and Lynx demonstrated notably high EGT levels at idle (79.4% and 82.0%, respectively), suggesting elevated thermal loads that may accelerate material degradation despite offering favorable thrust responsiveness. Conversely, the Olympus engine exhibited comparatively lower idle EGT (55.5%), reflecting improved thermal resilience, albeit at the cost of a less favorable fuel-to-thrust balance. The Titan engine emerged as a balanced solution, with intermediate values across all parameters, while Nike displayed the highest idle rotational speed (34.1%), indicating a design preference for rapid response.
These findings emphasize that while the maximum performance is broadly comparable among the models, the efficiency and sustainability of operation are highly dependent on idle and transient characteristics. From a practical perspective, Pegasus may be better suited for missions prioritizing fuel economy, Olympus for scenarios requiring thermal stability, Titan for balanced operations, Nike for rapid responsiveness, and Lynx for high power density at the expense of durability.
Overall, the study underlines the importance of assessing engine performance beyond the peak operational values, with a particular focus on idle and part-load regimes where significant differences emerged. Such insights are critical for optimizing engine selection and adaptation to specific mission requirements as well as guiding future research toward enhanced thermal management, improved fuel efficiency, and increased operational resilience.
