Article

A Novel Maximum Power Point Tracking Method Based on Optimal Evaporation Pressure and Superheat Temperature for Organic Rankine Cycle

by
Jinao Shen
and
Youyi Li
*
School of Marine Engineering Equipment, Zhejiang Ocean University, Zhoushan 316022, China
*
Author to whom correspondence should be addressed.
Processes 2025, 13(10), 3189; https://doi.org/10.3390/pr13103189
Submission received: 12 September 2025 / Revised: 30 September 2025 / Accepted: 3 October 2025 / Published: 8 October 2025
(This article belongs to the Section Energy Systems)

Abstract

The Organic Rankine Cycle (ORC) offers an efficient approach for harnessing low-grade thermal energy. However, ORC systems often struggle to achieve maximum output power when subject to fluctuations in sink and heat source temperatures. To address this challenge, this paper proposes a Maximum Power Point Tracking (MPPT) strategy based on the optimal evaporation pressure and superheat degree, enabling ORC systems to achieve maximum power output even under varying thermal conditions. First, a dynamic model of the ORC system is established, and the variations in key parameters under different expander and working fluid pump speeds are analyzed. Based on this analysis, the MPPT strategy is developed and its performance is verified through simulations under fluctuating sink and heat source temperatures. The results demonstrated that the ORC system must simultaneously adjust both the expander speed and the working fluid pump speed to maximize power output. Moreover, there exist optimal values of evaporation pressure and superheat degree that yield maximum system performance. Compared with the optimal evaporation pressure strategy, the proposed MPPT approach improves power generation by 14.15%.

1. Introduction

Many countries have successively announced net-zero carbon emission targets to address the escalating dual challenges of global climate change and energy insecurity. Power generation from low-grade heat sources offers a practical pathway toward achieving these goals [1]. Such heat sources are widely distributed in industrial waste heat, geothermal energy, solar thermal utilization, biomass energy, and ocean thermal gradients. Among various thermal energy conversion approaches, the Organic Rankine Cycle (ORC) has been extensively recognized as a leading technology for harnessing low-grade heat and transforming it into electricity, offering both high applicability and significant potential for energy recovery [2]. Maximizing the conversion efficiency from available thermal energy to electricity is a critical objective for ORC systems. However, in many thermal power generation scenarios, both sink and heat source temperatures vary with time, leading to off-design operation [3]. Consequently, Maximum Power Point Tracking (MPPT) control is required to adapt operating conditions and sustain optimal power output [4].
Maximum Power Point Tracking (MPPT) technology enables ORC systems to deliver maximum power output under varying sink and heat source conditions [5]. Quoilin et al. [6] proposed three MPPT control strategies. The first maintains a constant evaporation temperature by regulating pump flow rate and expander speed to control evaporation temperature and superheat degree. The second strategy determines the optimal evaporation temperature through a fitted correlation. The third utilizes a fitted relationship among heat source temperature, condenser temperature, and expander speed to identify the optimal working fluid flow rate under current operating conditions. Simulation results demonstrated that the optimal evaporation temperature strategy achieved the highest efficiency, providing theoretical guidance for subsequent studies.
Subsequent research has primarily focused on superheat temperature and evaporation pressure control. For MPPT strategies based on evaporation pressure, Hu et al. [7] simulated two approaches—fixed-pressure and sliding-pressure operation—adapted from steam turbine control. The results showed that at low geothermal mass flow rates, fixed-pressure operation achieved higher efficiency, whereas under fixed geothermal temperature with variable mass flow rates, sliding-pressure operation was superior. Peralez et al. [8] developed a reduced-order evaporator model and proposed a dynamic optimization algorithm to compute evaporation pressure for real-time control, demonstrating improved power generation efficiency. Hernandez et al. [9] introduced a perturbation-based extremum-seeking approach for real-time determination of the optimal evaporation temperature. To ensure system stability, they combined extended predictive adaptive control with model predictive control, achieving better performance than PID control. Li et al. [10] integrated reinforcement learning with model predictive control for evaporation pressure regulation, enhancing both response speed and control accuracy. Wang [11] compared fixed- and sliding-pressure operations, finding that sliding-pressure operation could increase net power output by up to 43.9%. Overall, these studies demonstrate that effective evaporation pressure control enables ORC systems to achieve maximum power output across diverse operating conditions.
In addition to evaporating pressure control, which enables the system to achieve maximum power output, regulating the superheat degree can also allow the ORC system to deliver maximum output under varying sink and heat source conditions [12]. Vaupel et al. [13] compared different maximum power output strategies for ORC systems and concluded that maintaining the minimum superheat degree is the most effective approach. Hernandez et al. [14] designed multiple model predictive control (MPC) strategies, adopting linear MPC when the superheat degree is relatively high and nonlinear MPC (NMPC) when it is low, in order to prevent the system from exceeding safe operating boundaries. This hybrid strategy not only increases net power output but also ensures safe operation. Zhou et al. [15] developed a 4 kW ORC experimental platform to compare and validate five MPPT strategies, finding that maintaining a constant superheat degree allows the system to operate safely. Fatigati et al. [16] proposed a model-based feedforward proportional–integral–derivative (PID) algorithm for superheat degree control, with experimental results demonstrating that this method enables the ORC system to achieve its designed output.
The two most widely adopted control strategies are the Minimal Superheat Temperature (MST) strategy [13] and the Optimal Evaporating Temperature (OET) strategy [6]. The OET strategy is theoretically derived and depends on heat source temperature, cold source temperature, and working fluid flow rate. In practice, the optimal evaporating temperature is calculated under given operating conditions and used as the setpoint. By contrast, the MST strategy regulates the evaporator outlet to maintain a small degree of superheating.
The OET strategy is best suited to scenarios with relatively stable operating conditions or cases where the heat source temperature or flow rate exceeds the rated value, as it allows the system to sustain optimal thermal efficiency and achieve high power output. However, under operating conditions where the heat source temperature or flow rate is below the rated level, OET control may drive the system beyond safe operating boundaries, potentially leading to equipment damage. In contrast, the MST strategy is more effective under severe heat source fluctuations or scenarios where the heat source temperature or flow rate declines below the specified operating point, ensuring safe and stable operation. Nevertheless, under conditions where the heat source temperature or flow rate exceeds the rated value, the MST strategy cannot enable the system to reach maximum power output.
A review of the existing literature indicates that relatively few MPPT strategies are able to simultaneously guarantee the safe operation of the ORC system and enhance power output to its maximum potential [5]. To address this gap, this study proposes an MPPT strategy based on the joint optimization of evaporating pressure and superheat degree. The strategy compiles the optimal evaporating pressure and superheat degree under various sink and heat source conditions into a system characteristic map. During operation, the controller references this map to obtain the optimal values corresponding to the current operating conditions. To further ensure that the system remains within safe operating limits, a Nonlinear Model Predictive Control (NMPC) algorithm is employed.
The rest of this manuscript is arranged as follows. Section 2 introduces the configuration of the ORC system and its control architecture, as well as the dynamic model of the ORC. Section 3 analyzes the relationship among output power, evaporating pressure, and superheat degree under different sink and heat source conditions, and it presents the proposed MPPT strategy. Section 4 details the design of the NMPC system. Finally, Section 5 discusses and evaluates the simulation results.

2. Methodology

2.1. Description of the ORC System and Its Control System

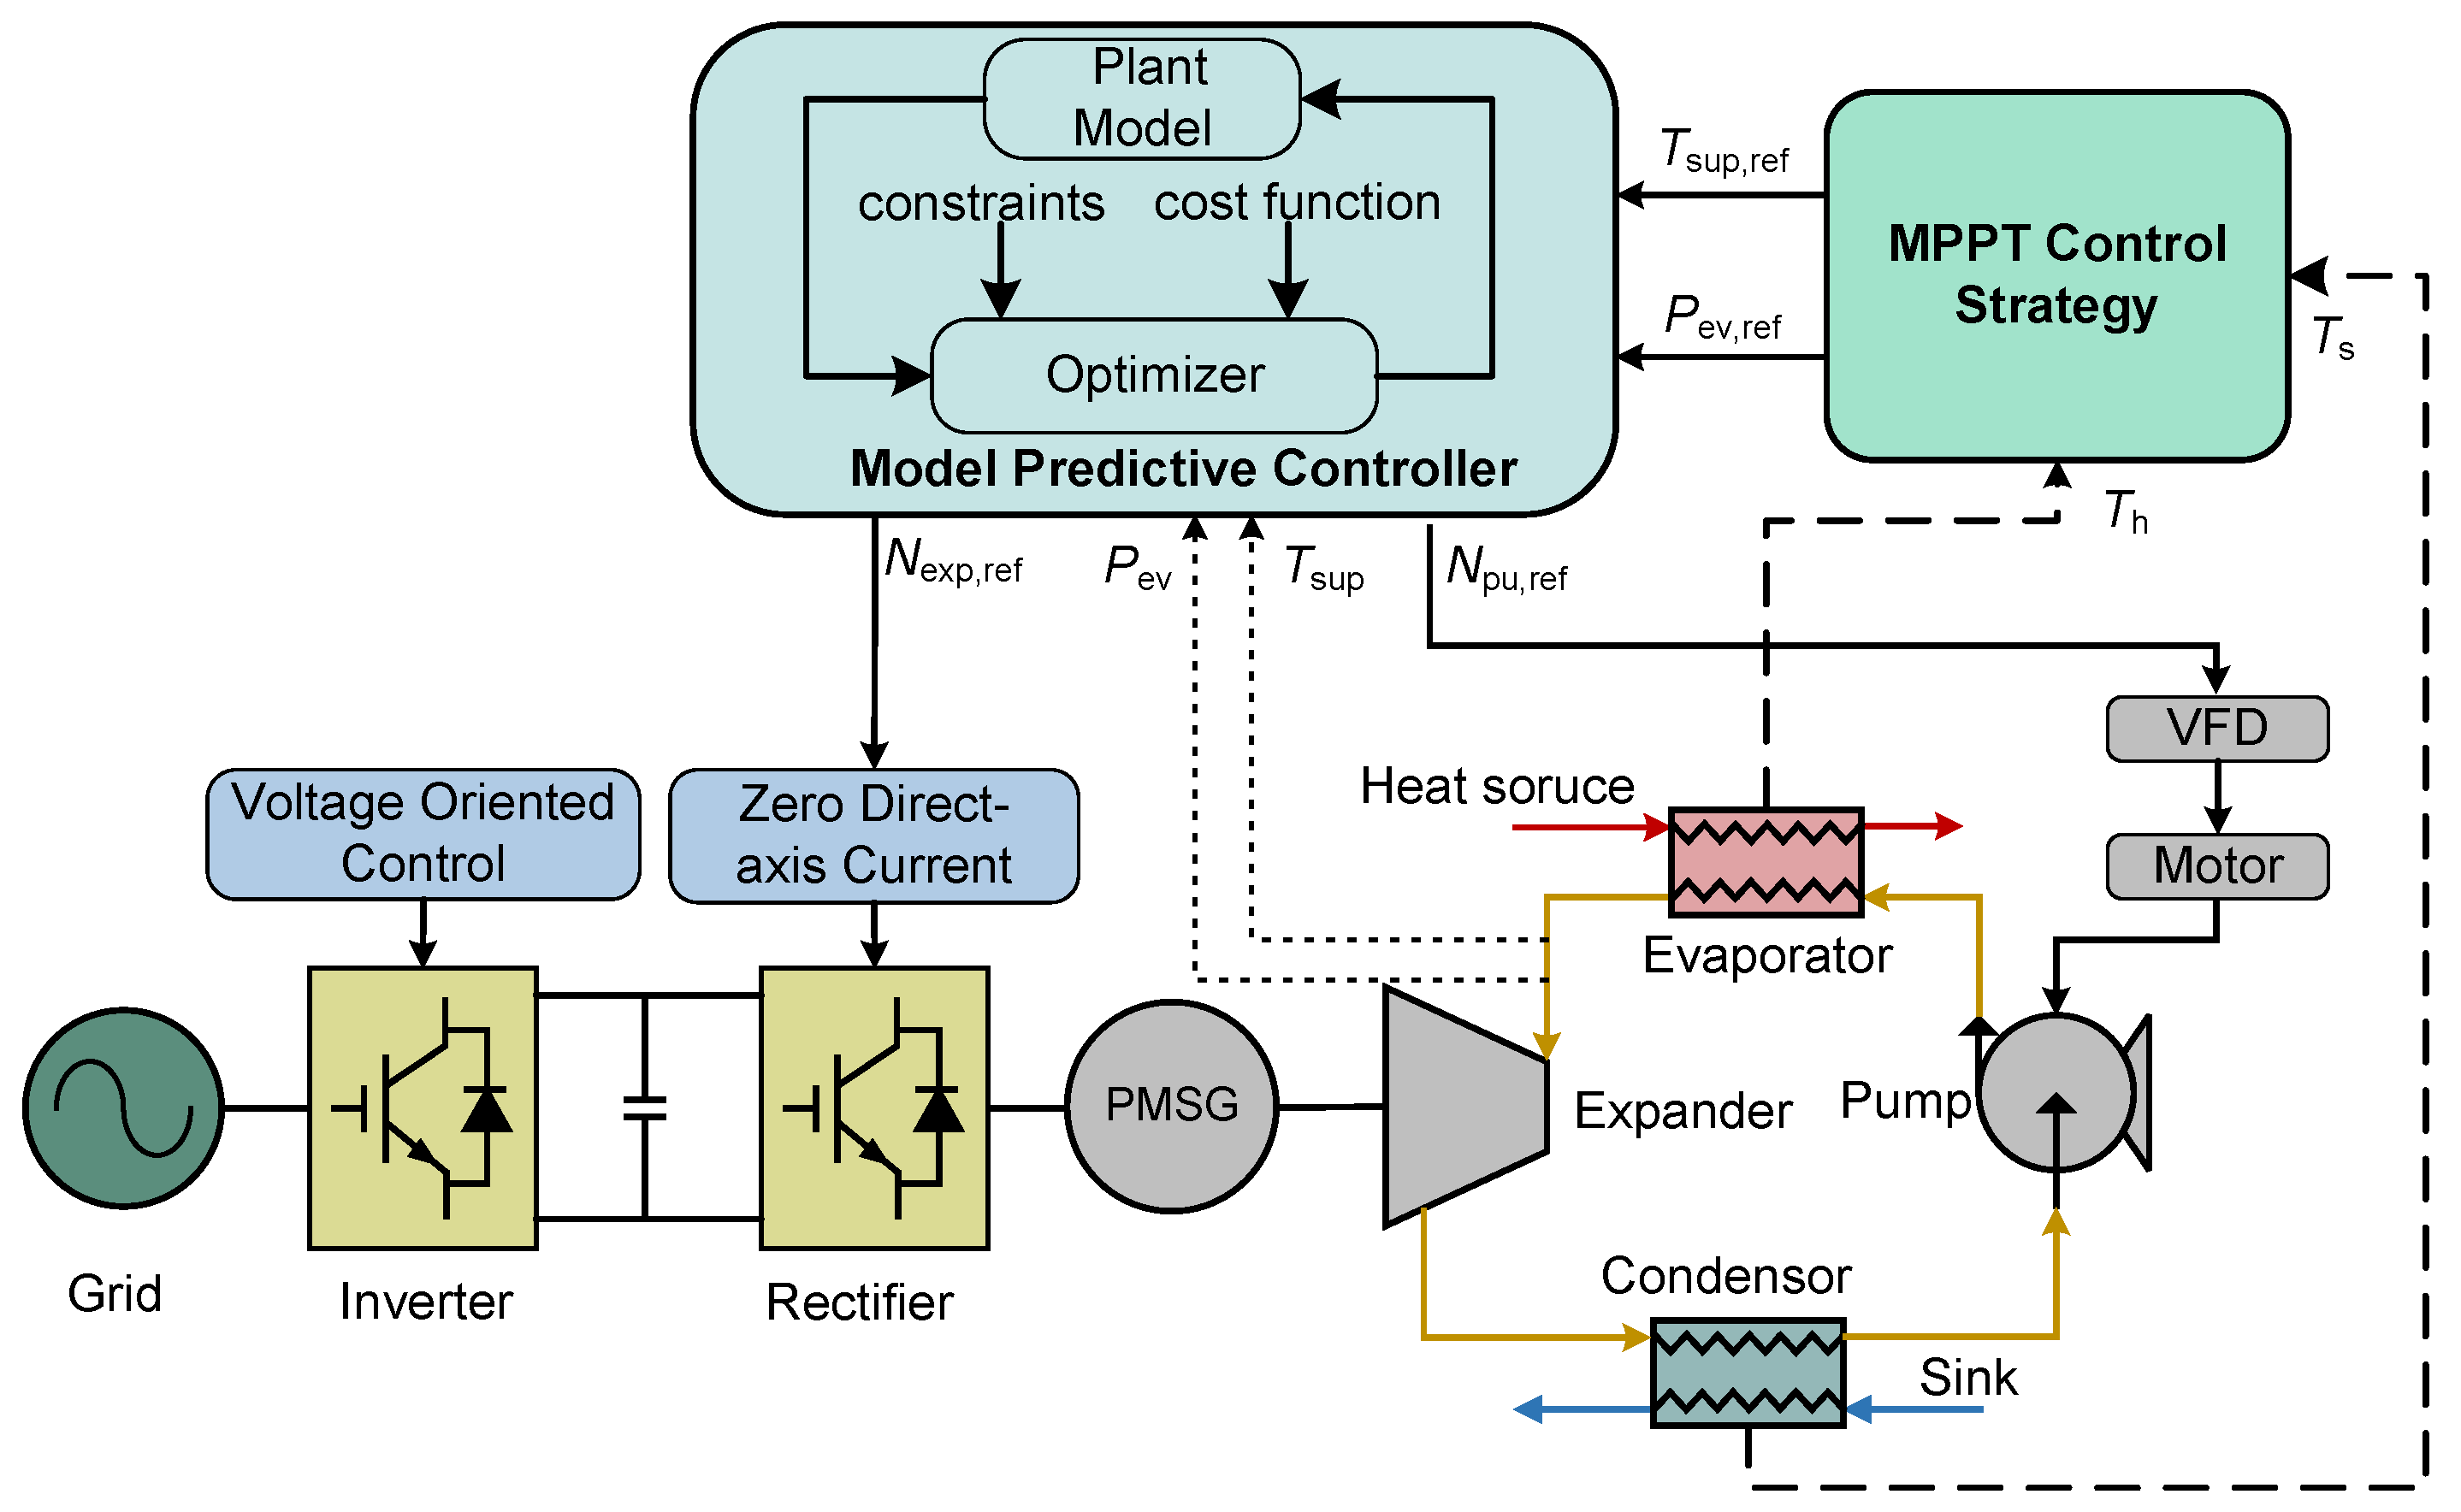
ORC is a technology that harnesses low-grade thermal energy for power generation. It offers relatively high thermo-electric conversion efficiency and is considered suitable for large-scale applications [17]. The overall configuration of the ORC power generation system and its control architecture is shown in Figure 1.
Figure 1 illustrates an ORC power generation system integrated with a power converter and an MPPT control strategy. The system comprises three core modules: the ORC power generation subsystem, the power conversion unit, and the control system. The ORC system is constituted by an evaporator, expander, condenser, working fluid pump, and generator. In this subsystem, the pump delivers the working fluid to the evaporator, where it is heated by the thermal source into high-pressure superheated vapor. The vapor then enters the expander, where it expands to produce mechanical work and is subsequently converted into low-pressure vapor. During this process, the expander drives the Permanent Magnet Synchronous Generator (PMSG) to generate alternating current (AC). The cycle is closed as the condenser converts the low-pressure vapor into subcooled liquid, finalizing the thermodynamic process of the ORC.
Within the power conversion unit, the electrical output of the PMSG is initially transformed into direct current (DC) through a controllable rectifier. Subsequently, the DC power from the rectifier is converted into alternating current (AC) by the inverter, which can then be either fed into the power grid or supplied directly to the load. The inverter thus serves not only to convert DC into AC but also to enable both grid-connected and stand-alone operation.

2.2. Dynamic Modeling of ORC System

Within the ORC system, the transient characteristics are primarily controlled by the heat exchangers, whose response time is slower than that of other components [18]. Therefore, it is essential to establish a dynamic evaporator model that offers both fast computational performance and accurate dynamic response.

2.2.1. Heat Exchanger

The heat exchanger is one of the most critical components in the ORC system, as its performance directly affects both the efficiency and the dynamic behavior of the cycle. In the literature, dynamic modeling techniques for heat exchangers are commonly grouped into two major categories: the Moving Boundary Model (MBM) approach [19] and the Finite Volume Method (FVM) [20]. The FVM approach is capable of delivering highly accurate results by finely discretizing the heat exchanger into a large number of control volumes; however, this accuracy comes at the cost of significant computational burden, which limits its applicability in real-time control and optimization. By contrast, the MBM approach offers a compromise between computational efficiency and modeling accuracy. MBM assumes uniform states within sharp phase regions and tracks only the moving interfaces, which makes it computationally efficient but unable to resolve detailed spatial variations. FVM, in contrast, captures local gradients and transients at the expense of significantly higher computational requirements. MBM is thus ideal for system-level dynamic simulation and control studies, whereas FVM is more suitable for high-fidelity component analysis. Therefore, MBM is adopted for heat exchanger modeling in this study. In the MBM framework, the heat exchanger is divided into three thermodynamic zones, as illustrated in Figure 2. The governing partial differential equations of mass and energy conservation are then integrated over the length of the evaporator within these zones, yielding a reduced-order yet dynamically representative model of the evaporator.
Figure 2 illustrates the three distinct regions in the moving boundary model. The subcooled region refers to the state in which the fluid remains in a subcooled condition inside the tube, during which the working fluid transitions from a subcooled liquid to a saturated liquid. The two-phase region represents the phase-change zone of the working fluid, describing its state transition during evaporation or condensation in the heat exchange process. Finally, in the superheated region, the working fluid evolves from saturated vapor into superheated vapor, carrying additional energy.
The following assumptions are made in the dynamic modeling of the heat exchanger:
  • The heat exchanger is treated as a long horizontal tube;
  • The conservation of momentum is neglected;
  • The working fluid flow is considered to be in one-dimensional flow;
  • Axial conduction is neglected;
  • The pressure drop inside the tube is neglected.
In the MBM, the working fluid in each region can be described by the mass and energy conservation equations. The mass balance equation governing the working fluid is expressed as follows:
ρ A t + m ˙ z = 0
The energy conservation of the working fluid is mathematically described as follows:
( ρ A h A P ) t + ( m ˙ h ) z = π D i α i ( T w T r )
The energy conservation of the tube wall is mathematically expressed as follows:
( C p ρ A ) w T w t = π D i α i ( T r T w ) + π D o α o ( T hs T w )
By integrating the mass and energy balance equations along the horizontal tube using the Leibniz integral rule, the following mass and energy conservation equations are obtained:
Sub-cooled zone:
1 2 A ρ ¯ 1 ( h in + h l ) 2 ρ l h l d L 1 d t + 1 2 A L 1 ρ ¯ 1 + 1 2 h in + h l ρ ¯ 1 h | p d h in d t + 1 2 A L 1 ρ ¯ 1 d h l d p + ( h in + h l ) ρ ¯ 1 p | h + 1 2 ρ ¯ 1 h | p d h l d t 2 d p d t = m ˙ in h in m ˙ 1 h l + π D i L 1 α i 1 ( T ¯ w 1 T ¯ r 1 )
A ( ρ ¯ 1 ρ l ) d L 1 d t + L 1 ρ ¯ 1 p | h + 1 2 ρ ¯ 1 h | p d h l d p d p d t + 1 2 L 1 ρ ¯ 1 h | p d h m d t = m ˙ in m ˙ 1
( C p ρ A ) w L 1 d T ¯ w 1 d t = π L 1 D o α o 1 ( T ¯ hs 3 T ¯ w 1 ) D i α i 1 ( T ¯ w 1 T ¯ r 1 )
where m ˙ is mass flow rate, h is enthalpy, ρ is density, L is the length of the tube, A is area, p is pressure, T is temperature, D is diameter, α is the heat transfer coefficient, and C p is specific heat capacity.
Two-phase zone:
A ρ l h l ρ g h g d L 2 d t + A ( 1 γ ¯ ) ρ l h l ρ g h g d L 1 d t + A L 2 γ ¯ d ( ρ g h g ) d p + ( 1 γ ¯ ) d ( ρ l h l ) d p 1 d p d t = m ˙ 1 h l m ˙ 2 h g + π D i L 2 α i 2 ( T ¯ w 2 T ¯ r 2 )
A ( ρ l ρ g ) d L 1 d t + ( 1 γ ¯ ) ( ρ l ρ g ) d L 2 d t + L 2 γ ¯ d ρ g d p + ( 1 γ ¯ ) d ρ l d p d p d t = m ˙ 1 m ˙ 2
( C p ρ A ) w L 2 d T ¯ w 2 d t = π L 2 D o α o 2 ( T ¯ hs 2 T ¯ w 2 ) D i α i 2 ( T ¯ w 2 T ¯ r 2 )
Superheat zone:
A ρ g h g 1 2 ρ ¯ 3 ( h g + h out ) d L 1 d t + d L 2 d t + A L 3 1 2 ( h g + h out ) 1 2 ρ ¯ 3 h | p d h g d p + ρ ¯ 3 p | h + 1 2 ρ ¯ 3 d h g d p 1 d p d t + A 1 2 ρ ¯ 3 L 3 + 1 4 ρ ¯ 3 h | p ( h g + h out ) L 3 d h out d t = m ˙ 2 h g m ˙ out h out + π D i L 3 α i 3 ( T ¯ w 3 T ¯ r 3 )
A ( ρ g ρ ¯ 3 ) d L 1 d t + ( ρ g ρ ¯ 3 ) d L 2 d t + A L 3 1 2 ρ ¯ 3 h | p d h g d p + ρ ¯ 3 p | h d p d t + 1 2 A L 3 ρ ¯ 3 h | p d h out d t = m ˙ 2 m ˙ out
A w ρ w c p , w L 3 d T ¯ w 3 d t = π L 3 D o α o 3 ( T ¯ hs 1 T ¯ w 3 ) D i α i 3 ( T ¯ w 3 T ¯ r 3 )
Consequently, the state space form of the model can be described as follows [21]:
x ˙ = Z ( x , u ) 1 f ( x , u )
where is the state vector of the heat exchanger, e q u a t i o n x = L 1 , L 2 , h out , p , T ¯ w 2 , T ¯ w 2 , T ¯ w 3 . u is the input vector, u = m ˙ in m ˙ out h in h ˙ in T h , in m ˙ h T .
Z ( x , u ) = z 11 0 z 13 0 0 0 0 z 21 z 22 z 23 0 0 0 0 z 31 z 32 z 33 z 34 0 0 0 z 41 z 42 z 43 z 44 0 0 0 z 51 0 0 0 z 55 0 0 z 61 z 62 0 0 0 z 66 0 0 z 72 0 0 0 0 z 77
The elements in matrix Z are given in Appendix A.
f ( x , u ) = f 1 f 2 f 3 f 4 f 5 f 6 f 7 T
f 1 = m ˙ in ( h in h l ) + α i 1 π D i L 1 ( T ¯ w 1 T ¯ r 1 ) A cs 2 ρ ¯ 1 L 1 + 1 2 h in + h l ρ ¯ 1 h 1 | P h l L 1 ρ ¯ 1 h 1 | P h ˙ in f 2 = m ˙ in ( h l h g ) + α i 2 π D i L 2 ( T ¯ w 2 T ¯ r 2 ) + 1 2 A cs L 1 ρ ¯ 1 h | P ( h g h l ) h ˙ in f 3 = m ˙ out ( h g h out ) + α i 3 π D i L 3 ( T ¯ w 3 T ¯ r 3 ) f 4 = m ˙ in m ˙ out A cs L 1 2 ρ ¯ 1 h 1 | P h ˙ in f 5 = π L 1 D o α o 1 ( T ¯ hs 3 T ¯ w 1 ) D i α i 1 ( T ¯ w 1 T ¯ r 1 ) f 6 = π L 2 D o α o 2 ( T ¯ hs 2 T ¯ w 2 ) D i α i 2 ( T ¯ w 2 T ¯ r 2 ) f 7 = π L 3 D o α o 3 ( T ¯ hs 1 T ¯ w 3 ) D i α i 3 ( T ¯ w 3 T ¯ r 3 )

2.2.2. Expander and Pump

Since the response times of pumps and expanders are much faster than those of heat exchangers, steady-state models are adopted for these components. The expander is typically treated as a nozzle for modeling purposes, and its mass flow rate is given as follows [4]:
m ˙ exp = C exp ρ exp P in , exp P out , exp
where C exp is the coefficient of flow.
The output power of the expander can be caculated as follows:
W exp = m ˙ r ( h exp , in h is , out + v r , exp ( P exp , in P exp , out ) ) η exp
The mass flow rate of the pump is described as follows:
m ˙ pu = η pu · ρ r , l · V pu · ω pu
where ω pu is the angular velocity of the pump, and V pu is the pump suction volume.
The power consumption of the pump can be presented as follows:
W ˙ pu = m ˙ r ( h out , pu h in , pu ) η pu

2.2.3. PMSG

The permanent magnet synchronous generator (PMSG) is a device that converts mechanical energy into electrical energy for output. To facilitate control implementation, its mathematical model is conventionally formulated in the dq-axis coordinate system [22]. The voltage equations of the PMSG are given as follows:
u d = R s i d + L d d i d d t ω e ψ q u q = R s i q + L q d i q d t + ω e ψ d
where u is the voltage of PMSG, ψ is flux linkage, and can be calculated as follows:
ψ d = ψ f + L d i d ψ q = L q i q
The electromagnetic torque of PMSG can be expressed as follows:
T e = 3 2 p n ψ f i q + L d L q i q i d
where p n is pole-pairs.
The rotational dynamics of the PMSG can be presented as follows:
J d ω r d t = T e T m
where J is the moment of inertia.

2.2.4. Rectifier and Inverter

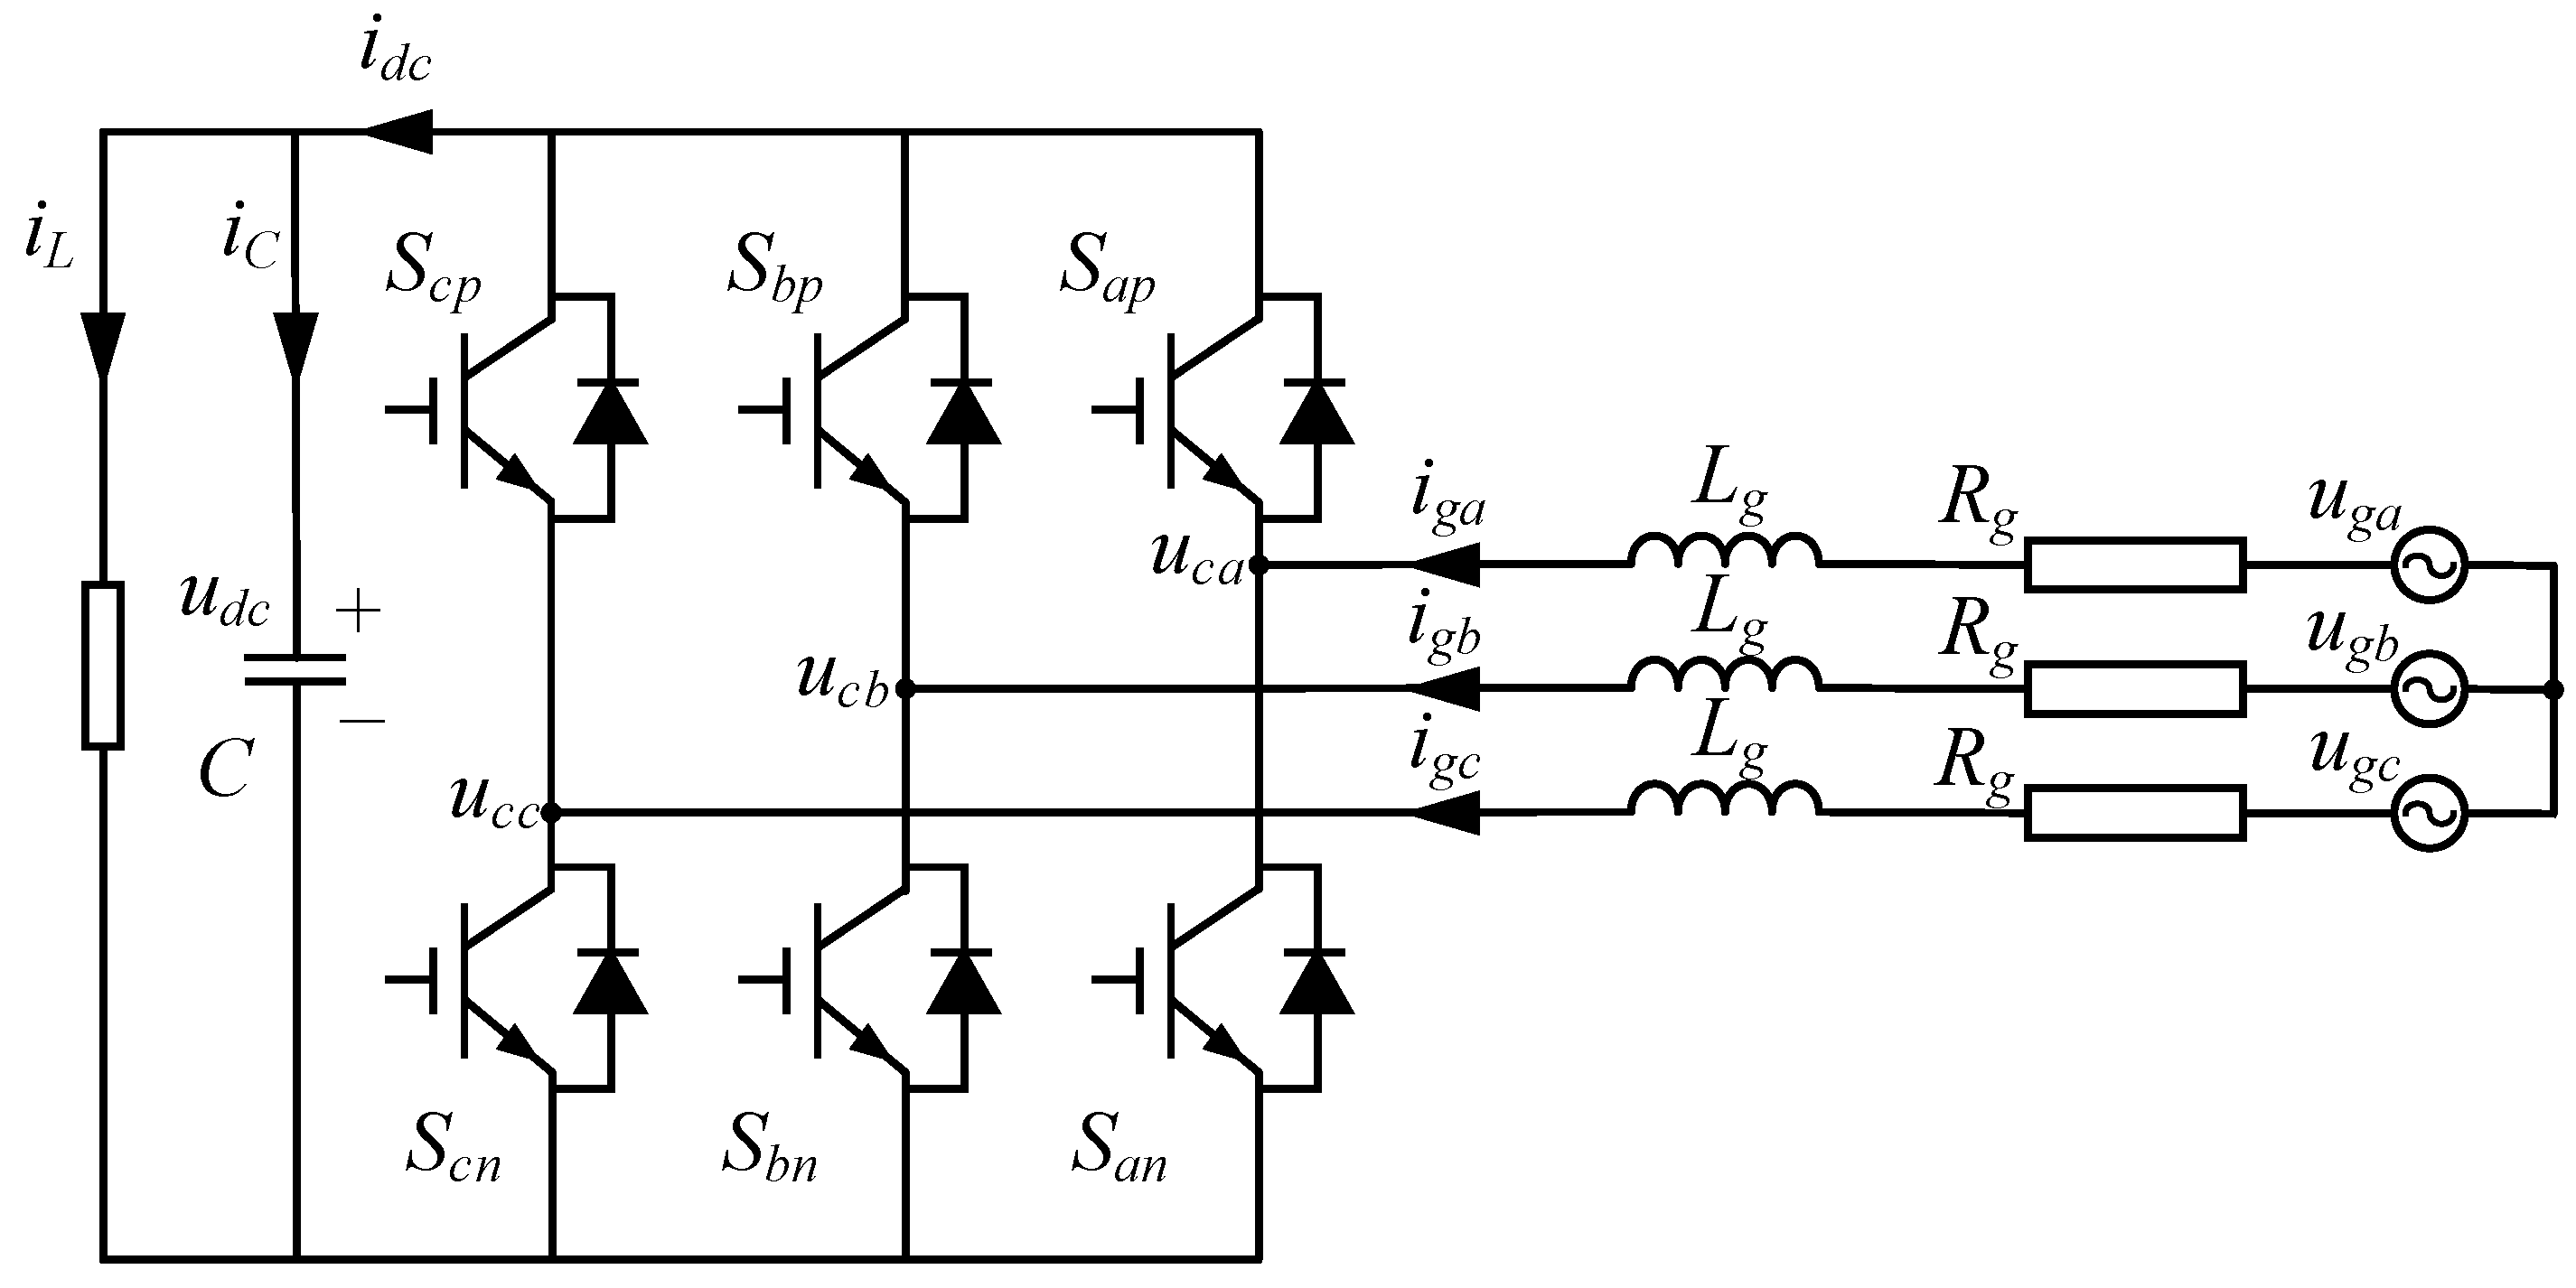
In an ORC power generation system, it is necessary to regulate the expander speed in order to achieve maximum power output. Typically, the expander speed is controlled indirectly through its rigidly coupled PMSG. The control of the PMSG involves adjusting its electromagnetic torque, which in turn governs the rotational speed. This torque is determined by the magnitude of the q-axis current, which can be regulated by a controllable rectifier. Therefore, the expander speed can be effectively managed by controlling the q-axis current via the rectifier. Controlling the expander speed in this manner allows the system to respond dynamically to variations in heat source and load, thereby improving overall efficiency and stability. Inverters and rectifiers share the same configuration and follow identical mathematical models [23]. Accordingly, only the mathematical model of the inverter is developed in this study as a representative example. The configuration of the PWM inverter is illustrated in Figure 3.
According to Kirchhoff’s voltage law, the voltage relationship in the abc coordinate system can be obtained as follows [24]:
u ga = L g d i ga d t + R g i ga + S a S a + S b + S c 3 u dc u gb = L g d i gb d t + R g i gb + S b S a + S b + S c 3 u dc u gc = L g d i gc d t + R g i gc + S c S a + S b + S c 3 u dc
The DC-link capacitor dynamics are described as follows:
C d u d c d t = S a i ga + S b i g b + S c i g c i L
Subsequently, the three-phase grid voltages and currents are transformed to the dq-axis coordinate system:
u c d = u g d R g i g d L g d i g d d t + ω L g i g q u c q = u g q R g i g q L g d i g q d t ω L g i g d
C d u d c d t = S d i g d + S q i g q i L

2.3. Control Strategy of the Rectifier

In the ORC power generation system, the control strategy of the rectifier could regulate the expander rotational speed to the setpoint. Currently, the zero d-axis current control strategy is widely adopted for the control strategy of the rectifier. The control principle of this strategy is to set the d-axis current to zero during the control process [25]. The dq-axis current is affected not only by the stator control voltage but also by the coupled voltage. Therefore, this study adopts a dual closed-loop control strategy consisting of an inner current loop and an outer speed loop. The specific overall machine-side control strategy is illustrated in Figure 4.
The control process for regulating the expander’s rotational speed via the rectifier is illustrated in Figure 4. First, the rotor position θ r and the phase currents i a b c are measured and subsequently transformed to obtain i q and i d . The reference rotational speed is denoted as N exp , ref , while N exp represents the actual rotational speed. The resulting error is processed through a PI controller to generate the reference current i q * . This reference current is compared with the actual i q , and the coupled voltage term is added to yield the reference voltage u q . For d-axis control, no speed loop is required. Instead, the reference voltage u d is obtained directly through PI control action combined with the influence of the coupled voltage. Finally, the two reference voltages are transformed into the α β coordinate system to produce the reference voltages u α and u β . The switching of the rectifier devices is then governed by the SVPWM modulation technique.

3. An Mppt Strategy Based on Optimal Evaporation Pressure and Superheat Degree

To maximize the power output of an ORC system when sink and heat source temperatures change, this study proposes a MPPT strategy based on optimal evaporation pressure and superheat degree.

3.1. The Effect of Heat Source on the ORC System

First, the power output, evaporation pressure, and superheat are analyzed under different expander rotational speeds with a sink temperature of 20 C .
As shown in Figure 5, the output power of the ORC system exhibits distinct variations with changes in the working fluid flow rate and expander rotational speeds when the heat source temperature is below the rated operating condition. It can be observed that the ORC system exhibits a maximum power output for each combination of working fluid flow rate and expander speed. This maximum output can be achieved by appropriately adjusting the pump and the expander rotational speed. Moreover, The findings demonstrate that lowering the heat source temperature imposes constraints on system operation, making it necessary to decrease the working fluid flow rate. This measure ensures that the ORC system continues to operate safely and avoids potential instabilities associated with inadequate thermal input.
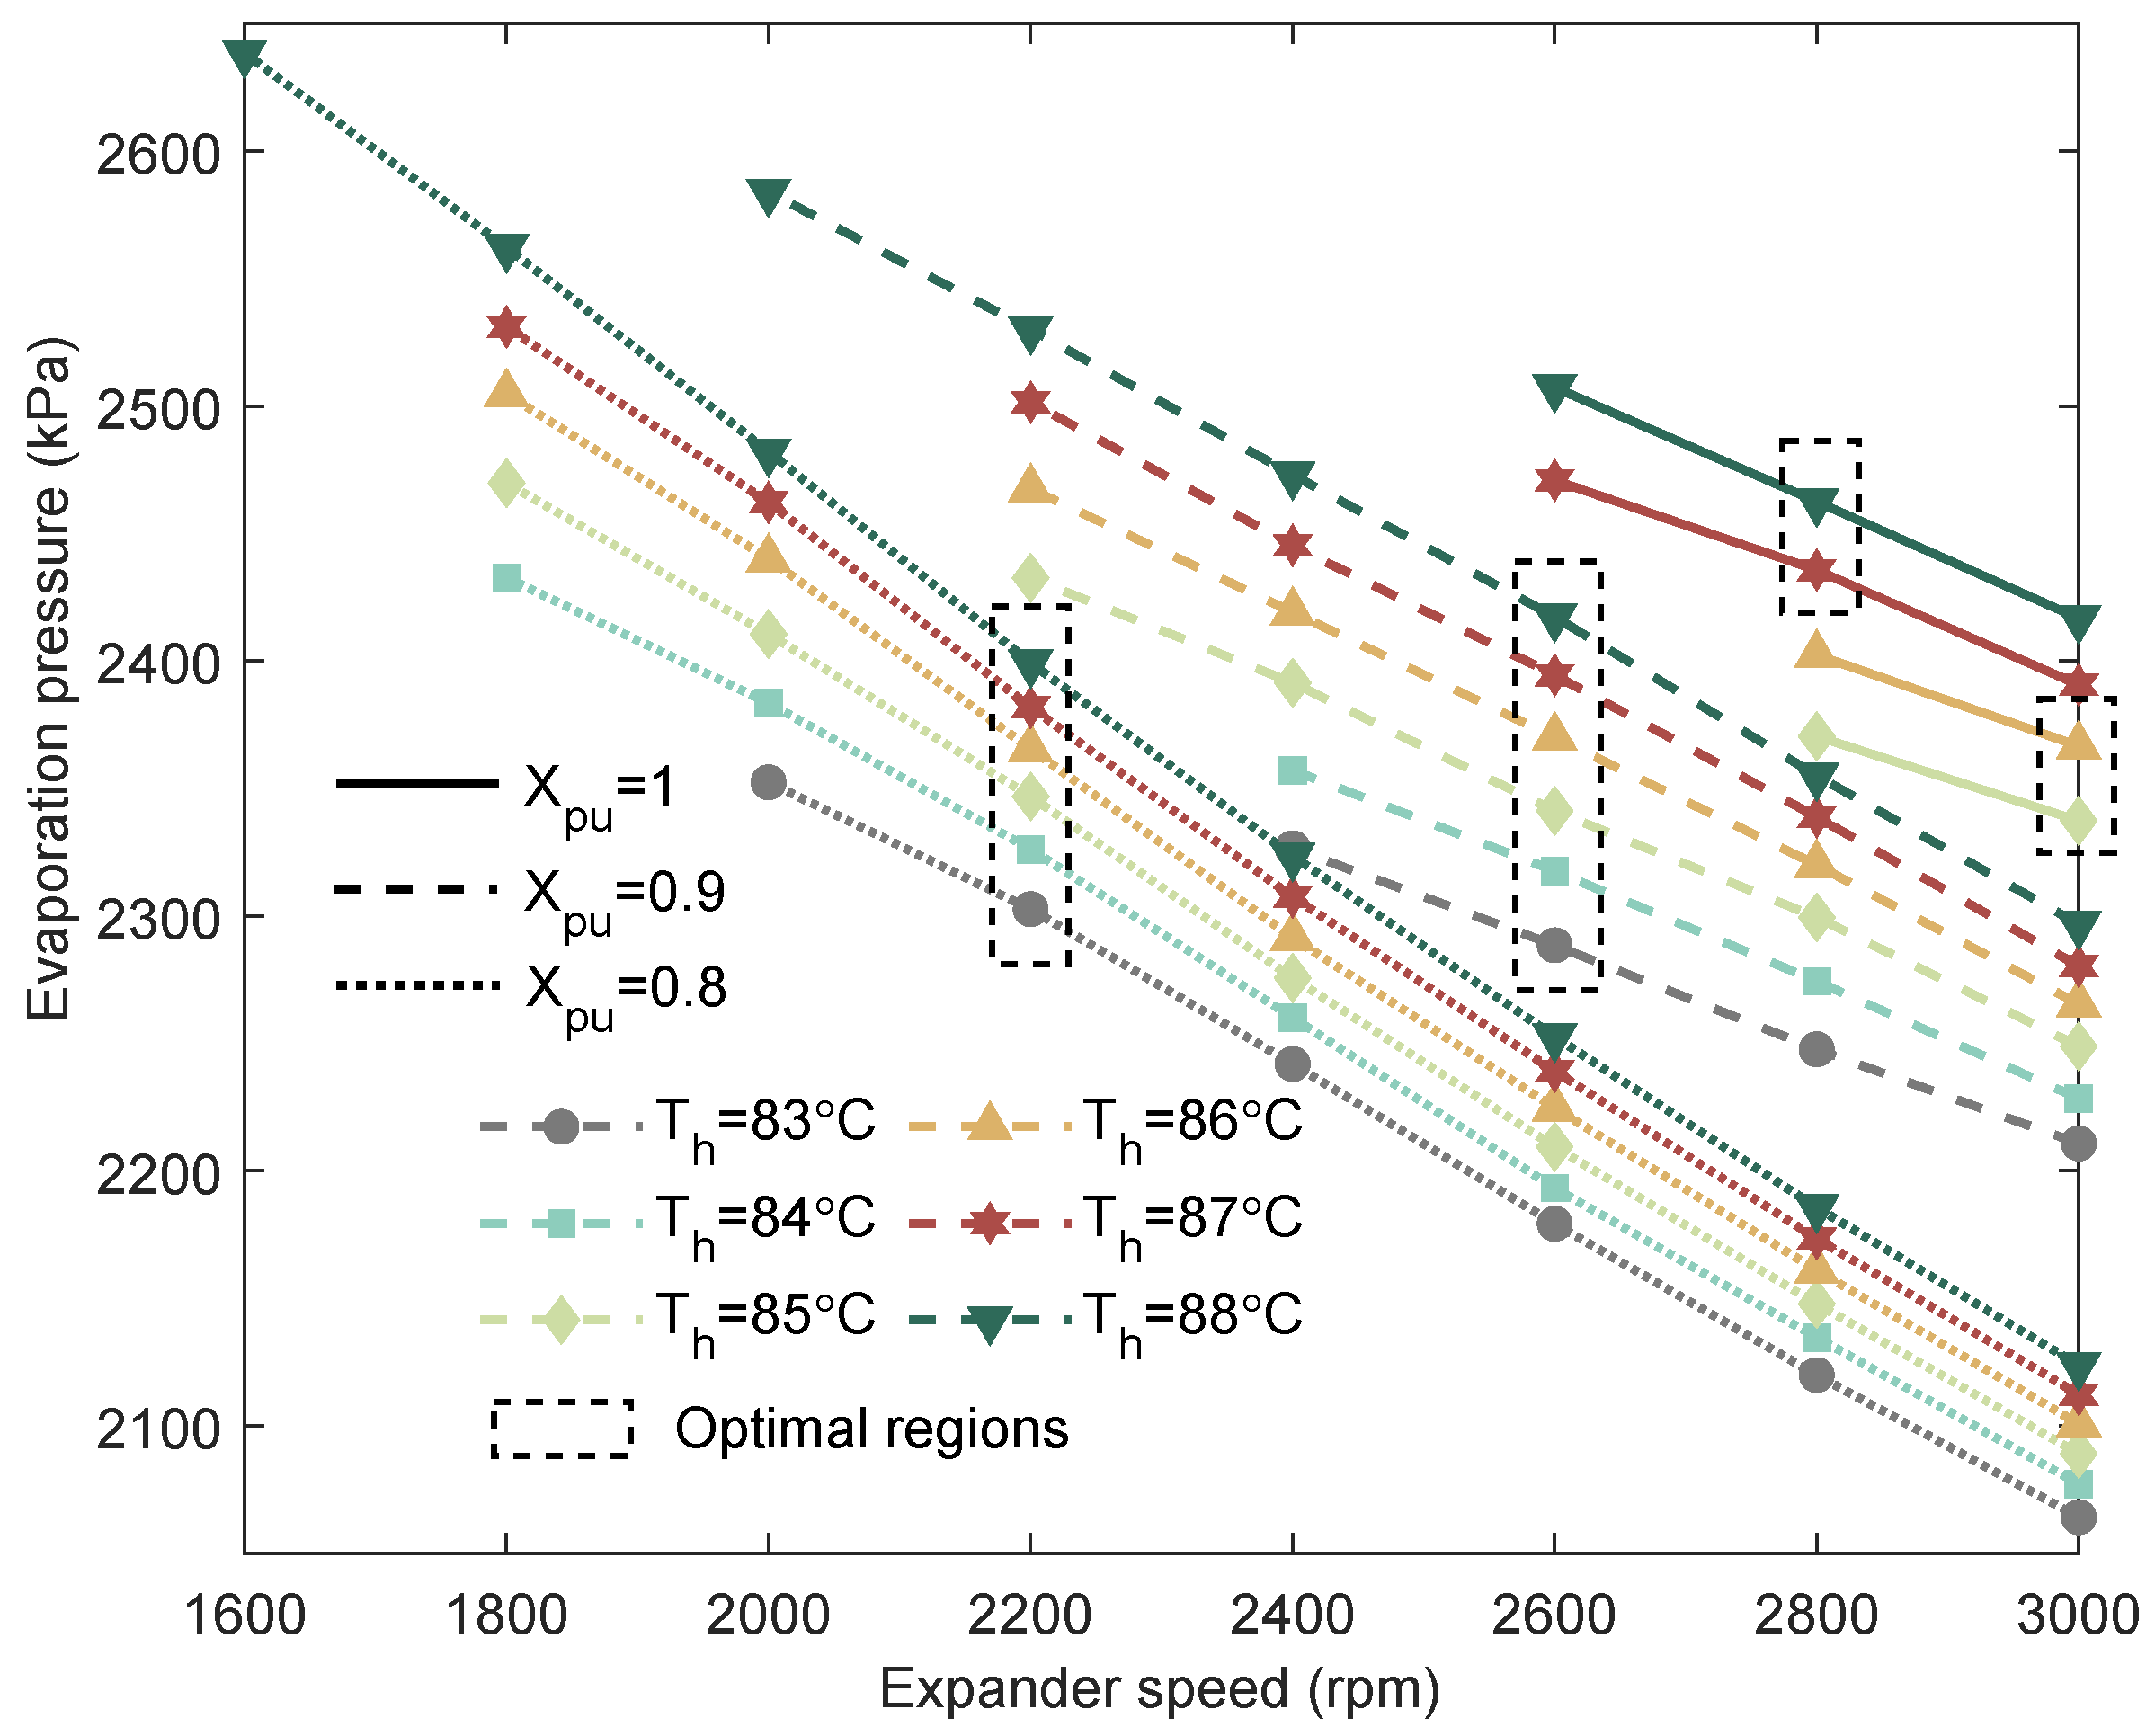
As illustrated in Figure 6, a decrease in expander rotational speed results in an increase in evaporation pressure. Similarly, a higher working fluid flow rate also leads to a rise in evaporation pressure. In the ORC power generation system, the evaporation pressure is influenced not only by the flow rate but also by the heat source temperature and expander rotational speed. Among these factors, the working fluid flow rate exerts a greater influence than the heat source temperature. When combined with the power output characteristics shown in Figure 5, it becomes evident that an optimal evaporation pressure exists across different heat source temperatures. This optimal condition can be achieved through coordinated adjustments of the pump and expander rotational speeds.
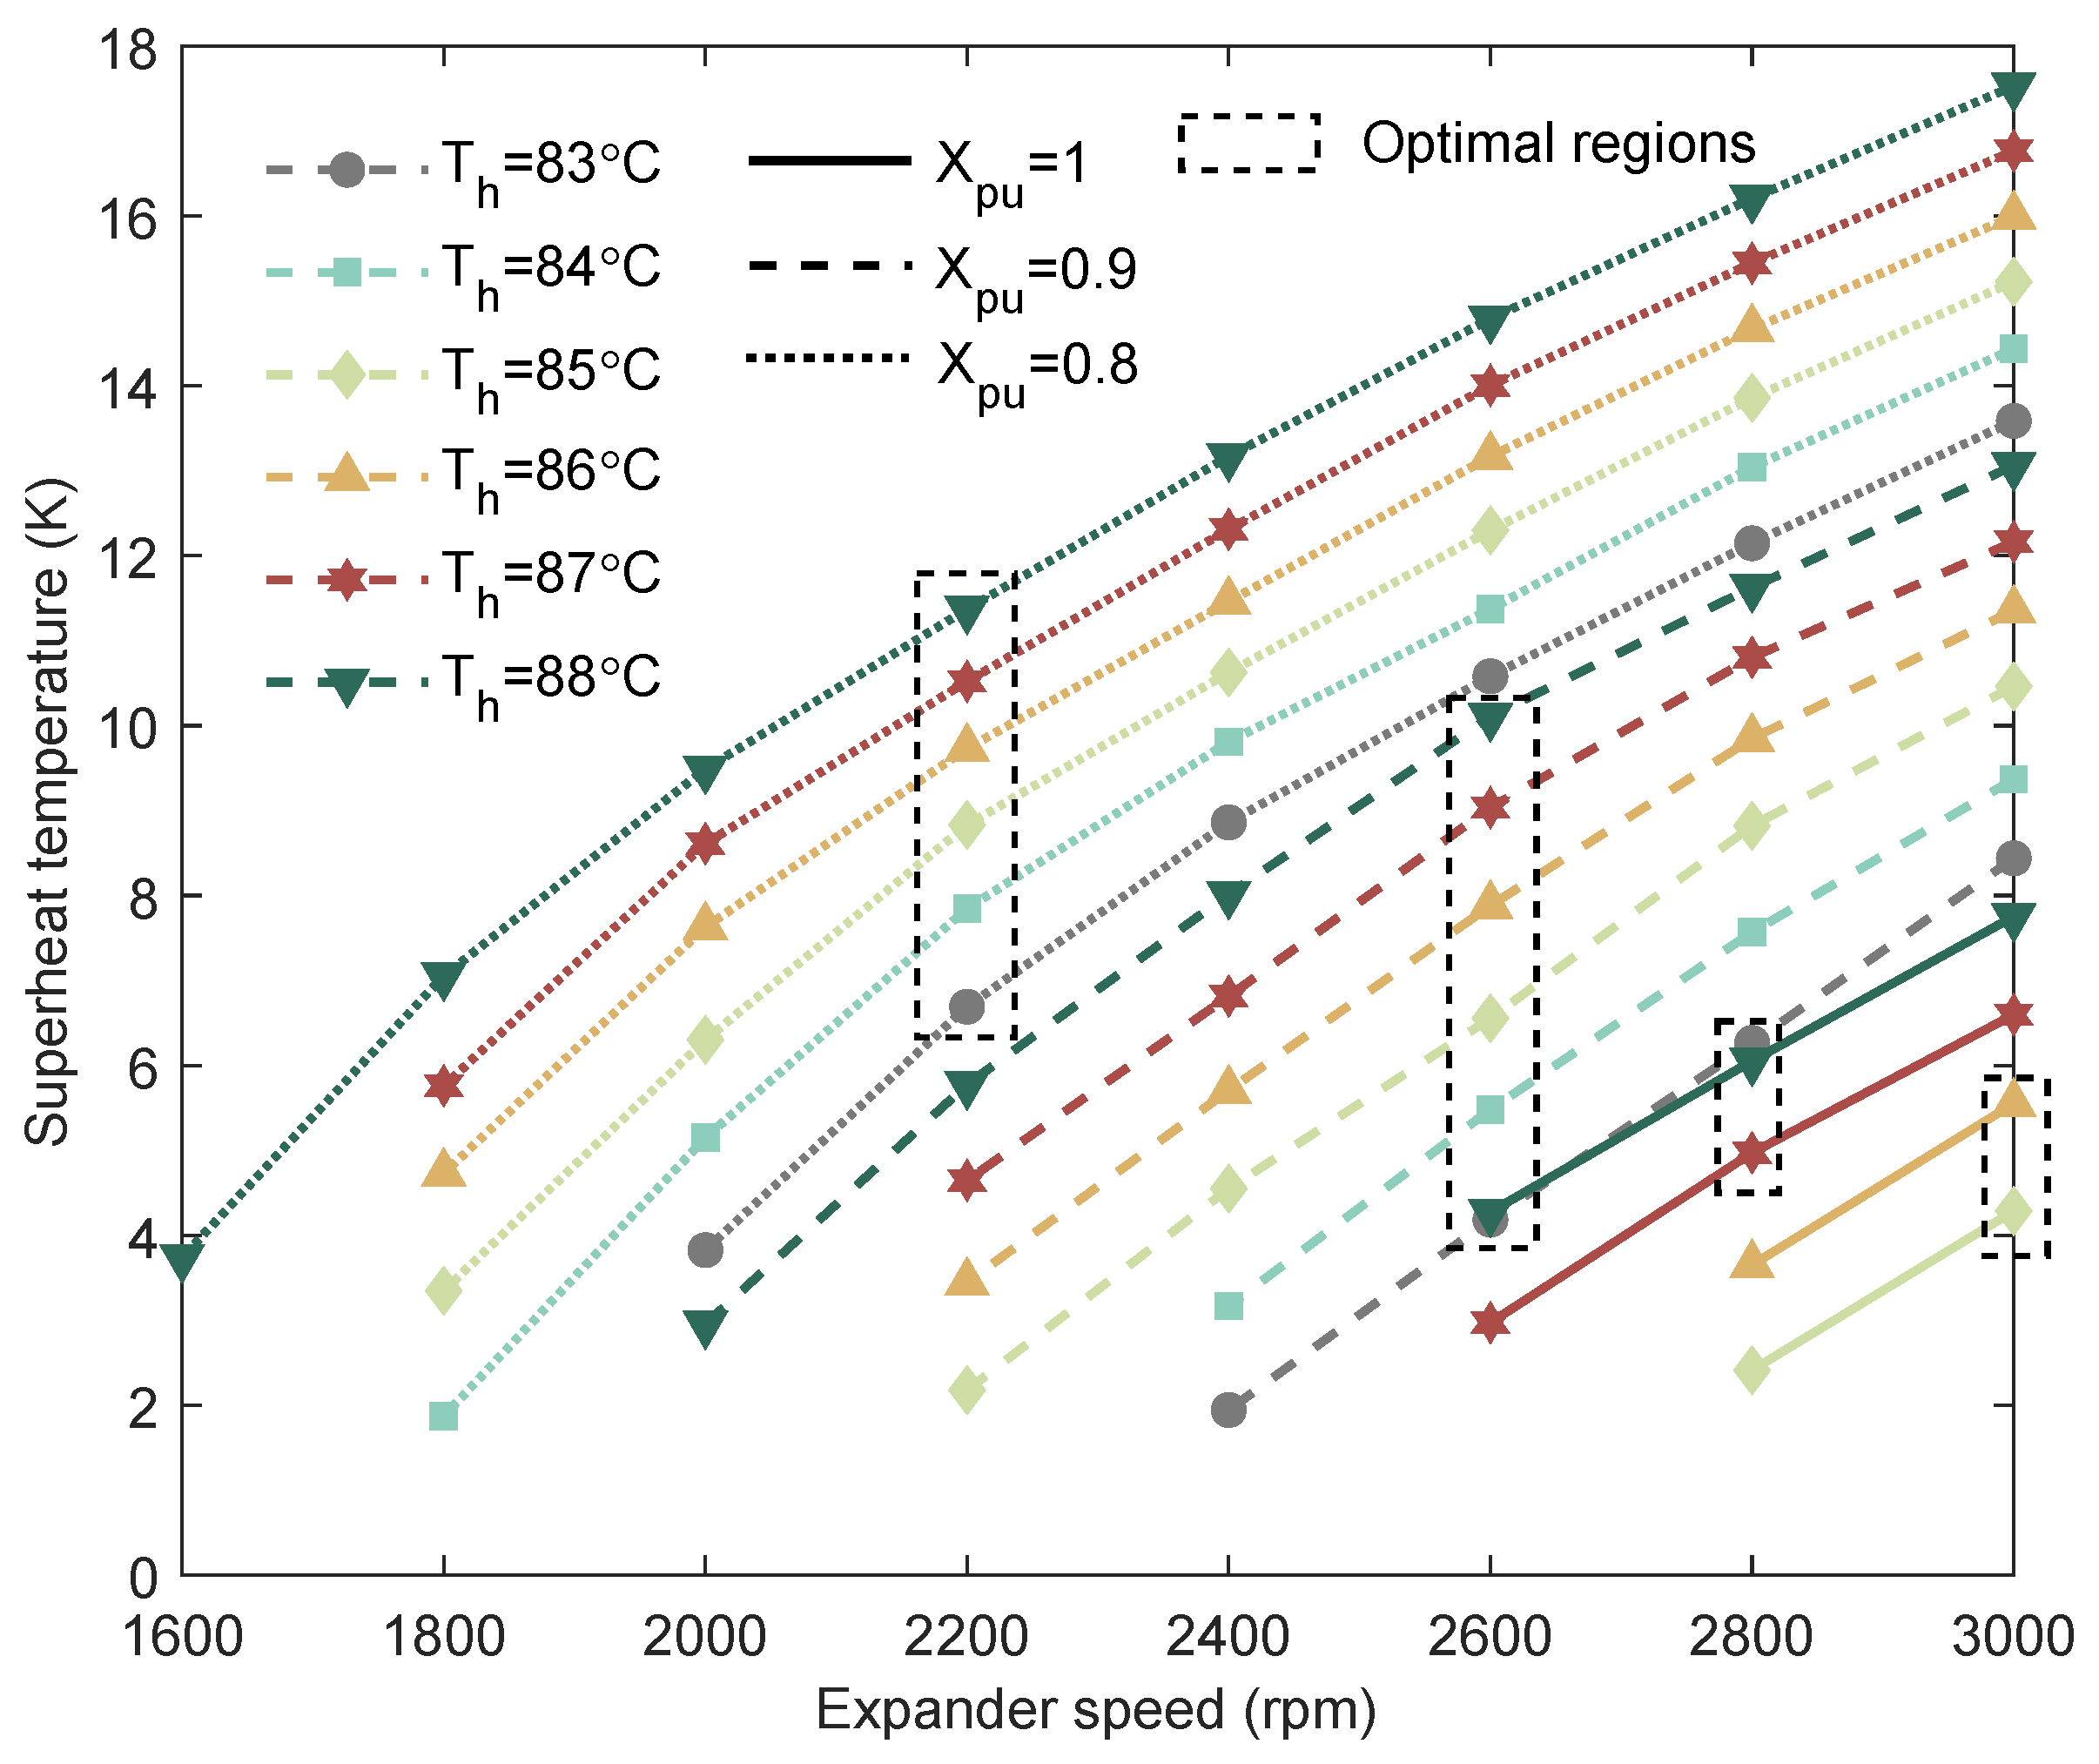
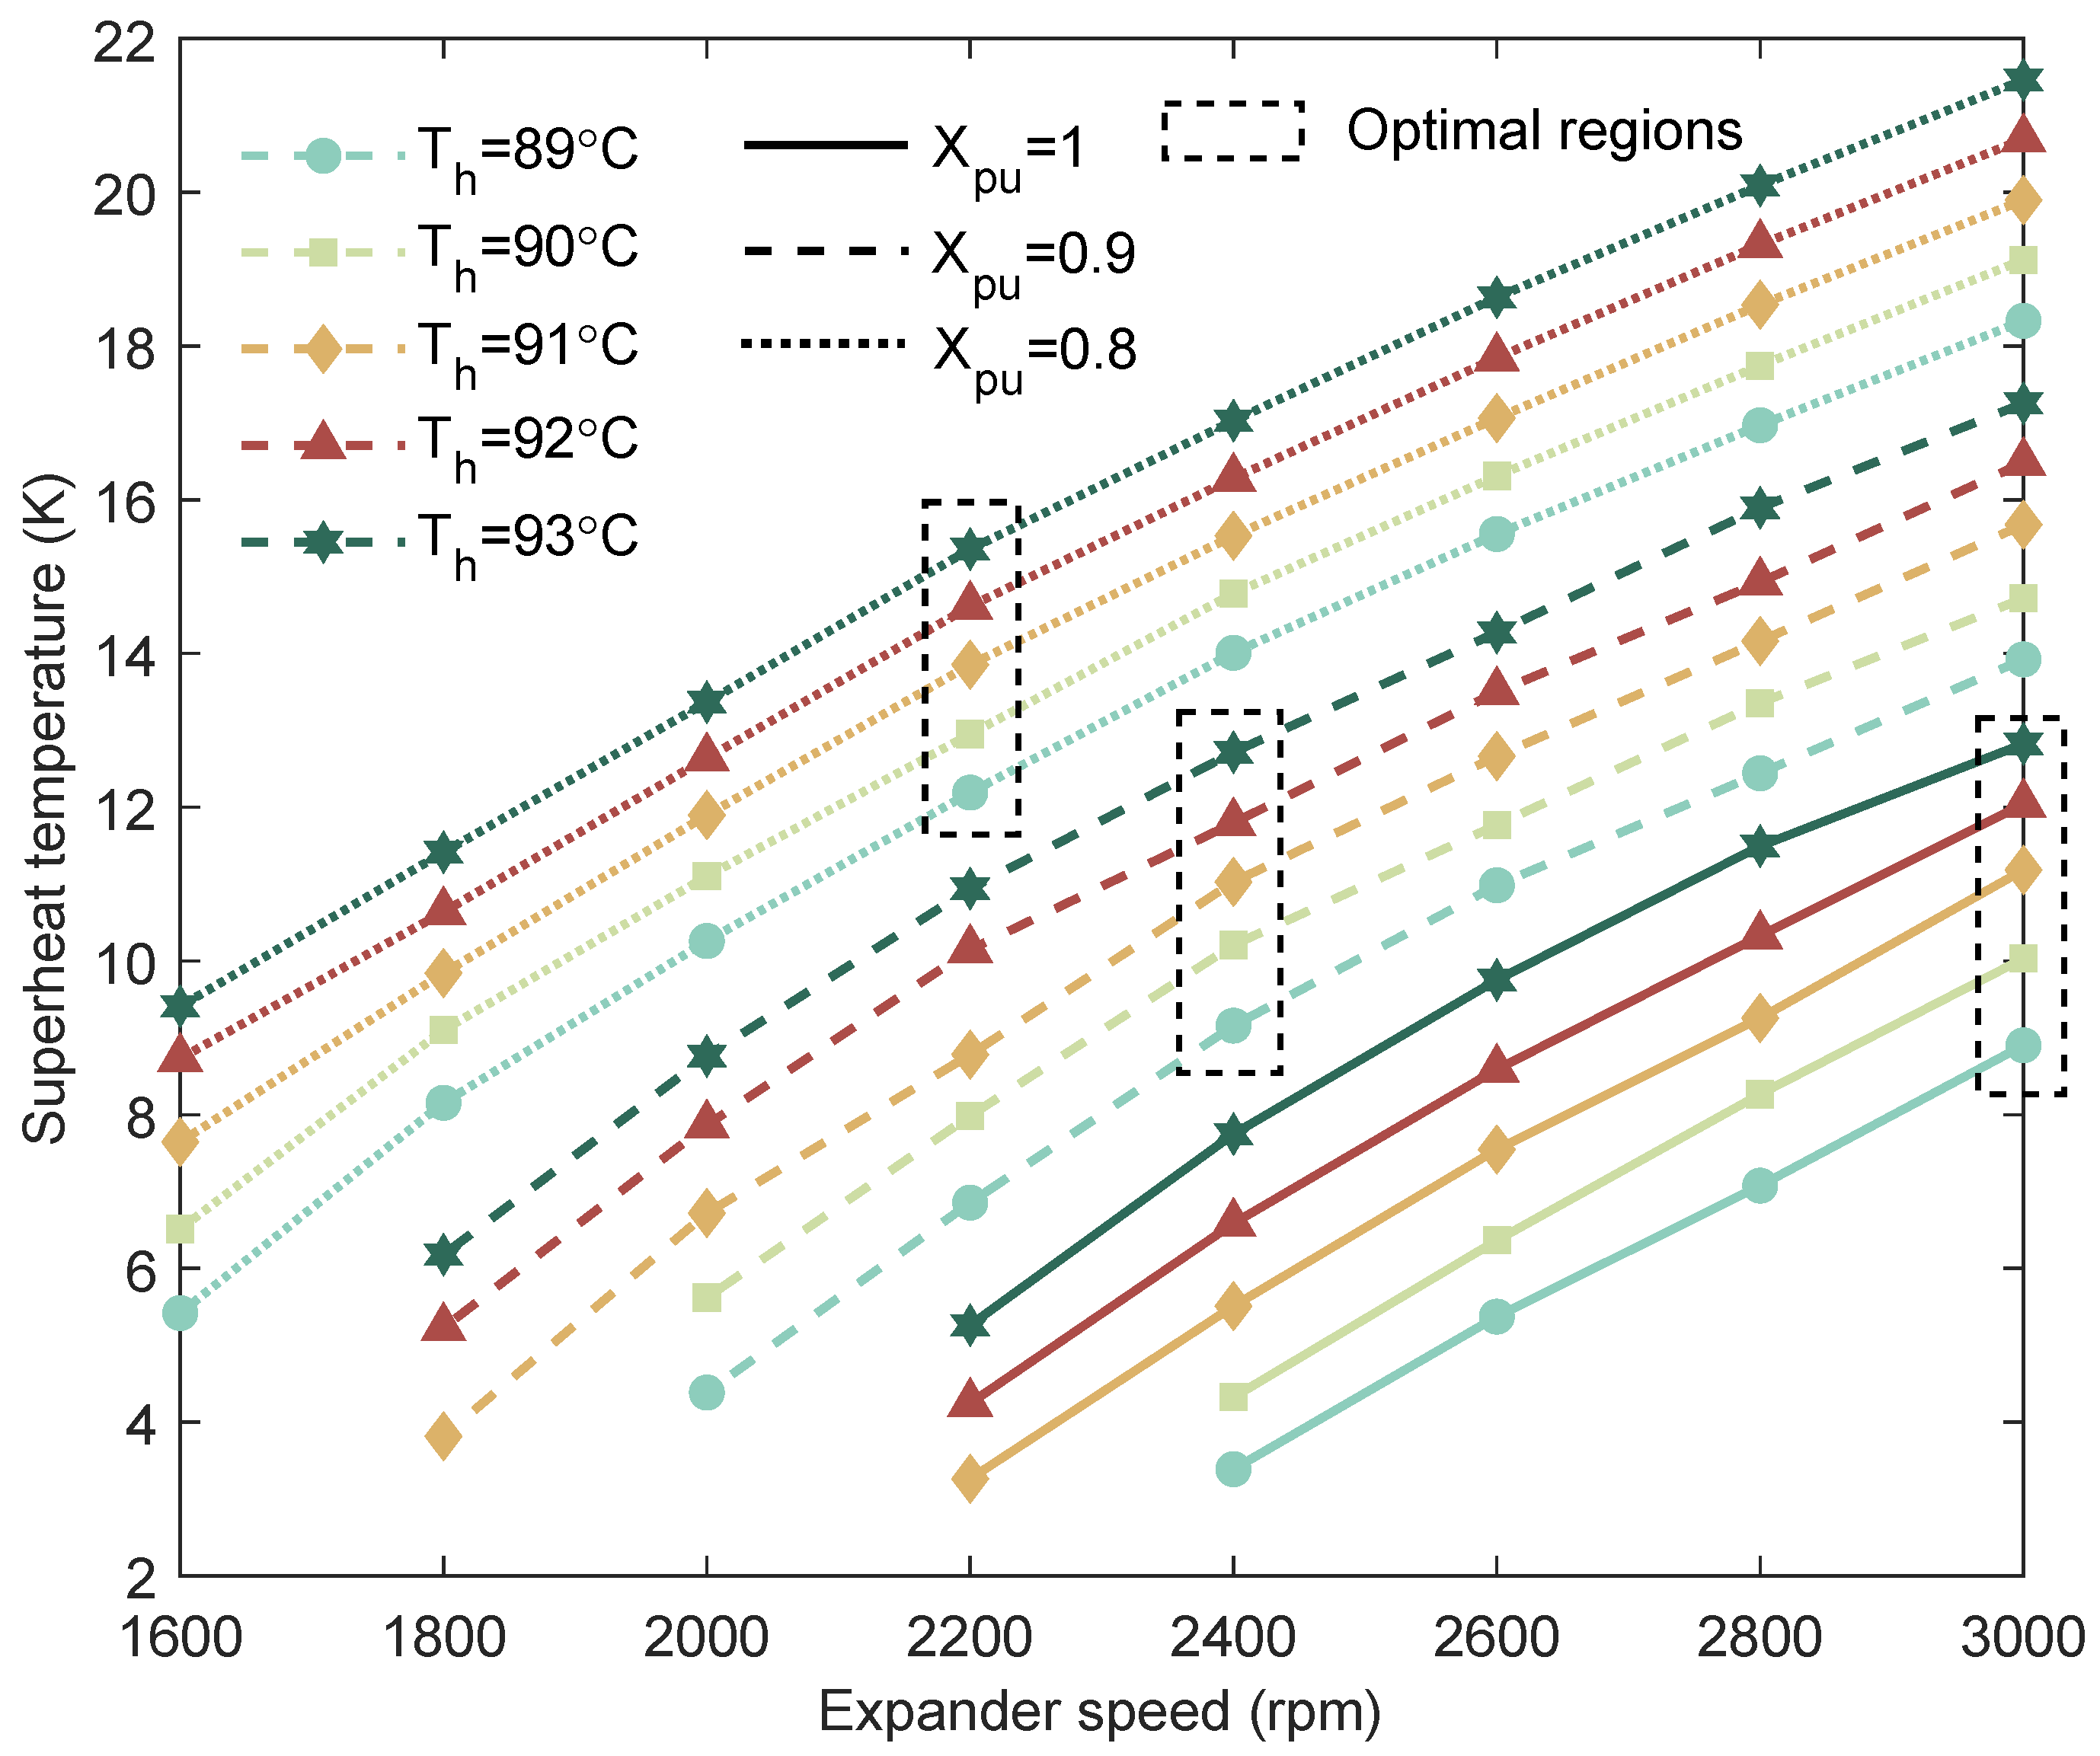
From Figure 7, it can be observed that the degree of superheat is strongly influenced by various parameters. As the rotational speed decreases, the superheat degree also declines. This occurs because a lower rotational speed reduces the m ˙ r at the expander inlet, which elevates the evaporation pressure and consequently diminishes the superheat. Similarly, increasing m ˙ r also reduces the superheat degree, whereas higher heat source temperatures enhance it. Integrating these observations with the results in Figure 5, it is evident that an optimal superheat degree exists that maximizes the system power output. Notably, while the minimum superheat temperature (MST) control strategy ensures safe operation, it yields suboptimal power output and fails to achieve the global optimum across different heat source temperatures.
Next, the system characteristics are analyzed under conditions where the heat source temperature exceeds the rated operating value.
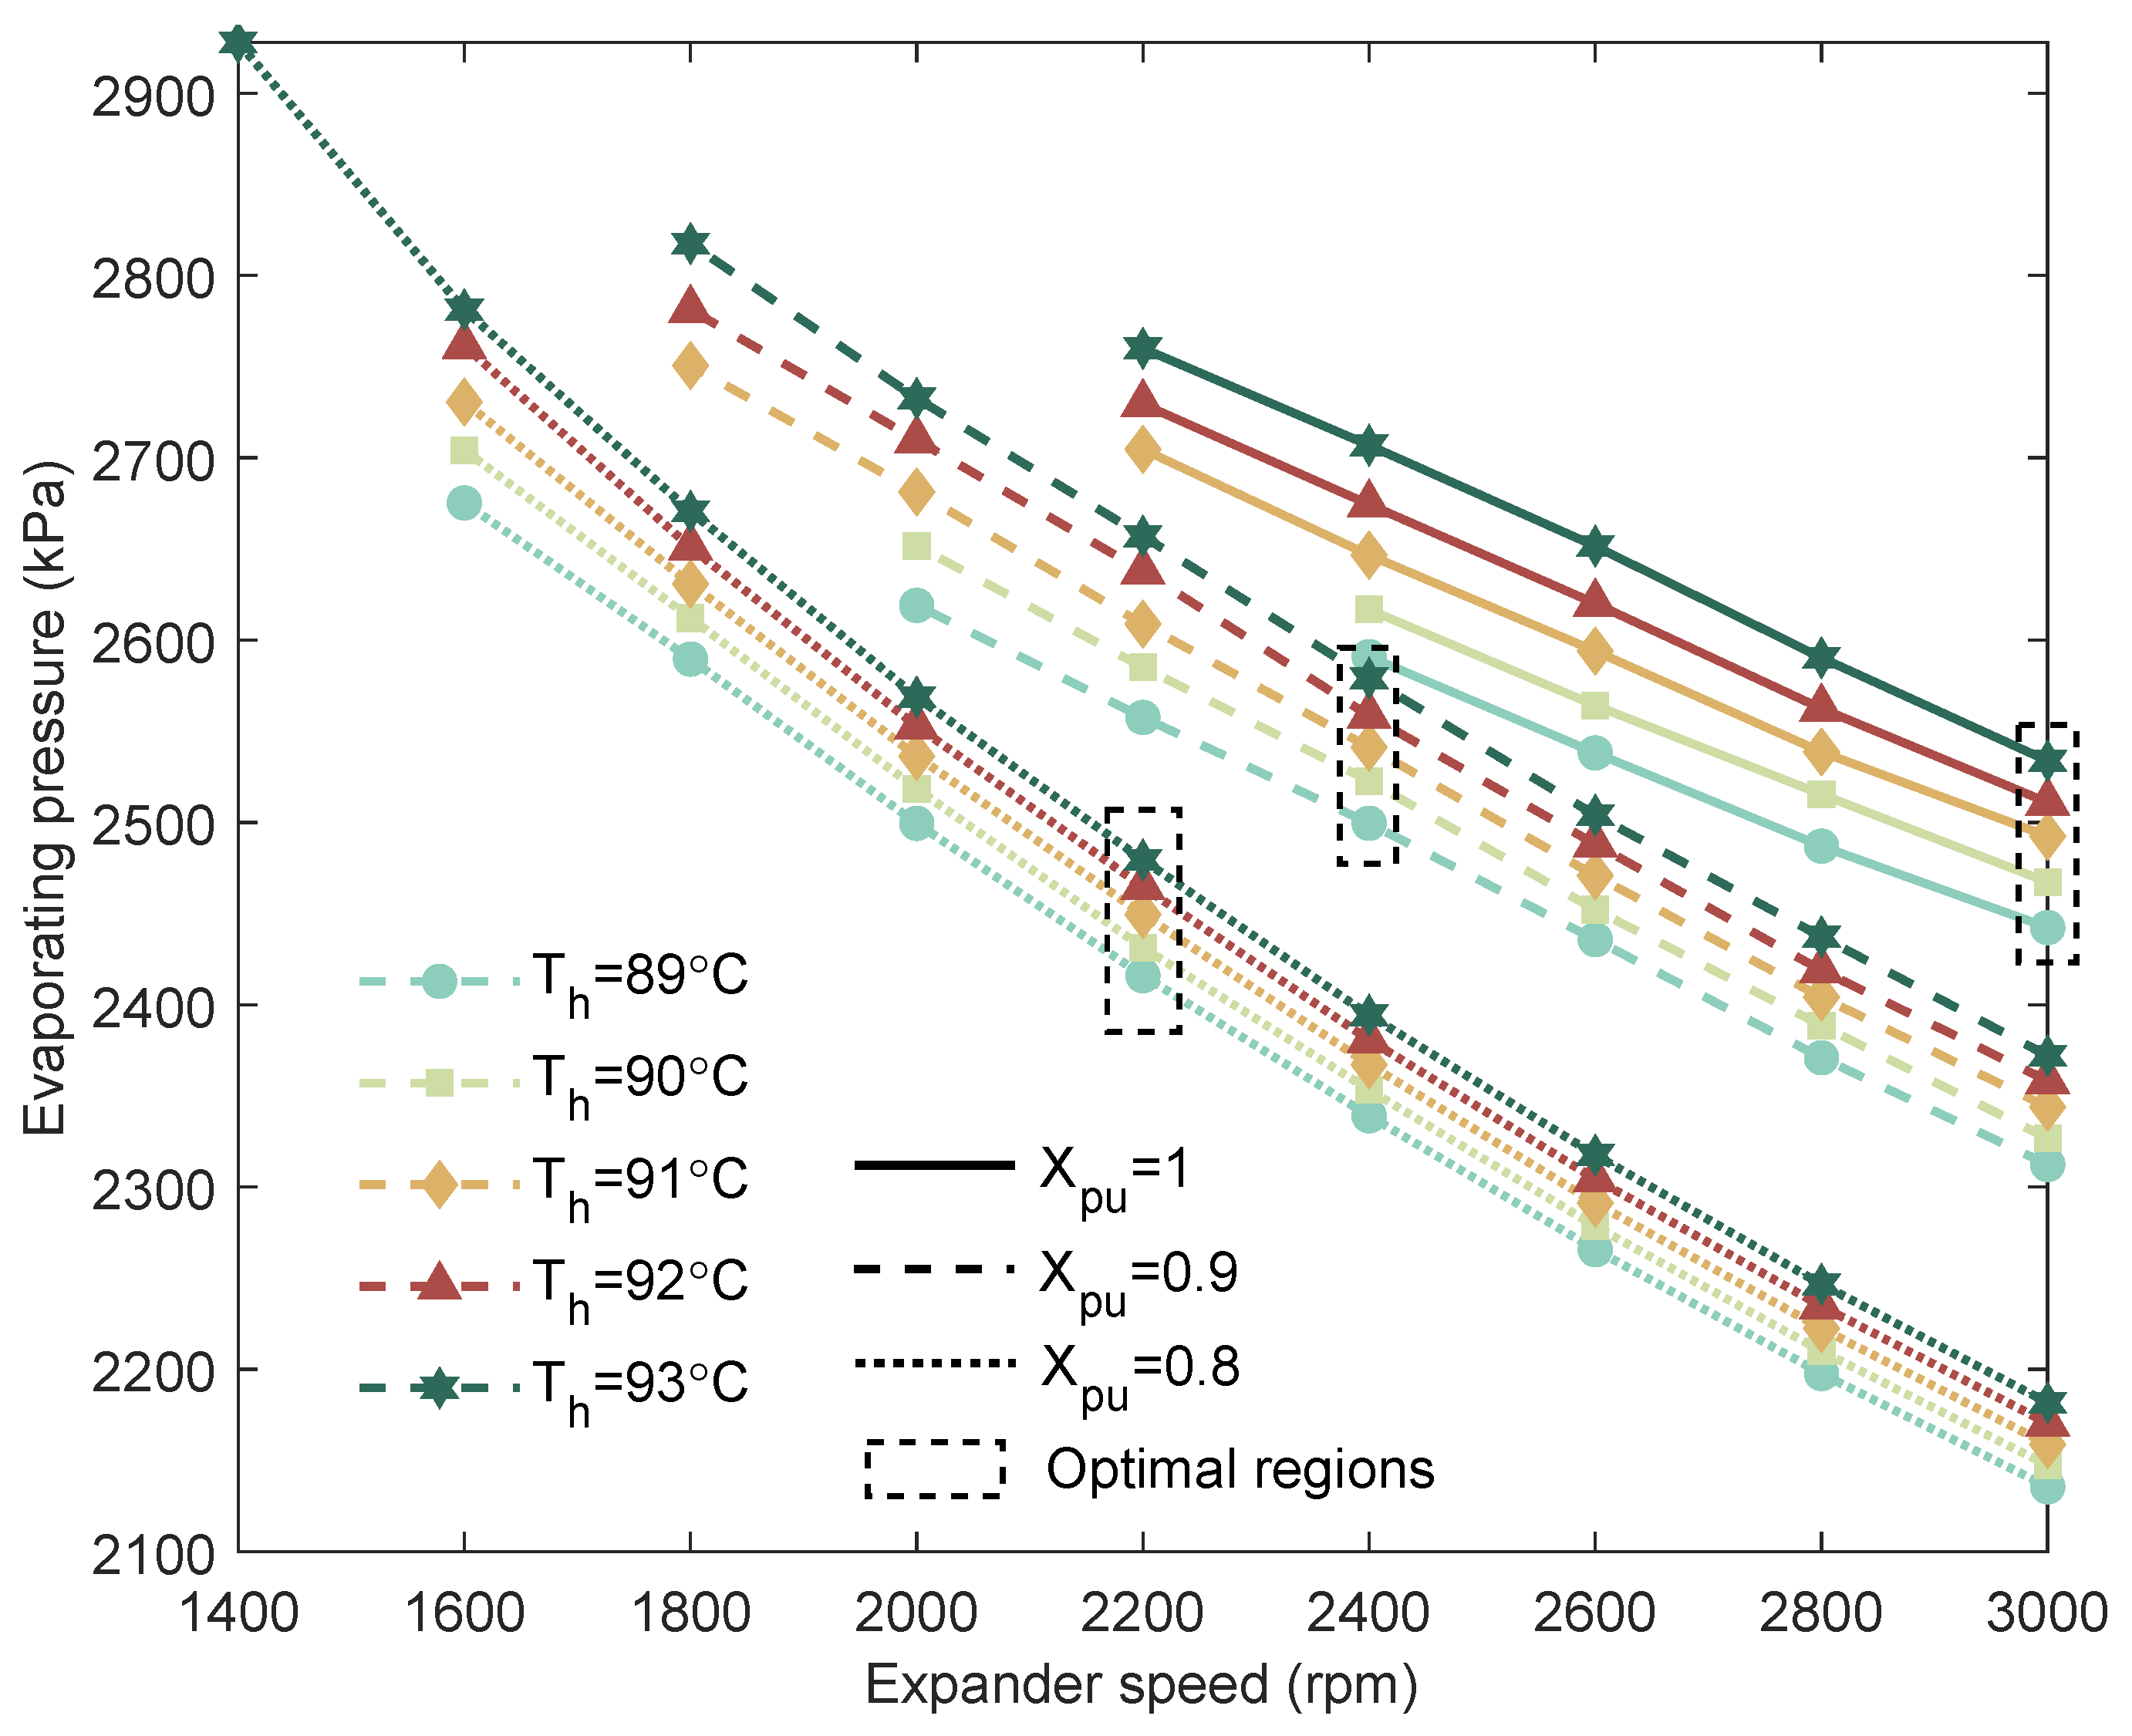
As can be observed in Figure 8, Figure 9 and Figure 10 below, the relevant characteristics are highly similar to both the system characteristics of the ORC system and those under the condition where the heat source temperature is below the rated operating point.
By integrating these observations with the power output characteristics in Figure 5, it becomes clear that an optimal superheat degree exists that maximizes the system’s power output. Notably, although the minimum superheat temperature (MST) control strategy ensures reliable and safe operation, it delivers only suboptimal power performance and fails to achieve the global optimum across different heat source temperature conditions.

3.2. The Effect of Heat Sink Temperature on the ORC System

The heat sink temperature exerts a non-negligible influence on the thermodynamic performance of the ORC system. Therefore, its effect must be considered in the design of the MPPT strategy. Owing to the relatively narrow operating range of the heat sink, the optimal evaporation pressure and superheat degree are investigated within a temperature range of 18 ∼ 20 C . Simulation results show that variations in heat sink temperature have only a marginal effect on evaporation pressure. Accordingly, the effect of expander rotational speed on evaporation pressure is not analyzed in this study.
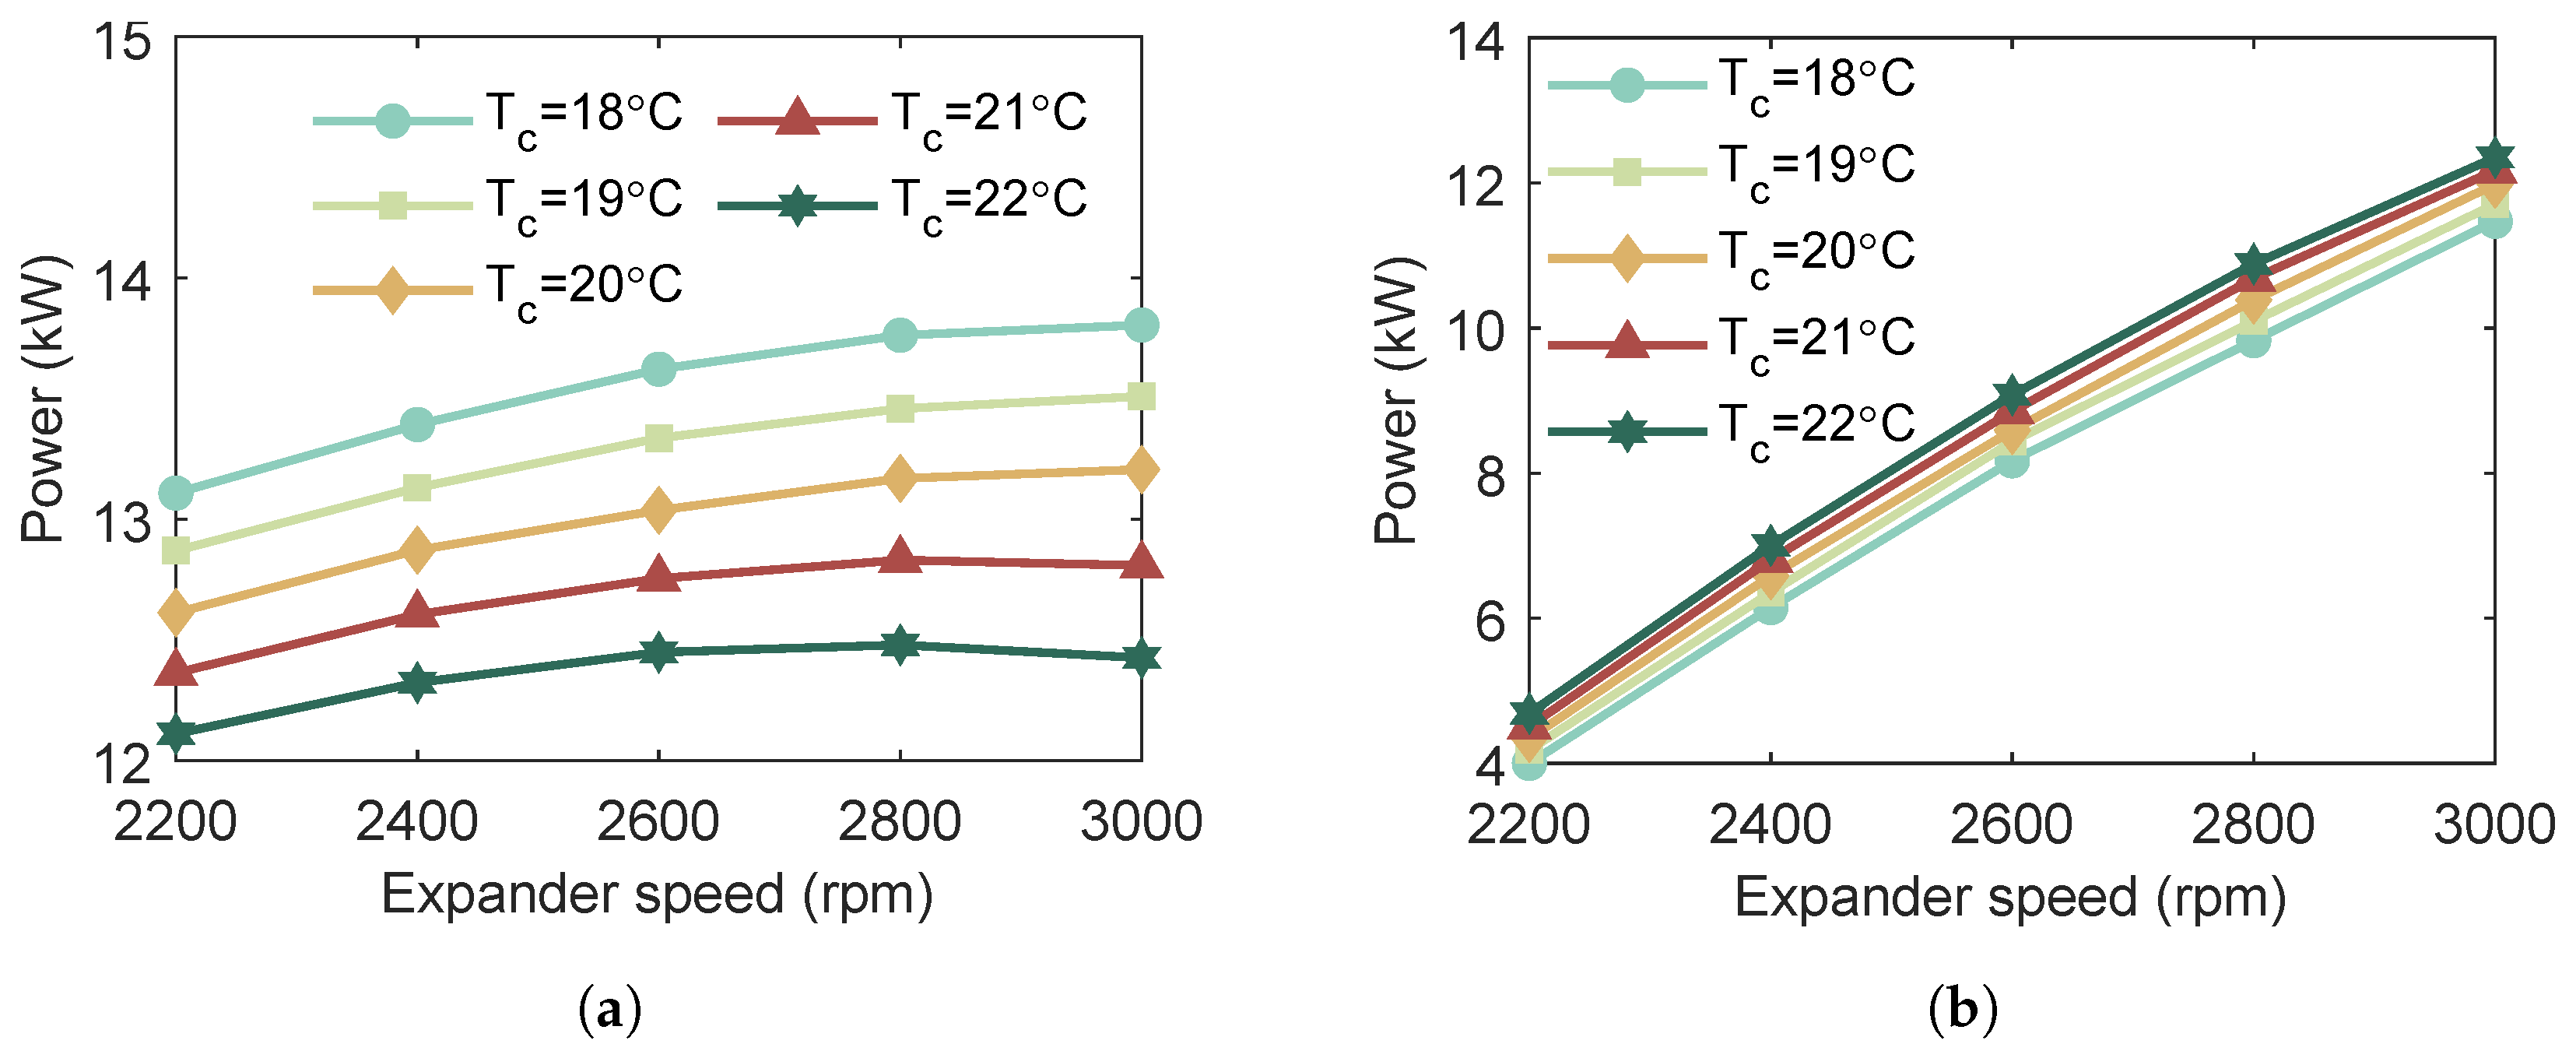
Figure 11 illustrates the influence of expander rotational speed on the system’s output power and superheat degree under different cooling water inlet temperatures. As shown, an increase in cooling water inlet temperature results in reduced output power and an elevated superheat degree. This finding indicates that, under conditions of fixed expander rotational speed, a near-linear relationship exists between the superheat degree and output power. Accordingly, the ORC system exhibits an optimal superheat degree at which maximum power output can be achieved.
By comparing Figure 11 with Figure 12, it is observed that an increase in heat source temperature causes the optimal expander rotational speed to shift downward, while the optimal superheat degree remains essentially constant.
A comparative analysis of Figure 12 and Figure 13 reveals that an increase in heat source temperature leads to an overall rise in the superheat degree. This occurs because higher heat source temperatures elevate the evaporating pressure, which in turn inevitably increases the superheat degree. In addition, this phenomenon is closely associated with expander efficiency. Both the pressure level and the thermodynamic state of the working fluid influence expander performance. A higher superheat degree allows the fluid to deliver more energy to the expander, thereby enabling greater mechanical energy output during the expansion process.
By comparing Figure 13 and Figure 14, it is observed that the optimal superheat degree decreases slightly. Moreover, when both the heat source and sink temperatures increase, the expander rotational speed corresponding to the optimal superheat degree varies within a certain range. This behavior arises from a fundamental characteristic of expanders: peak isentropic efficiency is achieved only within a specific range of rotational speeds.
Therefore, based on the above analysis of the system characteristics, the following conclusions can be drawn:
  • Adjusting a single parameter—either the evaporating pressure or the superheat degree—cannot enable the ORC system to achieve maximum power output;
  • The MST strategy primarily ensures safe system operation and facilitates control rather than improving power output;
  • The optimal evaporating pressure lies within a specific range, and further increases in pressure do not necessarily yield higher power output;
  • The optimal superheat degree also falls within a defined range, and further reductions in superheat do not lead to increased power output.

3.3. An Mppt Strategy Based on Optimal Evaporation Pressure and Superheat Degree

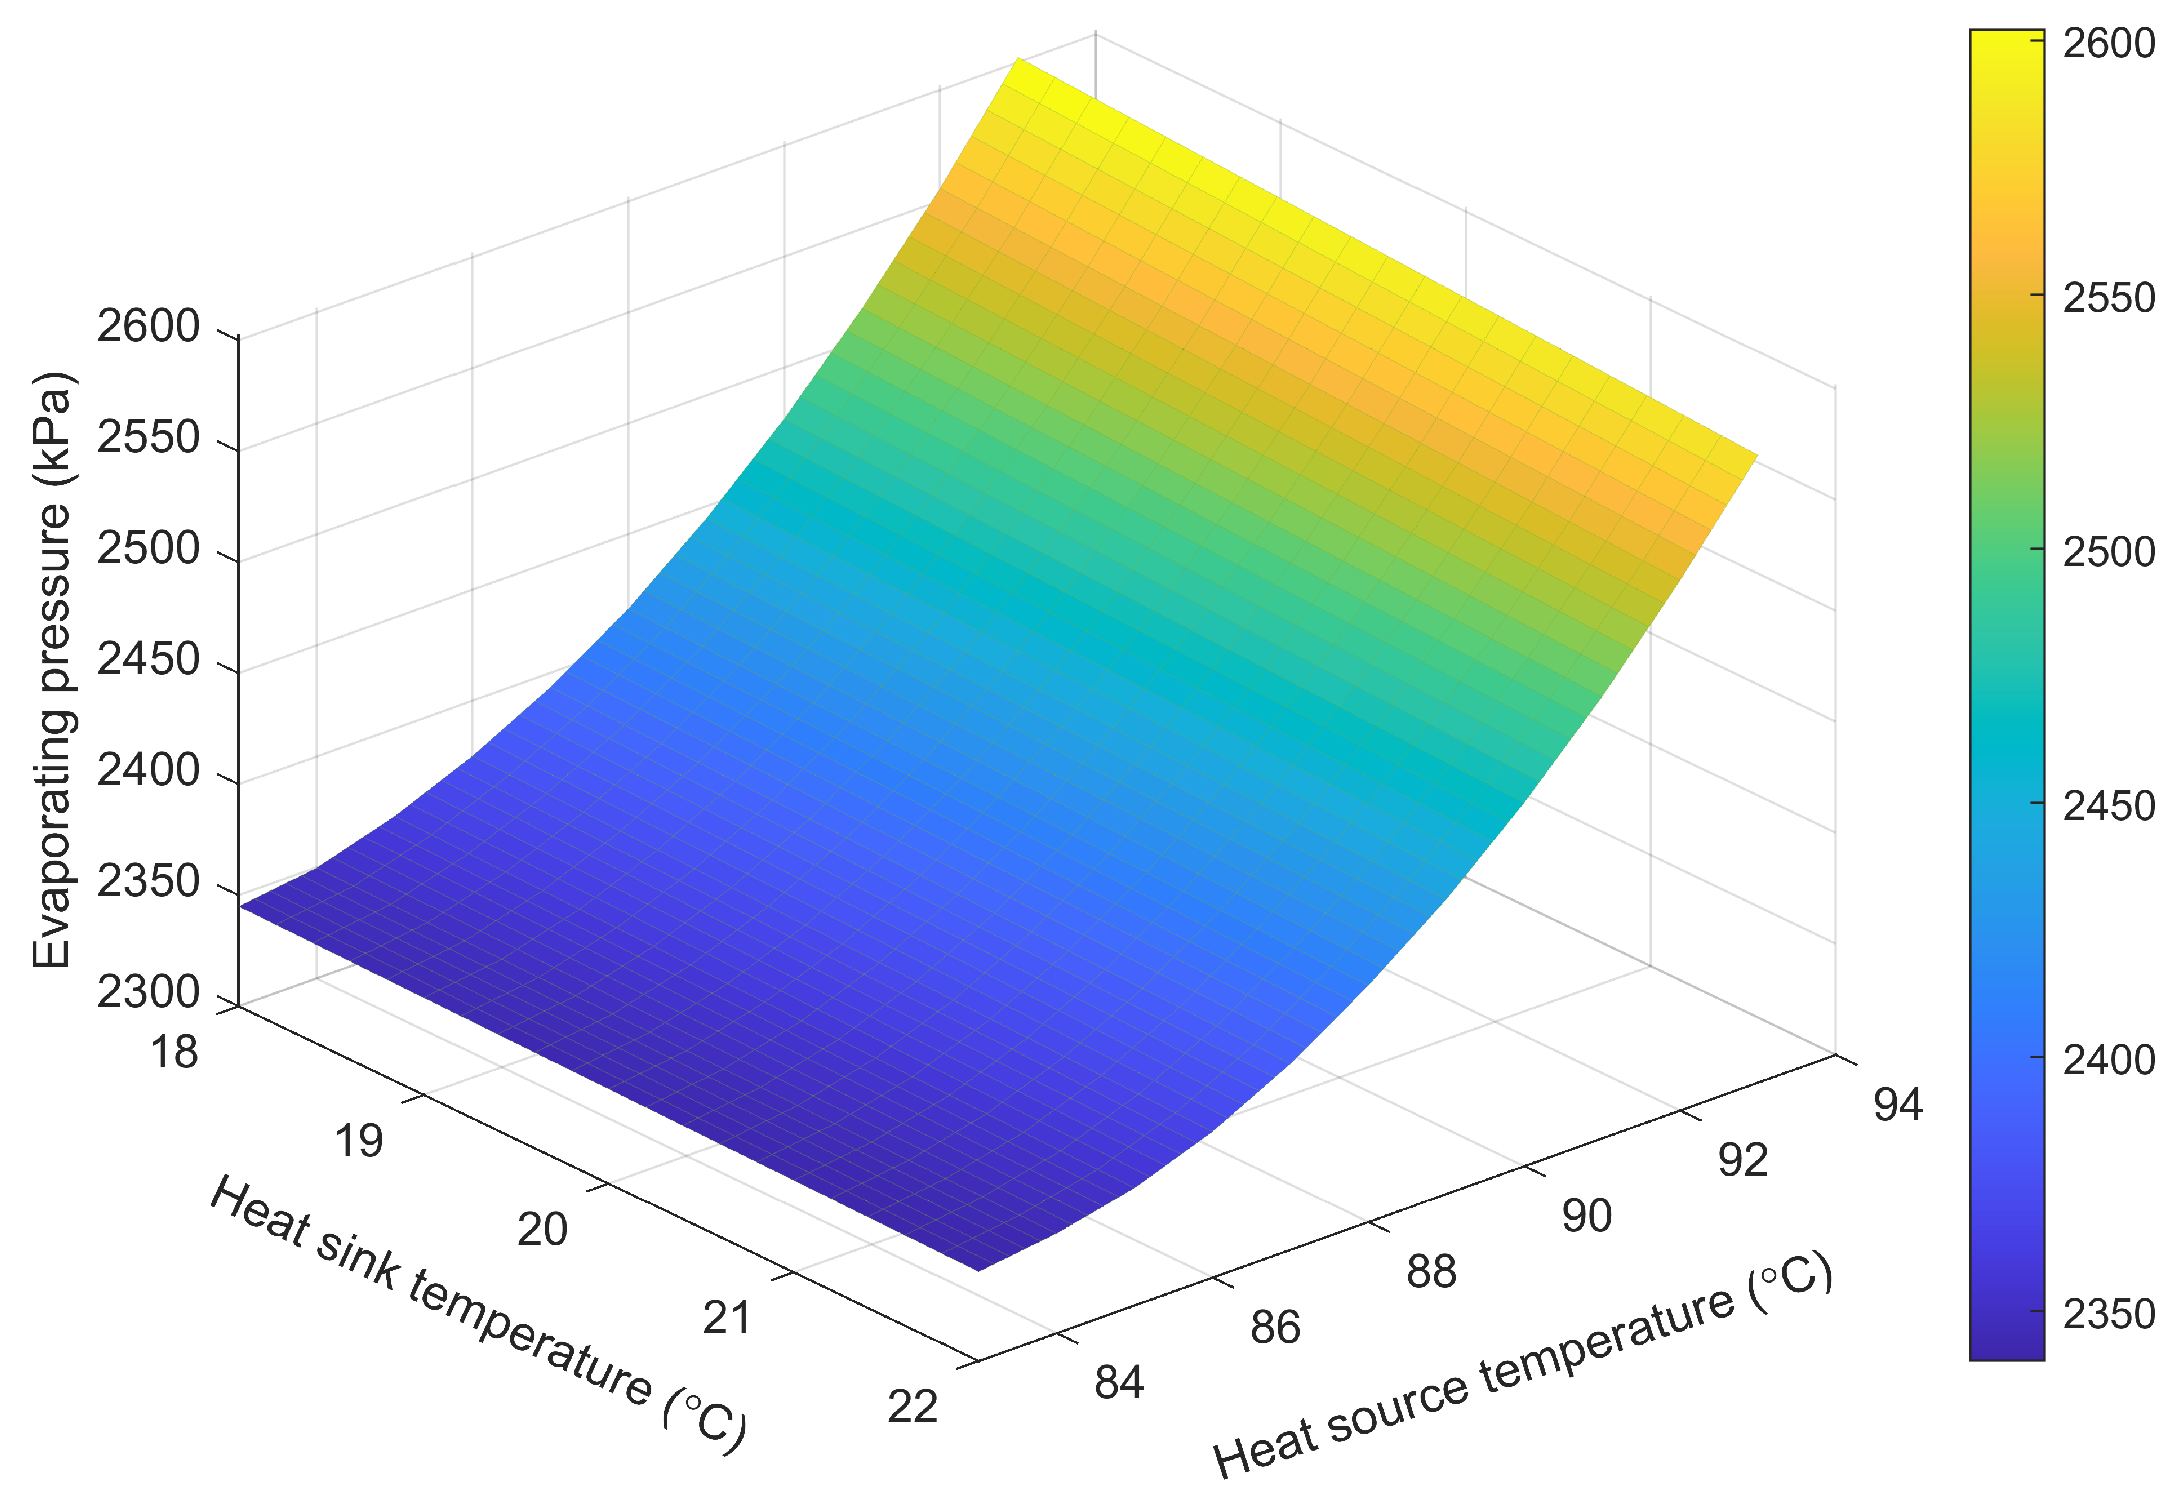
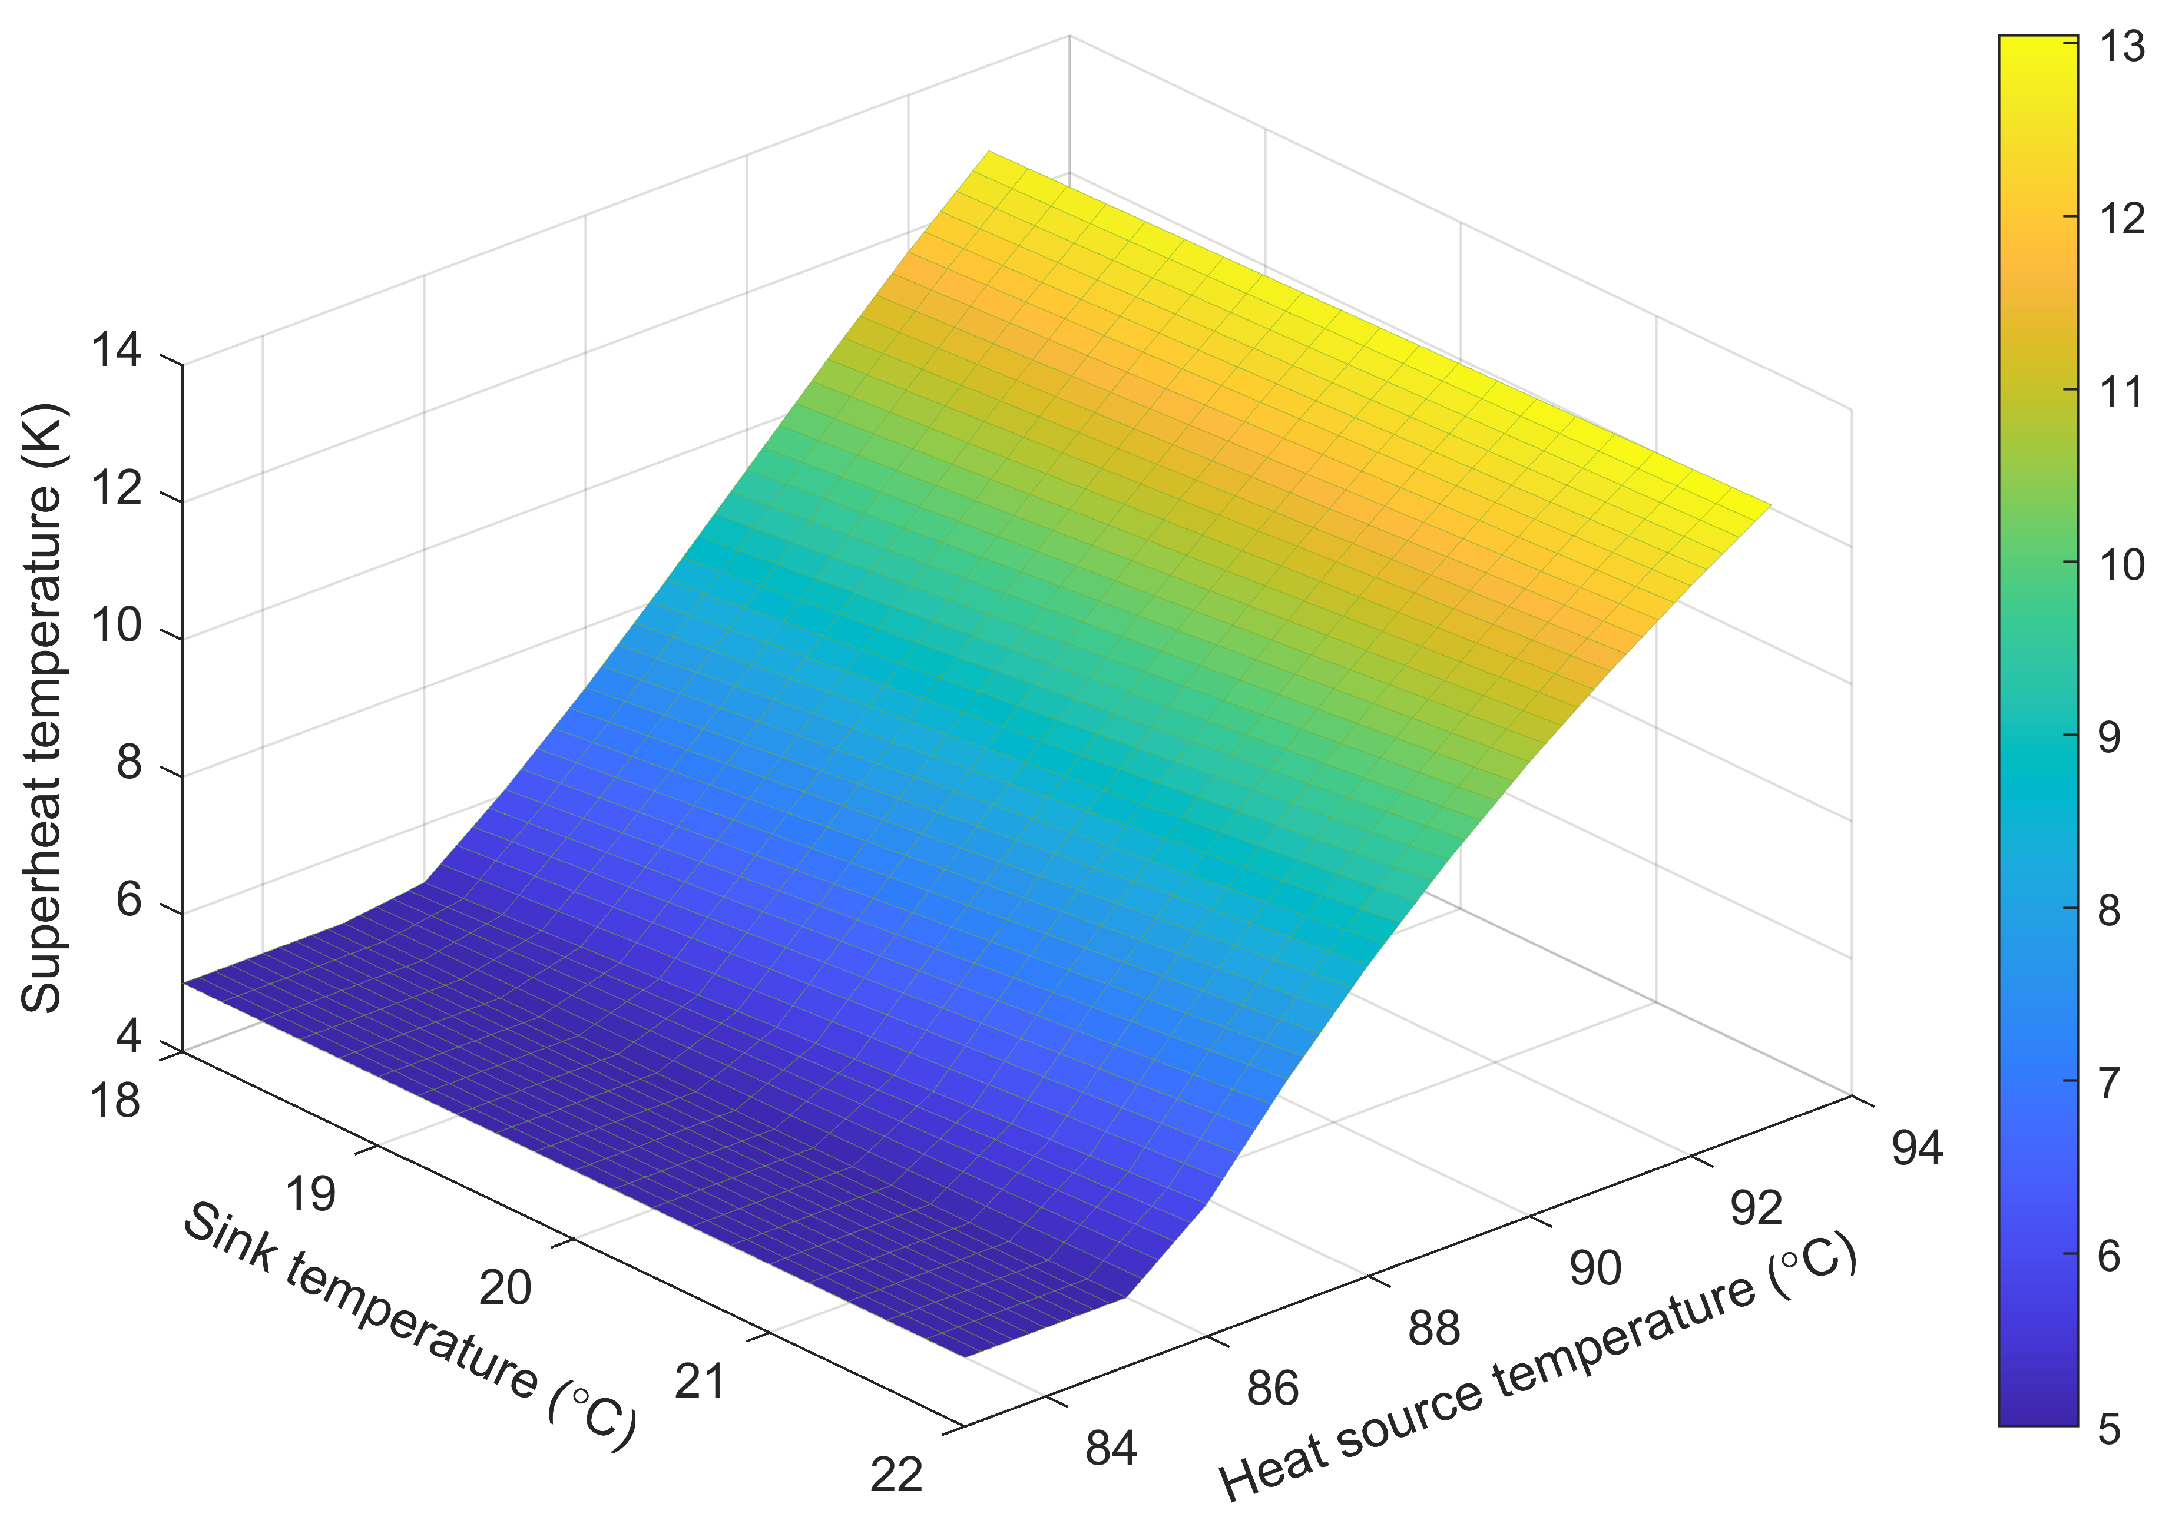
At present, Maximum Power Point Tracking (MPPT) strategies applied to Organic Rankine Cycle (ORC) systems are primarily classified into two types: the Minimal Superheat Temperature (MST) strategy and the Optimal Evaporation Temperature (OET) strategy. The MST strategy maintains the superheat at the outlet of the evaporator in the ORC system at a minimum value. However, as analyzed in Section 3.1, under high heat-source temperatures, adjusting only the superheat degree is insufficient for the system to achieve maximum output power. In contrast, the OET strategy ensures that the ORC system operates at the optimal evaporation temperature. Nevertheless, the analysis also reveals that when the heat-source temperature is relatively low, this strategy fails to maintain the system at the optimal evaporation temperature. Based on the preceding analysis, it is evident that the ORC system achieves maximum power output at optimal values of evaporation pressure and superheat degree, which vary with the sink and heat source temperatures. Accordingly, this study proposes a novel Maximum Power Point Tracking (MPPT) strategy that leverages both optimal evaporation pressure and superheat degree. The proposed methodology constructs characteristic maps that correlate the optimal evaporation pressure and superheat degree with different combinations of heat source and sink temperatures, as illustrated in Figure 15 and Figure 16.
Figure 15 and Figure 16 illustrate the optimal evaporation pressure and superheat degree under different heat-source and heat-sink temperatures. The data corresponding to the rated operating condition were obtained from experimental measurements, while those for off-design conditions were derived from simulations.
The ORC control system consists of an MPPT control strategy module and an MPC controller. Specifically, the MPPT strategy acquires the temperatures of the heat source and sink and outputs the optimal evaporation pressure and superheat degree as reference values for the MPC controller. Based on these reference values, the MPC controller regulates the rotational speeds of the expander and working fluid pump to control the evaporation pressure and superheat degree of the ORC system. When the MPC controller increases the speed of the working fluid pump, the mass flow rate of the working fluid rises, which elevates the system’s evaporation pressure but reduces the degree of superheat. Conversely, when the pump speed is reduced, the opposite effect occurs. Similarly, when the MPC controller increases the expander speed, the expander ingests a greater mass flow of the working fluid, leading to a decrease in both the evaporation pressure and the degree of superheat. Conversely, reducing the expander speed produces the opposite effect. The expander speed is adjusted via the rectifier, while the pump speed is governed by a motor driven through a variable frequency drive (VFD).
The proposed MPPT strategy operates in two sequential stages, as illustrated in Figure 17. First, characteristic maps of the optimal evaporation pressure and superheat degree are established, with the corresponding values at different operating conditions obtained through dynamic simulations. During real-time control, the MPPT strategy provides the optimal evaporation pressure and superheat degree as reference signals for the MPC controller. These values are retrieved from the characteristic maps via parameter look-up based on real-time operating conditions.

4. Design of Model Predictive Controller

The principle of the MPC method is to first predict the dynamic response of the system under a specific control law using a model, then solve the optimal control problem subject to given constraints, and finally apply corrections through feedback. Predictive models are employed to estimate the system response based on its current state and control inputs. In this study, a discrete-time state-space model of the ORC system is adopted for the design of the control law.
x m ( k + 1 ) = A m x m ( k ) + B m u ( k ) y ( k ) = C m x m ( k )
Equation (29) can be rewritten into an incremental form:
x ( k + 1 ) = A x ( k ) + B δ u ( k ) y ( k ) = C x ( k )
where x ( k ) = δ x m ( k ) y ( k ) , A = A 0 C A I , B = B C B , C = 0 I
From Equation (30), the future output of the system within p steps can be obtained:
y ( k + 1 k ) = C A x ( k ) + C B δ u ( k k ) y ( k + 2 k ) = C A 2 x ( k ) + C A B δ u ( k k ) + C B δ u ( k + 1 k ) y ( k + 3 k ) = C A 3 x ( k ) + C A 2 B δ u ( k k ) + C A B δ u ( k + 1 k ) + C B δ u ( k + 2 k ) y ( k + N p k ) = C A N p x ( k ) + C A N p 1 B δ u ( k k ) + C A N p 2 B δ u ( k + 1 k ) + + C A N p N c B δ u ( k + N c 1 k )
If we define
δ U = δ u k T δ u k + 1 T δ u k + N c 1 T T Y = y k + 1 k T y k + 2 k T y k + 3 k T y k + N p k T T
then Equation (31) can be written as
Y = F x k + Φ δ U
where
F = C A C A 2 C A 3 C A N p Φ = C B 0 0 0 C A B C B 0 0 C A 2 B C A B C B 0 C A N p 1 B C A N p 2 B C A N p 3 B C A N p N c B
One of the crucial steps in the design of an MPC controller is solving the optimization problem, which fundamentally depends on the formulation of an appropriate cost function. For the ORC power generation system, two reference values are considered—the optimal evaporation pressure and the optimal superheat degree—together with two control variables, namely the turbine speed and the pump speed. Accordingly, the cost function is defined as follows:
J = w ev m = 1 N p T ev , ref T ev ( k + m k ) T T ev , ref T ev ( k + m k ) + w sup m = 1 N p T sup , ref T sup ( k + m k ) T T sup , ref T sup ( k + m k ) + w pu m = 0 N c Δ u pu , ref Δ u pu ( k + m k ) T Δ u pu , ref Δ u pu ( k + m k ) + w exp m = 0 N c Δ u exp , ref Δ u exp ( k + m k ) T Δ u exp , ref Δ u exp ( k + m k )
where w is weight, w ev = 5 , w sup = 5 , w pu = 2 , and w exp = 2 .
After incorporating the constraints, the optimization problem is described as follows:
arg min J Δ U k s . t . Y min F x k + Φ Δ U Y max Δ U min Δ U k Δ U max U min U k U max

5. Results and Discussion

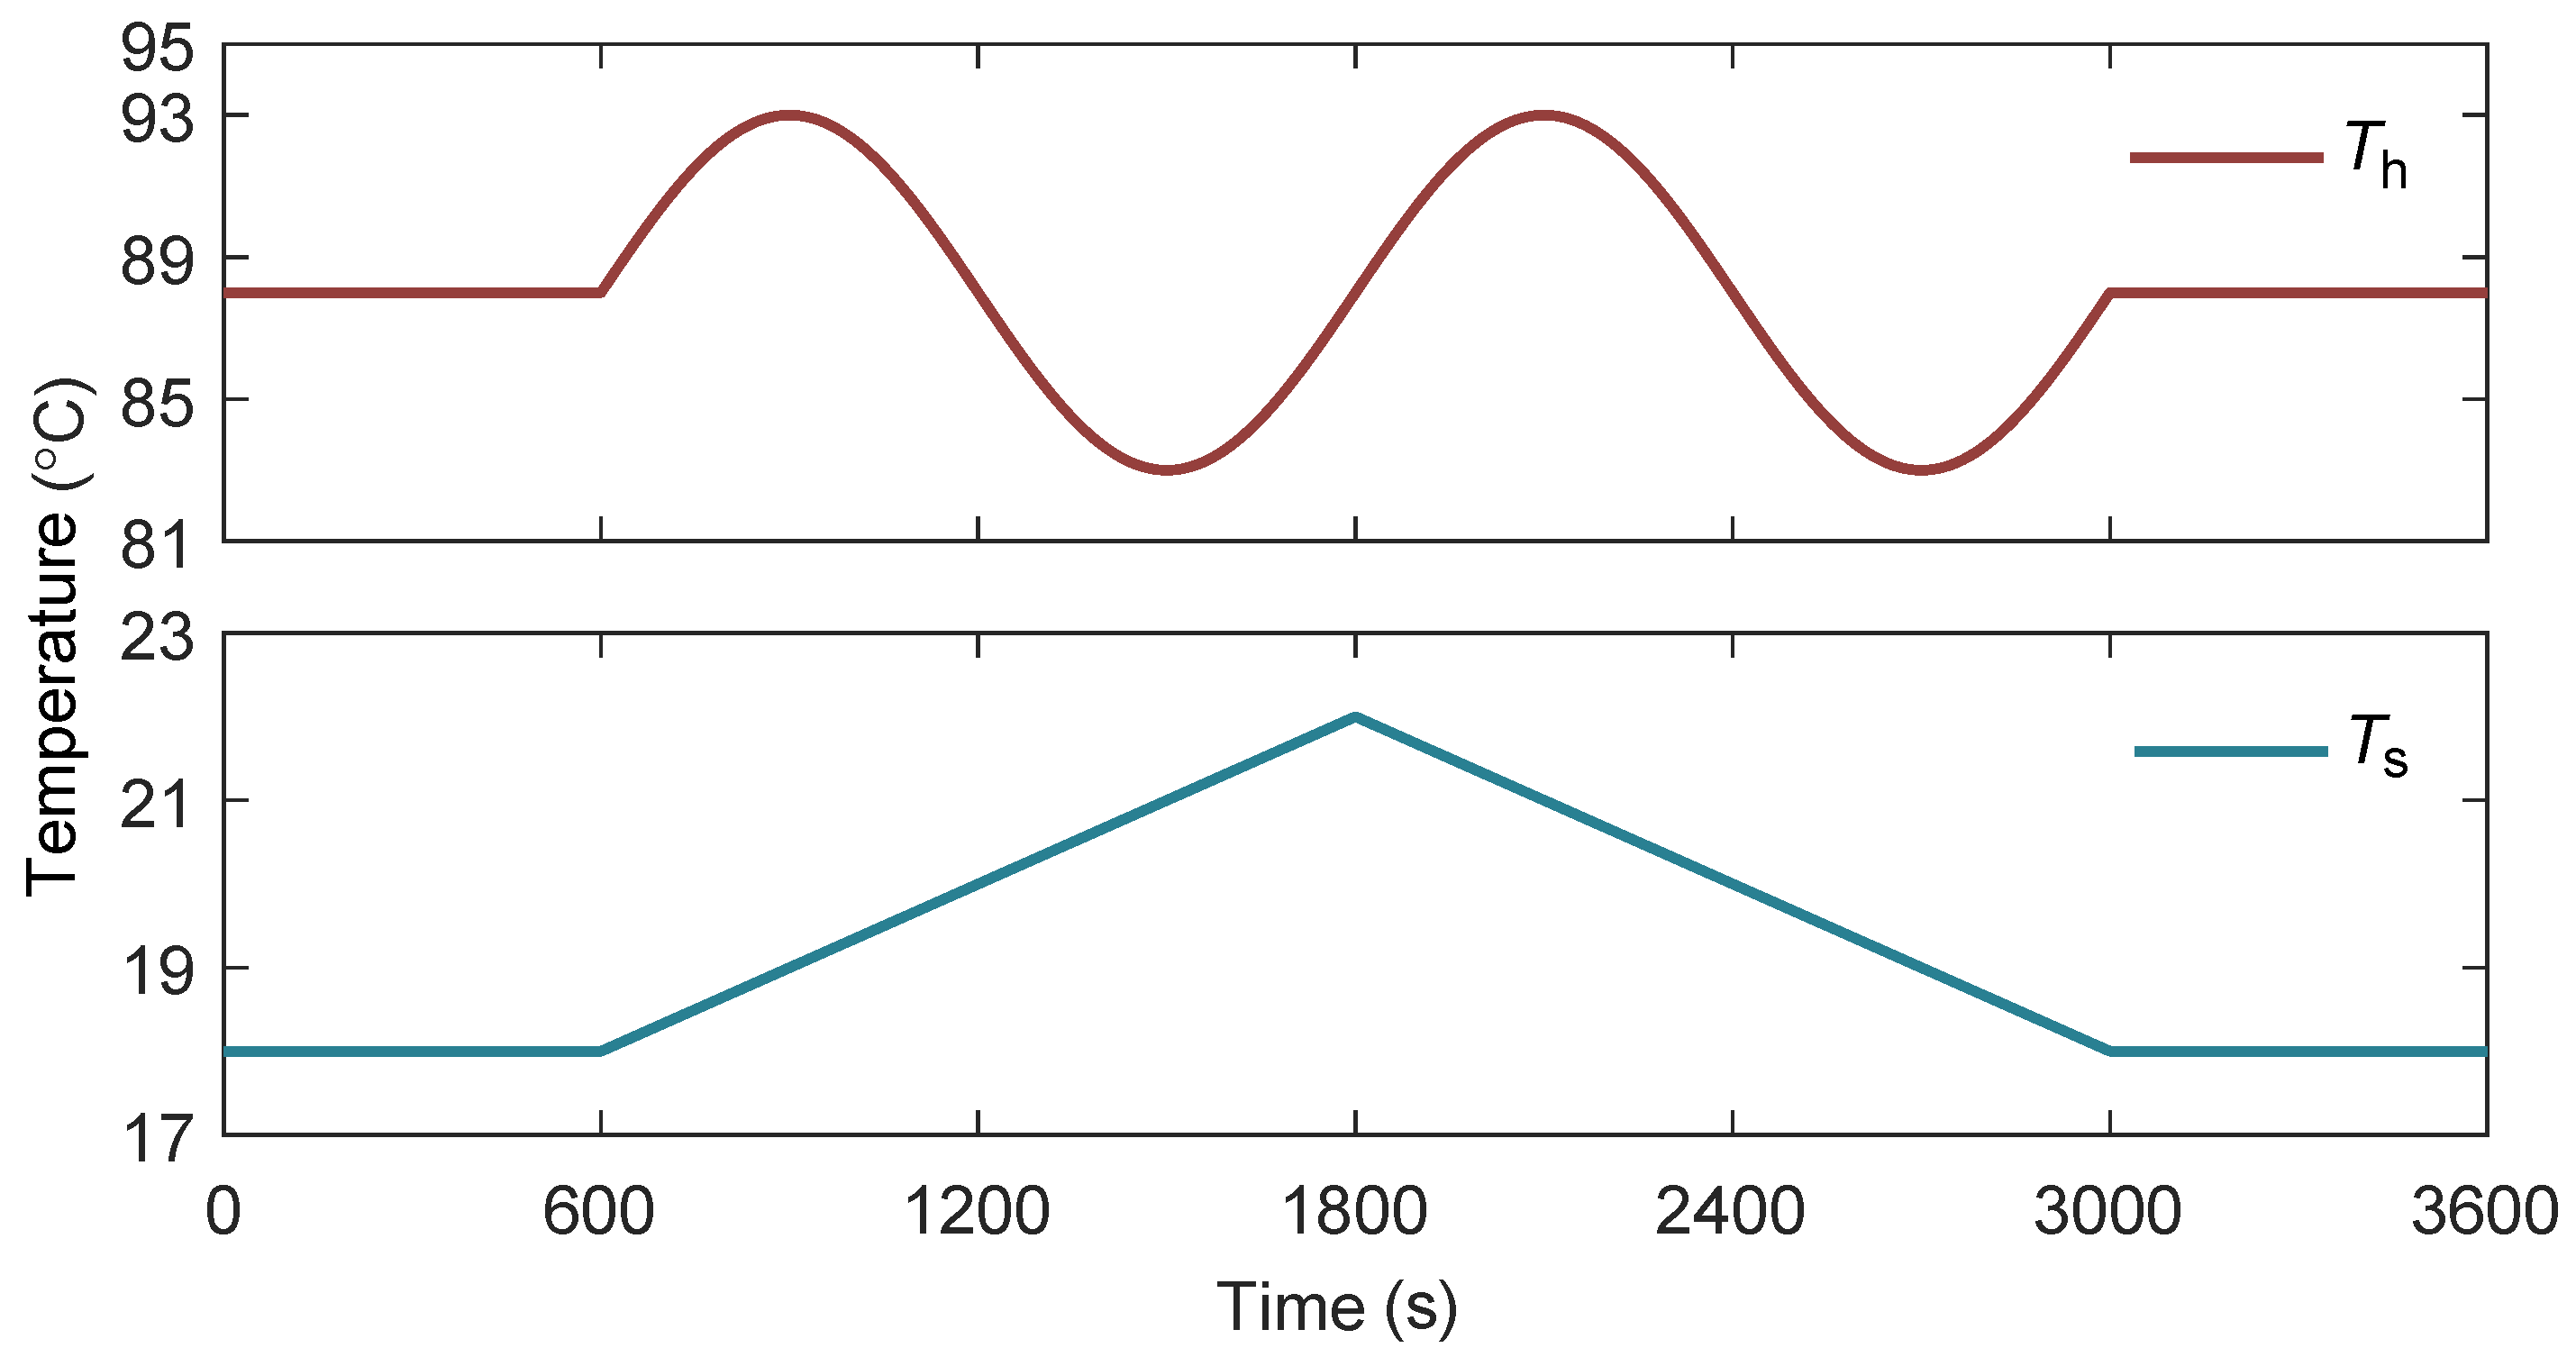
To validate the proposed MPPT strategy, dynamic models of the ORC system were established, and the MPC controller was implemented in MATLAB/Simulink. Furthermore, a test scenario was designed that combined a sinusoidally varying heat source with a linearly varying sink, as illustrated in Figure 18.
The sinusoidal and linear heat-source variations designed in this study were chosen to represent two fundamental categories of transient behavior: periodic fluctuations, such as those arising from diurnal solar irradiance or cyclic feedstock supply in biomass combustion. The linear variation of the heat sink considered in this study primarily reflects the temperature changes of seawater when it is used as the cooling medium during ship navigation.
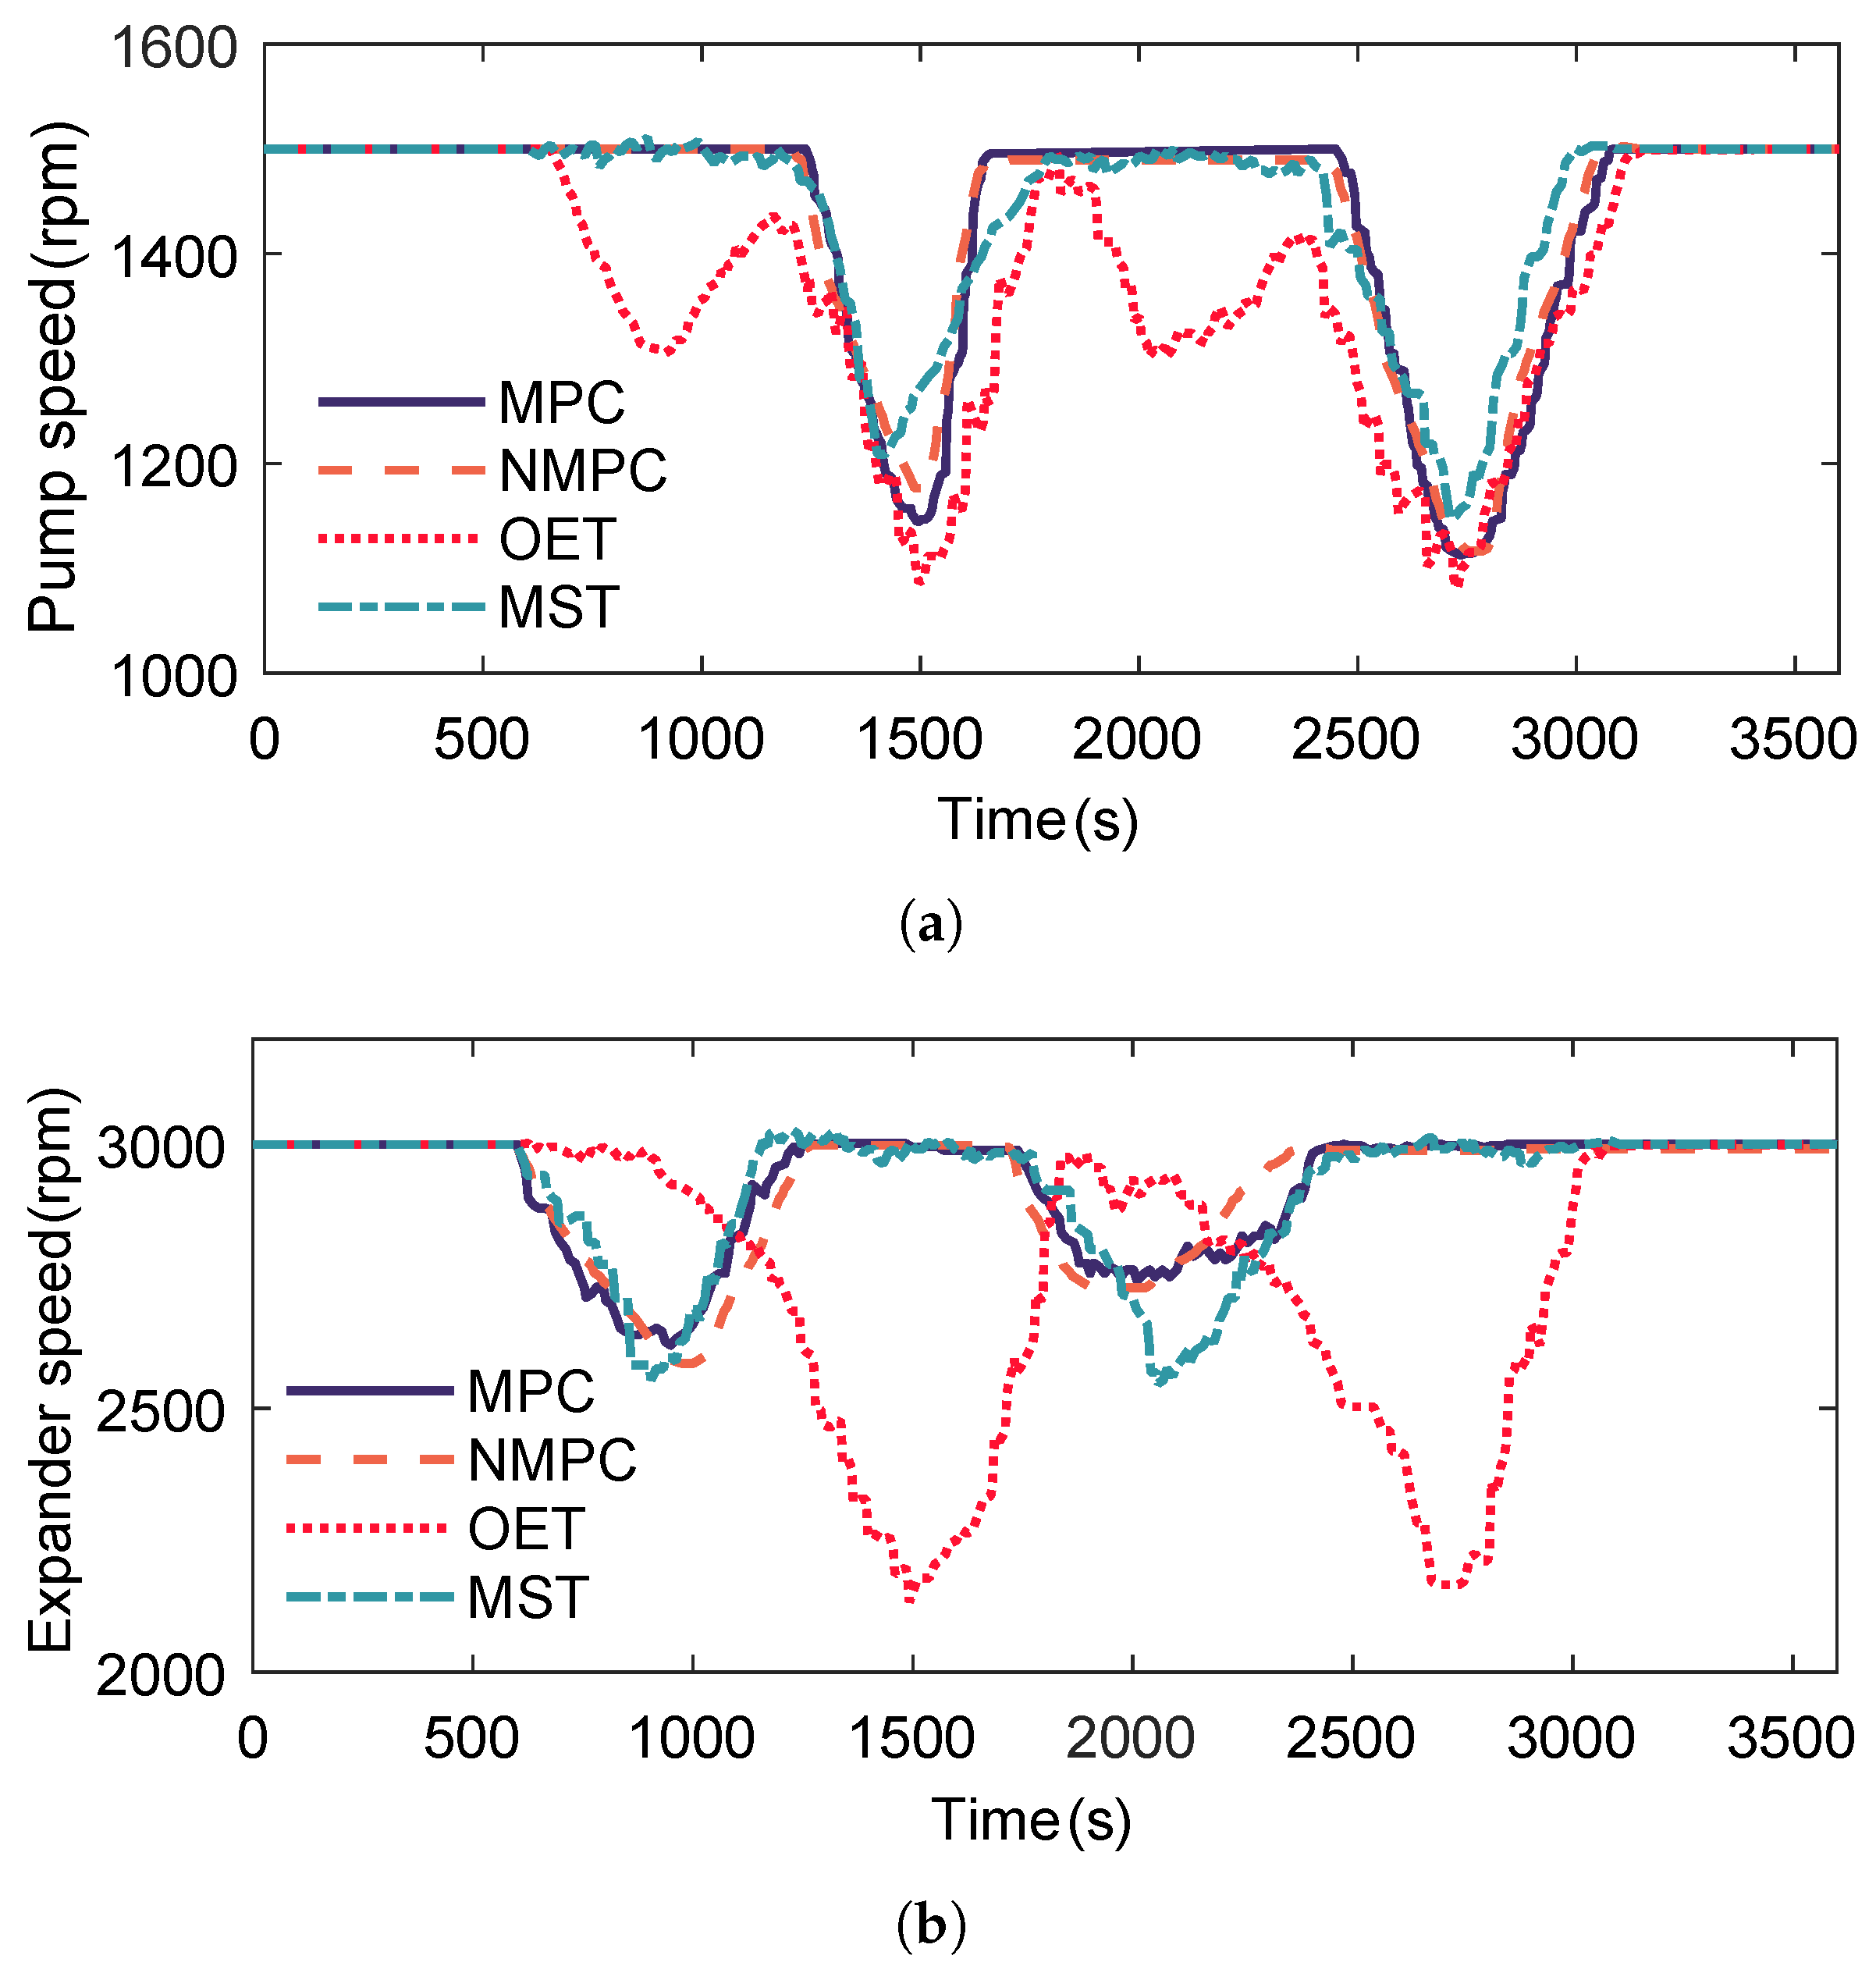
Figure 19 illustrates the variation in pump and expander rotational speeds during the control process. As shown, the MPC, NMPC, and MST strategies exhibit similar trends. Under the OET strategy, however, the pump speed is frequently adjusted to maintain constant pressure. When the heat source temperature is relatively high, the MPC and NMPC strategies keep the pump speed nearly constant, achieving the optimal evaporation pressure and superheat degree primarily by adjusting the expander speed. In contrast, the OET strategy simultaneously adjusts both pump and expander speeds to maintain constant pressure. When the heat source temperature is low, the MPC, NMPC, and MST strategies maintain safe system operation mainly by regulating the pump speed. By comparison, the OET strategy imposes excessive adjustments on the expander speed to enforce constant pressure, ultimately leading to reduced efficiency.
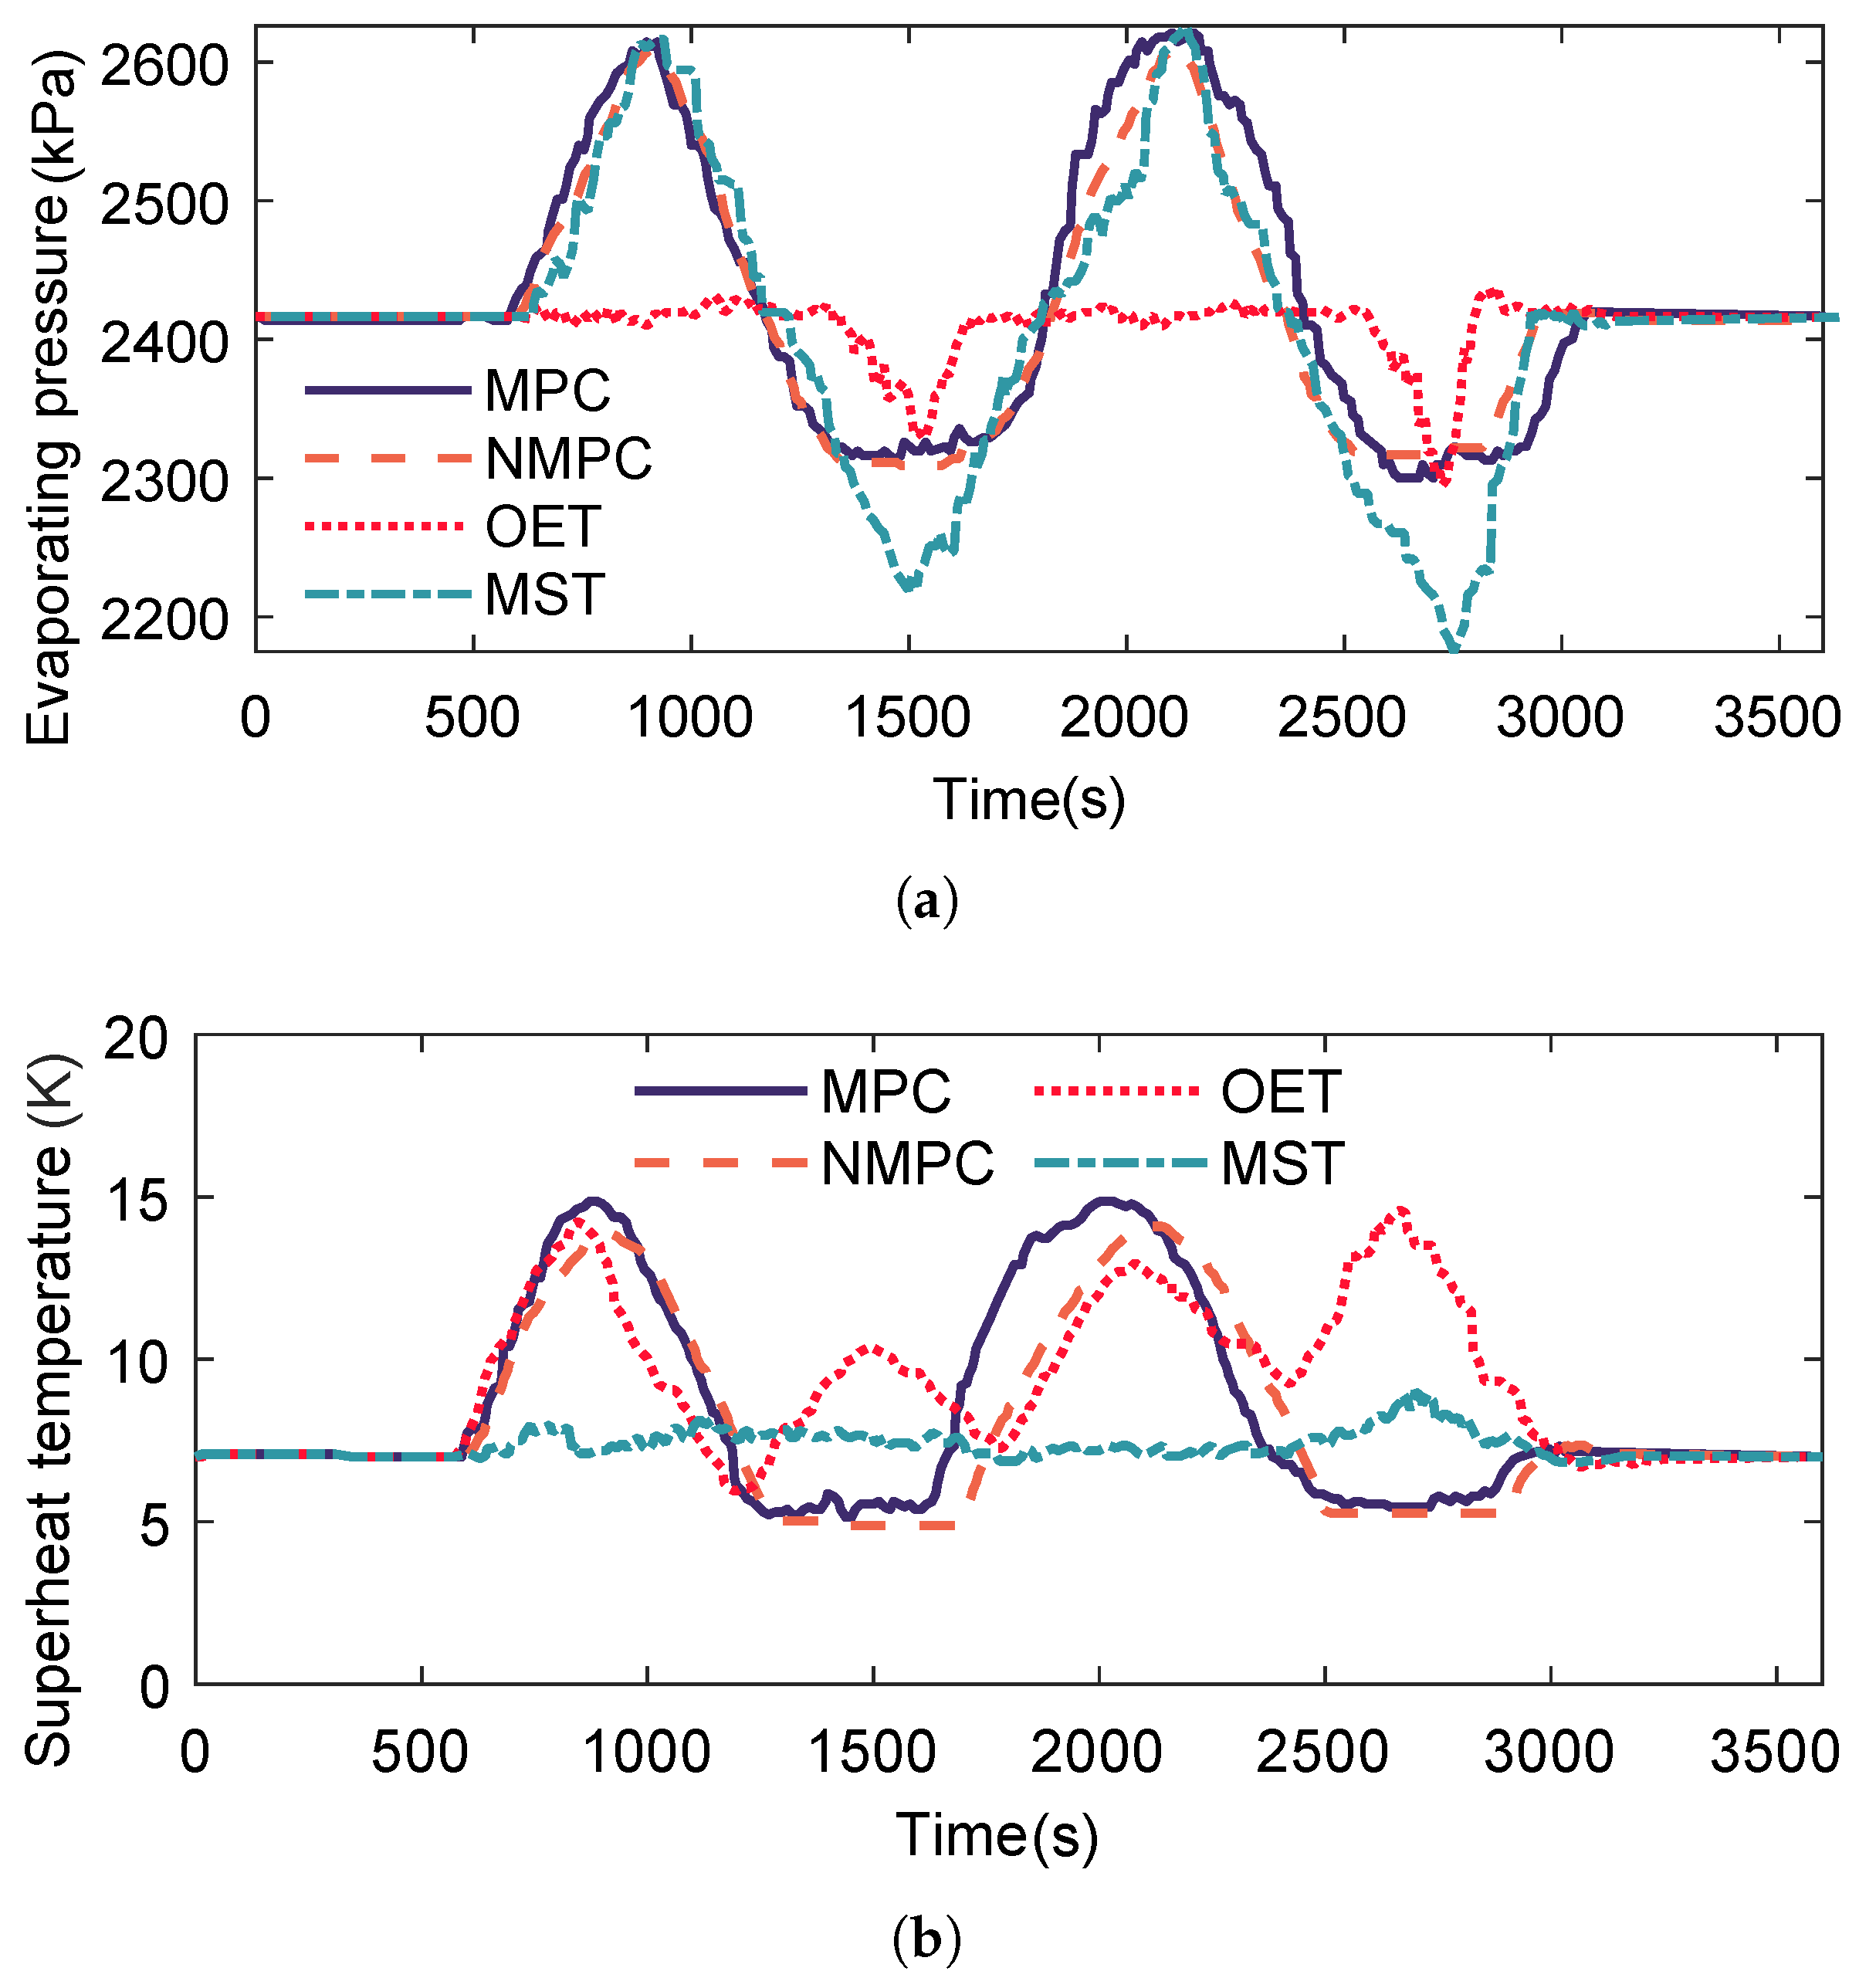
Figure 20 presents the variations in evaporating pressure and superheat degree. The trends of both parameters are highly similar under the MPC, NMPC, and MST control strategies. During operation, the OET strategy is generally able to maintain a constant pressure, but it fails to do so when the heat source temperature is low. Likewise, the MST strategy struggles to maintain the superheat degree at its setpoint when the heat source temperature is high. In contrast, both MPC and NMPC accurately track the optimal evaporating pressure, although the NMPC strategy exhibits larger tracking errors when operating far from the nominal point.
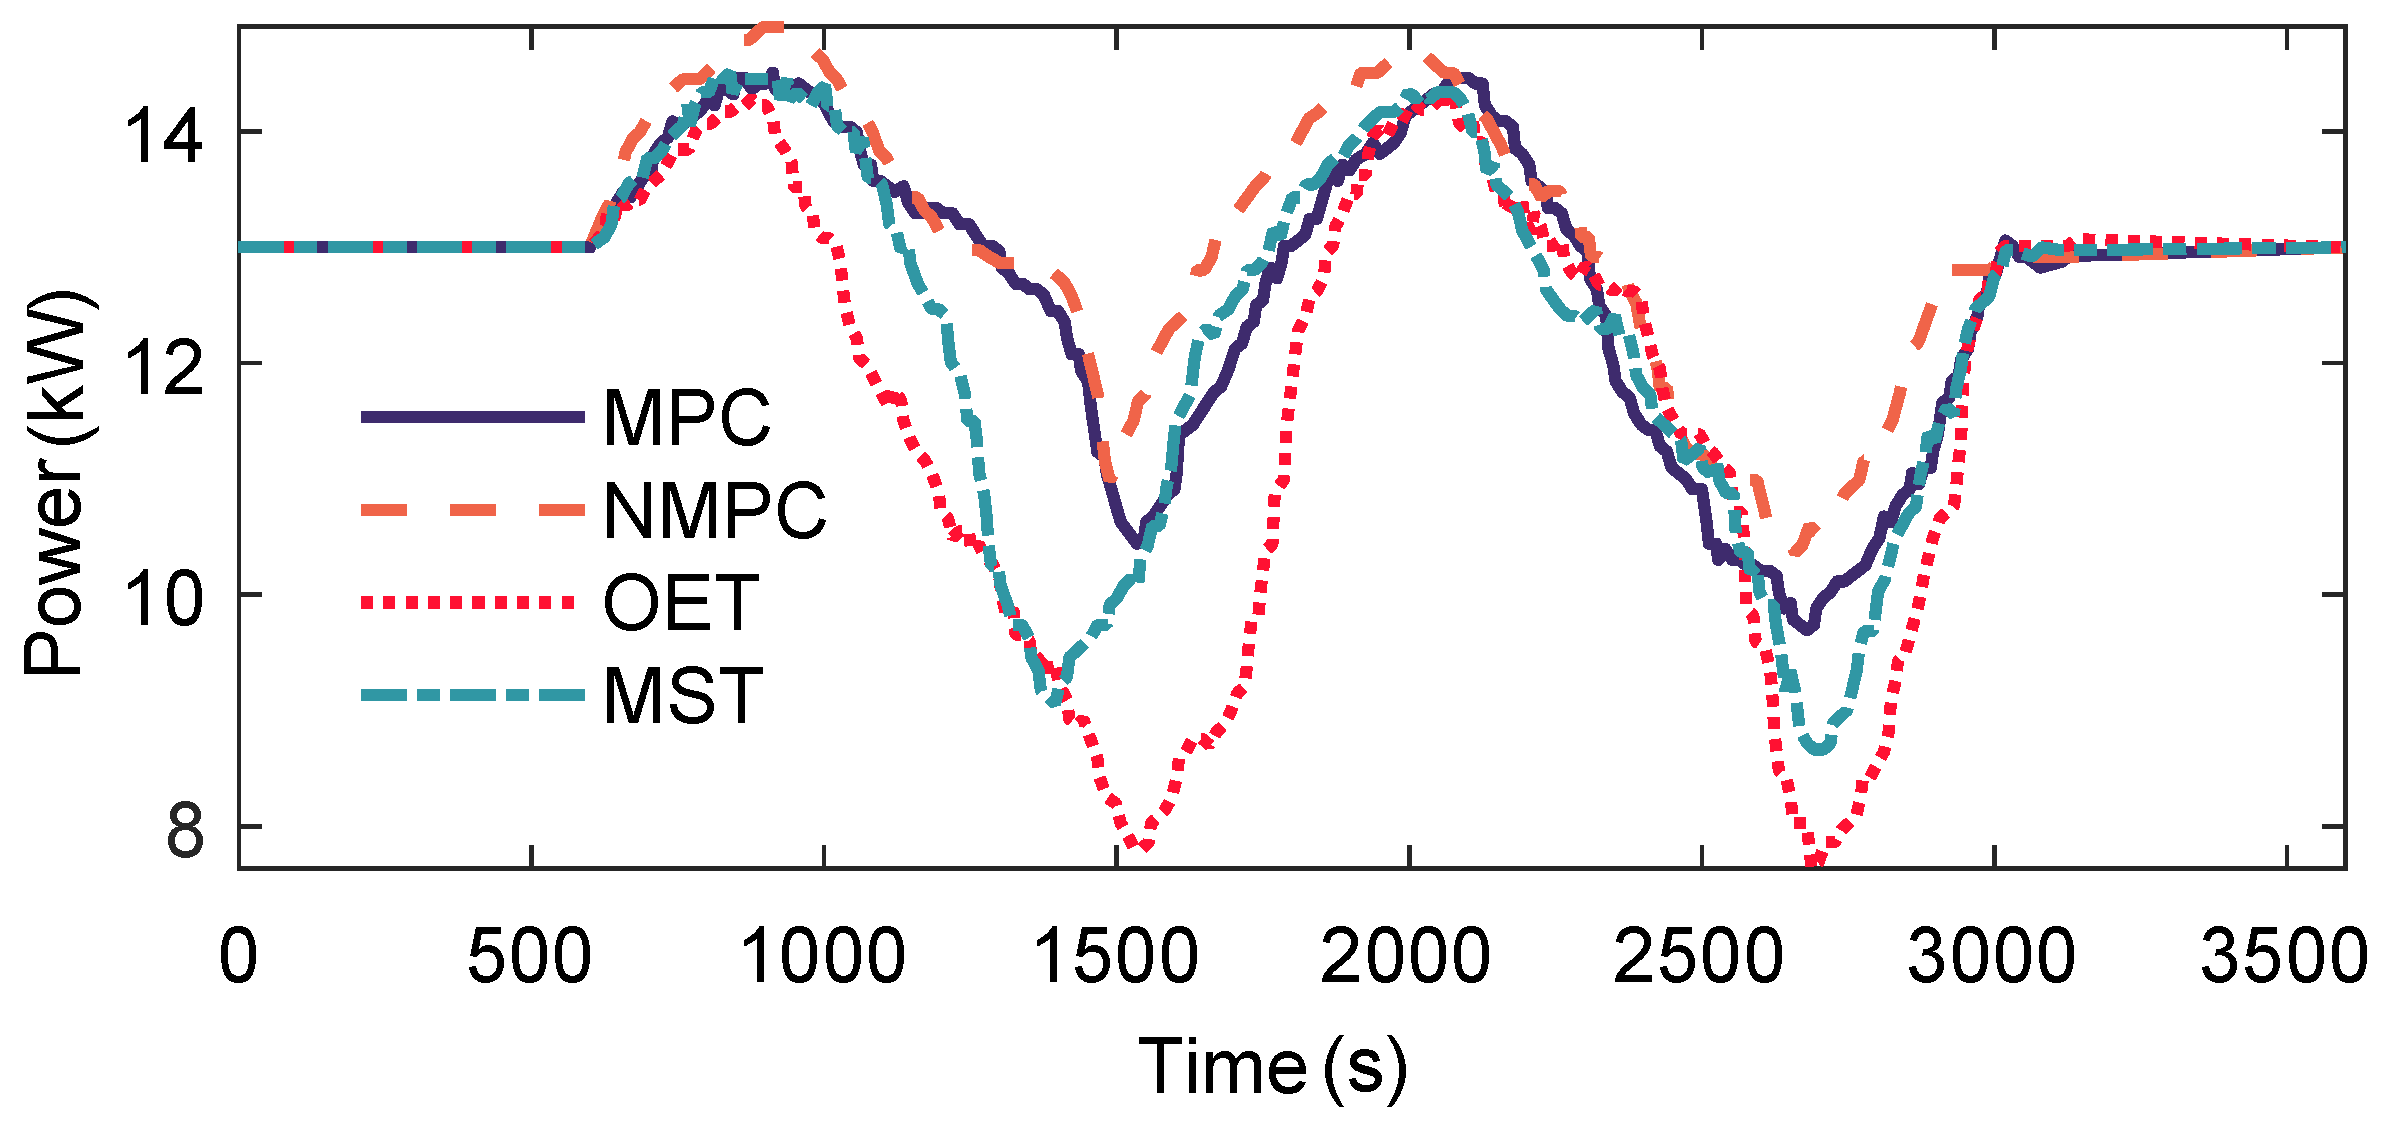
Figure 21 illustrates the variation in power output during the control process. As shown, the OET strategy incurs significant power loss in order to maintain constant pressure and thereby preserve expander efficiency. Under low heat source temperatures, the MST strategy also excessively adjusts the expander speed to achieve the tracking target, which results in reduced expander efficiency and power loss. The strategy proposed in this study represents a trade-off between the OET and MST approaches: it adopts the OET strategy when the heat source temperature is relatively high and the MST strategy when the temperature is relatively low. Consequently, the proposed MPPT strategy achieves relatively smooth power output under both MPC and NMPC control.
Integrating the power output over time yields the total electricity generation for the considered period, thereby providing a more intuitive comparison of the performance of the different strategies under fluctuating heat and sink temperatures, as summarized in Table 1.
Using the electricity generation of the OET strategy as the baseline, the MST strategy achieves a 6.16% increase. In comparison, the strategy proposed in this study yields a 9.70% improvement with the basic MPC method and a 14.15% improvement with the NMPC method. The improvement in power generation achieved by the MPPT strategy proposed in this study under simultaneous fluctuations of heat-source and heat-sink temperatures can be attributed to two key factors. First, by jointly regulating the expander speed and the working-fluid pump speed, the system is able to track the optimal operating point more rapidly. Second, the proposed strategy maintains minimal superheat at low heat-source temperatures to ensure safe operation, while under high heat-source temperatures, it enables the system to operate at both the optimal evaporation pressure and superheat degree, thereby achieving maximum power output.

6. Conclusions

In this paper, a dynamic model of the ORC system was established, and the variations in evaporating pressure, superheat degree, and output power under different expander and working fluid pump speeds were analyzed. Based on these results, a Maximum Power Point Tracking (MPPT) strategy was proposed, founded on the optimal evaporating pressure and superheat degree. In addition, the machine-side control strategy and an MPC controller for the ORC system were designed, and their performance was validated through simulations. The main conclusions are as follows:
  • Adjusting a single parameter, such as evaporating pressure or superheat degree, cannot enable the ORC power generation system to achieve maximum output power;
  • The proposed MPPT strategy achieves coordinated control of evaporation pressure and superheat degree, enabling the system to attain maximum power output under varying operating conditions;
  • By simultaneously regulating the expander speed and the working fluid pump speed, the system exhibits a shorter response time and reaches the set point more rapidly;
  • The proposed MPPT strategy maintains the optimal pressure when the heat source temperature is relatively high and the minimum superheat degree when the temperature is relatively low;
  • Compared with the OET strategy, the proposed MPPT strategy increases power generation by 14.15%, and it achieves a 7.53% improvement compared with the MST strategy.
Overall, the MPPT strategy developed in this study, based on the optimal evaporating pressure and superheat degree, enables the ORC system to achieve maximum power output under fluctuating sink and heat source temperatures. The proposed MPPT strategy for ORC systems can be applied to waste heat recovery in marine engines, as well as to power generation from geothermal energy and industrial waste heat. Future work will focus on extending this approach to ORC power generation systems with more complex configurations.

Author Contributions

Conceptualization, Y.L.; methodology, Y.L.; writing—original draft preparation, Y.L. and J.S.; writing—review and editing, Y.L. and J.S.; supervision, Y.L. All authors have read and agreed to the published version of the manuscript.

Funding

This research received no external funding.

Institutional Review Board Statement

Not applicable.

Informed Consent Statement

Not applicable.

Data Availability Statement

The raw data supporting the conclusions of this article will be made available by the authors upon request.

Acknowledgments

During the preparation of this manuscript, the author(s) used the AI model for polishing the English text. The authors have reviewed and edited the output and take full responsibility for the content of this publication.

Conflicts of Interest

The authors declare no conflicts of interest.

Abbreviations

The following abbreviations are used in this manuscript:
ORCOrganic Rankine Cycle
MPCModel Predictive Control
NMPCNonlinear Model Predictive Control
FVMFinite Volume Method
OETOptimal Evaporating Temperature
MBMMoving Boundary Model
PMSGPermanent Magnet Synchronous Generator
MPPTMaximum Power Point Tracking
MSTMinimal Superheat Temperature
Symbols
 The following symbols are used in this manuscript:
AHeat transfer area
ρ Density
m ˙ Mass flow rate
G ˙ Mass flux
hEnthalpy
PPressure
NRotational speed
DDiameter
α Heat transfer coefficient
TTemperature
LLength of the region
c p Specific heat
F F Filling factor
VDisplacement volume
vSpecific volume
WPower output
ω Angular velocity
η Efficiency
RResistance
uVoltage
iCurrent
ψ Flux linkage
JMoment of inertia
SSwitch
CCapacitor
dd-axis
qq-axis
Subscripts
 The following subscripts are used in this manuscript:
w Wall of heat exchanger
r Working fluid
in Inlet
l Saturated liquid state of the working fluid
i Inner
g Saturated vapor state of the working fluid
out Outlet
exp Expander
ref Reference value
pu Pump
e Electric
m Mechanical
ga Phase A of the power grid
gb Phase B of the power grid
gc Phase C of the power grid

Appendix A

The following elements in matrix Z are present:
z 11 1 2 A cs ρ ¯ 1 h in h l
z 13 1 2 A cs L 1 ρ l d h l d P + ( h in + h l ) ( a 2 ) 2 a h l
z 21 A cs ρ l h l ρ g h g h g ( ρ ¯ 1 ρ g ) + h l ( ρ 1 ρ l )
z 22 A cs ρ l ( 1 γ ¯ ) ( h l h g )
z 23 A cs L 2 γ ¯ d ρ g h g d P h g d ρ g d P + A cs L 2 1 γ ¯ d ρ l h l d P h g d ρ l d P 1 + A c s L 1 a h l h g
z 31 A cs ρ 3 h g 1 2 ρ 3 ( h g + h o u t )
z 32 A cs ρ 3 h g 1 2 ρ 3 ( h g + h o u t )
z 33 A cs L 3 1 2 ( h g + h o u t ) ( 1 2 ρ 3 h 3 | P d h g d P + ρ 3 P | h ) + A cs L 3 1 2 ρ 3 d h g d P 1 1 2 h g ρ 3 h 3 | P d h g d P ρ 3 P | h h g
z 34 A cs 2 ρ 3 L 3 + 1 2 ρ 3 h 3 | P ( h g + h o u t ) L 3 h g L 3 ρ 3 h 3 | P
z 41 A cs ( ρ ¯ 1 ρ 3 )
z 42 A cs ( ρ g ρ 3 ) + ( 1 γ ¯ ) ( ρ l ρ g )
z 43 A cs L 2 ( γ ¯ d ρ g d P + ( 1 γ ¯ ) d ρ l d P ) + a L 1 + L 3 ( 1 2 ρ 3 h 3 | P d h g d P + ρ 3 P | h )
z 44 A cs 2 L 3 ρ 3 h 3 P
z 51 ( C p ρ A ) w T ¯ w 1 T w | L 1
z 55 ( C p ρ A ) w L 1
z 61 ( C p ρ A ) w T w | L 1 T w | L 1 + L 2
z 62 ( C p ρ A ) w T ¯ w 2 T w | L 1 + L 2
z 66 ( C p ρ A ) w L 2
z 72 ( C p ρ A ) w T w | L 1 + L 2 T ¯ w 3
z 77 ( C p ρ A ) w L 3
A cs π r i + w 2 r i 2

References

  1. Sharma, V.K.; Monteleone, G.; Braccio, G.; Anyanwu, C.N.; Aneke, N.N. A Comprehensive Review of Green Energy Technologies: Towards Sustainable Clean Energy Transition and Global Net-Zero Carbon Emissions. Processes 2025, 13, 69. [Google Scholar] [CrossRef]
  2. Sohrabi, A.; Liu, S.; Cuce, E.; Shen, Y.; Khan, S.Y.; Kumar, M. Utilization of Low-Grade Thermal Energy for Residential Applications: A Review of the Existing and Potential Technologies. Renew. Sustain. Energy Rev. 2025, 219, 115832. [Google Scholar] [CrossRef]
  3. Wu, J.; Liang, Y.; Dong, M.; Zhu, Y.; Zhou, J.; Ling, X.; Lu, J. Dynamic Analysis and Control Strategy of Solar-Driven ORC-VCC System Using Zeotropic Mixture. Energy 2025, 317, 134706. [Google Scholar] [CrossRef]
  4. Zhang, Q.; Feng, Y.Q.; Xu, K.J.; Liang, H.J.; Liu, Z.N.; Zhao, C.Y.; Wang, Y.Z.; Sapin, P.; Markides, C.N. Dynamic Behaviour and Performance Evaluation of a Biomass-Fired Organic Rankine Cycle Combined Heat and Power (ORC-CHP) System under Different Control Strategies. Appl. Therm. Eng. 2024, 248, 123236. [Google Scholar] [CrossRef]
  5. Imre, A.R.; Daniarta, S.; Błasiak, P.; Kolasiński, P. Design, Integration, and Control of Organic Rankine Cycles with Thermal Energy Storage and Two-Phase Expansion System Utilizing Intermittent and Fluctuating Heat Sources—A Review. Energies 2023, 16, 5948. [Google Scholar] [CrossRef]
  6. Quoilin, S.; Aumann, R.; Grill, A.; Schuster, A.; Lemort, V.; Spliethoff, H. Dynamic Modeling and Optimal Control Strategy of Waste Heat Recovery Organic Rankine Cycles. Appl. Energy 2011, 88, 2183–2190. [Google Scholar] [CrossRef]
  7. Hu, D.; Zheng, Y.; Wu, Y.; Li, S.; Dai, Y. Off-Design Performance Comparison of an Organic Rankine Cycle under Different Control Strategies. Appl. Energy 2015, 156, 268–279. [Google Scholar] [CrossRef]
  8. Peralez, J.; Tona, P.; Nadri, M.; Dufour, P.; Sciarretta, A. Optimal Control for an Organic Rankine Cycle on Board a Diesel-Electric Railcar. J. Process Control 2015, 33, 1–13. [Google Scholar] [CrossRef]
  9. Hernandez, A.; Desideri, A.; Ionescu, C.; De Keyser, R.; Lemort, V.; Quoilin, S. Real-Time Optimization of Organic Rankine Cycle Systems by Extremum-Seeking Control. Energies 2016, 9, 334. [Google Scholar] [CrossRef]
  10. Li, J.; Gao, Z.; Zhou, X.; Zhang, J. ORC System Temperature and Evaporation Pressure Control Based on DDPG-MGPC. Processes 2025, 13, 2314. [Google Scholar] [CrossRef]
  11. Wang, Z.; Li, X.; Xia, X.; Yang, H.; Zuo, Q.; Xie, B.; Gong, T. Optimal Operation for Organic Rankine Cycle Using a Machine Learning-Based Radial Turbine with Variable Nozzles at off-Design Conditions. Phys. Fluids 2025, 37, 025183. [Google Scholar] [CrossRef]
  12. Imran, M.; Pili, R.; Usman, M.; Haglind, F. Dynamic Modeling and Control Strategies of Organic Rankine Cycle Systems: Methods and Challenges. Appl. Energy 2020, 276, 115537. [Google Scholar] [CrossRef]
  13. Vaupel, Y.; Huster, W.R.; Mhamdi, A.; Mitsos, A. Optimal Operating Policies for Organic Rankine Cycles for Waste Heat Recovery under Transient Conditions. Energy 2021, 224, 120126. [Google Scholar] [CrossRef]
  14. Hernandez, A.; Ruiz, F.; Gusev, S.; De Keyser, R.; Quoilin, S.; Lemort, V. Experimental Validation of a Multiple Model Predictive Control for Waste Heat Recovery Organic Rankine Cycle Systems. Appl. Therm. Eng. 2021, 193, 116993. [Google Scholar] [CrossRef]
  15. Zhou, Y.; Ruan, J.; Hong, G.; Miao, Z. Dynamic Modeling and Comparison Study of Control Strategies of a Small-Scale Organic Rankine Cycle. Energies 2022, 15, 5505. [Google Scholar] [CrossRef]
  16. Fatigati, F.; Di Battista, D.; Carapellucci, R. Model-Based Assessment of a Feedforward-Feedback Control Strategy for ORC-based Unit in Waste Heat Recovery Application. Appl. Therm. Eng. 2025, 258, 124774. [Google Scholar] [CrossRef]
  17. Park, H.S.; Heo, H.J.; Choi, B.S.; Kim, K.C.; Kim, J.M. Speed Control for Turbine-Generator of ORC Power Generation System and Experimental Implementation. Energies 2019, 12, 200. [Google Scholar] [CrossRef]
  18. Guan, Z.; Zhao, P.; Wang, J.; Sun, Q.; Guo, Y.; Lou, J.; Chen, L.; Liu, B.; Li, H. Dynamic Performance and Control Strategy of a Combined Heat and Power System Driven by Geothermal Energy Considering the Building Multi-Load Requirements. Energy Convers. Manag. 2022, 270, 116189. [Google Scholar] [CrossRef]
  19. Raheli Kaleibar, M.; Khoshbakhti Saray, R.; Pourgol, M. Comprehensive Assumption-Free Dynamic Simulation of an Organic Rankine Cycle Using Moving-Boundary Method. Energy 2024, 307, 132584. [Google Scholar] [CrossRef]
  20. Du, Y.; Liu, T.; Wang, Y.; Chen, K.; Zhao, P.; Wang, J.; Dai, Y. Transient Behavior Investigation of a Regenerative Dual-Evaporator Organic Rankine Cycle with Different Forms of Disturbances: Towards Coordinated Feedback Control Realization. Energy 2021, 235, 121437. [Google Scholar] [CrossRef]
  21. Milián, V.; Navarro-Esbrí, J.; Ginestar, D.; Molés, F.; Peris, B. Dynamic Model of a Shell-and-Tube Condenser. Analysis of the Mean Void Fraction Correlation Influence on the Model Performance. Energy 2013, 59, 521–533. [Google Scholar] [CrossRef]
  22. Huang, F.; Chen, C.; Sun, X.; Wang, Z.; Fu, H. Dynamic Behavior of Permanent Magnet Synchronous Motor Rotor Bending Fault. Measurement 2025, 256, 118123. [Google Scholar] [CrossRef]
  23. You, L.; Zhang, X.; Jin, S.; Luan, M. Machine Learning-Based Forward Design Approach for Grid-Connected Inverters with Enhanced Stability and Dynamic Performance. IEEE Trans. Power Electron. 2025, 40, 15638–15651. [Google Scholar] [CrossRef]
  24. Ait Hammouda, C.; Bradai, R.; Bendib, A.; Kherbachi, A.; Kara, K.; Boukenoui, R.; Ahmed, H. Modelling, Control Design, and Analysis of the Inner Control’s Loops Intended for Single-Phase Voltage-Controlled Inverter-Based Microgrid. IET Gener. Transm. Distrib. 2024, 18, 568–584. [Google Scholar] [CrossRef]
  25. Hassan, M.A.; Adel, M.M.; Saleh, A.A.; Eteiba, M.B.; Farhan, A. Maximum Power Point Tracking Based on Finite Voltage-Set MPC for Grid-Connected Photovoltaic Systems Under Environmental Variations. Sustainability 2024, 16, 10317. [Google Scholar] [CrossRef]
Figure 1. Configuration of the ORC system.
Processes 13 03189 g001
Figure 2. Schematic diagram of the moving boundary model.
Processes 13 03189 g002
Figure 3. Configuration of PWM inverter.
Processes 13 03189 g003
Figure 4. Dual closed-loop control strategy of the rectifier.
Processes 13 03189 g004
Figure 5. Variationin system power output with expander speed and pump flow rate when the heat source temperature falls beneath its rated value.
Processes 13 03189 g005
Figure 6. Evaporation pressure variation under different expander rotational speeds and working fluid pump flow rates in scenarios where the heat source temperature does not reach the rated operating point.
Processes 13 03189 g006
Figure 7. Superheat degree variation under different expander rotational speeds and working fluid pump flow rates under conditions where the heat source temperature is reduced relative to the rated value.
Processes 13 03189 g007
Figure 8. Power output variation under different expander rotational speeds and working fluid pump flow rates under super-rated heat source temperature conditions.
Processes 13 03189 g008
Figure 9. Evaporation pressure variation under different expander rotational speeds and working fluid pump flow rates at heat source temperatures above the rated level.
Processes 13 03189 g009
Figure 10. Superheat degree variation under different expander rotational speeds and working fluid pump flow rates when the heat source temperature exceeds the rated value.
Processes 13 03189 g010
Figure 11. Effect of expander rotational speed on net power output and superheat under varying heat-sink conditions at a fixed heat-source temperature of 86 C . (a) Effect of expander rotational speed on net power output. (b) Effect of expander rotational speed on superheat.
Processes 13 03189 g011
Figure 12. Effect of expander rotational speed on net power output and superheat under varying heat-sink conditions at a fixed heat-source temperature of 88 C . (a) Effect of expander rotational speed on net power output. (b) Effect of expander rotational speed on superheat.
Processes 13 03189 g012
Figure 13. Effect of expander rotational speed on net power output and superheat under varying heat-sink conditions at a fixed heat-source temperature of 90 C . (a) Effect of expander rotational speed on net power output. (b) Effect of expander rotational speed on superheat.
Processes 13 03189 g013
Figure 14. Effectof expander rotational speed on net power output and superheat under varying heat-sink conditions at a fixed heat-source temperature of 92 C . (a) Effect of expander rotational speed on net power output. (b) Effect of expander rotational speed on superheat.
Processes 13 03189 g014
Figure 15. Optimal evaporating pressure map.
Processes 13 03189 g015
Figure 16. Optimalsuperheat map.
Processes 13 03189 g016
Figure 17. Configuration of ORC control system.
Processes 13 03189 g017
Figure 18. Variation in heat and sink source.
Processes 13 03189 g018
Figure 19. Variation in pump and expander rotational speeds during the control process. (a) The variation in pump speed during the control process. (b) The variation in expander speed during the control process.
Processes 13 03189 g019
Figure 20. Variation in the evaporating pressure and superheat temperature during the control process. (a) Variation in evaporating pressure during the control process. (b) Variation in superheat temperature during the control process.
Processes 13 03189 g020
Figure 21. Variation in power in control process.
Processes 13 03189 g021
Table 1. Comparison of electricity generation with different MPPT strategies.
StrategyElectricity GenerationUnit
OET7.63kWh
MST8.1kWh
MPC8.37kWh
NMPC8.71kWh
Disclaimer/Publisher’s Note: The statements, opinions and data contained in all publications are solely those of the individual author(s) and contributor(s) and not of MDPI and/or the editor(s). MDPI and/or the editor(s) disclaim responsibility for any injury to people or property resulting from any ideas, methods, instructions or products referred to in the content.