1. Introduction
The gas turbine (GT)-based combined cycle (CC) is the most efficient and cleanest technology among the fossil fuel-fired power generation systems. In particular, gas turbines are expected to play a significant role in the medium-term future of the energy mix as governments continue to pursue decarbonization while balancing the demands between a coal-fired past and a renewable-based future.
From a theoretical point of view, the gas turbine is a particular internal combustion engine based on the Brayton–Joule cycle according to four thermodynamic processes: (i) air compression, (ii) constant pressure combustion, (iii) gas expansion, and (iv) heat rejection. GT technology evolution has been largely driven by turbine inlet temperature (TIT) and pressure ratio, so efficiency values for current state-of-the-art heavy-duty gas turbines up to around 43% and 64% are possible in simple cycle and combined cycle, respectively [
1,
2,
3]. However, the steady performance increase over the last decades is rapidly approaching a plateau considering the current state of the art of around 1600 °C for TIT and 24 for pressure ratio. Considering TIT increases at an average rate of 20 °C per year, while the allowable superalloy material temperature increases only at 8 °C per year [
4], advanced materials and innovative cooling systems are required for stable and prolonged operation of the next generation of gas turbines, targeting TIT up to 1700 °C. On the other hand, higher and higher TITs are challenging because of the manufacturability of hot gas path parts for efficient film cooling, superalloy capabilities, and even ceramic matrix composites. In addition, the corresponding onus on Dry-Low-NO
x combustor technology should not be neglected.
Instead of the above-mentioned pathway of ever-increasing hot gas temperatures, fixing the fundamental deficiency of the Brayton–Joule cycle by reducing the cycle heat addition irreversibility is another possible approach. As a matter of fact, the conventional isobaric combustion process is a significant loss source. Multiple heat addition steps in series, as realized in commercial gas turbine units with “sequential combustion”, i.e., the reheat concept [
5], as well as the use of a combustor capable of generating a stagnation pressure increase are two possible options. In particular, the latter is an alternative technology of a new combustion process, combining heat addition and pressure rise, which contrasts with the conventional Brayton–Joule cycle that operates at constant pressure.
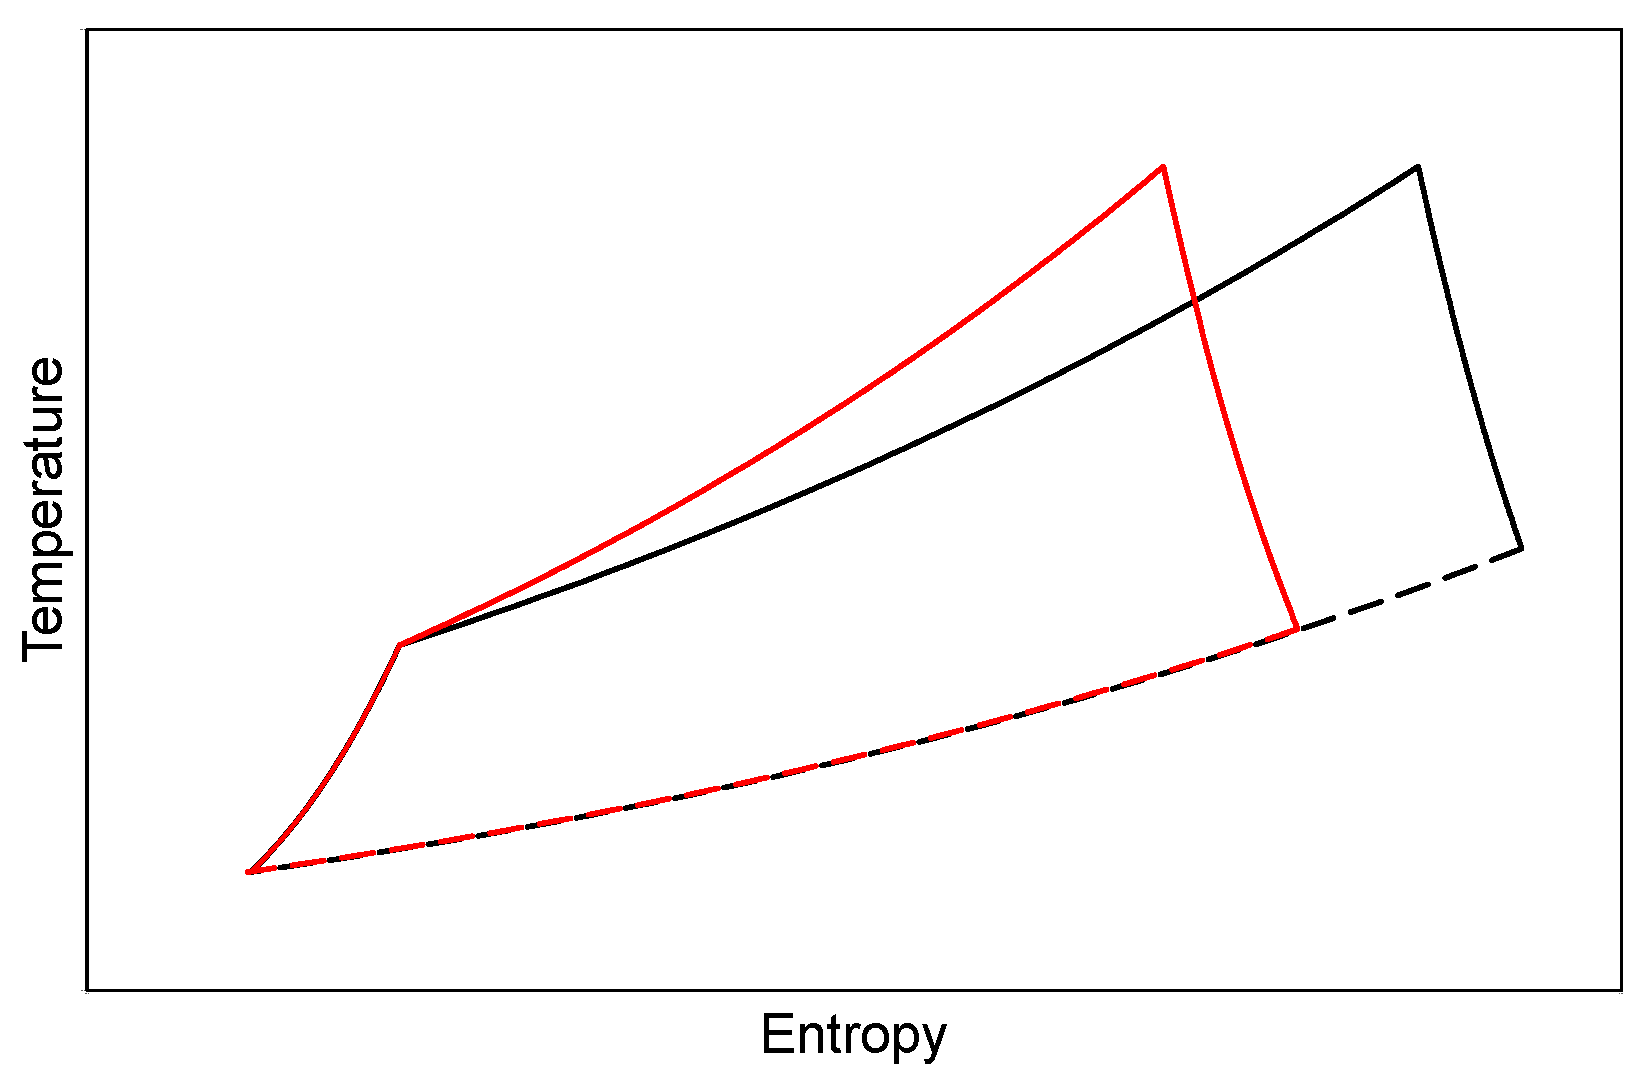
Figure 1 shows an elementary GT cycle on the temperature-entropy plane. It is clear from the schematic that a combustion-driven pressure gain results, for a prescribed maximum cycle temperature, in a potential for an increased network output, with a resultant reduction in specific fuel consumption. Looking at
Figure 1, the benefit of pressure gain combustion (PGC) is associated with the reduced production of entropy during the combustion process compared to conventional constant pressure combustion. In addition, pressure gain combustion can reduce exhaust heat losses. As a matter of fact, the increased turbine inlet pressure, and thus the turbine expansion ratio, lowers the exhaust temperature.
1.1. Potential for Pressure Gain Combustion in Gas Turbines
The potential benefit of applying pressure gain combustion technology to gas turbines has been investigated by several researchers. Focusing on both the ideal Humphrey and Zel’dovich-von Neumann-Doring (ZND) cycles, Heiser and Pratt [
6] theoretically demonstrated that, for a constant heat addition, the higher cycle efficiency of PGC cycles is due to higher enthalpy at combustor outlet and reduced entropy generation. In addition, the advantage of PGC is higher at lower cycle pressure ratios. However, the calculation assumptions of Heiser and Pratt [
6] are questionable, as they (i) neglected the intermittency of PGC heat addition, (ii) assumed perfect gases with constant specific heat, and (iii) calculated work extraction from the maximum cycle temperature, leading to an optimistic analysis. More suitable PGC models were proposed and presented by other researchers [
7,
8,
9,
10,
11,
12,
13], based on the assumption that the kinetic energy at combustor exit is not thoroughly available for work transfer in the turbine. However, the performance results of these models differ from each other [
14,
15]. This can be explained by applied simplifications and different underlying technical realizations of PGC (wave rotor, shockless explosion combustion, pulsed detonation combustion, radial detonation combustion).
Dealing with the integration of pressure gain combustion into a gas turbine using realistic side conditions, there are lots of studies in the technical literature. Neumann and Peitsch [
15] presented comprehensive optimization studies for pressure gain combustion in advanced thermodynamic cycles with intercooling and recuperation. The objective of their studies was to quantify the possible potential of a specific gas turbine layout, as well as to identify promising gas turbine designs for optimum thermal efficiency. Xisto et al. [
16] proposed a PGC model integrated within a gas turbine simulation tool to support the development of novel aircraft engine architectures by exploiting the synergies between intercooling, aftercooling, and pulse detonation combustion. The proposed engine architectures were based on a reference high bypass ratio geared-turbofan engine model. Sousa et al. [
17] developed a numerical tool for modeling gas turbines equipped with rotating detonation combustors. In detail, the combustor model consisted of an iterative procedure to predict the injection velocity for a stabilized spinning of the detonation front with the corresponding refilling process. The approach characterized the reaction zone with the 1-D ZND theory, while the subsequent post detonation flow was solved with a 2-D method of characteristics solver. A new design philosophy for the turbine was required, ensuring first the starting of the supersonic passage, then computing the power extraction and the outlet conditions using 1-D analysis, velocity triangles, and new loss correlations. Focusing on the Humphrey gas turbine cycle, the effects of excursions from ideal constant volume combustion on the cycle and its thermal efficiency were explored by Stathopoulos [
18]. The impact of an additional compressor for delivering cooling air to the first turbine stage was included in the analysis and efficiency reductions in the first turbine stage were also accounted for. Further studies on the Humphrey cycle were oriented to investigate different architectures, namely steam injected [
19] and recuperated [
20], as well as the effect of fuel type, specifically hydrogen and dimethyl ether, on cycle efficiency [
21].
Pressure gain combustion is an interesting technology also for gas turbines in combined cycle layout. Based on fundamental considerations and heat and mass balances, Gulen [
22] showed that more than 65% of net thermal efficiency is readily achievable with TITs well below that of nowadays state-of-the-art units. More recently, efficiency improvements for PGC gas turbine combined cycles compared to conventional combined cycles have been reported by Dubey et al. [
23], based on different configurations of the heat recovery steam generator, including one pressure level without reheat, two pressure levels with reheat and three pressure levels with reheat. Further thermodynamic analyses of the gas turbine combined cycle equipped with rotating detonation combustion have been proposed by Dubey et al. [
24], also including gas turbine blade cooling integrated with the bottoming cycle [
25].
1.2. Aim and Novelty of the Work
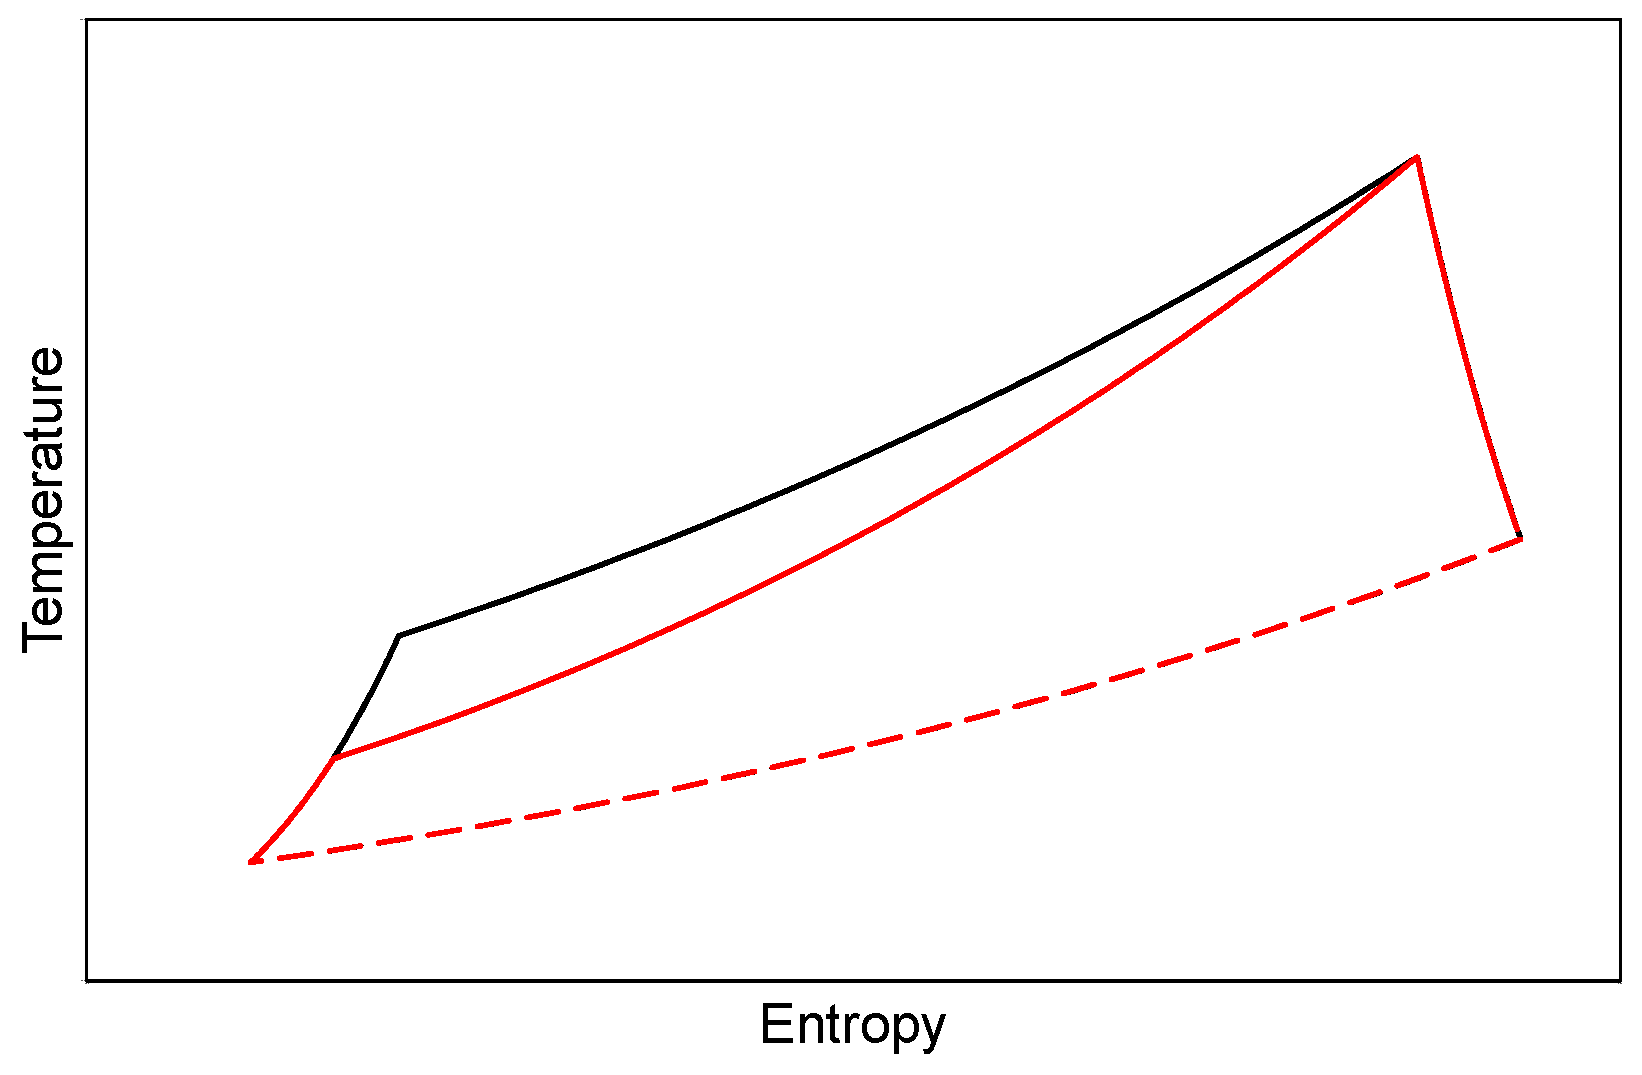
The present work deals with pressure gain combustion applied to a gas turbine in combined cycle layout. In detail, referring to a large-size F-class gas turbine for land-based power generation as the reference case, this work investigates the effects of pressure gain combustion as a solution to reduce the load at the compressor. Differently from the schematic cycle shown in
Figure 1, the compressor pressure ratio is not fixed and depends on the pressure gain at the combustor. The calculations are performed by simulating the GT expander with almost the same assumptions as the reference case (see
Figure 2). Such a choice, rather than increasing the turbine inlet pressure at the same compressor pressure ratio as schematized in
Figure 1, is justified for two main reasons.
Feasibility: the GT expander operates under the same conditions as the reference power plant, simplifying implementation. In a multi-stage axial compressor, typical of gas turbine engines, achieving a lower pressure ratio is straightforward by eliminating one or more high-pressure stages.
Maximum efficiency in combined cycle mode: assuming a fixed TIT, increasing the turbine inlet pressure reduces the turbine outlet temperature (TOT). While this improves the efficiency of a simple GT cycle, it is detrimental to a combined cycle, since the latter benefits from converting the heat released in the gas turbine exhaust into work. Typically, the efficiency of a combined cycle is optimized at the pressure ratio that maximizes the specific work of the gas turbine, which is typical in single-shaft heavy-duty gas turbine design.
Reducing the pressure ratio of the compressor because of the pressure gain at the combustor requires the introduction of an air boosting system to properly feed, at the right pressure level, the blade cooling circuits at the GT expander. In addition, when dealing with advanced gas turbine systems, thermal load management is not limited to turbine blade cooling only, since also combustor walls, disks, and external casing require extensive cooling. Although thermal loads in PGC devices are potentially manageable, their impact on performance may be serious. Paxson and Perkins [
26] formerly indicated that nearly one half of the ideally possible specific fuel consumption reduction may be lost due to cooling. However, based on the authors’ knowledge of open literature about PGC cycle studies, Purushothaman et al. [
27] are the only researchers who attempted to include the problem of combustor cooling into cycle simulations of gas turbine layouts with pressure gain combustion. As a matter of fact, they assumed a fixed fraction of air delivered by the booster to the combustor of a PGC gas turbine for propulsion applications. On the other hand, an original parametric analysis of the amount of coolant to the combustor is carried out in the current work, in order to present a better assessment of the effects of thermal management on the overall PGC cycle performance. Ultimately, based on the open literature about supersonic turbines downstream of a rotating detonation combustor [
28,
29,
30,
31], the parametric analysis of the PGC cycles is revised after taking a reduced efficiency of the first stage of the GT expander into account.
2. Combined Cycle Modeling
The power cycles investigated in this work are simulated by using a proprietary software developed by the Gecos Group at Politecnico di Milano, known as GS (‘Gas Steam’). GS is a modular simulation software designed for assessing the energy balance at the design point of various plant configurations [
32,
33,
34,
35,
36,
37], representing them as networks of components, including expanders, combustors, compressors, heat exchangers, mixers, splitters, etc. The software iteratively solves the mass, energy balances, and constitutive equations of each component until the design specifications imposed by the user are met, reaching stable convergence. While extensive explanations and validations of the simulation software can be found in previous works from the research group [
32,
38], this section provides an overview of its main features.
The GS software adopts the ideal gas model for all gas mixtures and assumes a 0-D model for the compressor, where the average polytropic efficiency is evaluated based on the size parameter. The combustor is modeled as a full conversion reactor, ensuring the complete combustion of fuel species into H
2O and CO
2. The cooled expander, a component with a significant impact on modern gas turbine performance, is modeled using the 1-D approach proposed by Chiesa and Macchi [
32]. This model enables the calculation, row by row, of geometric, aerodynamic, and thermodynamic characteristics of the streams and incorporates a physical approach to model the cooling system. Film cooling, enhanced heat transfer surfaces (ribs), and Thermal Barrier Coating (TBC) are also considered in the model. The GS software is, therefore, able to correctly evaluate the heat transfer phenomena that occur following the modification of the composition of the working fluid, making consistent estimates on the mass and energy balance of the gas turbine. As documented in previous works [
32,
38,
39], the turbine model has been validated for various commercial advanced large-size heavy-duty gas turbines.
For evaluating the performance of PGC cycles, the study focuses on F-class gas turbines. Actually, gas turbines of less recent classes persist in the market because, benefitting from technological improvements, they offer reliable solutions for lower power capacity compared to the advanced classes. Although these machines are less efficient than the most recent H-class gas turbines, they are potential candidates for the introduction of PGC technology because of the following:
It is essential for the purpose of the current work that simulations predict accurately the performance of both gas turbines and combined cycles. In detail, reference to five commercial gas turbines of three different manufacturers, namely Ansaldo Energia, GE Vernova and Siemens Energy, as listed in
Table 1, is made. Design parameters and performance specs are taken from the Gas Turbine World Handbook [
40] and checked against websites of the respective manufacturers. The current approach for the calibration of the gas turbine model is the same as already adopted in a previous work [
32]. All the parameters included in the gas turbine model have been divided in two sets. The first set includes parameters fixed according to the authors’ best knowledge (see
Appendix A). On the other hand, there are parameters that are not usually declared by the manufacturers, such as the turbine inlet temperature. In particular, this parameter has been varied to match the TOT. In detail, GS simulations were run by imposing the number of turbine stages, pressure ratio, and exhaust mass flow rate.
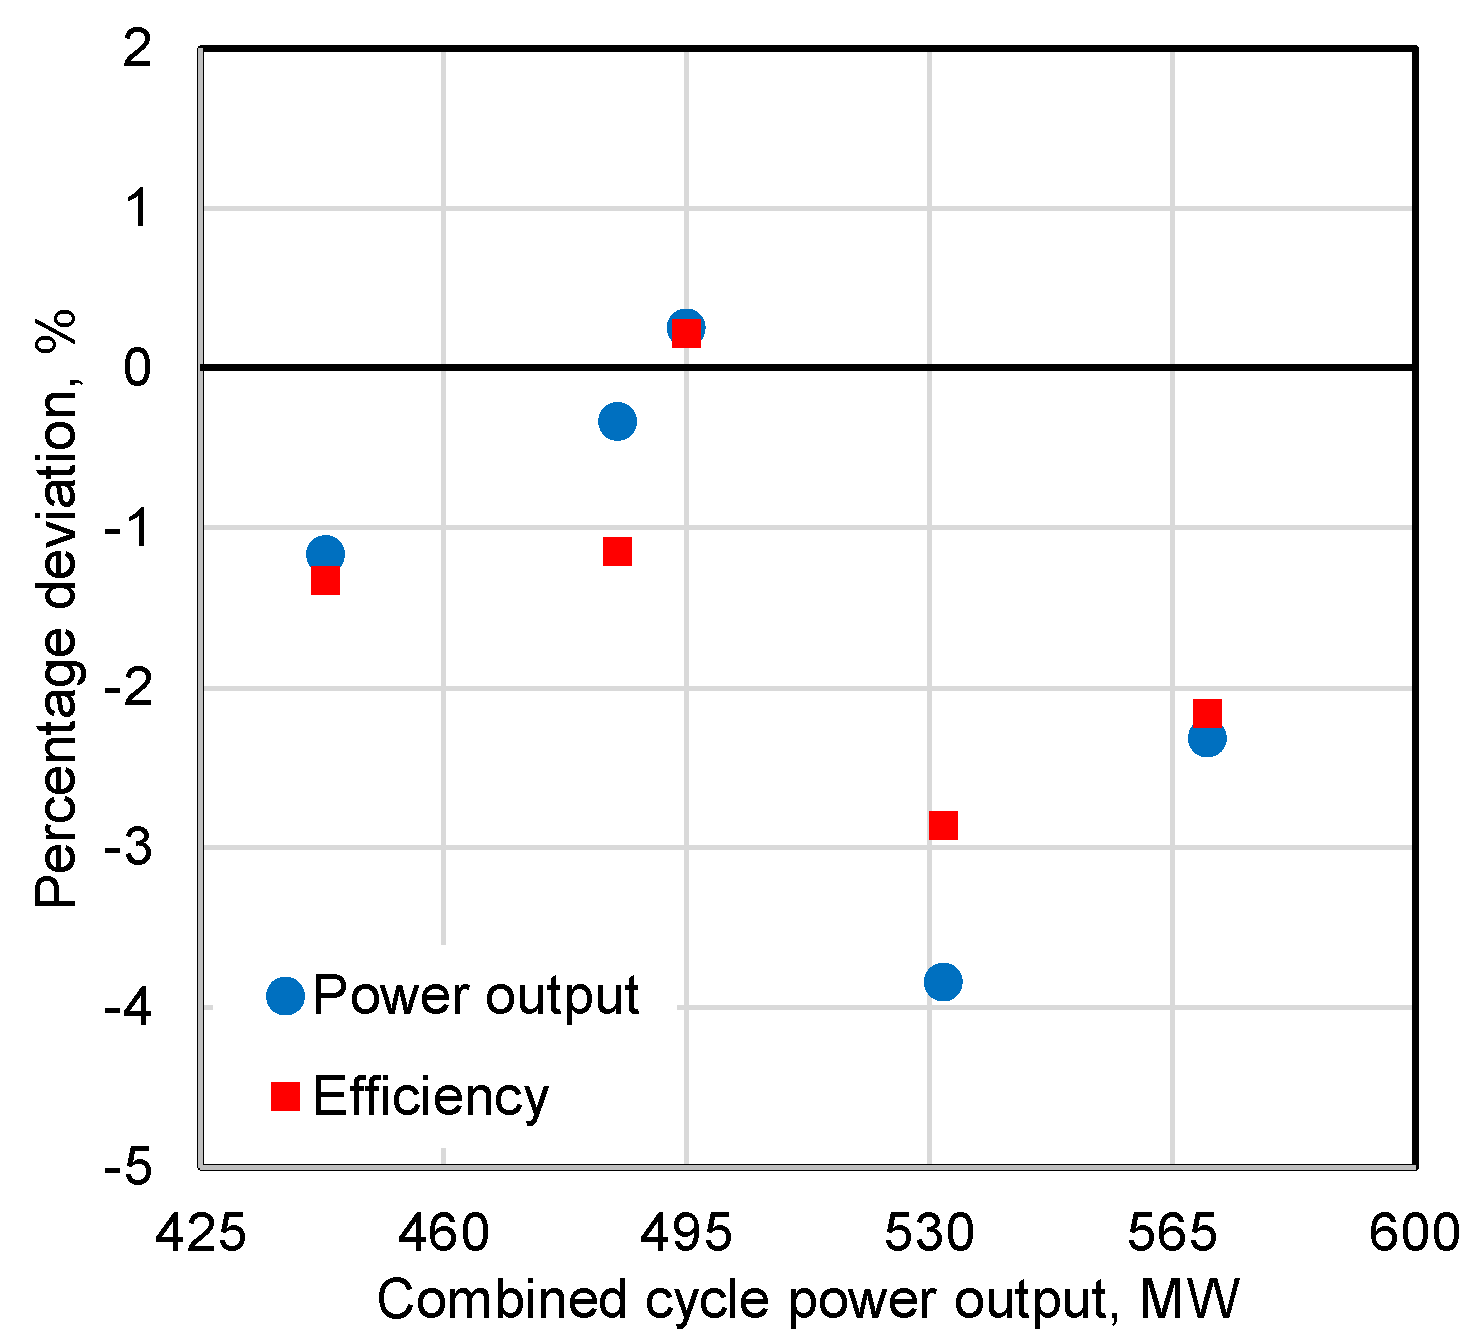
Results of the validation are summarized in
Figure 3 and
Figure 4 that provide the percentage deviation between GS estimation and manufacturers data for power output and efficiency in simple and combined cycle operations, respectively. Dots in the figures are randomly scattered around the zero value to conclude that the sets of assumptions allow a realistic description of the technological level of the F-class gas turbines.
Figure 5 shows the turbine inlet temperature (TIT), i.e., the total temperature of the gas at the inlet of the first GT expander rotor, to match the outlet temperature declared by manufacturers. In particular, an average value of 1430 °C has been assumed to be representative of the F-class technology. Such a TIT, along with the main design parameters reported in
Table 2, have been used to assess the GT performance in both simple and combined cycle operations and adopted as reference in the current work.
Assuming that the pressure at the inlet of the GT expander remains unchanged compared to the reference case, the performance of a combined cycle with pressure gain combustion in the gas turbine is evaluated. Thus, PGC potential is accounted for by reducing the pressure ratio of the compressor (see
Figure 2).
From a computational standpoint, rotating detonation combustion is modeled as a device that increases flow pressure while maintaining the enthalpy balance of the component. The main challenge for steady state performance simulations is to infer the combustor pressure ratio, which lies between a purely isobaric and ideal isochoric change in state [
14]. Actually, the results of a parametric analysis of different pressure gain values are presented in the next section, since the current work does not integrate a specific modeling of the PGC system into the power cycle simulation tool. In detail, reference is made to
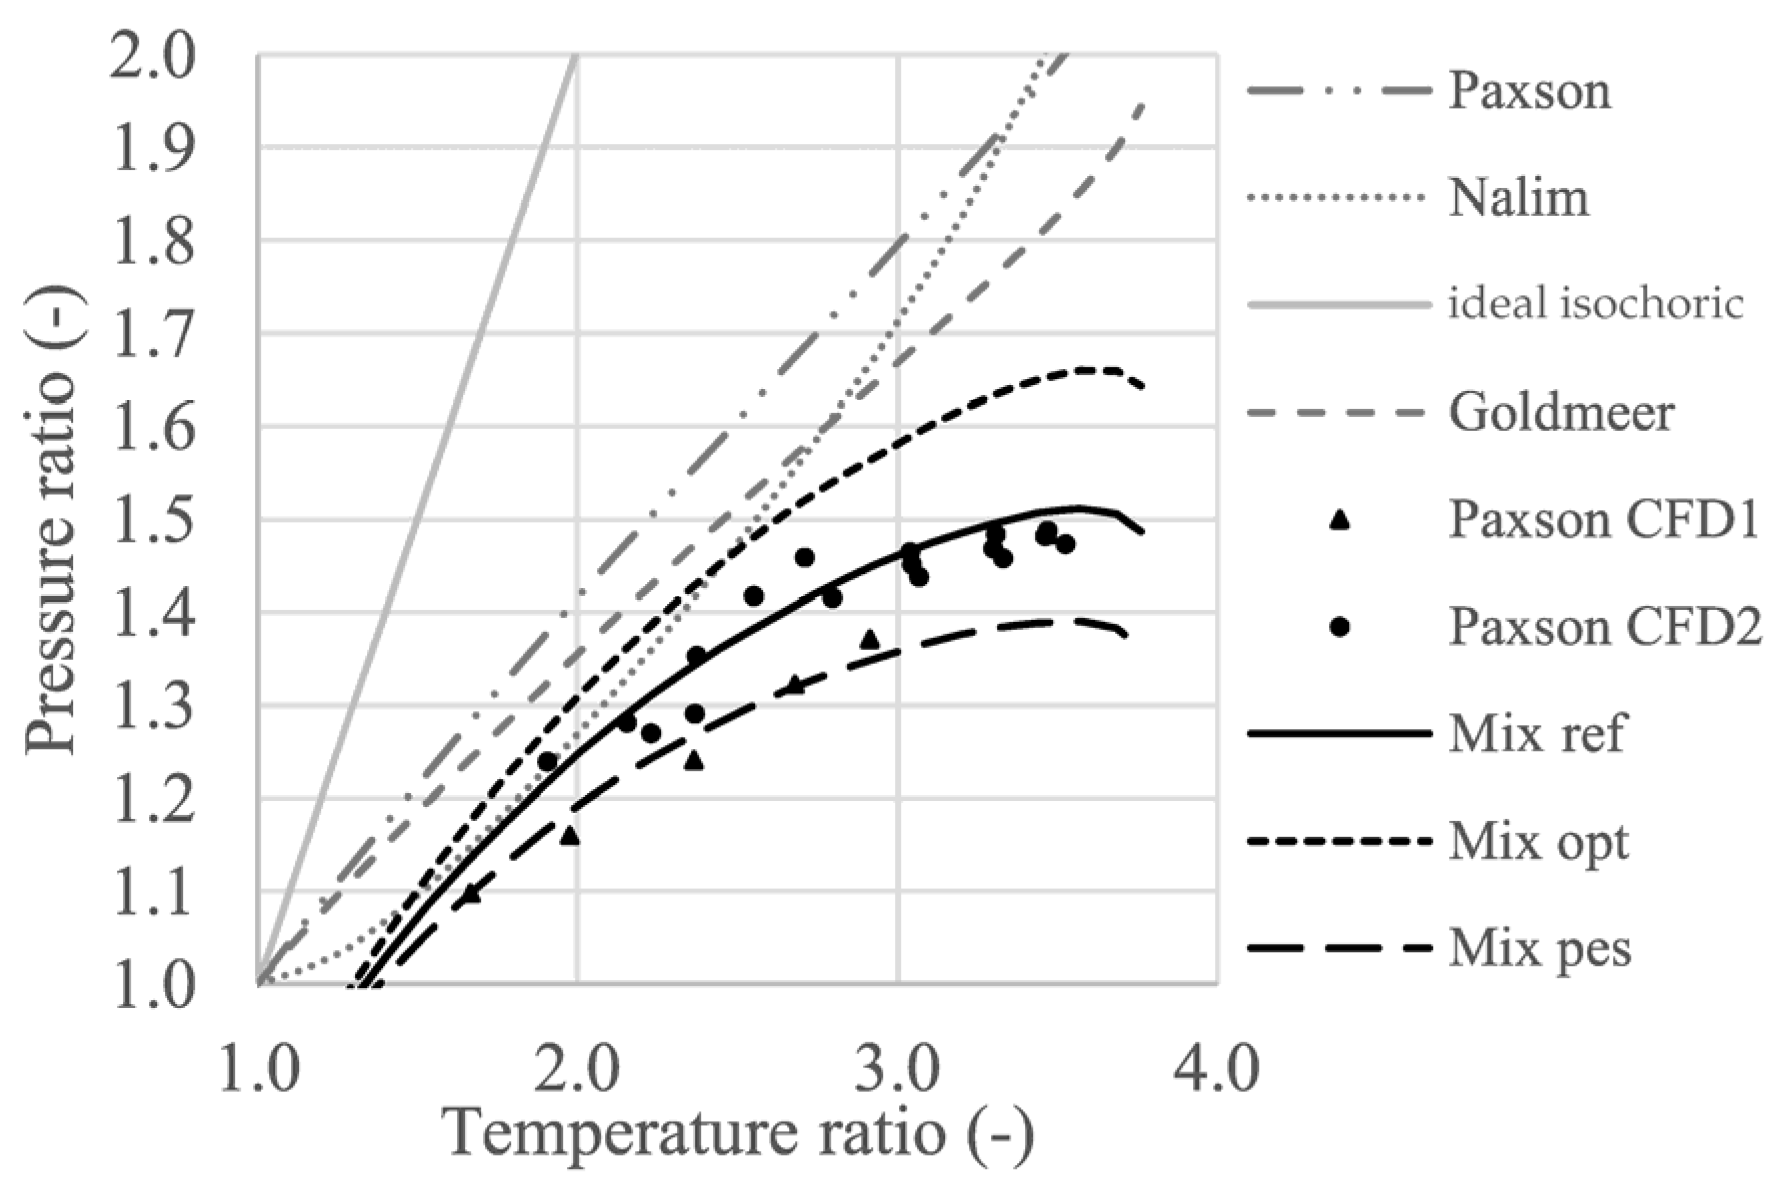
Figure 6, where pressure ratio vs. temperature ratio in the PGC system is reported according to a few models, including the results of the ‘Mix’ model by Neumann et al. [
14,
15], matching data published by Paxson [
11]. Both pessimistic and optimistic versions for the ‘Mix’ model proposed by Neumann et al. [
14,
15] are also included in
Figure 6, suggesting to set the limit pressure gain value for the next parametric analysis at 65%.
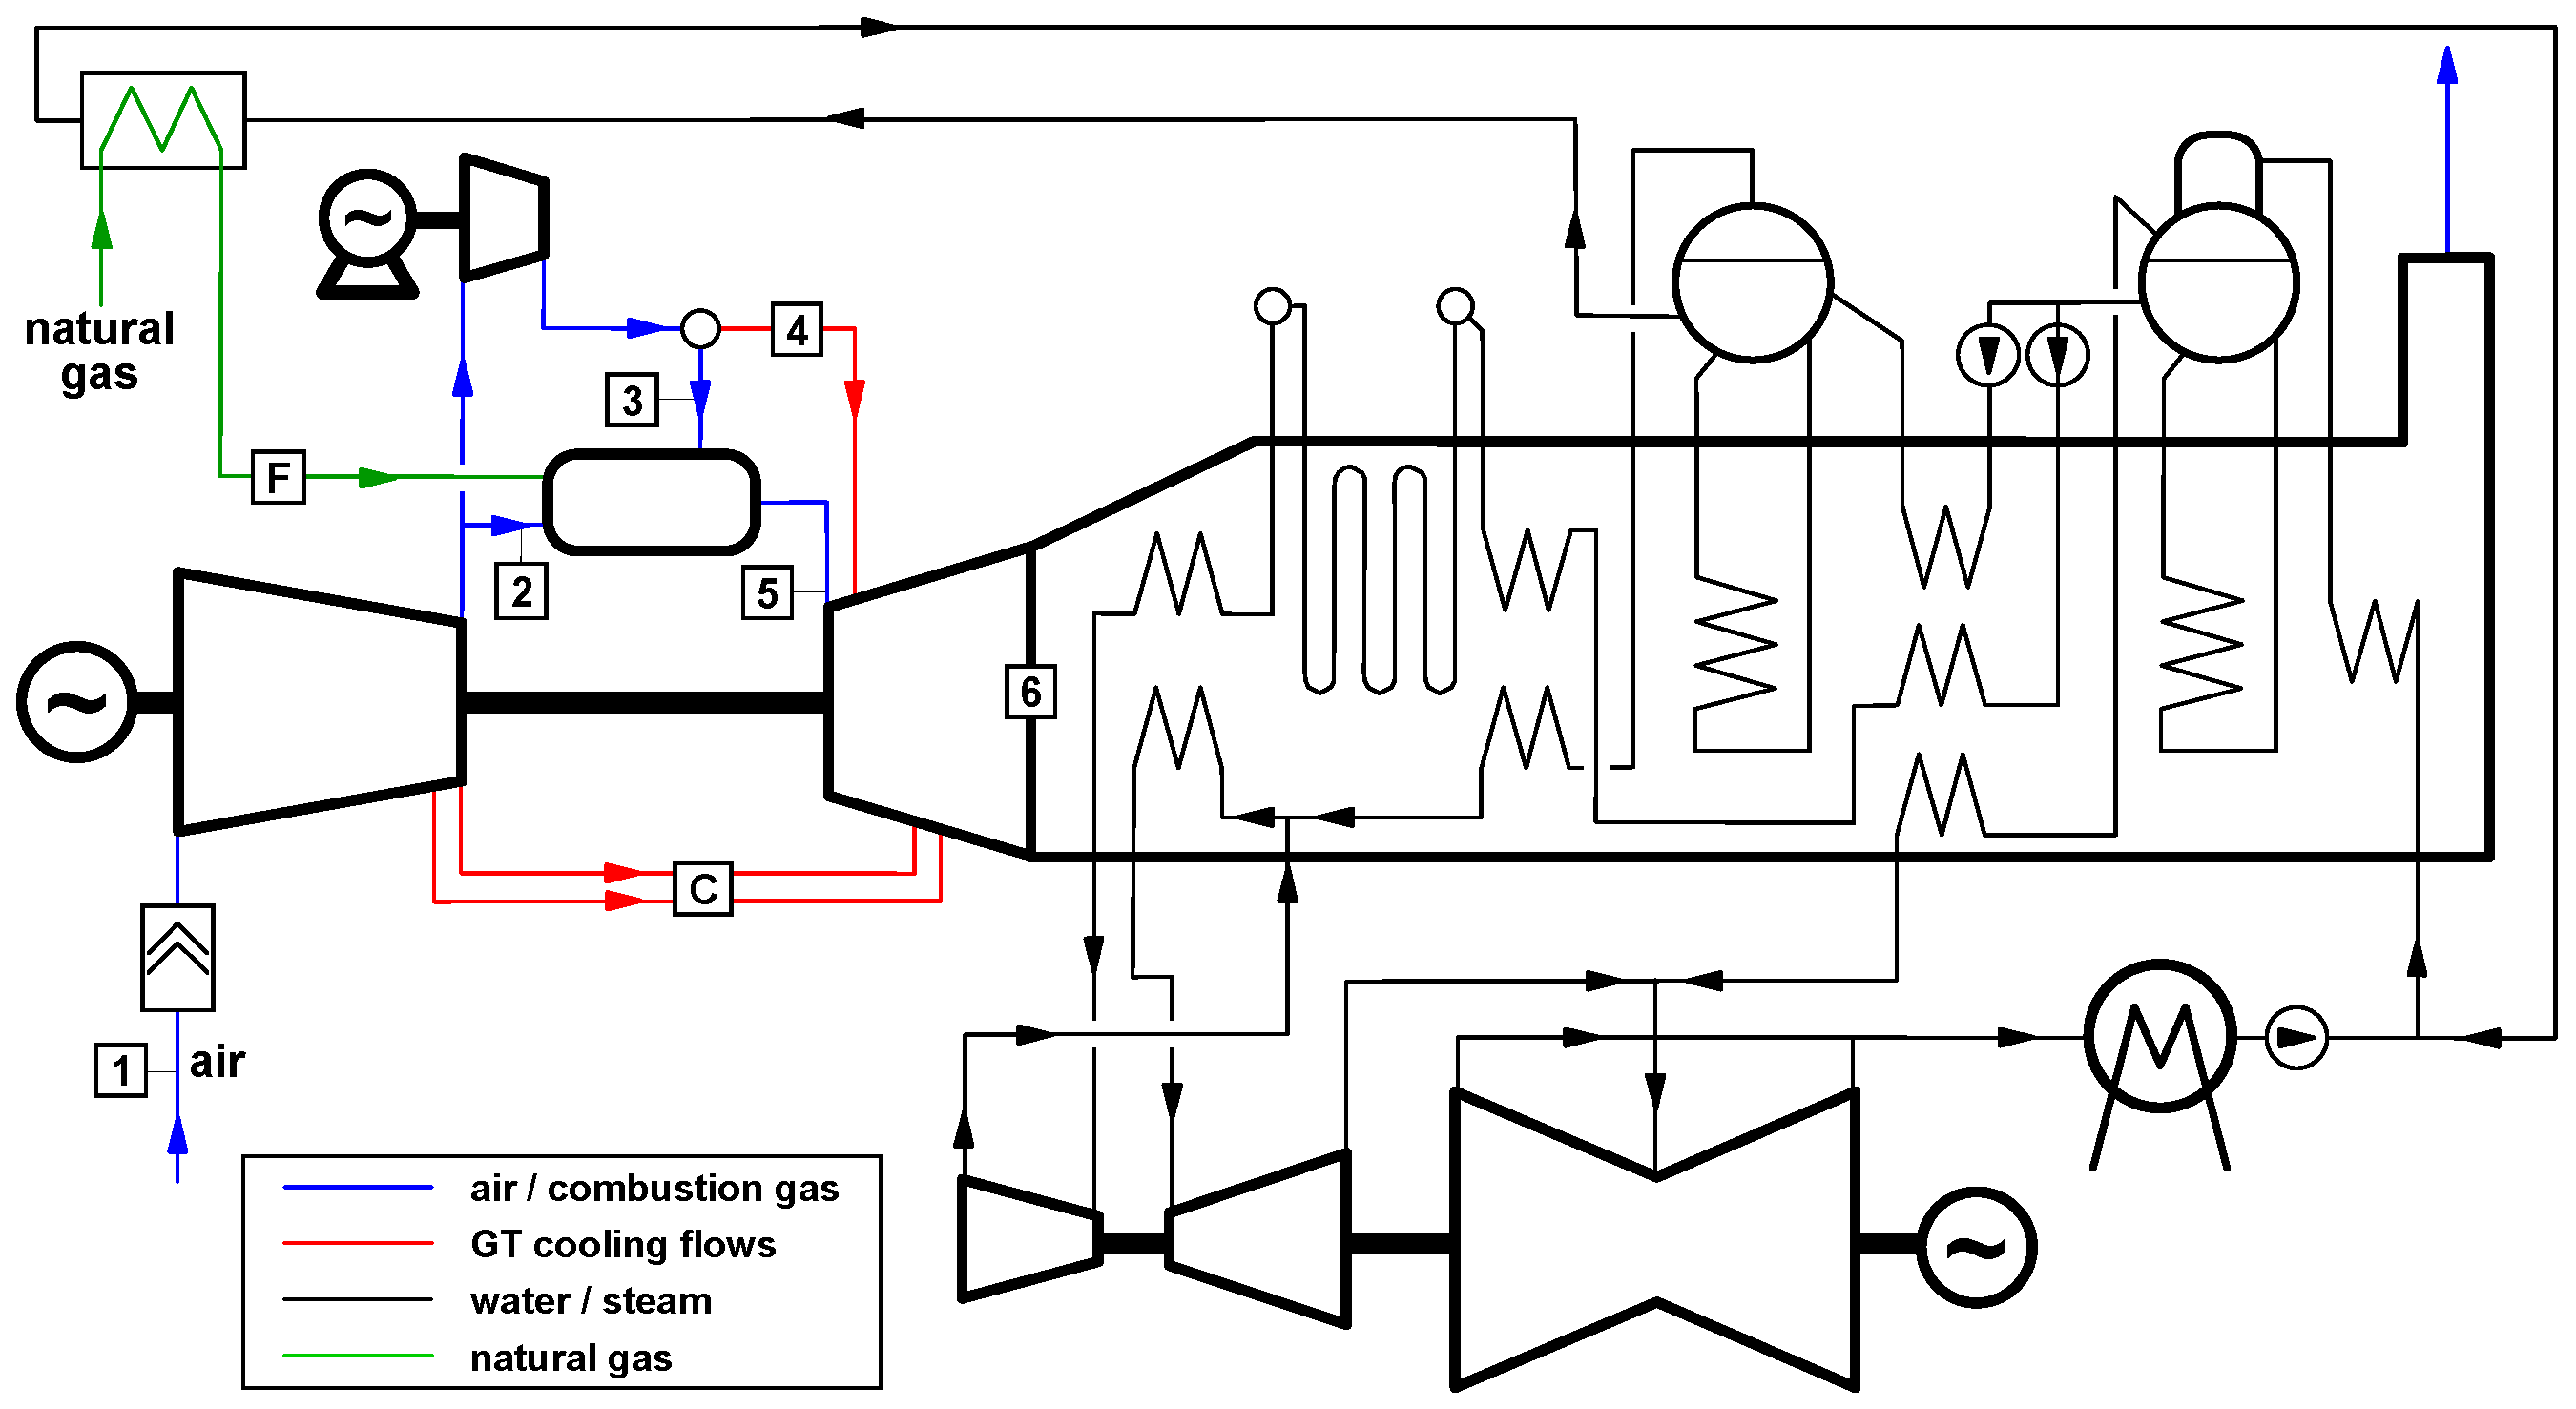
The pressure increase achieved in the PGC system necessitates modifications compared to traditional systems, as illustrated in the plant flow diagram in
Figure 7. The air pressure at the main compressor outlet is insufficient for cooling the hottest sections of the GT expander. Consequently, a booster compressor is introduced to elevate this flow (denoted as #4 in
Figure 7) to an adequate pressure. This pressure is assumed to be equal to 19.11 bar throughout the simulations, matching the compressor outlet pressure of the reference GT cycle. An isentropic efficiency of 80% is considered for the booster compressor, regardless of its size and pressure ratio.
The flow processed by the booster compressor also includes an additional portion (stream #3 in
Figure 7) for ensuring the cooling of the combustor. This stream is necessary for a technical reason and eventually mixes with the main stream. As a matter of fact, diluting the main flow rate is necessary to reduce the temperature at the exit of the rotating detonation combustion and to align it with the target TIT. According to a constant TIT, the temperature at the exit of the rotating detonation combustion rises in case of larger dilution flow rates. This potentially enhances the pressure gain, which rises with the temperature ratio in the combustion process (see
Figure 6).
From a computational standpoint, the specific mass flow rate of stream #4 in
Figure 7 is calculated based on the cooling requirements at the nozzle of the first stage of the GT expander, with the same approach adopted for the reference case (conventional gas turbine) [
32], whereas stream #3 depends on the cooling requirements of the combustor. In particular, four cases are analyzed in the following: the first with no cooling at the combustor, as already investigated by other researchers [
15,
16,
17,
18,
19,
20,
21,
22,
23,
24,
25], who considered only turbine blade cooling, and three cases with increasing air flow rate as reported in
Table 3. In detail, the parametric analysis considers air flow rate for combustor cooling up to a value of 30% as the fraction of overall air entering the PGC system, i.e., stream #2 plus stream #3.
3. Results and Discussion
The results of the PGC cycles are presented in this section starting from the topping cycle, i.e., the gas turbine exploiting PGC technology.
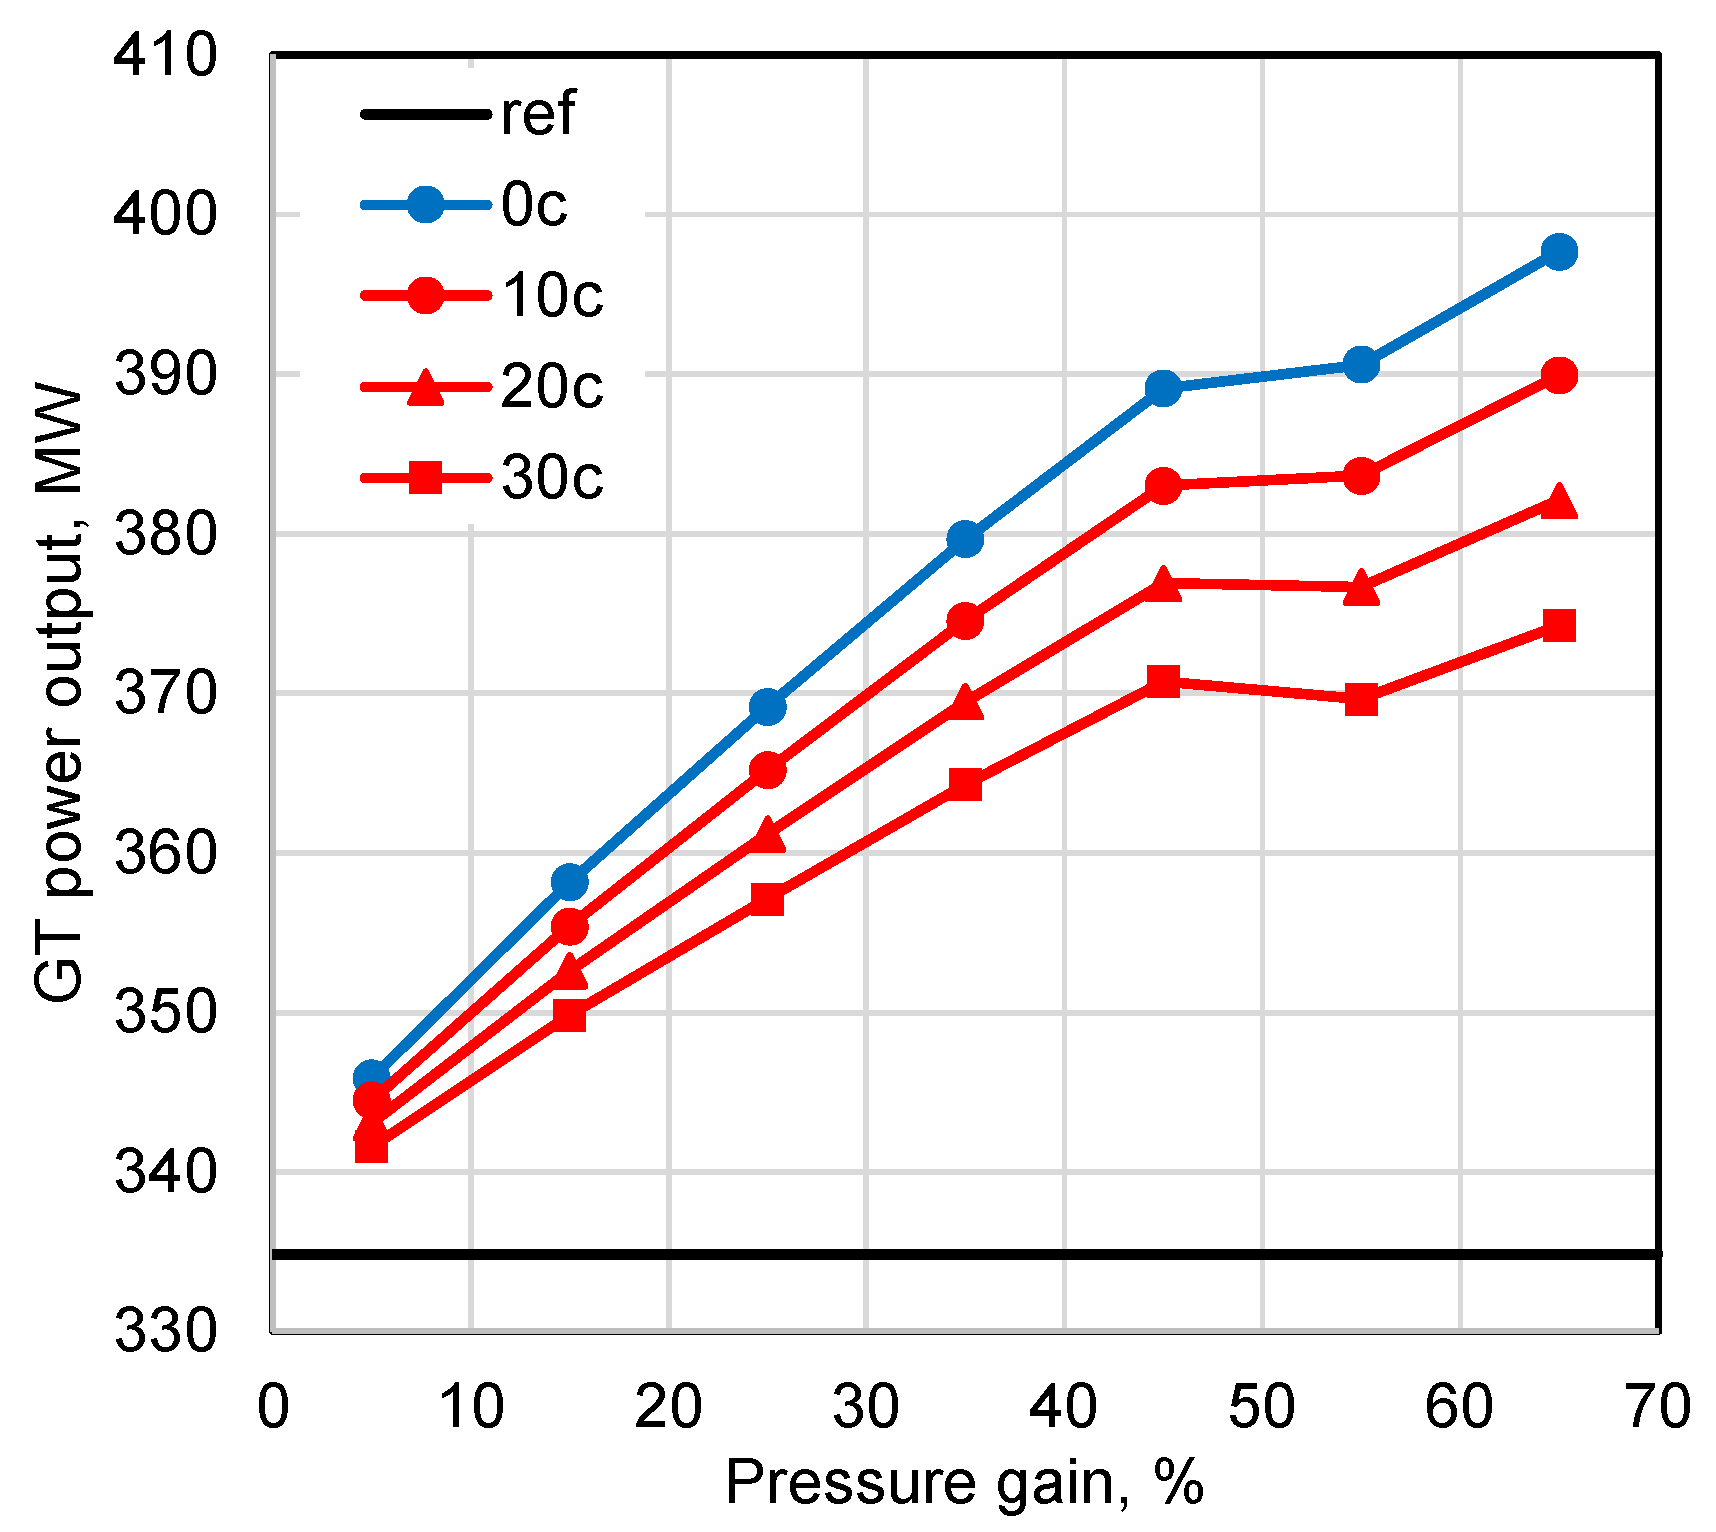
Figure 8 shows power output for five cases, namely the reference F-class gas turbine with deflagrative combustion and four PGC cycles with different amounts of coolant to the combustor (see
Table 3). Regardless of the pressure gain value, the potential of PGC technology is clear and the trends are justified by considering that the higher the pressure gain during combustion, the lower the load of the main compressor (see
Figure 2). However, the higher the pressure gain, the heavier the duty of the air booster, though this is not seriously detrimental to overall GT performance.
When looking at
Figure 8 for high pressure gains, improvements in GT performance are initially clear, then a singularity is significant for PG higher than 45%. Based on the calculation assumptions for the GT expander, almost around 650 MW of gross power is calculated, so attention is to be paid to the duties of the two compressors.
Figure 9 shows the higher the pressure gain, the lower the power required by the main compressor, as expected. In detail, the pressure ratio of the main compressor results as low as 11.9 in the case with PG = 55% but, for this specific case, the air pressure at the outlet of the main compressor is not sufficient for cooling the rotor blades at the first stage of the GT expander. As a matter of fact, the cooling air experiences pressure drops through the channels inside the blades, so the resulting pressure before mixing with the main gas stream in the GT expander may be lower than the pressure of the main gas stream. In the case with PG = 55%, the booster compressor must supply high-pressure air for blade cooling not only to the first stator but also to the first rotor of the GT expander. These considerations may be obviously repeated for PG = 65%. Thus, a steeper increase in compression power for the air booster is calculated when switching from PG = 45% to PG = 55% because of delivering cooling air also for the rotor blades at the first stage of the GT expander. This result is evident whether the booster delivers air only for blade cooling or whether it also delivers air for combustor cooling.
The calculated temperature ratio (TR) values at the combustor span in the ranges 2.77–3.33 and 2.82–3.40 for pressure gains of 35% and 45%, respectively. The lower TR value refers to case 0c, whereas the higher TR value refers to case 30c, then it is possible to draw an horizontal segment in
Figure 6 and realize if the corresponding PG value is sufficiently reasonable based on those literature models. According to the results in
Figure 6, it is possible to realize that 35% and especially 45% are reasonable pressure gains that seriously improve the performance of the gas turbine with an extra power generation compared to the reference case. This result is achieved mainly thanks to compression power saving: even considering the most severe case (30c) in
Figure 8, around 35 MW more than the reference gas turbine are possible. However, based on the results in
Figure 8, the PGC advantage could be even more optimistic. According to the calorimetry tests on a water-cooled rotating detonation engine (RDE) by Theuerkauf et al. [
41], the heat transferred to the combustor walls was 8–15% of fuel LHV. An air-cooled design was even proposed by Naples et al. [
42] for a rotating detonation engine developed and deployed into an Allison T63 gas turbine environment. Through various heat transfer models and hot wall tests, heat transfer rates in the air-cooled RDE system were lower than in water-cooled RDE, due to reduced temperature differential between the detonation gases and channel walls. In this regard, the air flow rate processed by the booster as stream #3 in
Figure 7 to the combustor serves for wall cooling as well as for combustion gas dilution. The larger this flow rate, the higher the temperature ratio at the combustor (see
Figure 6), which is convenient to increase the pressure gain but penalizing for the heavier duty of the booster. Considering the amount of air related to stream #3 for cases 10c and 20c in
Figure 8, as well as the final temperature of stream #5 exiting the combustor, an overall heat transfer is calculated as 8.24% and 16.60% of the fuel LHV, respectively. These values for the overall heat exchange are calculated based on the product of the mass flow rate delivered by the booster and the air enthalpy rise up to the combustor outlet temperature. The related heat for case 30c is even higher, as 25.85% of the fuel LHV. These figures are reported to highlight the heat duty related to the cases included in
Table 3, even though a correspondence with other studies [
41,
42] may be misleading as the current calculations for stream #3 include both combustor cooling and combustion gas dilution.
Before considering and realizing the advantage in terms of GT efficiency,
Table 4,
Table 5 and
Table 6 report details of the main streams in
Figure 7 regarding the gas turbine. Three specific cases are considered, namely the reference gas turbine, for due comparison, as well as two PGC cycle cases, (PGC set at 45%): one without cooling air to the combustor (case 0c) and another with the most extensive cooling (case 30c). Looking at the results in these three tables, the following differences are worth of attention.
The air booster has to process a significant flow rate in case 30c, since it is more than 5 times larger than in case 0c. The procedure for centrifugal compressor preliminary sizing proposed by Aungier [
43] is adopted in order to have an idea of the driving speed and the dimensions of this turbomachinery. Looking at the data in
Table 6 for case 0c, a single-stage centrifugal compressor running at around 9000 rpm and with an impeller diameter of ≈77 cm is a possible architecture. On the other hand, by dividing the entire flow rate to be processed in half, a double entry centrifugal compressor running at around 5500 rpm and with an impeller diameter of ≈125 cm is a possible architecture for case 30c. Actually, a single-entry solution is always possible but considering the large flow rate specific of case 30c, a mixed-flow architecture is necessary, with an impeller diameter of ≈70 cm running at around 11,500 rpm.
Stream #4 is extracted at the compressor outlet for the reference GT case, so temperature and pressure are the same as for stream #2. As for cases 0c and 30c, the temperature is slightly higher due to the lower efficiency of the air booster compared to the last stages of the main compressor in the reference case.
The air stream delivered by the main compressor for both cases 0C and 30c is colder than in the reference case, due to the lower pressure ratio. Thus, a slightly larger fuel input is necessary for the same energy balance at the combustor with the fixed TIT at the GT expander. In this sense, the GS software returns really slight differences for stream #5 at the inlet of the GT expander as for mass flow rate and composition.
Stream #6 also accounts for air leakages at the main compressor.
In detail, because of the fuel input generally increasing with the PG value, an elementary difference in power outputs as shown in
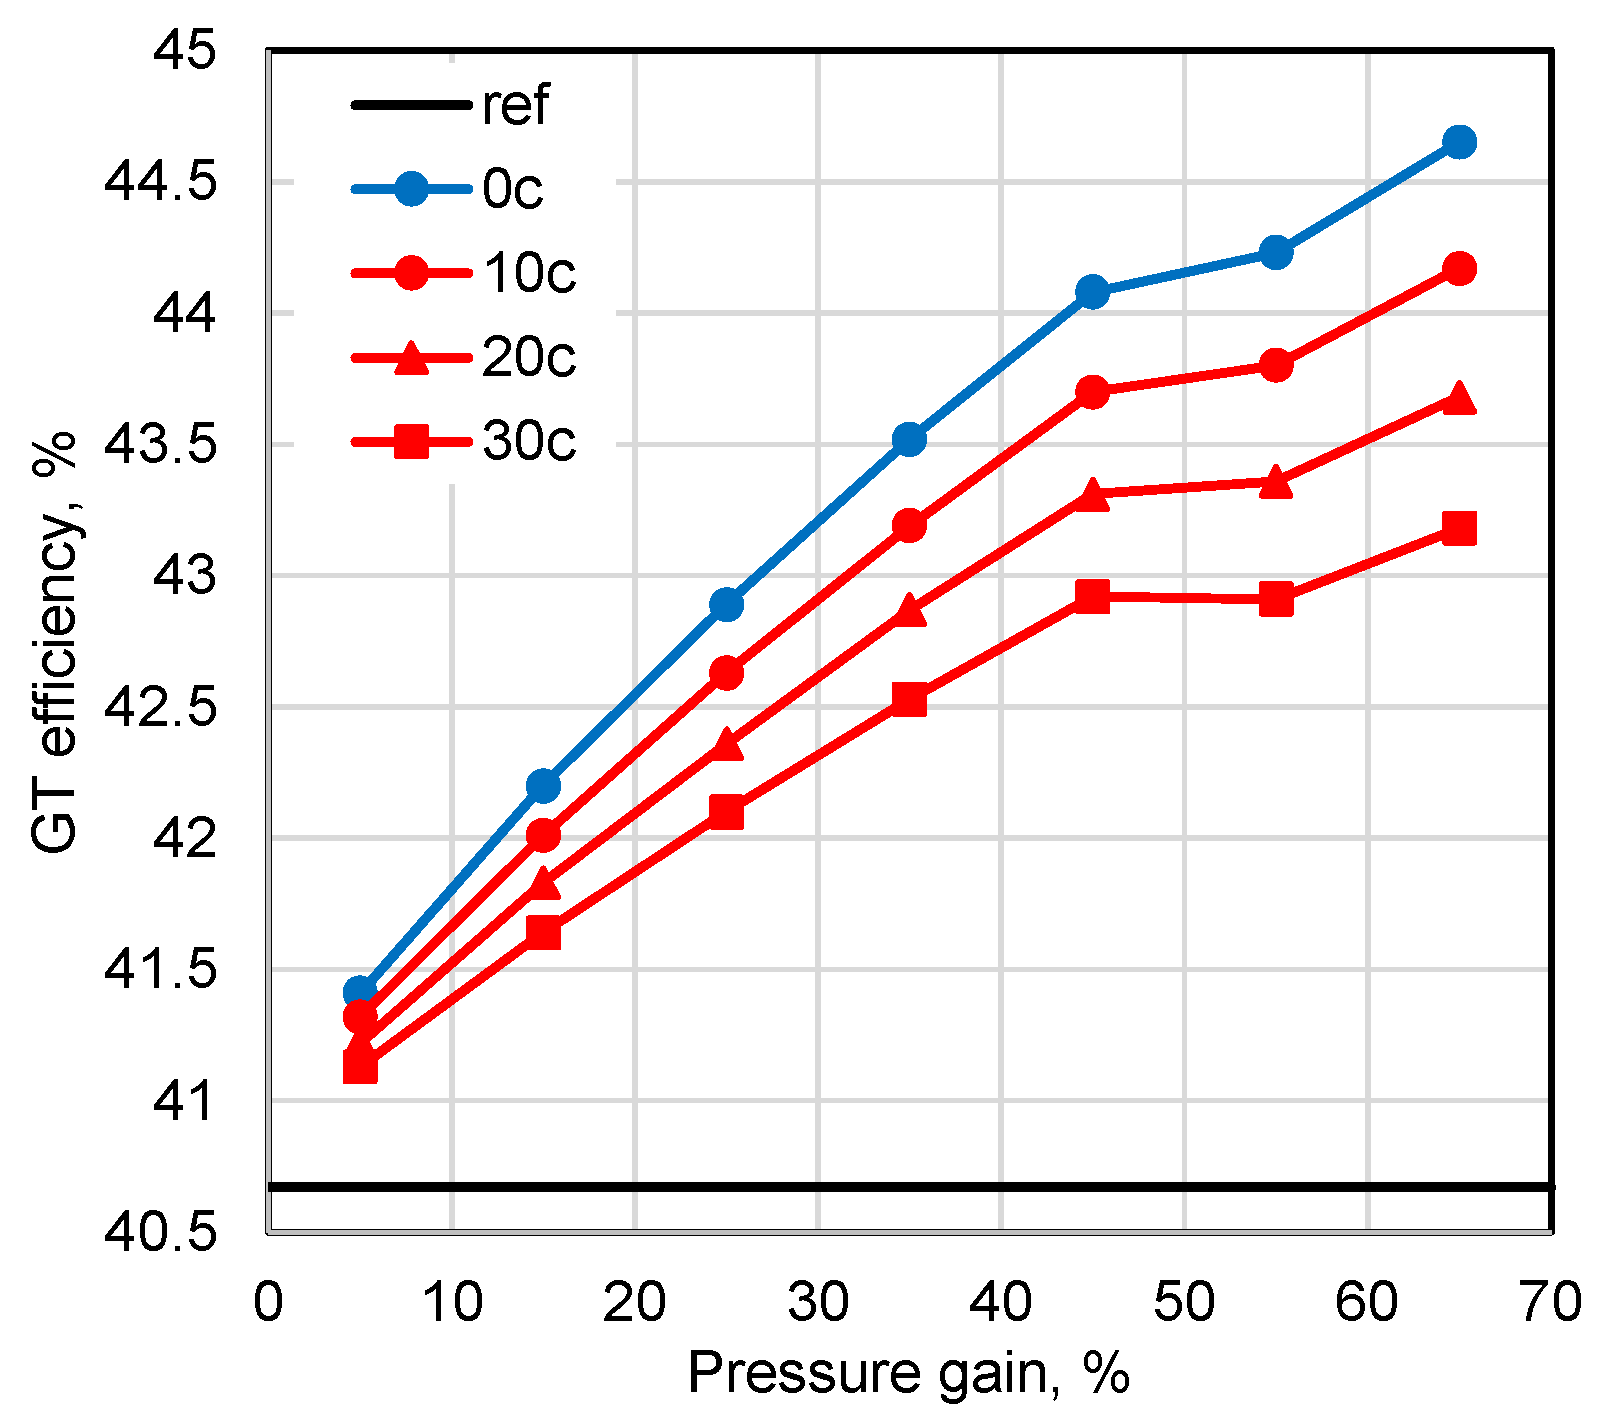
Figure 8 may be misleading for a fair comparison between the investigated cycles. Thus, the calculated GT efficiency values, correctly taking the actual fuel demand into account, are reported in
Figure 10, where trends similar to the ones for GT power in
Figure 8 are clear.
Focusing on the combined cycle results,
Figure 11 shows the same trend anticipated in
Figure 10. As a matter of fact, based on the calculation assumptions for the GT expander, the power output at the bottoming cycle is almost unchanged. Thus, focusing on a PG value of 45%, an extra power output in the range of around 35–55 MW is calculated, depending on the amount of coolant for combustor cooling, and available at the gas turbine shaft. The calculated net efficiency obviously rises, but the advantages compared to the gas turbine only are reduced: a difference of 1.4–2.3% in the case of PG = 45% is clear compared to the reference case.
In order to look at the potential advantages of pressure gain combustion for gas turbines and combined cycles from a second law of thermodynamics point of view, exergy losses are also calculated by means of the GS software. In detail, results of exergy losses referring to the cases 0c and 30c with PGC equal to 35% and 45% are reported and compared to the reference case in
Table 7.
As expected, the exergy losses related to the combustion process are the largest for all the power cycles, but the ones for the PGC cycle cases are always lower compared to the reference case. In particular, results in
Table 7 highlight that higher pressure gains reduce the exergy losses related to combustion. The effects of air flow rates for combustor cooling in the PGC cycle cases are clear with slight variations throughout all the exergy losses, even though the same loss is calculated for the exergy rate at the gas stream exiting the heat recovery steam generator.
The accuracy of the PGC GT cycle analysis depends largely on the degree of the assumptions in the modeling stage. Thus, as long as the calculation assumptions are the ones adopted in this analysis, results in
Figure 8,
Figure 9,
Figure 10 and
Figure 11 as well as
Table 7 highlight PGC technology is an effective solution for raising gas turbine performance, then also for combined cycles.
When referring to the rotating detonation engine as a solution for realizing the PGC concept, a detonation wave rotates and propagates around the perimeter of an annular combustion chamber to achieve the pressure increase. However, conventionally designed turbines are inadequate to expand the transonic/supersonic and fluctuating gas stream exiting such a PGC system. In this context, a transition duct connecting the combustor to the first stage of the GT expander would allow for a more efficient expansion [
45,
46,
47], even though the design of an efficient turbine is a very complex task [
28,
29,
30,
31]. In particular, based on a preliminary design of a supersonic turbine, Mushtaq et al. [
30,
31] revealed that expansion efficiency values over 70% are possible. In detail, a variable stator blade height design allows choosing lower reaction degree and higher peripheral velocity designs [
30]. Opposite to common subsonic turbine design, the lower the reaction the higher the efficiency, as the result of a reduction in rotor shock losses backed by a higher work generation when the reaction degree is lowered. In order to highlight that a variable blade height geometry, compared to a constant-span configuration, is necessary to guarantee a higher efficiency, an in-house code was adopted to search for the optimal endwall shape for these unconventional machines [
31]. Actually, the optimal shape reduces shock losses and deviation angles and provides a significant gain in both efficiency and work extraction.
Actually, referring to other works about thermodynamic analysis of gas turbine combined cycles with pressure gain combustion [
18,
23], there is evidence of considering reduced efficiency for the first stage of the GT expander. On the other hand, further efficiency reductions in the second and next stages of the GT expander can be neglected, as the pulsations from the PGC system outlet are mostly attenuated within the first expansion stage [
48,
49]. Thus, new simulations have been run in order to take reduced efficiency at the GT expander into account. In detail, the cooled GT expander modeling in the GS software has been revised to introduce a fixed penalty: compared to the isentropic efficiency value (90.55%) of the first stage, as calculated for the F-class gas turbine assumed as reference case, a reduction down to 70% has been set.
Based on the previous results shown in
Figure 8, power output improvements for the gas turbine may be a misleading result, as slightly larger fuel amounts are necessary for the PGC cycle cases compared to the reference, so attention should be paid to other performance figures. In particular,
Figure 12 shows the new calculated GT efficiency for the PGC cycles in the case of a penalty in the efficiency of the first stage of the GT expander. Three amounts of coolant at the combustor are always considered, along with a PGC cycle case with no coolant to the combustor. In detail, when considering the reduced efficiency at the first stage of the GT expander (70% vs. 90.55%) and referring to a PG value of 35–45%, a first glance at
Figure 12 suggests no actual GT efficiency improvement compared to the reference case when an extensively large cooling at the PGC system is necessary. This result clearly suggests not only further research efforts oriented to turbine design for the highest possible efficiency, but also solutions of effective cooling techniques for reducing the heat transfer to the combustor walls substantially [
50]. As a matter of fact, based on the results in
Figure 12, the combination of lower expansion efficiency at the GT expander with extensive cooling requirements at the combustor risks nullifying the potential advantages of PGC.
In regard to the overall CC performance in terms of net electric efficiency,
Figure 13 shows the ultimate results of the new revised analysis. Compared to the efficiency of the gas turbine only, slight improvements seem to be possible for the CC power plant. As a matter of fact, the temperature of the gas at the inlet of the heat recovery steam generator rises from around 600 °C up to around 615 °C because of the reduced efficiency at the first stage of the GT expander. This result, along with the constant gas flow rate (750 kg/s), reflects on slightly higher power generation for the bottoming cycle. In particular, with a PG value of 45% and a coolant to the combustor at 30%, the reduced efficiency at the first stage of the GT expander brings about a CC power output of 519.8 MW, compared to 494.6 MW of the reference CC case.
Ultimately, a general overview of the overall power balance for a few representative cases selected among the ones calculated in this work is reported in
Table 8. As discussed throughout this paragraph, reference to two values of PGC at 35% and 45% is made, considered as the most significant according to
Figure 6, including the two extreme cases in
Table 3, namely cases 0c and 30c, as well as reduced expansion efficiency at the first stage of the GT expander. In these authors’ opinions, these cases are reasonably indicative in outlining the perimeter of the possible advantages of PGC technology applied to F-class gas turbines, compared to the conventional constant pressure combustion case.
4. Conclusions
This work has presented the results of a parametric analysis of pressure gain combustion applied to a F-class gas turbine for power generation.
The potential of pressure gain combustion for both simple cycle and combined cycle operations has been investigated initially by including the effects of different amounts of air from the booster to the PGC system. Actually, no other work in the open literature about thermodynamic analysis of PGC power cycles has paid the same attention on the effects of thermal management of the combustor, so the results presented in the current work are original. Even considering the most extensive cooling requirements, the GT efficiency increases by 1.85–2.25 percentage points compared to the reference gas turbine in case of pressure gains of 35–45%. However, the CC efficiency improvement is lower, with only 1.25–1.50 more percentage points, mainly related to the almost equal power generation of the bottoming steam cycle.
A revised parametric analysis with more realistic performance of the first stage of the gas turbine expander downstream of the PGC system has been carried out as well. As a matter of fact, a poor turbine efficiency due to the pulsating flow at the PGC system outlet may completely eliminate the ideal performance advantages of pressure gain combustion. In particular, the new results show that the risk of nullifying the potential advantages of pressure gain combustion is real in case of specific combinations of lower expansion efficiency at the gas turbine expander with extensive cooling requirements at the combustor. Focusing on the latter, it is worth underling that the thermal management in PGC combined cycles may be easier than in aero-engine applications, due to steam extraction from the bottoming cycle for, at least, combustor cooling. Actually, steam (i) has superior heat exchange properties compared to air, (ii) is available from the heat recovery steam generator at lower temperatures than air, (iii) can reduce the cooling requirements and coolant pressure loss, and (iv) the recovered heat from cooling can be used to increase the steam turbine power output. Thus, further analyses in the near future are necessary to investigate the effects of such an alternative cooling solution, along with the application of pressure gain combustion to more advanced state-of-the-art gas turbines. However, investigations about possible improvements in the power system are seriously contingent upon the risks related to the PGC technology. As reported in technical literature, particular attention must be paid to the combustion system, due to the challenges in controlling unsteady combustion, potential for noise, vibration, and component fatigue, along with its proper connection with the gas turbine expander for achieving the highest possible efficiency.
