Article

Research on Optimization Method of Operating Parameters for Electric Submersible Pumps Based on Multiphase Flow Fitting

by
Mingchun Wang
1,
Xinrui Zhang
1,*,
Yuchen Ji
1,
Yupei Liu
1,
Tianhao Wang
1,
Zixiao Xing
1,
Guoqing Han
2 and
Yinmingze Sun
2
1
CNOOC Research Institute, Beijing 100028, China
2
College of Petroleum Engineering, China University of Petroleum-Beijing, Beijing 102249, China
*
Author to whom correspondence should be addressed.
Processes 2025, 13(10), 3156; https://doi.org/10.3390/pr13103156
Submission received: 30 July 2025 / Revised: 12 September 2025 / Accepted: 30 September 2025 / Published: 2 October 2025
(This article belongs to the Section Energy Systems)

Abstract

Electric submersible pumps (ESPs) are among the most widely used artificial lifting systems, and their operational stability is crucial to the production capacity and lifespan of oil wells. However, during the operation of ESP systems, they often face complex flow issues such as gas lock and insufficient liquid carry. Traditional control strategies relying on liquid level monitoring and electrical parameter alarms exhibit obvious latency, making it difficult to effectively guide the adjustments of key operating parameters such as pump frequency, valve opening, and on/off strategies. To monitor the flow state of ESP systems and optimize it in a timely manner, this paper proposes an innovative profile recognition method based on multiphase flow fitting in the wellbore, aimed at reconstructing the flow state at the pump’s intake. This method identifies flow abnormalities and, in conjunction with flow characteristics, designs targeted operating parameter optimization logic to enhance the stability and efficiency of ESP systems. Research shows that this optimization method can significantly improve the pump’s operational performance, reduce failure rates, and extend equipment lifespan, thus providing an effective solution for optimizing production in electric pump wells. Additionally, this method holds significant importance for enhancing oil well production efficiency and economic benefits, providing a scientific theoretical foundation and practical guidance for future oil and gas exploration and management.

1. Introduction

In the process of efficient development of oil fields, artificial lifting technology plays a crucial role. Among them, electric submersible pump (ESP) systems have rapidly emerged and developed into one of the most widely used artificial lifting methods in major oil fields, thanks to their excellent lifting capacity, broad adaptability, and flexible adjustment of operating parameters [1]. Compared to traditional lifting methods, ESP systems demonstrate more economic and efficient advantages. Their efficient drainage capability can significantly enhance the production of single wells; moreover, their compact downhole design and good adaptability to complex well conditions (such as highly deviated wells and horizontal wells) provide strong support for cost reduction and efficiency improvement in oil fields [2,3,4].
It is important to note that the ESP system, as a highly integrated and complex electromechanical device, relies on its operational stability to maintain an efficient and reliable lifting process. Any fluctuations or anomalies in the system’s operation can not only directly impact the well’s production capacity, resulting in production losses and decreased economic benefits, but they can also significantly accelerate the wear and aging of critical downhole components (such as motors, protectors, multistage centrifugal pumps, cables, etc.). This poses a serious threat to the service life of the entire equipment and can lead to high unplanned maintenance costs due to downtime.
However, during the actual operation of ESP systems, the downhole multiphase flow environment is complex and variable, with issues such as gas locking and insufficient liquid carry frequently occurring, which severely restricts the efficient and stable operation of the system. Gas locking can lead to the accumulation of gas within the pump, reducing effective displacement and even causing the system to underload and shut down; on the other hand, insufficient liquid carry may result in slug flow or backflow, increasing frictional pressure drops and exacerbating equipment wear. Therefore, diagnosing abnormal operating conditions in electric submersible pump systems is of significant importance.
Current signature analysis is one of the most commonly used techniques for diagnosing faults in electric submersible pumps (ESPs). By comparing the current signature with typical operating conditions, it is possible to diagnose various scenarios in the ESP system, such as pump cavitation, sand production, gas locking, etc. [5].
Hoefel A et al. developed a novel data acquisition (DAQ) system for ESP diagnostics that integrates all available measurement data, variable frequency drive (adjustable control inputs such as voltage, frequency, and surface throttling position) settings, and calculated electrical parameters to diagnose surface equipment, cables, and pumps [6].
Lu et al. employed a portable high-speed electrical signal acquisition tool to collect current signals at a frequency of 10 kHz. They utilized motor current signature analysis (MCSA) techniques to extract fault characteristics from the current spectrum for diagnosing faults in electric submersible pump motors [7].
From previous research, it is evident that faults in electric submersible pump (ESP) systems are frequent, and improving and stabilizing the operating conditions of ESP systems presents a significant challenge. Therefore, it is essential to optimize and regulate the operating parameters of the electric submersible pump in a timely manner.
Currently, the control methods for electric submersible pump (ESP) systems can be mainly divided into two categories: liquid level monitoring through sensors and control through electrical parameter alarm mechanisms.
(1)
Liquid Level Monitoring through Sensors:
Moradeyo Adesanwo et al. developed a warning system for the automated estimation and optimization of electric submersible pump (ESP) system parameters. The workflow of this system integrates surface controller data, wellhead data, and sensor data to intelligently define thresholds, triggering manual intervention when measured values are determined to be out of range [8].
Sergey Ulyanov et al. installed flow measurement firmware sensors above the electric submersible pump (ESP) to monitor liquid levels and flow rates. Based on actual measurement data, they evaluated the status of downhole pump equipment, pump capacity, and reservoir capabilities, designing measures to improve pump operation and repairs, thereby determining the operating mode of the well [9].
Cohen, D.J. developed a new downhole monitoring system that combines electric submersible pump (ESP) status monitoring with downhole flow, liquid level monitoring, and reservoir evaluation. The surface control system integrates downhole sensor data with surface parameters to optimize equipment performance. Special operational measures have been developed and implemented to enhance well performance and conduct reservoir evaluation [10].
(2)
Regulation through Electrical Parameter Alarm Mechanisms:
Nolen compared the pump intake pressure and pump input power with the motor output power, assessing the matching condition of the pump with the oil reservoir based on a series of parameters, including the position on the characteristic curve corresponding to oil well productivity and pump operating conditions, as well as the gas content at various stages within the pump. Necessary recommendations were proposed based on this assessment [11].
Badkoubeh, A. et al. proposed an electrical parameter-based condition monitoring technology that involves measuring high-frequency electrical signals, three-phase current, and voltage, followed by trend analysis of the data to determine warning thresholds. Operational recommendations were then made based on the findings. This technology was tested in the field on multiple electric submersible pump (ESP) systems at a SAGD oil field in Canada, demonstrating its advantages and effectiveness [12].
El Mahbes et al. developed a real-time remote monitoring system for unconventional wells in the United States, utilizing downhole and surface data such as pressure, temperature, vibration, production data, motor load, and many other parameters to monitor system performance. The system allows for interaction with production engineers or production analysts via a web browser to optimize operations, thereby improving the operational lifespan of the ESP system and maximizing productivity [13].
From the studies mentioned above, it is evident that many oilfields still rely on traditional liquid level monitoring and electrical parameter alarm mechanisms for control. However, these methods have significant delays and limitations. The update cycle for liquid level monitoring data is long, making it difficult to timely reflect changes in wellbore flow conditions. Anomalies in electrical parameters (such as current and voltage) often trigger alarms only after a fault has occurred, which means early warning and proactive intervention are not achievable.
Such passive control strategies struggle to provide precise guidance for critical operations, such as pump frequency regulation, valve opening optimization, and start-stop strategy adjustments. As a result, ESP systems often operate in a “post-remedial” rather than a “preventive” mode, which not only reduces production efficiency but also increases the risk of unscheduled downtime and equipment damage.
It is clear that designing a method for real-time monitoring and timely optimization of the flow state in ESP systems is essential. Therefore, this paper proposes a profile identification method based on multiphase flow fitting in the wellbore, which aims to reconstruct the flow state at the pump intake. Based on this reconstruction, an optimization logic for operational parameters will be designed to enhance the stability and operational efficiency of the ESP system.

2. Fitting Model and Parameter Optimization Method

2.1. Multiphase Flow Calculation Model

To accurately describe the flow behavior of multiphase fluids within the wellbore, this section utilizes the Beggs-Brill classical multiphase flow model to construct a pressure drop calculation framework for gas–liquid two-phase flow suitable for inclined wellbores [14].
The flow characteristics of the gas–liquid two-phase flow in the electric submersible pump (ESP) system directly affect its lifting efficiency and operational stability. The Beggs-Brill model takes into account flow pattern transitions, liquid hold-up variations, and the effects of inclined pipe flow, enabling the calculation of key parameters such as pressure drop along the ESP wellbore and liquid hold-up [15].
In the wells studied, the ESPs are equipped with standard rotary gas separators to mitigate free gas entrainment.
The multiphase flow pressure drop calculation process based on the Beggs-Brill model is as follows:
(1)
Pressure Gradient Calculation:
For inclined pipe flow, the total pressure gradient calculation formula is as follows:
dp dz = p z fr + p z h + p z a
In this equation, p z fr is the frictional pressure gradient, p z h is the hydrostatic pressure gradient, and p z a is the acceleration pressure gradient. Thus, the total pressure gradient is the sum of the frictional pressure gradient, hydrostatic pressure gradient, and acceleration pressure gradient. Therefore, it is necessary to calculate these three pressure gradients separately.
Frictional Pressure Gradient
According to the definition, the frictional pressure gradient is:
p z fr = λ v 2 2 D ρ = λ G / A v 2 D
where λ is the friction factor, dimensionless; v is the fluid flow velocity, m/s; D is the internal diameter of the pipe, m; ρ is the fluid density, kg/m3; G is the fluid mass flow rate, kg/s.
Hydrostatic Pressure Gradient
When calculating the pressure gradient due to changes in height, the equation is:
( p z ) h = [ ρ 1 H 1 + ρ g ( 1 H 1 ) ] gsin θ
where H1 is the liquid hold-up factor in the wellbore, dimensionless; sin θ   is the sine of the pipe’s inclination angle, °.
Acceleration Pressure Gradient
The formula for calculating the acceleration pressure gradient is:
p z a = ρ v d dz ( G g / A ρ g )
where G g   is the gas mass flow rate, kg/s; ρ g is the gas density, measured in kg/m3.
In this study, the acceleration term was neglected, as its contribution to the total pressure gradient is negligible under typical ESP operating conditions compared with the hydrostatic and frictional terms.
From the above equations, it can be seen that in order to calculate the pressure gradient of inclined gas–liquid two-phase flow, it is also necessary to compute the liquid hold-up in the wellbore.
(2)
Liquid hold-up calculation:
The liquid hold-up in inclined gas–liquid two-phase flow can be expressed as:
H 1 ( θ ) = H 1 ( 0 ) ψ
where H 1 θ is the liquid hold-up when the pipe’s inclination angle is θ, m3/m3; H 1 ( 0 ) is the liquid hold-up when the pipe is horizontal, m3/m3; ψ is the inclination correction factor, dimensionless.
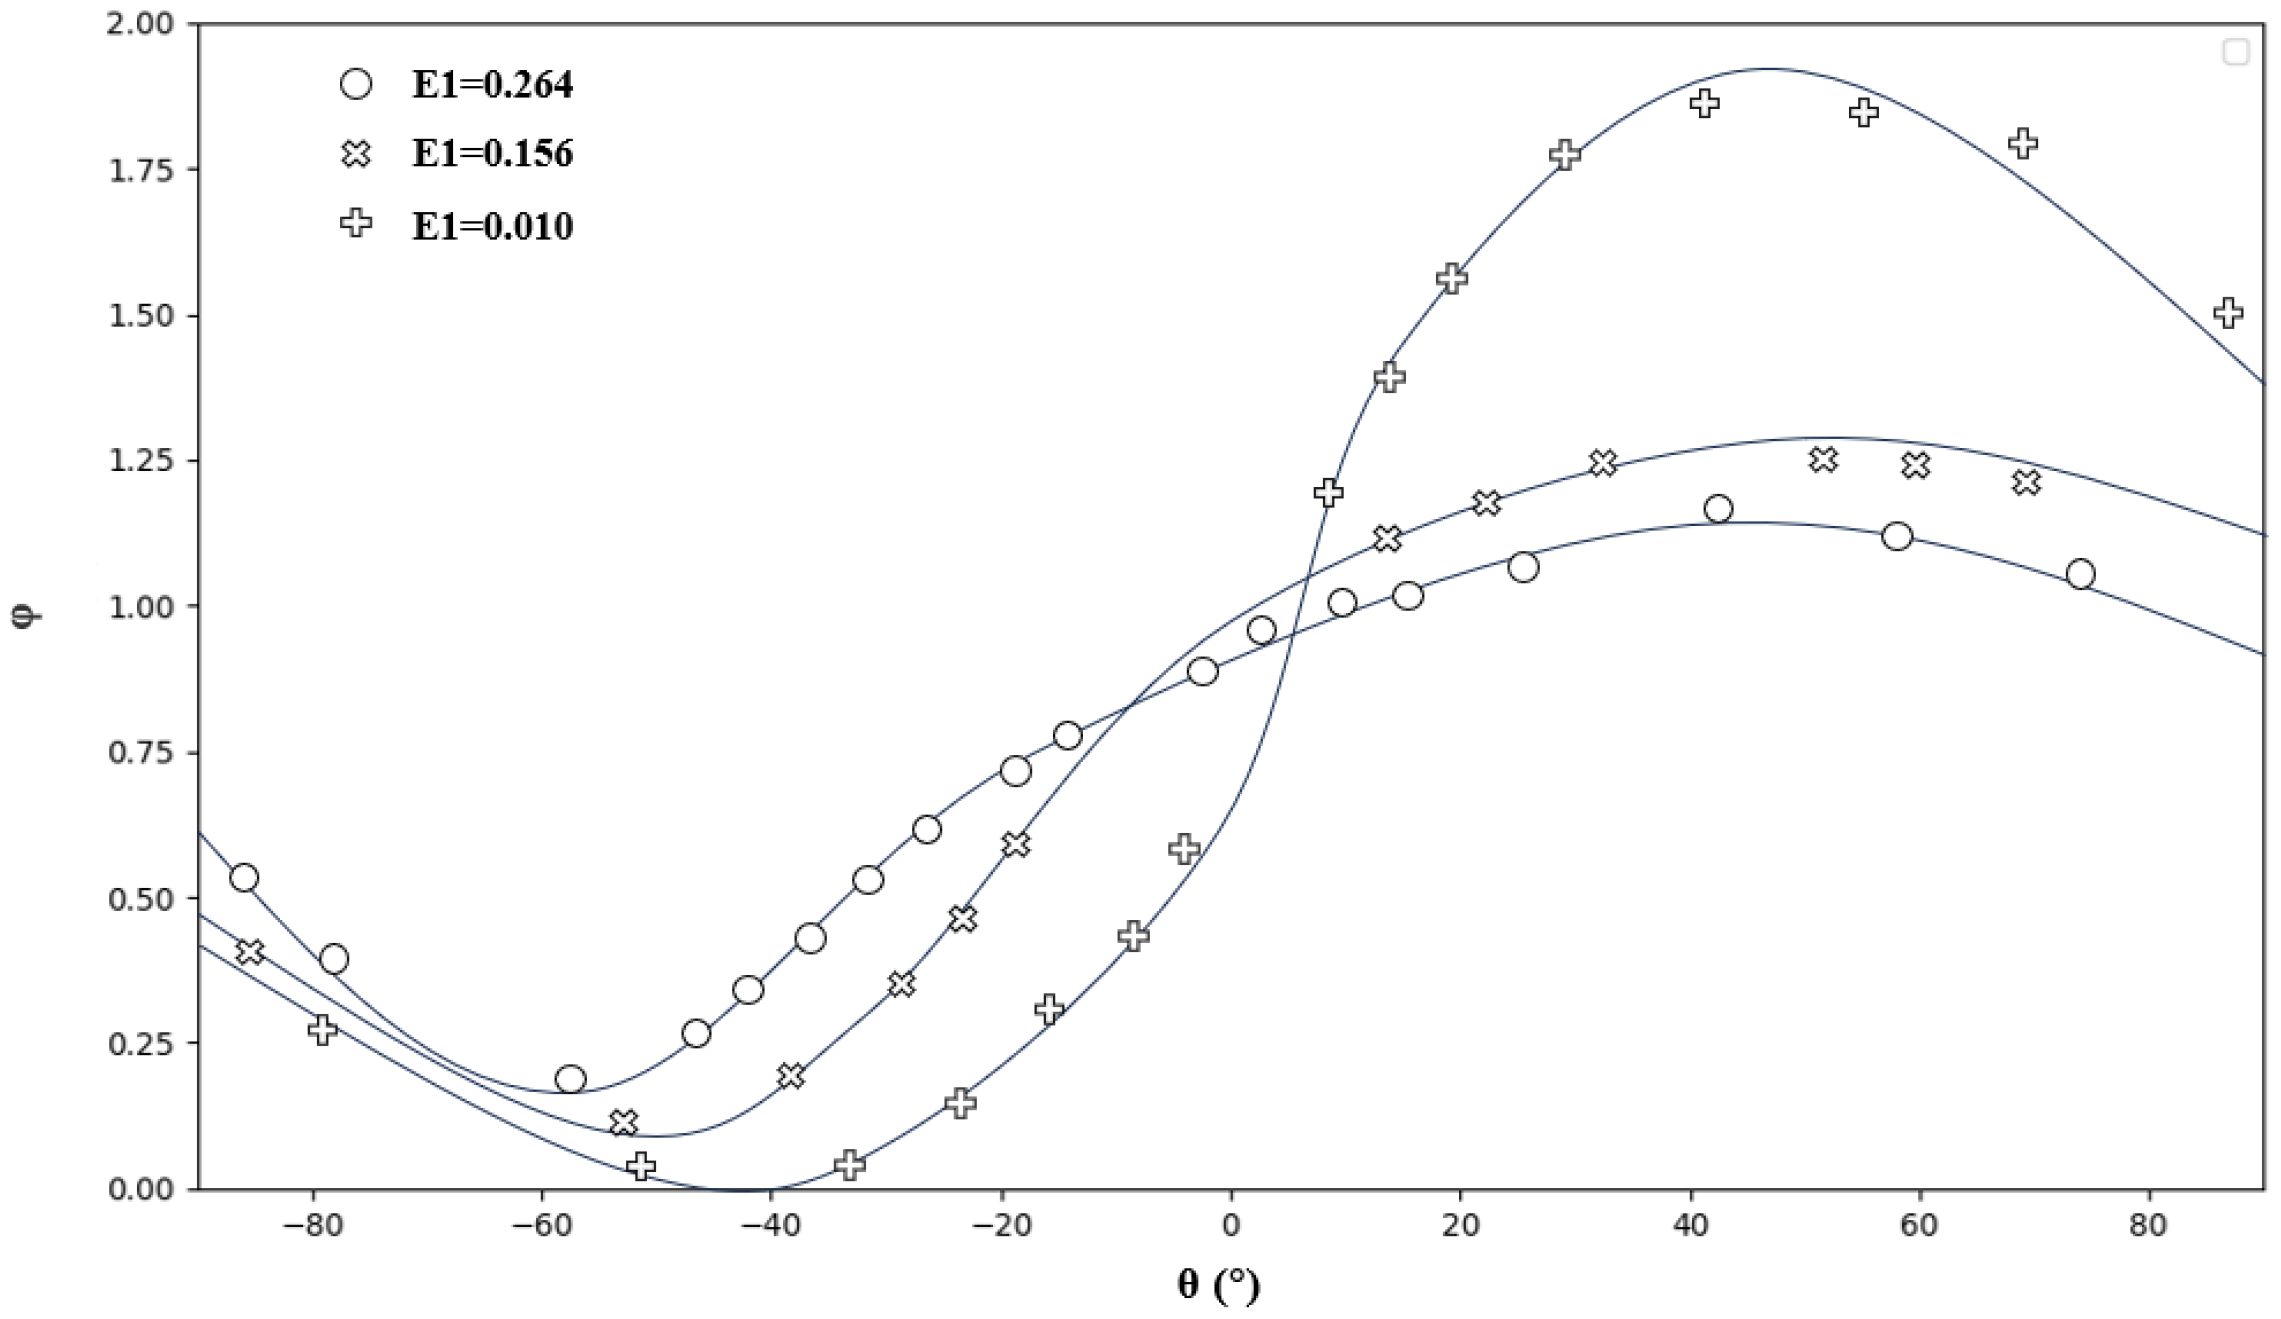
The relationship between the liquid hold-up H 1 ( θ ) , the inclination correction factor ψ , and the pipe’s inclination angle θ is shown in Figure 1 and Figure 2:
The curves in the figure can be fitted to the following formulas:
ψ = 1 + C [ sin ( 1.8 θ ) 1 3 sin 3 ( 1.8 θ ) ]
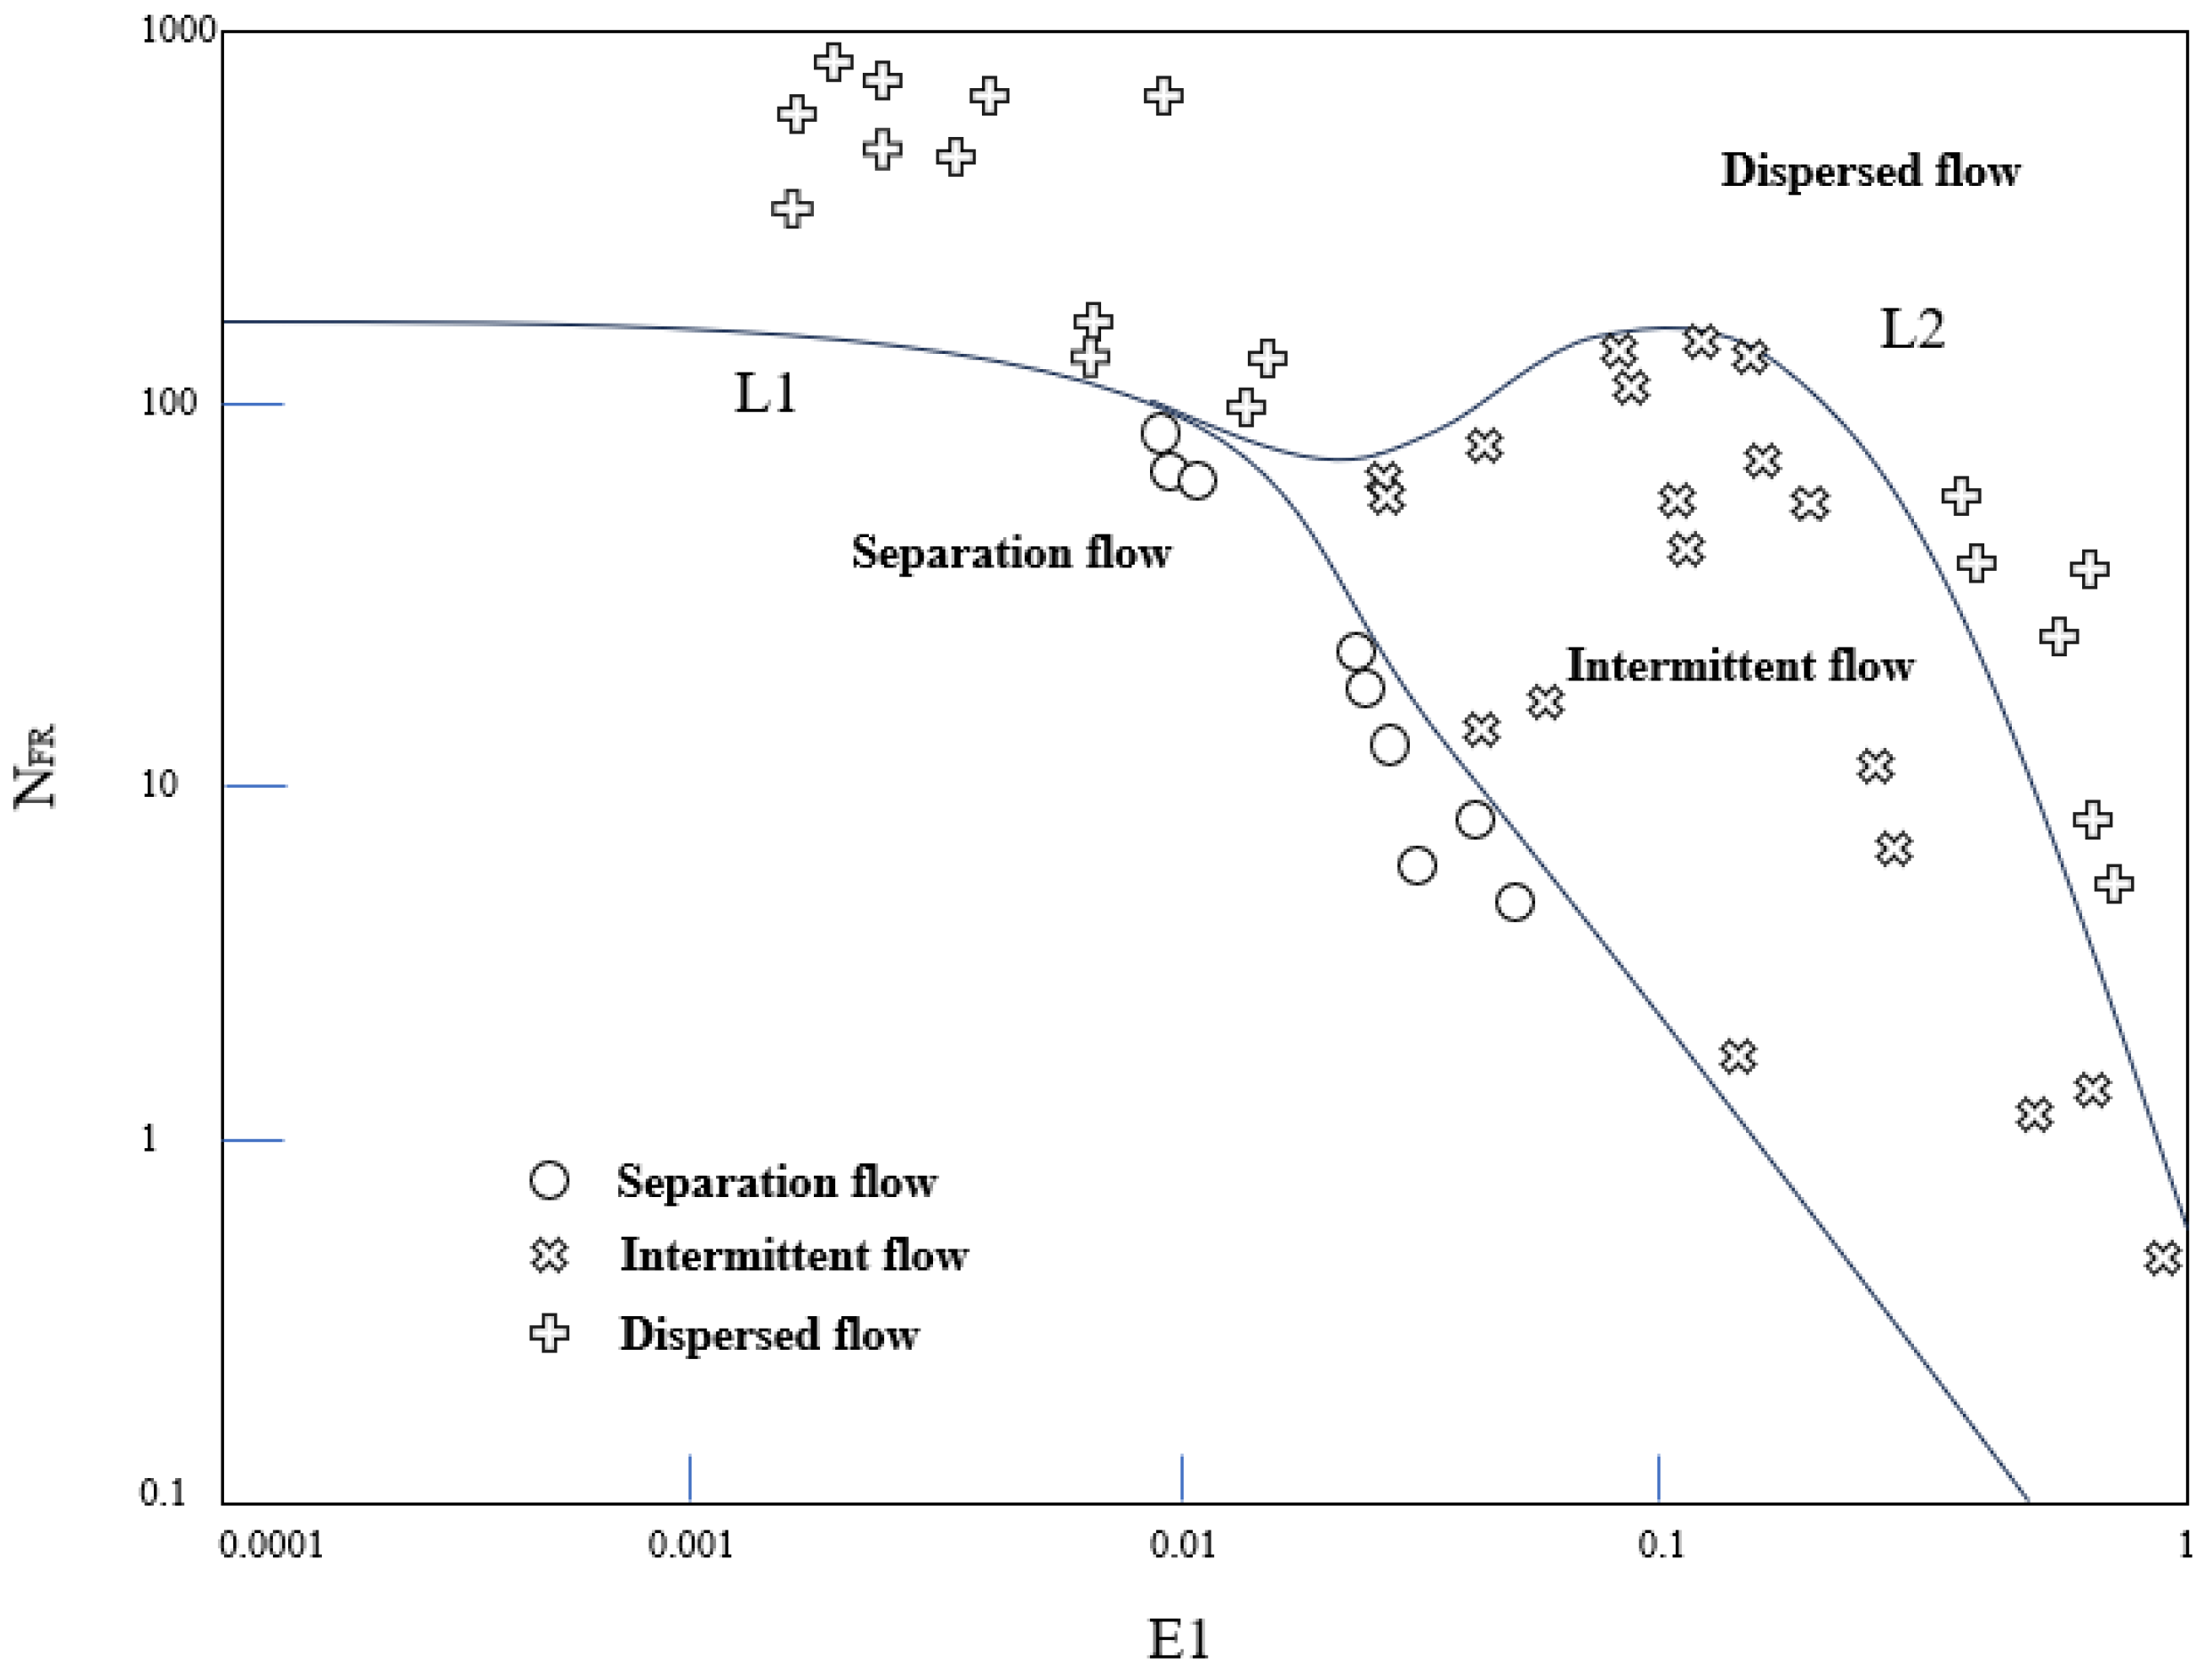
The value of H 1 ( 0 ) depends on the flow pattern within the wellbore, the Froude number N FR , and the inlet volume liquid hold-up E1, and their relationship is shown in Figure 3:
Additionally, the flow pattern can also be determined using the following calculation method:
Separated flow: Includes stratified flow, wavy flow, and annular flow. In this case:
N FR < L 1
Intermittent flow: Includes slug flow and plug flow. In this case:
L 1 < N FR < L 2
Distributed flow: Includes bubbly flow and mist flow. In this case:
N FR > L 1
where
L 1 = exp ( 4.62 3.757 x 0.481 x 2 0.0207 x 3 )
L 2 = exp ( 1.061 4.602 x 1.609 x 2 0.179 x 3 + 0.635 × 10 3 x 5 )
where
x = ln E 1
By using the Beggs-Brill model described above, the pressure drop of gas–liquid two-phase flow in the ESP wellbore can be calculated.

2.2. Multiphase Flow Fitting Model

In order to obtain a more accurate gas–liquid flow profile characteristic for designing optimized operational parameters, it is necessary to adjust the key parameters during the flow process to fit the pressure profile and liquid hold-up profile.
The fitted pressure drop can be expressed as:
( dp dz ) = X 1 p z fr + X 2 p z h + X 3 p z a
This paper adopts a piecewise fitting method. After calculating the pressure drop of a certain section, the computed value is used to correct the pressure drop for the next section of the wellbore, achieving a correction of the entire wellbore profile.
To identify the key parameters, the fitted pressure drop formula needs to be decomposed:
( dp dz ) = X 1 ( λ G / A v 2 D ) + X 2 [ ρ 1 H 1 + ρ g ( 1 H 1 ) ] gsin θ + X 3 ρ v d dz ( G g / A ρ g )
Based on the research experience and analysis validation from previous studies, the friction factor λ and the liquid hold-up factor H 1 are identified as key parameters for fitting, requiring significant correction.
To optimize these parameters, this paper employs a Genetic Algorithm (GA). This population-based evolutionary algorithm operates directly on encoded solution parameters [16]. Through iterative selection, crossover, and mutation, the GA continuously improves solution quality across the search space, making it particularly suitable for fitting complex parameters like “λ” and “H1”.
The principle of this algorithm is as follows:
First, it is necessary to define a fitness function F, which represents the error between the actual measured pressure gradient dp dz and the predicted value calculated using λ and H 1 .
F ( λ , H 1 ) = i = 1 n dp dz i ( f ( λ , H 1 , Z i ) ) 2
Encode the parameters λ and H 1 to be optimized. Individual solutions can be represented using real-valued encoding:
I n d i v i d u a l = [ λ , H 1 ]
Select the encoded individuals:
P ( i ) = F ( i ) j = 1 N F ( j )
where P ( i ) is the selection probability of individual i, and F ( i ) is the fitness value of individual i.
To ensure physical plausibility during the optimization, constraints were imposed on the varied parameters. Specifically, liquid holdup was restricted to values between 0 and 1, while the friction factor was limited to a range close to its theoretical value according to the Moody diagram. These bounds prevented unrealistic solutions and improved the convergence of the genetic algorithm by reducing the feasible search space.
A selection crossover operation is performed to generate the next generation, and mutation is introduced to increase the diversity of the population. Then, repeat the steps of selection, crossover, mutation, and fitness evaluation until the error meets the specified conditions, at which point the optimization is complete.
In this study, the genetic algorithm was implemented with a population size of 50, a crossover probability of 0.8, and a mutation probability of 0.05. The selection strategy was based on tournament selection to maintain diversity and avoid premature convergence. The optimization was terminated when either the maximum number of 200 generations was reached or when the relative improvement in the fitness function (RMSE reduction) was less than 10−5 over 20 consecutive generations. These settings were chosen after preliminary sensitivity tests to balance computational efficiency and fitting accuracy, and they were applied consistently to all wells studied.
Fit the model using the fitting algorithm for a certain X electric pump well in the eastern South Sea:
The input parameters include:
Pump frequency f; pump lift Hp; well depth structural data; measured liquid production Q; and casing pressure P, etc.
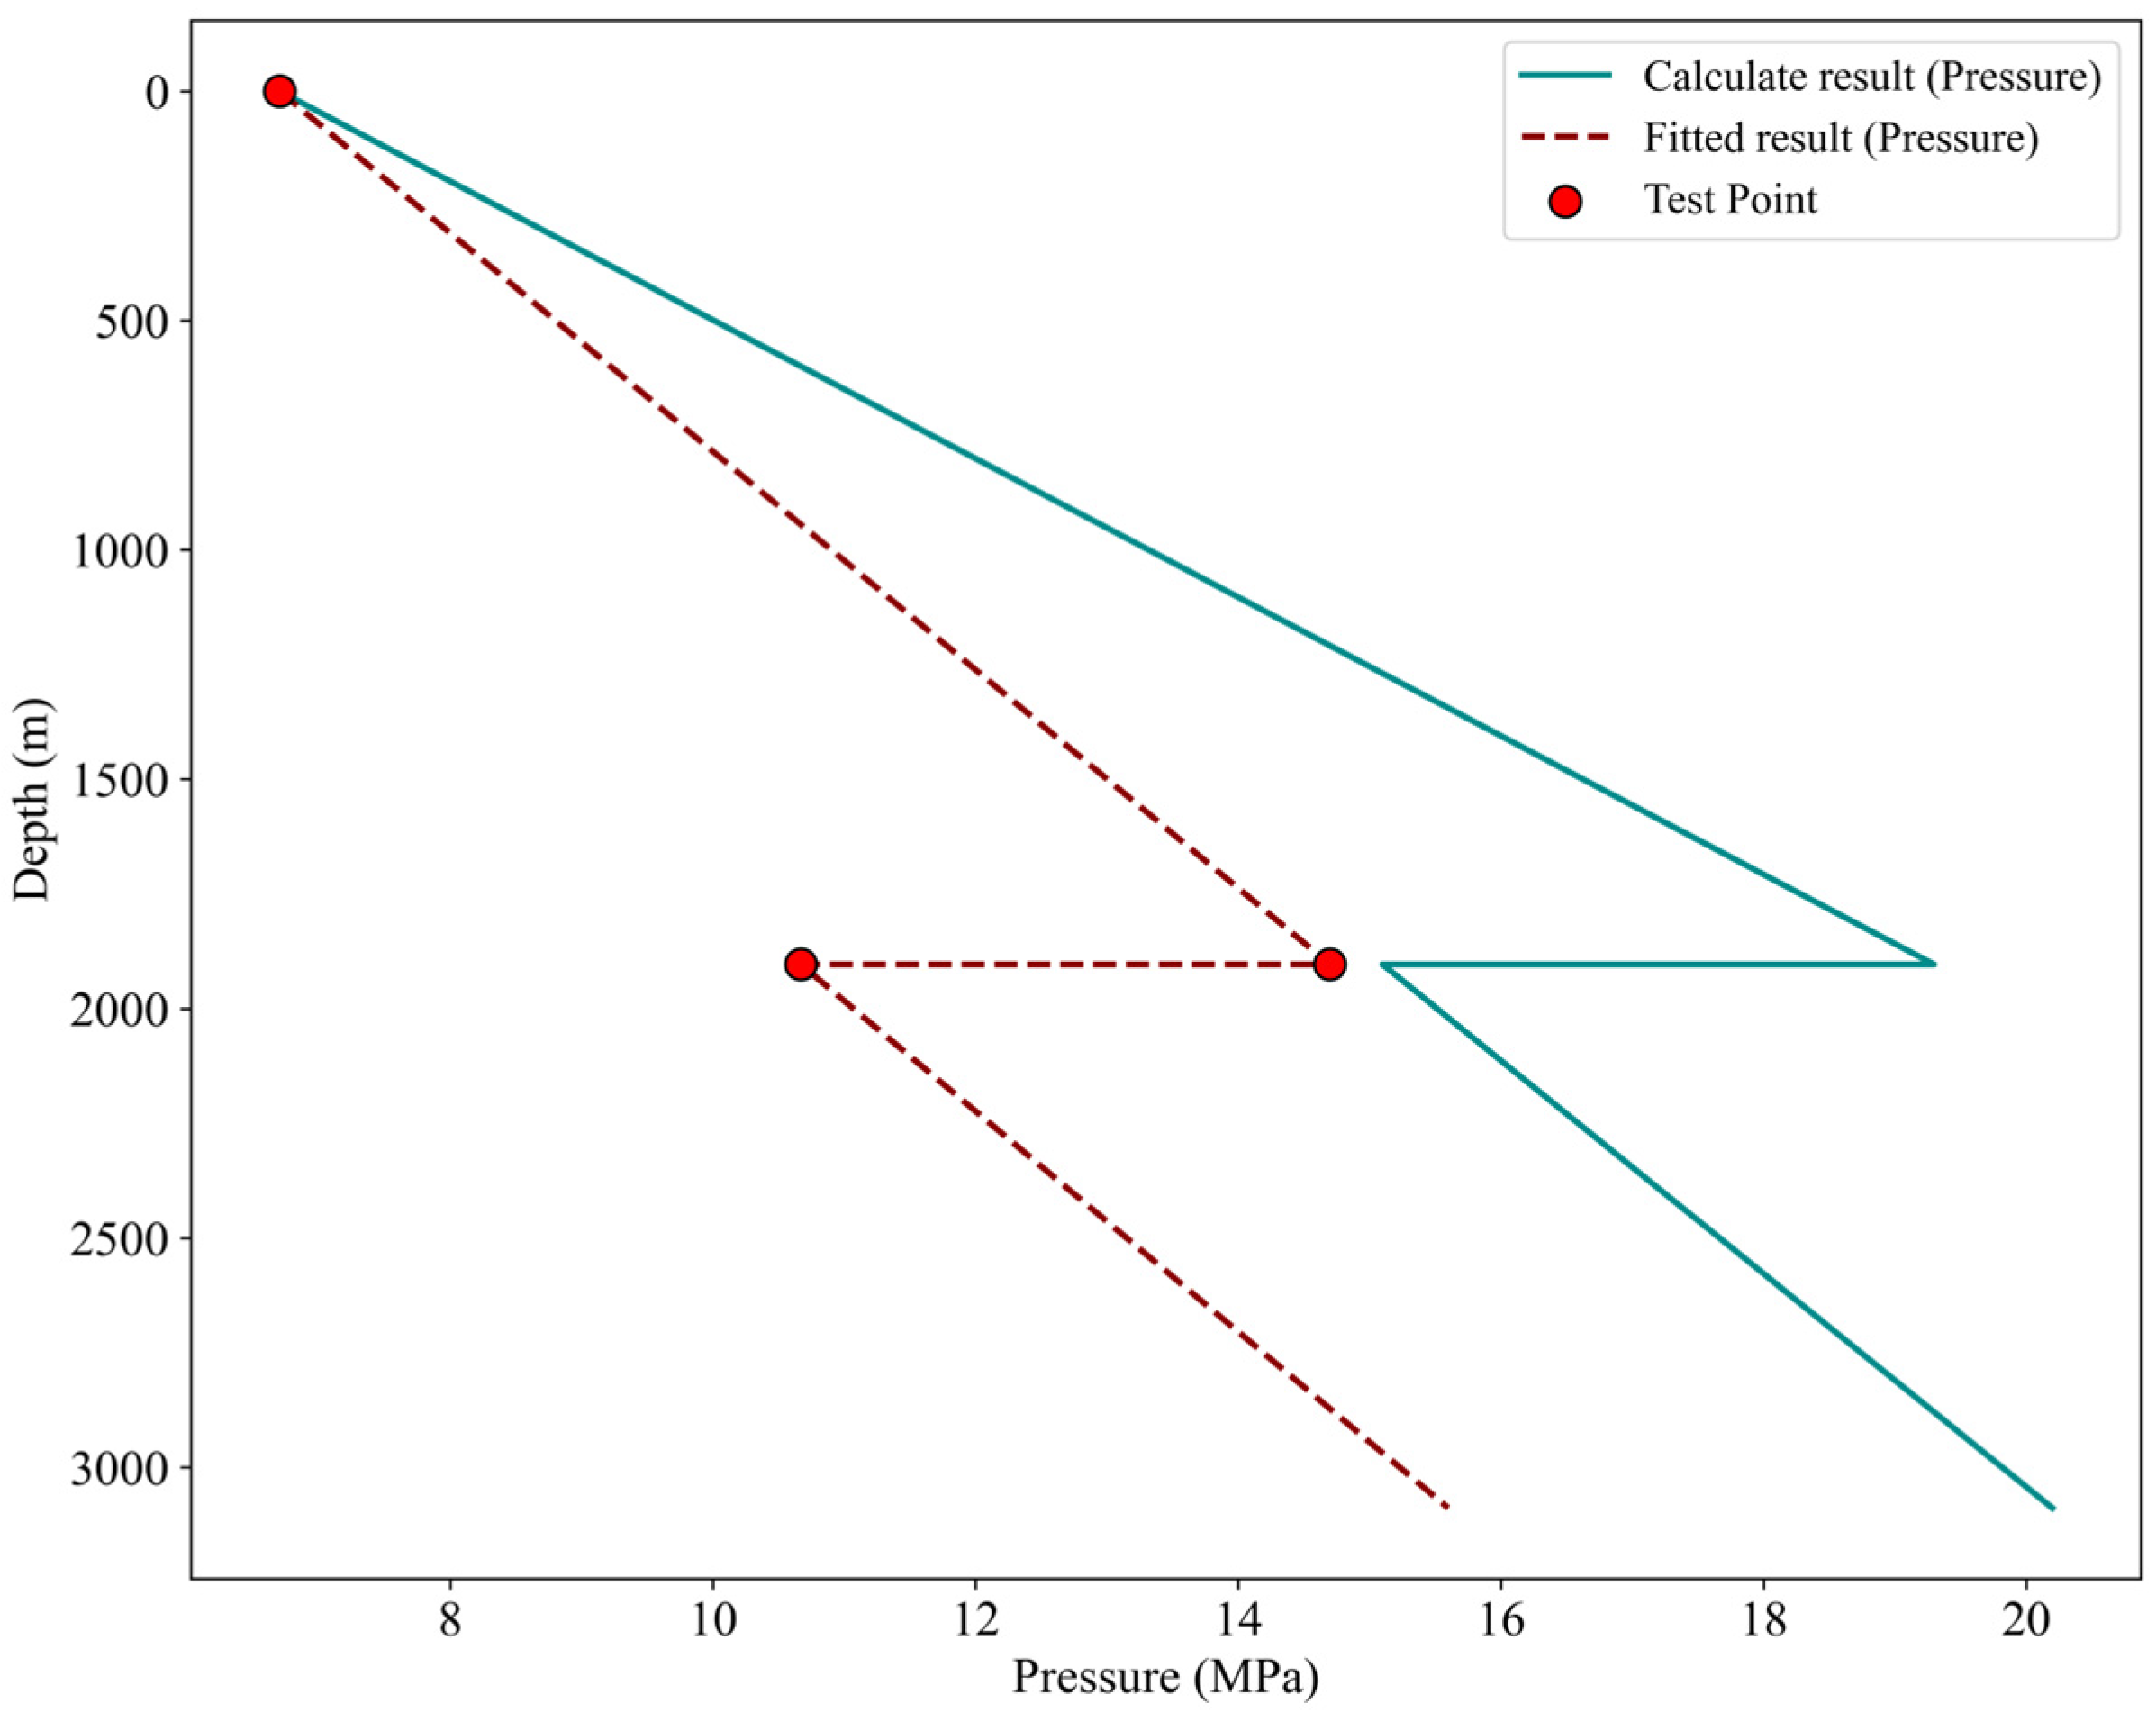
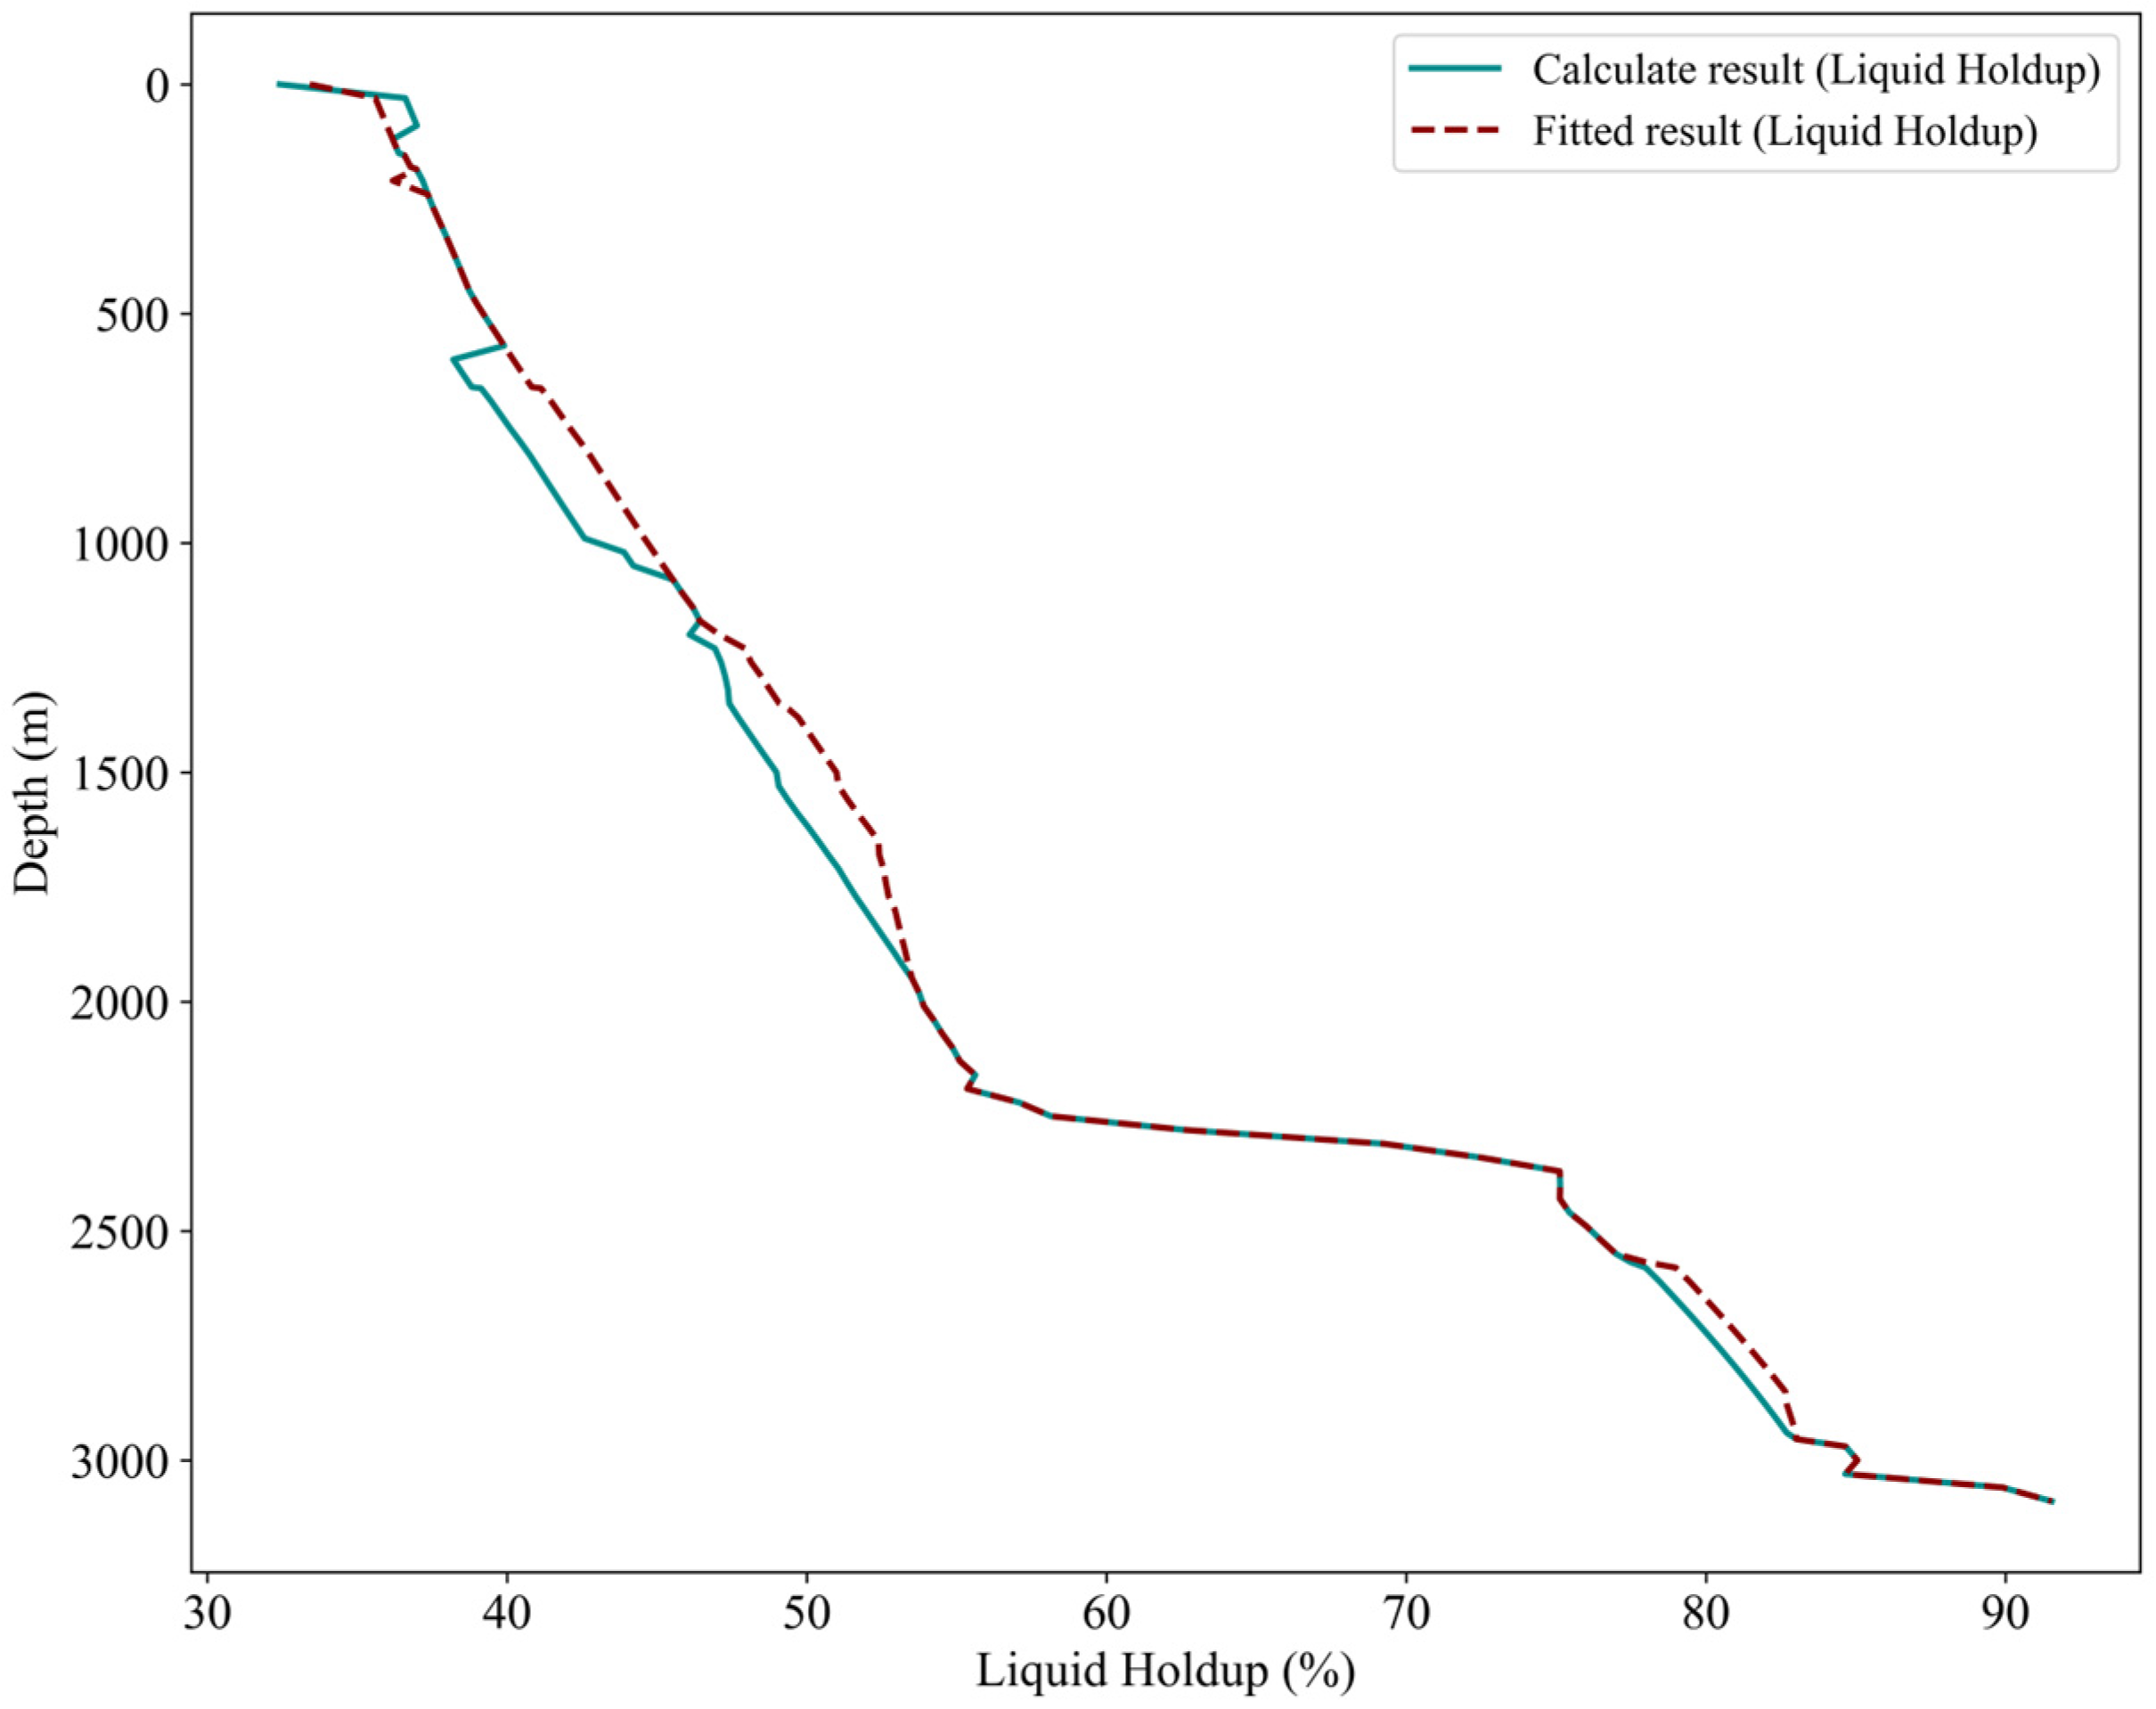
The output profile fitting results are shown in Figure 4 and Figure 5:
It should be noted that the Beggs–Brill correlation typically overestimates pressure gradients in vertical well sections, which explains the smaller pressure drop in the fitted profile compared to the initial calculation. In practice, the proposed methodology can be adapted to different gas–liquid ratio (GLR) conditions by selecting appropriate multiphase flow correlations, since flow patterns may vary significantly with GLR.
And at the pump discharge, the increased pressure promotes partial dissolution of free gas into the liquid phase, which reduces the apparent liquid holdup compared with the pump intake.

2.3. Design of Rule-Based Parameter Optimization Logic Based on Fitted Flow Profile

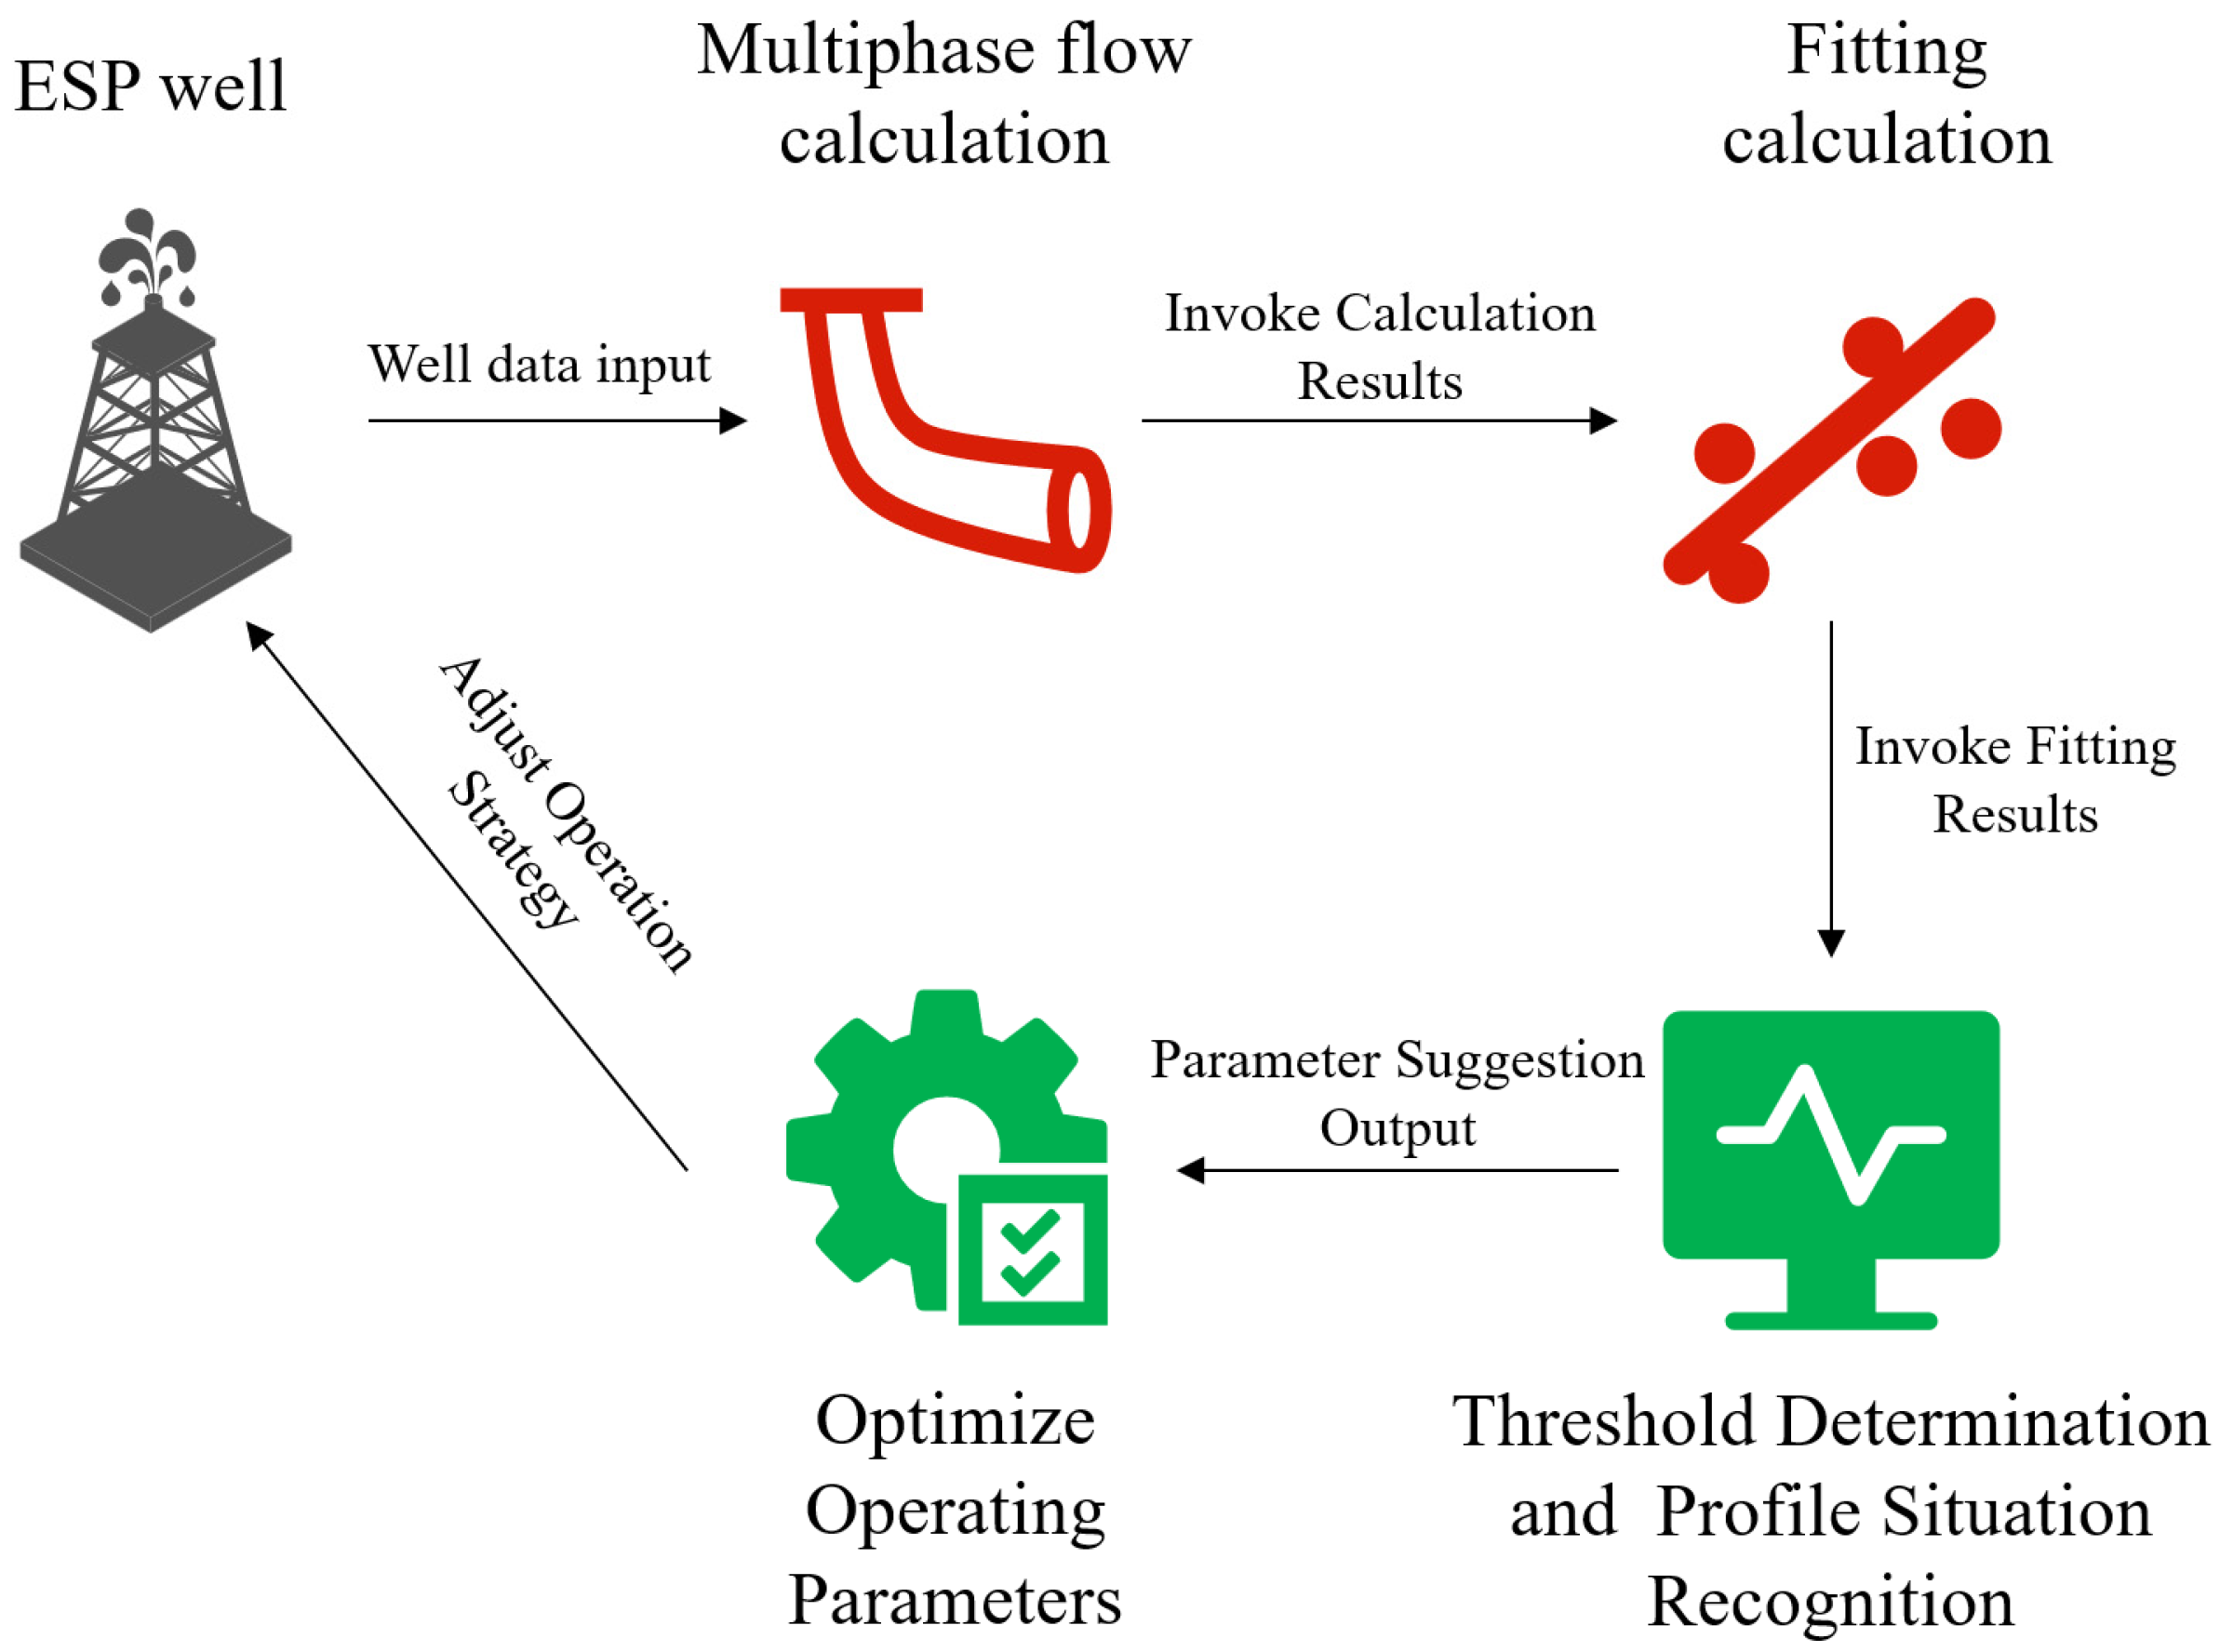
To enhance the stability of Electric Submersible Pump (ESP) systems in complex operating scenarios, flexible adjustment of operating parameters based on real-time conditions is essential [17]. Therefore, after completing the flow profile fitting, this paper constructs a set of adjustment rules based on the characteristics of the gas–liquid flow profile obtained from the fitting. This method optimizes the ESP operating state by identifying system issues through threshold-based diagnostics of key parameters and providing actionable recommendations, thereby achieving intelligent parameter optimization. The specific process is shown in Figure 6:
This method mainly adjusts three core operating parameters in the ESP system: pump frequency, choke valve opening, and pump stop time. The variable frequency adjustment method changes the operating characteristics of the electric submersible pump well production system by altering the pump’s rotational speed, thereby improving the flow conditions. The choke valve adjustment method changes the discharge pressure of the multistage centrifugal pump by adjusting the nozzle opening, thus maintaining the stability of the fluid supply. Optimizing the pump stop time can prevent gas intrusion, ensure the stability of downhole fluids, reduce the risk of equipment failure, and extend the equipment’s service life. The following sections will provide a detailed explanation of the optimization principles and logic for each parameter.
  • The principle of frequency optimization is as follows:
The rotational speed of an asynchronous motor is proportional to the frequency of the power supply [18], and the relationship is given by the formula:
n = 60 f z ( 1 s )
where n is the rotational speed of the asynchronous motor, r/min; s is the motor slip rate, %; f is the motor frequency, Hz; z is the number of pole pairs in the motor stator winding.
From the above formula, it can be seen that the rotational speed n of the motor has a linear proportional relationship with the power supply frequency f Therefore, by changing the frequency of the power supply, the speed of the motor can be altered. Thus, the operating speed of the motor has good adjustability.
By using variable frequency control to adjust the speed of the electric submersible pump motor, the pump displacement can be matched with the fluid supply from the oil well. When the oil well’s fluid supply is insufficient, the speed of the submersible pump automatically decreases to ensure continuous operation, avoiding damage caused by frequent start-stop cycles to the pump unit and cables. This approach achieves energy savings and extends the pump testing cycle, providing strong support for the normal production of low-energy electric submersible pump wells.
Frequency Optimization Logic:
In the operation of the ESP system, the identification of the characteristics of the gas–liquid flow profile is crucial for optimizing system performance. Based on the gas–liquid flow profile characteristics obtained from the fitting in this paper, we have developed a set of efficient adjustment rules to address dynamic changes in the flow. One key adjustment strategy is monitoring and responding to the liquid hold-up rate at the inlet.
(1)
Low Liquid Proportion at the Inlet:
In the ESP system, a low liquid proportion at the inlet typically indicates that the system may be experiencing poor gas–liquid separation or increased gas entrainment. In this case, the liquid hold-up rate at the inlet section is a crucial parameter for assessing the low liquid proportion, and monitoring it is essential. When the hold-up rate falls below a set threshold (e.g., 30%), it is determined that the liquid proportion is low.
Additionally, if the gravitational pressure drop at the inlet section significantly decreases, it usually means that there is insufficient height of the liquid column, leading to a low liquid proportion. This is because, in a gas–liquid mixed flow, the gravitational contribution of the liquid plays a major role, and an insufficient proportion will reduce the gravitational pressure drop in that section.
Based on the gas–liquid flow profile characteristics obtained from the fitting in this paper, an adjustment rule set has been developed. When the gas content at the inlet exceeds the set threshold, it is recommended to reduce the pump frequency by 3 to 5 Hz. This adjustment strategy is based on the following principles:
Reducing Gas Entrainment: By lowering the pump operating speed, gas entrainment can be minimized, restoring gas–liquid separation and optimizing the flow state at the inlet section.
Mitigating Pressure Fluctuations: Moderately reducing the pump frequency helps alleviate pressure fluctuations caused by increased gas, thus maintaining pressure balance within the wellbore.
Reducing Equipment Wear: Frequency adjustments can also reduce mechanical wear on equipment, prolonging the pump’s lifespan and decreasing maintenance frequency.
(2)
Low Inlet Pressure
In the operation of an electric submersible pump (ESP) system, maintaining appropriate inlet pressure is one of the key factors for ensuring stable pump operation. When the pressure at the inlet section is significantly lower than the minimum pressure required for stable liquid suction, a low-pressure situation typically occurs.
The suction pressure of the liquid must be higher than its saturation pressure to avoid vaporization. The saturation pressure is the pressure at which the liquid starts to vaporize at a specific temperature, and this factor must be considered in the design and operation.
Therefore, when the monitored pressure is significantly below the minimum pressure required for stable liquid suction, it should be compared with the saturation pressure of the liquid to confirm the low-pressure phenomenon.
When it is determined that the inlet pressure is too low, it is recommended to reduce the pump frequency by 2 Hz based on the rule set. This adjustment is based on the following principles:
During the pump operation, a higher pump frequency can lead to the liquid being drawn in at a faster rate. This rapid extraction may significantly reduce the pressure at the pump inlet, especially in cases of insufficient liquid or gas entrainment. By lowering the pump frequency, the flow speed of the liquid decreases, which in turn reduces the demand for fluid suction, helping the inlet section to recover to a higher pressure level.
2.
The basic principle of optimizing the nozzle opening is as follows:
The ESP system is typically equipped with adjustable nozzles, which can have diameters ranging from 6 to 28 mm.
The oil pressure in the submersible pump well is calculated using the following equation:
P wh = Δ P + P l + h l / ( ρ g )
where P wh is the oil pressure, MPa; P l is the return oil pressure, MPa; h l is the pressure loss along the oil pipeline, m.
For typical oil wells, most flow conditions involve gas–liquid two-phase flow; thus, the two-phase flow formula is needed when adjusting parameters. An empirical formula derived from test data is commonly used for this calculation. Under critical flow conditions, the variation in flow rate is primarily related to the pressure at the nozzle entrance, i.e., the oil pressure:
P wh = a R p b d c q
where R P is the production gas-oil ratio, m3/m3; q is the production flow rate, m3/d; d is the nozzle diameter, mm; a, b, c are the empirical constants, with values determined based on the specific conditions of the oil field.
The optimization principle of nozzle adjustment primarily involves modifying the nozzle opening to change the inlet pressure of the multistage centrifugal pump. This, in turn, alters the flow rate and lift of the multistage centrifugal pump, ensuring that the liquid production from the oil well remains within the recommended flow rate range for the pump.
Nozzle Opening Optimization Logic:
(1)
Insufficient Liquid Column Height
In the operation of an electric submersible pump (ESP) system, maintaining an appropriate liquid column height is critical for ensuring the effective operation of the pump. When the liquid column height is insufficient, it may lead to a decrease in suction capacity and unstable operation, thereby affecting liquid production. Adjusting the nozzle opening is an effective measure to address this issue.
In this case, the liquid hold-up rate in the middle section is an important indicator for assessing liquid column height. When the liquid hold-up rate in this section falls below a set threshold (e.g., 30%), it is determined that the liquid column height is insufficient.
Additionally, if the gravitational pressure drop in this section is low, it can also indicate that the liquid column height is insufficient, failing to provide adequate pressure support, which results in reduced efficiency for liquid suction into the pump.
When it is confirmed that the liquid column height is insufficient, it is recommended to close the nozzle opening by 5% to 10% based on the rule set. This adjustment is based on the following principles:
According to Equation (20), when the valve opening degree decreases, the oil pressure will increase, thereby restoring the inlet pressure of the pump. Simultaneously, this adjustment can also achieve the goal of regulating flow rate; as the valve opening decreases, the flow rate reduces, and the pressure differential increases, which helps restore the liquid hold-up rate in the middle section.
(2)
High Back Pressure
High back pressure refers to a situation where the outlet pressure (i.e., discharge pressure) faced by the pump when discharging liquid exceeds the designed or expected level. In this case, even though the pump operates under good conditions, the outlet pressure hinders the normal discharge of fluid, resulting in reduced pump flow rate.
The negative impacts on system operation include:
Energy Loss: Excessively high back pressure leads to decreased pump efficiency, as the pump requires more power to overcome this resistance, resulting in energy wastage.
Insufficient Flow: High back pressure may prevent the pump from fully discharging liquid, thus failing to meet operational requirements and affecting oil and gas production.
Equipment Wear: Prolonged exposure to high back pressure subjects the pump’s mechanical components and motor to additional loads, potentially accelerating equipment wear and increasing the likelihood of failure.
To address this situation, frictional pressure drop, liquid hold-up rate, and current or shaft power are important parameters for assessing system operation conditions. When the overall frictional pressure drop is high, the liquid hold-up rate is also high, but there is no significant increase in current or shaft power, it can be determined that the system experiences high back pressure.
When it is confirmed that the system has high back pressure, it is recommended to open the throttle valve by 5% based on the rule set. This operation is based on the following principles:
When the throttle valve is opened, the channel through which the fluid passes becomes wider, reducing flow resistance. This reduces the obstruction to fluid flow within the system, consequently lowering the overall pressure drop.
Opening the throttle valve will decrease the pressure encountered by the liquid during discharge, thereby reducing discharge pressure and alleviating the back pressure the pump must overcome. This reduction in back pressure can effectively relieve the load on the pump and improve its discharge efficiency.
At the same time, lowering back pressure also provides an opportunity to increase the pump’s flow rate. As back pressure decreases, the pump can extract liquid more efficiently, leading to an increase in liquid transportation flow. This helps enhance the overall production capacity of the system.
3
Optimization of Pump Shutdown Time
In the operation of an electric submersible pump (ESP) system, periodic gas locking is a common flow issue that can severely affect the pump’s performance and the safety of the equipment. When these phenomena are observed, it is recommended to extend the pump shutdown time to avoid damage caused by frequent starting and stopping of the pump. Below is a detailed explanation of this recommendation.
(1)
Periodic Gas Lock
Periodic gas lock refers to the intermittent accumulation of gas within the pump chamber. When gas lock occurs, the pump cannot continuously draw in liquid, resulting in intermittent flow interruptions that lead to fluctuations and instability in flow rate. Gas lock often causes “hydraulic shocks,” which can lead to pump vibrations and accelerated damage.
Pump Shutdown Time Optimization Logic:
Frequent starting and stopping impose shock loads on the pump, increasing mechanical wear and potentially causing significant damage to the motor and drive system. This is especially critical in cases where gas lock or breakage occurs frequently; the pump may suddenly experience excessive pressure and temperature, leading to rapid aging of seals and damage to valves.
Extending the shutdown time can provide the system with an opportunity to recover and stabilize. During the shutdown period, gas may be expelled through natural drainage or other means, allowing the fluid flow condition to gradually return to normal.
Therefore, by reducing the frequency of starting and stopping, the pump can operate stably under appropriate conditions for an extended period, thereby improving overall operational efficiency.
In summary, this section constructs a set of adjustment rules based on the fitted characteristics of the gas–liquid flow profile, focusing on three core operational parameters in the ESP system: pump frequency, throttle valve opening, and pump shutdown time. When the gas content at the inlet exceeds the set threshold, it is recommended to reduce the pump frequency by 3 to 5 Hz; when the liquid column height is insufficient, the throttle valve should be appropriately closed to elevate the liquid level; if periodic gas locks or breakage profiles are detected, it is advisable to extend the pump shutdown time to avoid damage from frequent starting and stopping.
The above logic is implemented through simple rules and threshold determinations, and automatic suggestions for operational parameters can be generated based on real-time profile outputs, establishing a closed-loop operational framework of “fitting—recognition—optimization”.
The basic logic of the adjustment rules set is summarized in Table 1, Table 2 and Table 3:

3. Experiments and Result Verification

This section selects three typical ESP wells in the Eastern South China Sea oil field for case validation, including conditions of high gas content, high liquid volume, and frequent gas disturbances. It compares the changes in operational stability duration, liquid production, pump energy consumption, and current fluctuations between the original operating strategy and the optimized strategy presented in this paper.
(1)
Well A1:
This well is a directional well with a casing diameter of 174.4 mm in the oil layer. The surface crude oil density is 940 kg/m3, and the surface crude oil viscosity is 0.8 mPa.s, with a water cut of 76%. The relative density of the natural gas is 0.8, the wellhead oil pressure is 1.97 MPa, and the current formation static pressure is 3.39 MPa. The well’s current daily liquid production is 168.68 m3/d, with a production gas-oil ratio of 26 m3/m3. The nozzle diameter is 10.7 mm, and the pump depth is 1173.5 m. The rated discharge of the electric pump used is 962 m3/d, with a rated lift of 1100 m, and the number of stages of the submersible pump is 204. The motor’s rated power is 200 KW with a rated voltage of 2340 V, operating at a frequency of 55 Hz.
Through analysis of the fitted results, it was found that the liquid holding rate in the inlet segment of this well is 28%, and the gravitational pressure drop significantly decreases in the inlet segment. Therefore, it is determined that the liquid ratio at the inlet is relatively low. The predetermined optimization operation is applied, reducing the frequency by 5 Hz.
The adjustment range of 3–5 Hz was determined based on sensitivity checks, which showed that smaller reductions (<3 Hz) had negligible effect on suction pressure, while larger reductions (>5 Hz) significantly decreased liquid production. The chosen range therefore balances pump intake stability with production performance.
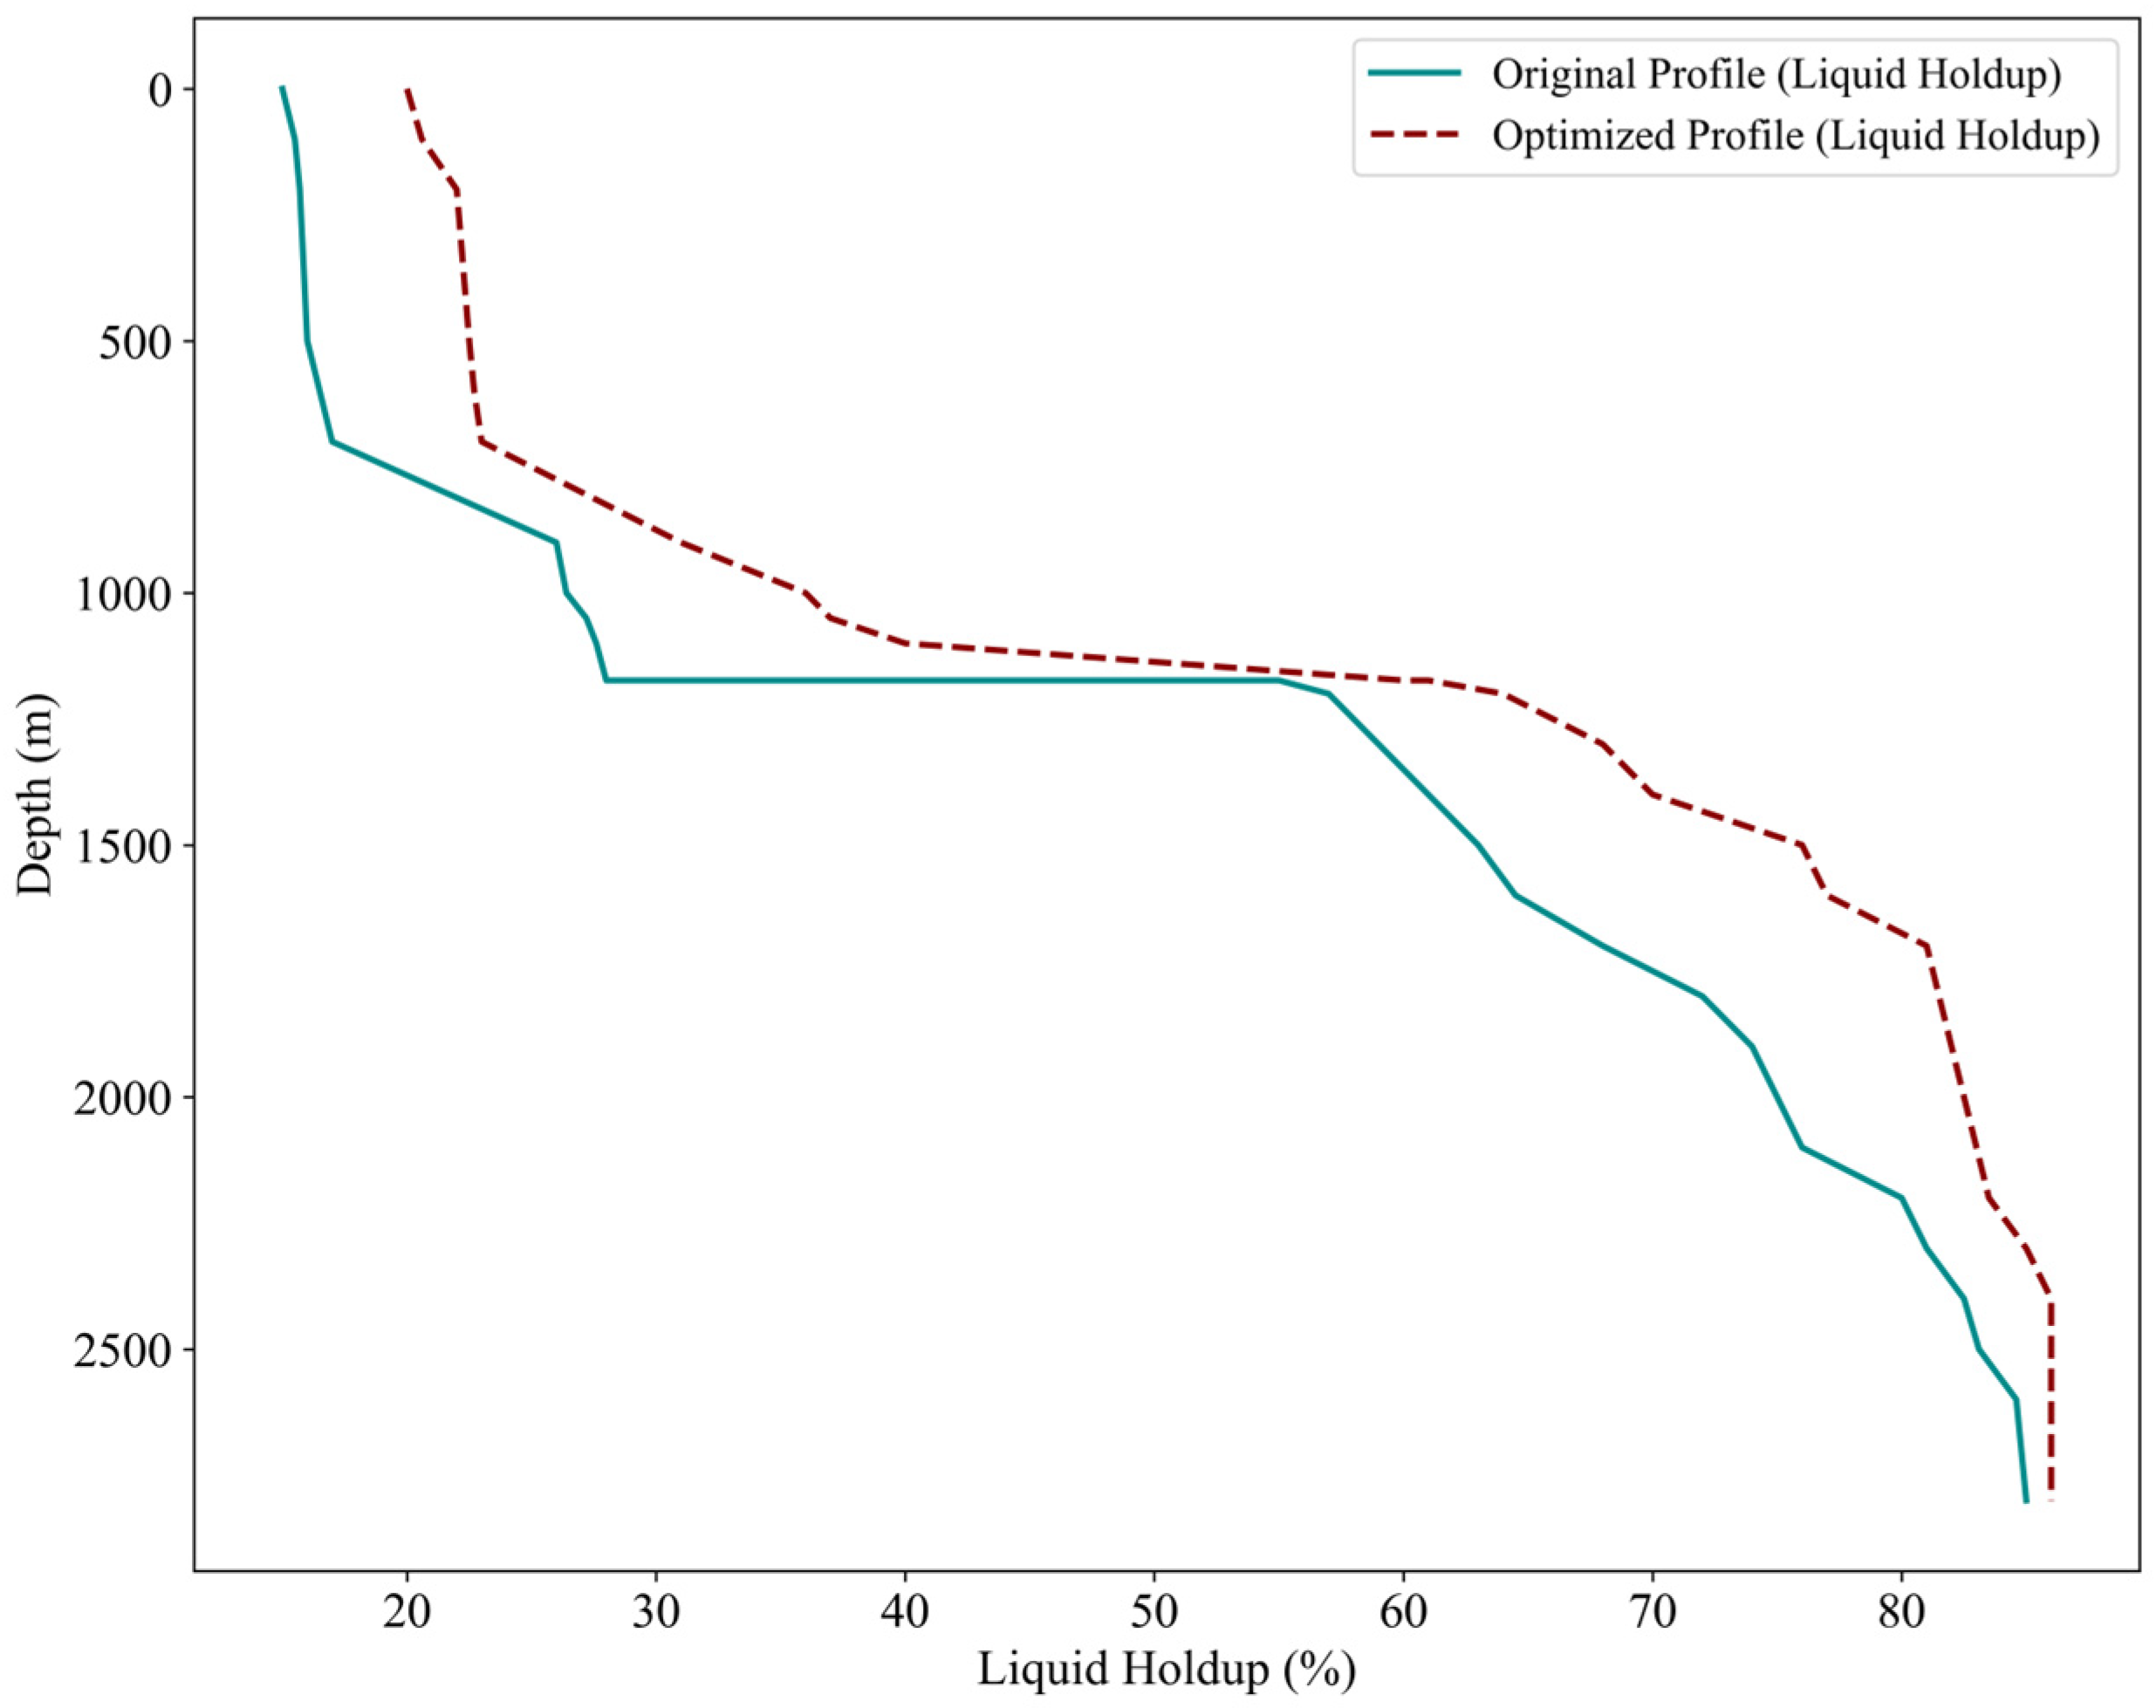
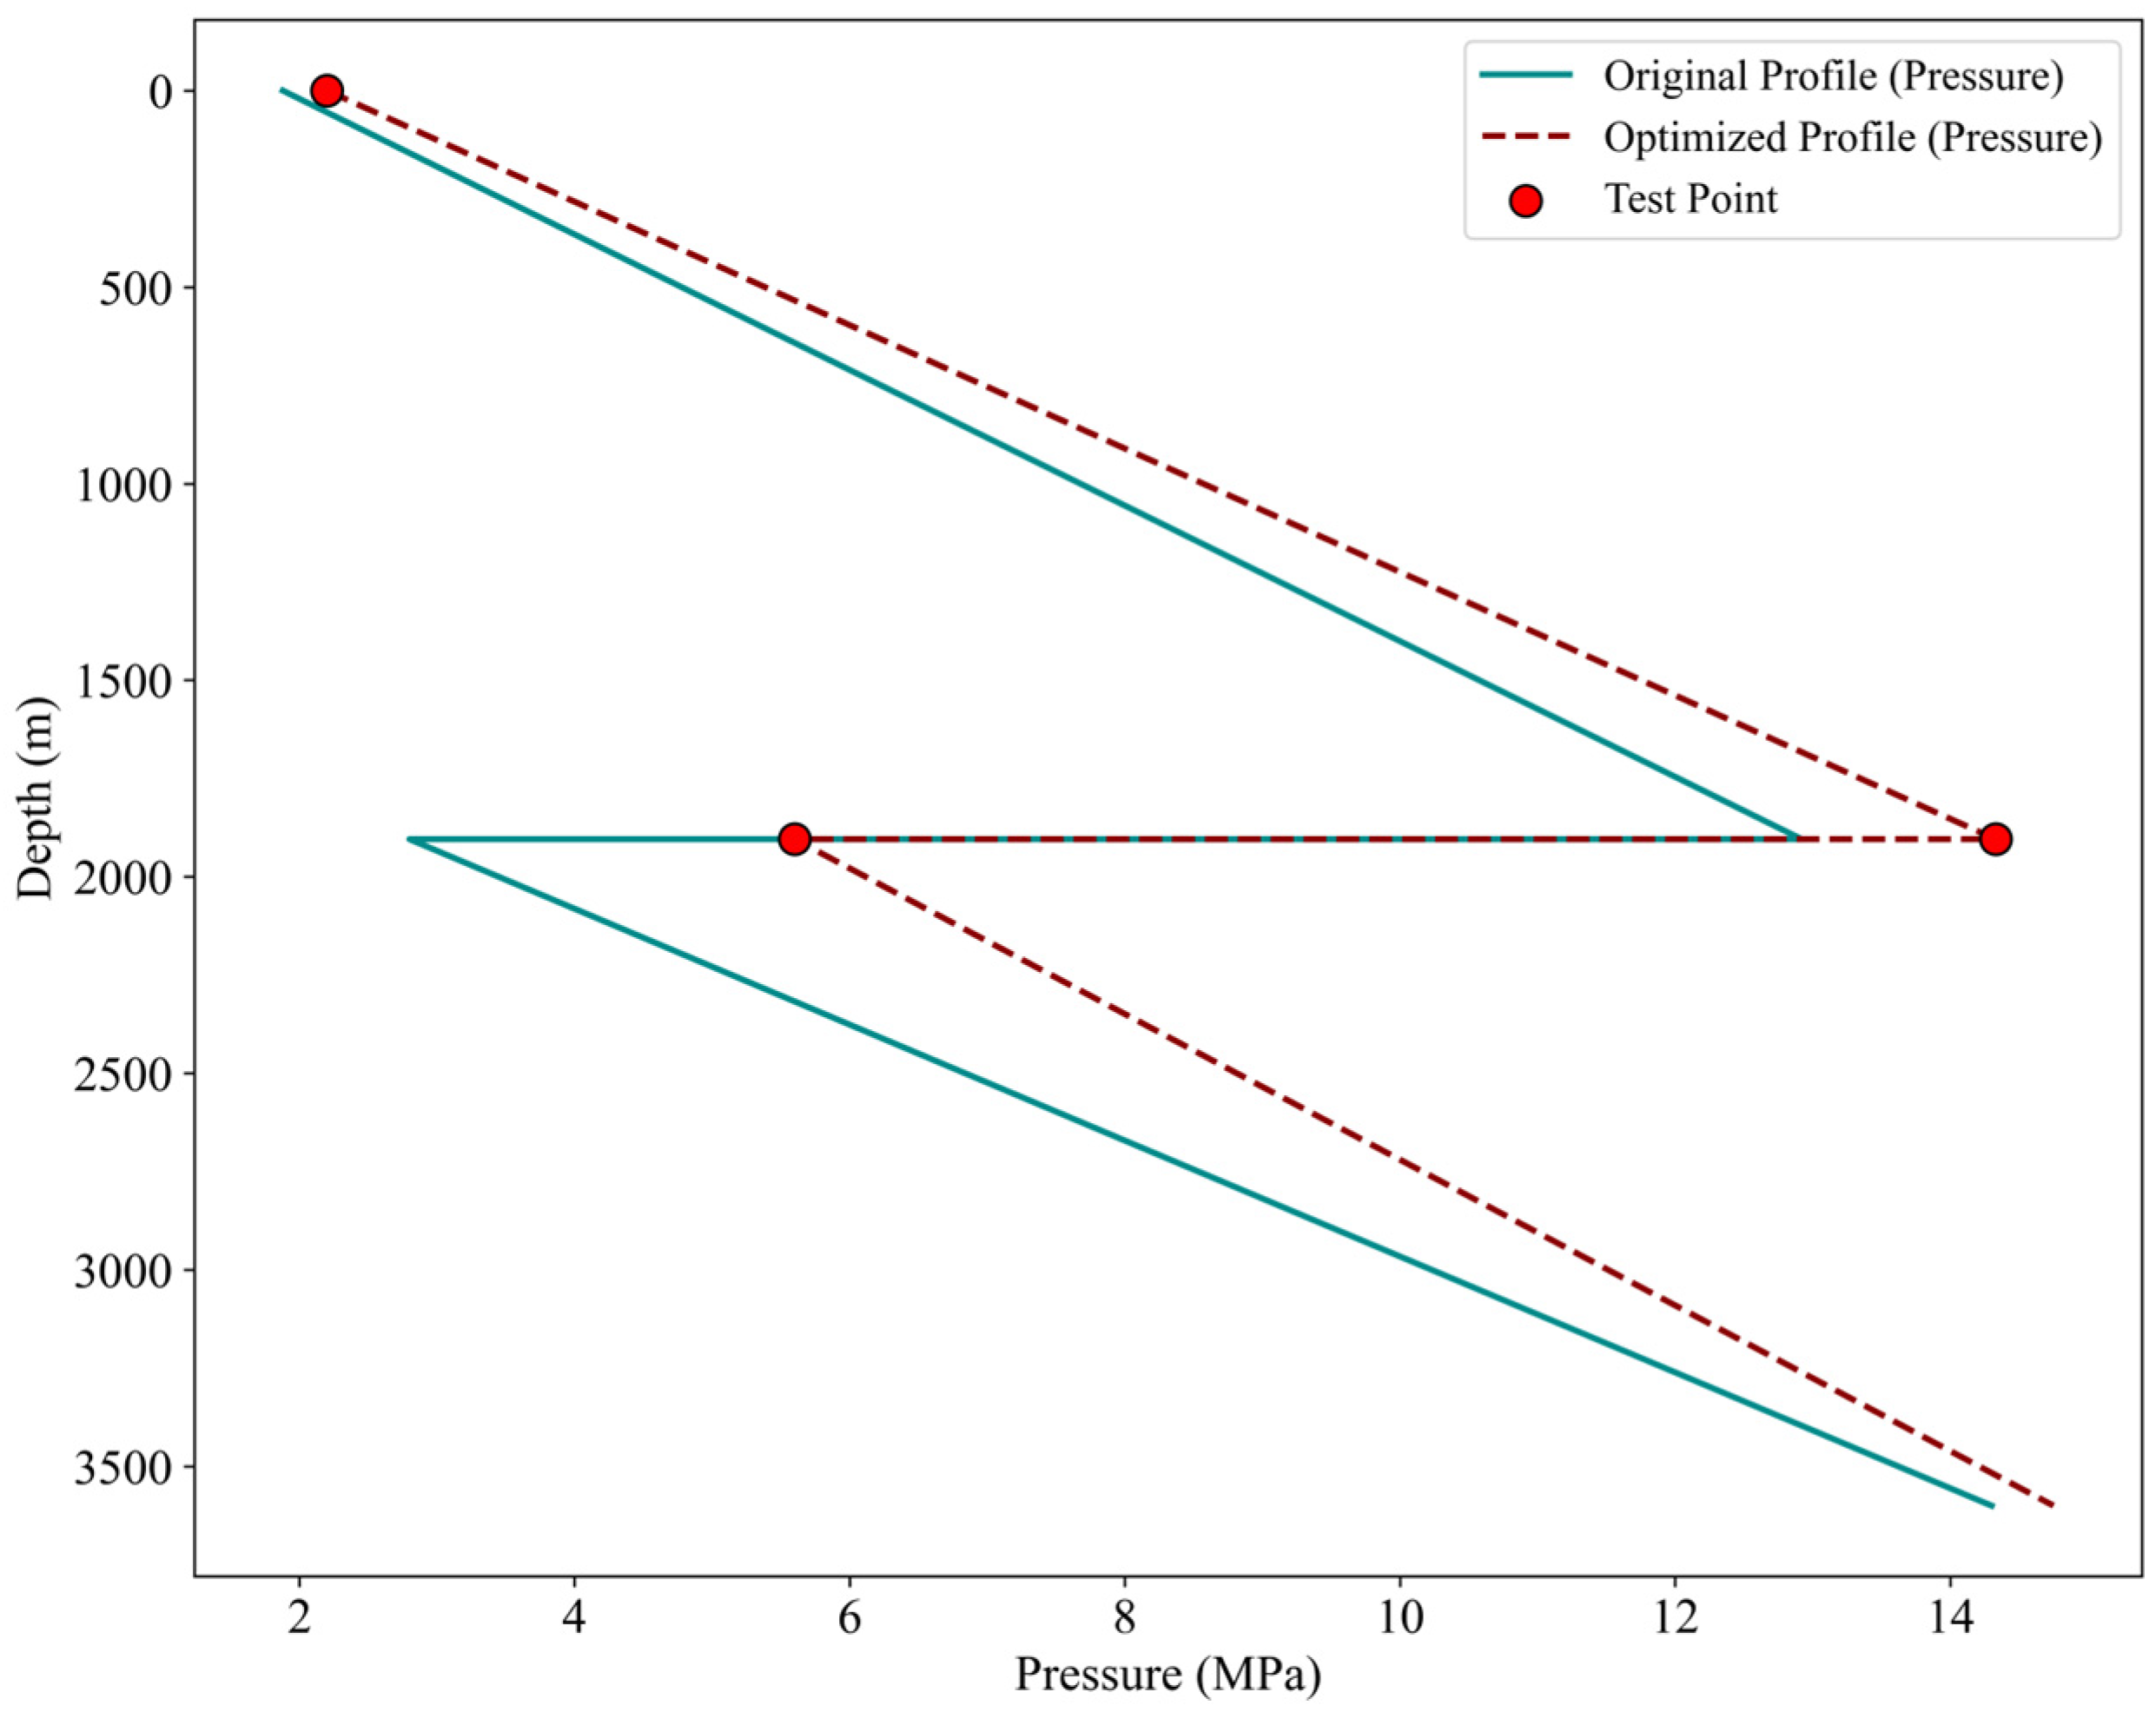
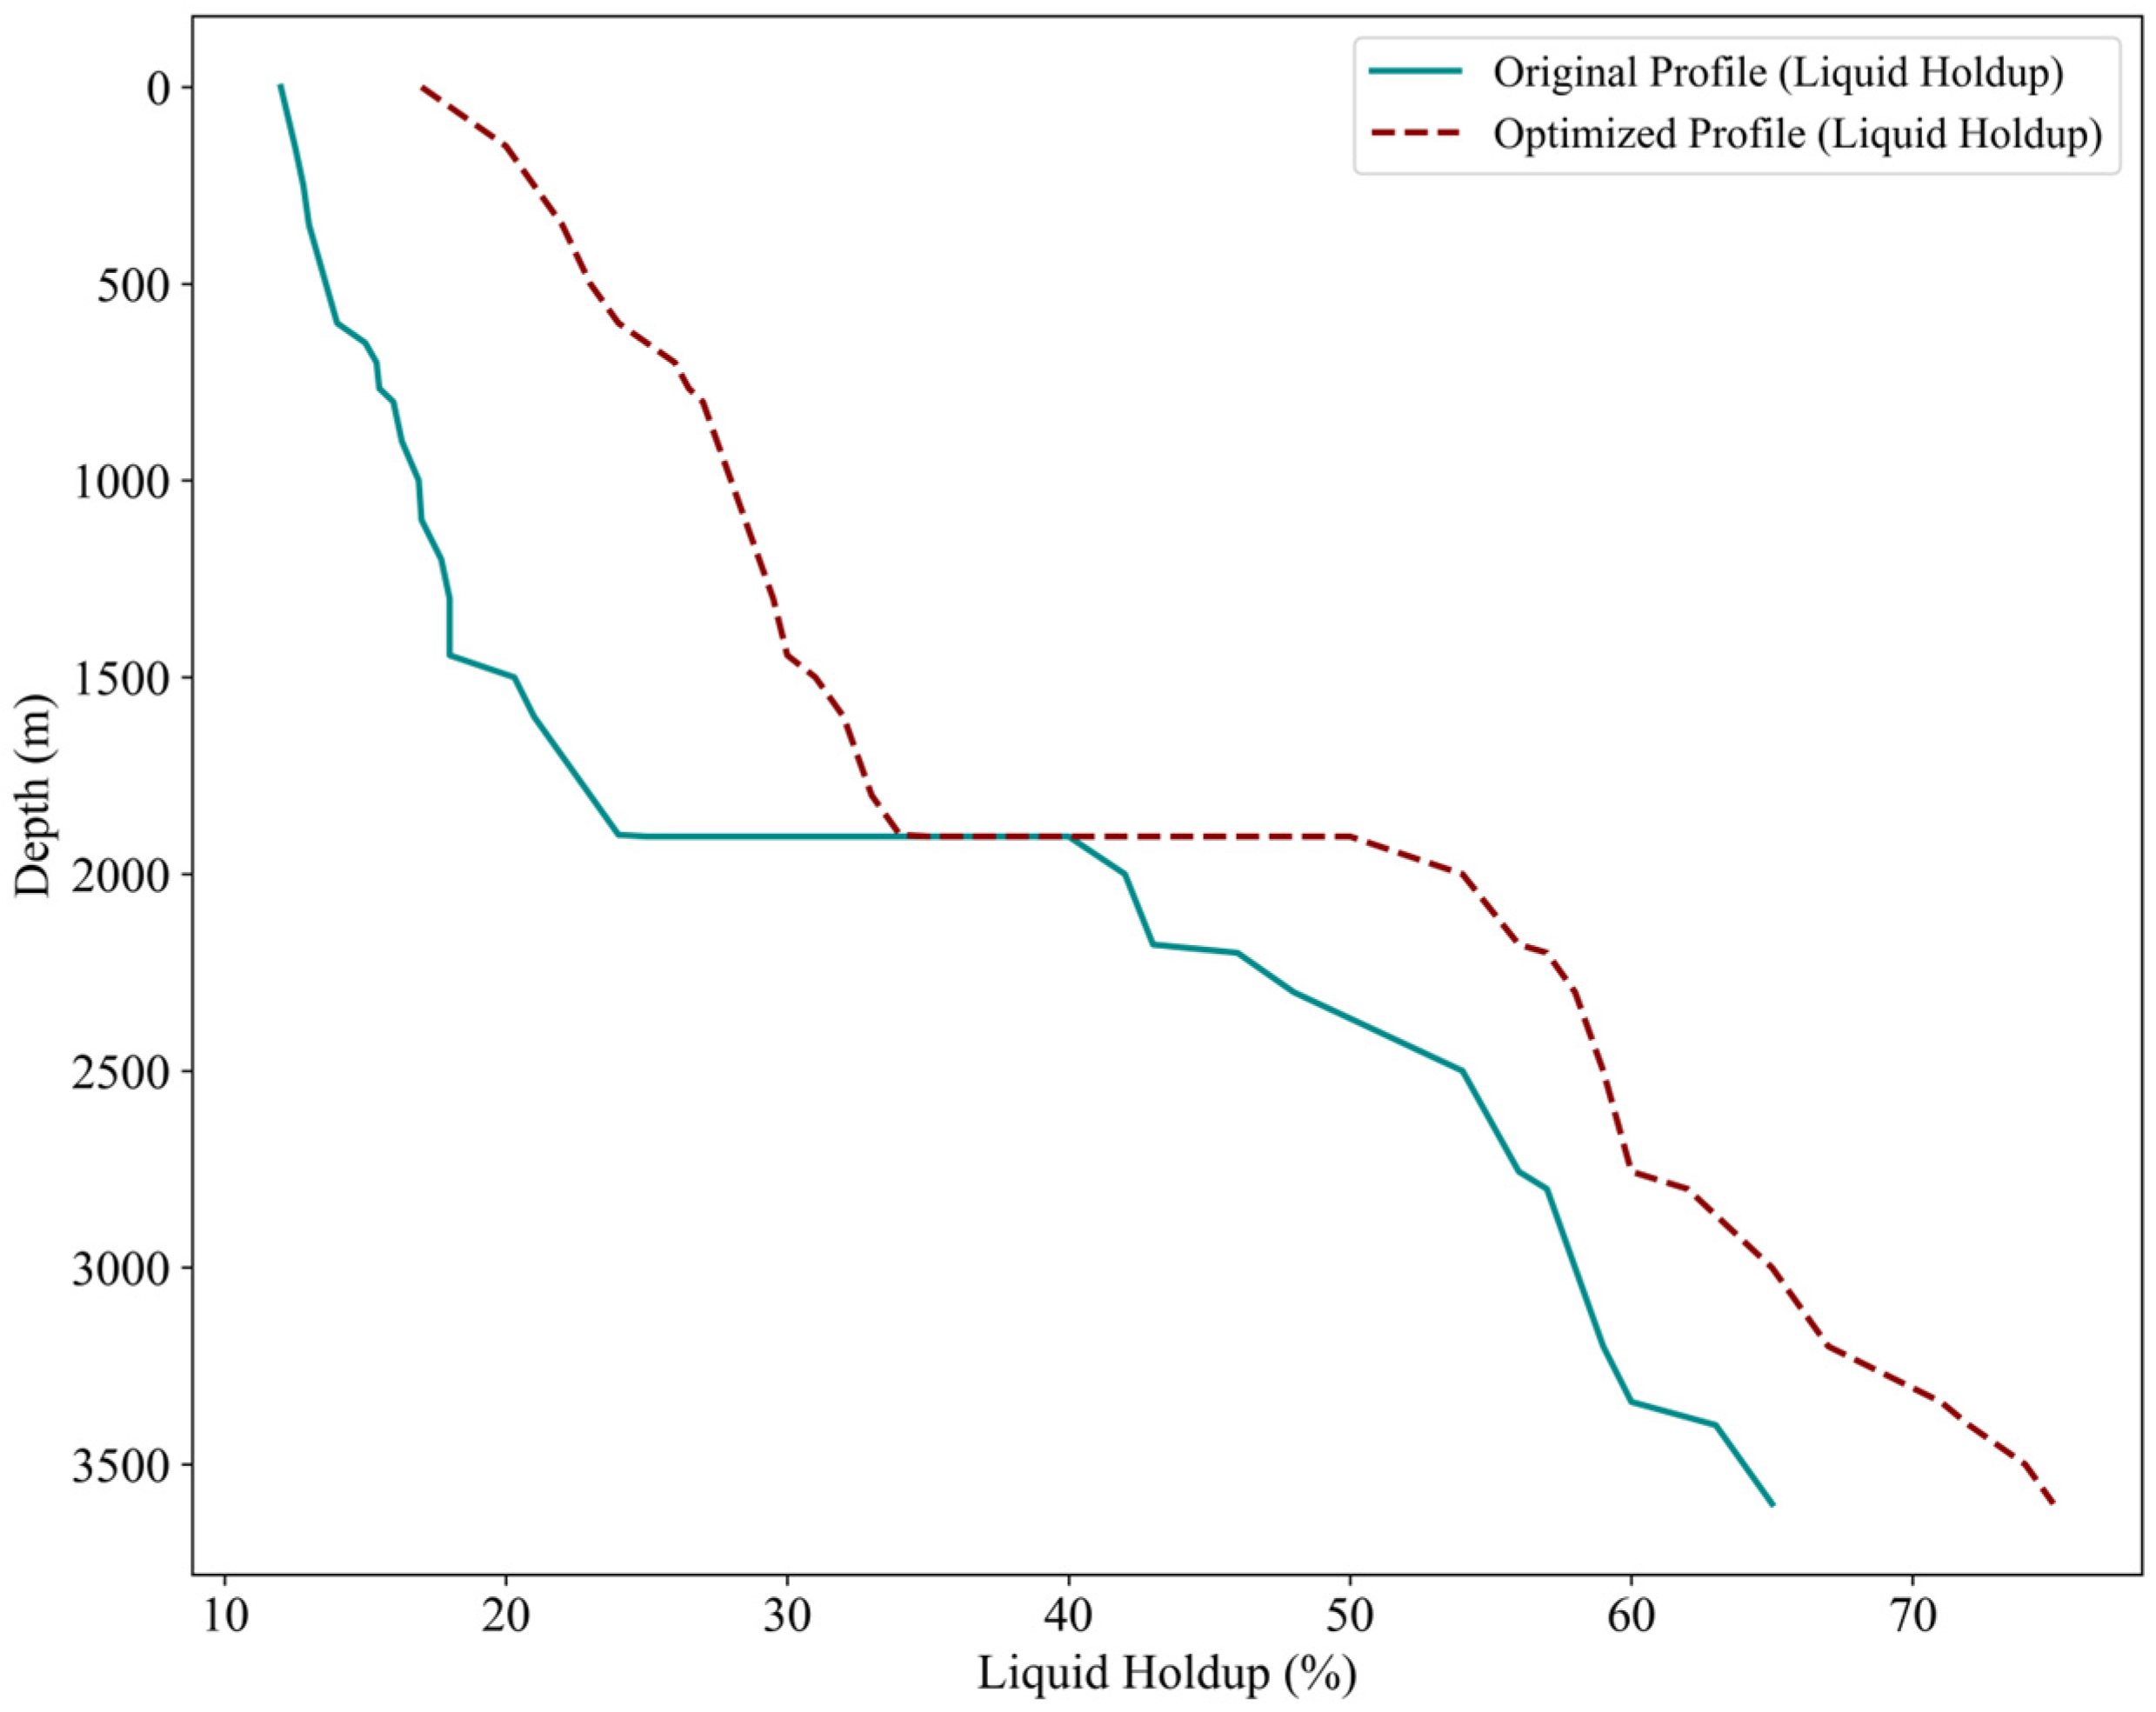
The profile data before and after optimization is shown in Figure 7 and Figure 8:
As shown in the figure, after implementing optimization measures, the wellhead pressure increased from 0.8 MPa to 1.5 MPa, while the pump suction pressure rose from 3.5 MPa to 5.5 MPa. Concurrently, the liquid holdup in the pump suction section increased from 28% to 40%. This indicates that the frequency reduction operation has elevated the liquid content in the suction section, leading to improved fluid flow conditions within the well.
(2)
Well A2:
This well is a directional well with a casing diameter of 244 mm in the oil layer. The surface crude oil density is 940 kg/m3, and the surface crude oil viscosity is 220.9 mPa.s, with a water cut of 74.2%. The relative density of the natural gas is 0.8, the wellhead oil pressure is 2.3 MPa, and the current formation static pressure is 6.08 MPa. The well’s current daily liquid production is 82.30 m3/d, with a production gas-oil ratio of 15 m3/m3. The nozzle diameter is 16.7 mm, and the pump depth is 1098.8 m. The rated discharge of the electric pump used is 400 m3/d, with a rated lift of 800 m, and the number of stages of the submersible pump is 174. The motor’s rated power is 167 KW with a rated voltage of 540 V, operating at a frequency of 40 Hz.
Through analysis of the fitted results, it was found that the overall liquid holding rate of this well is relatively high, but the operating current is only 21 A, indicating low power. Therefore, it is determined that the back pressure is relatively high. The predetermined optimization operation is applied, opening the throttle valve by 5% to reduce system back pressure and increase discharge.
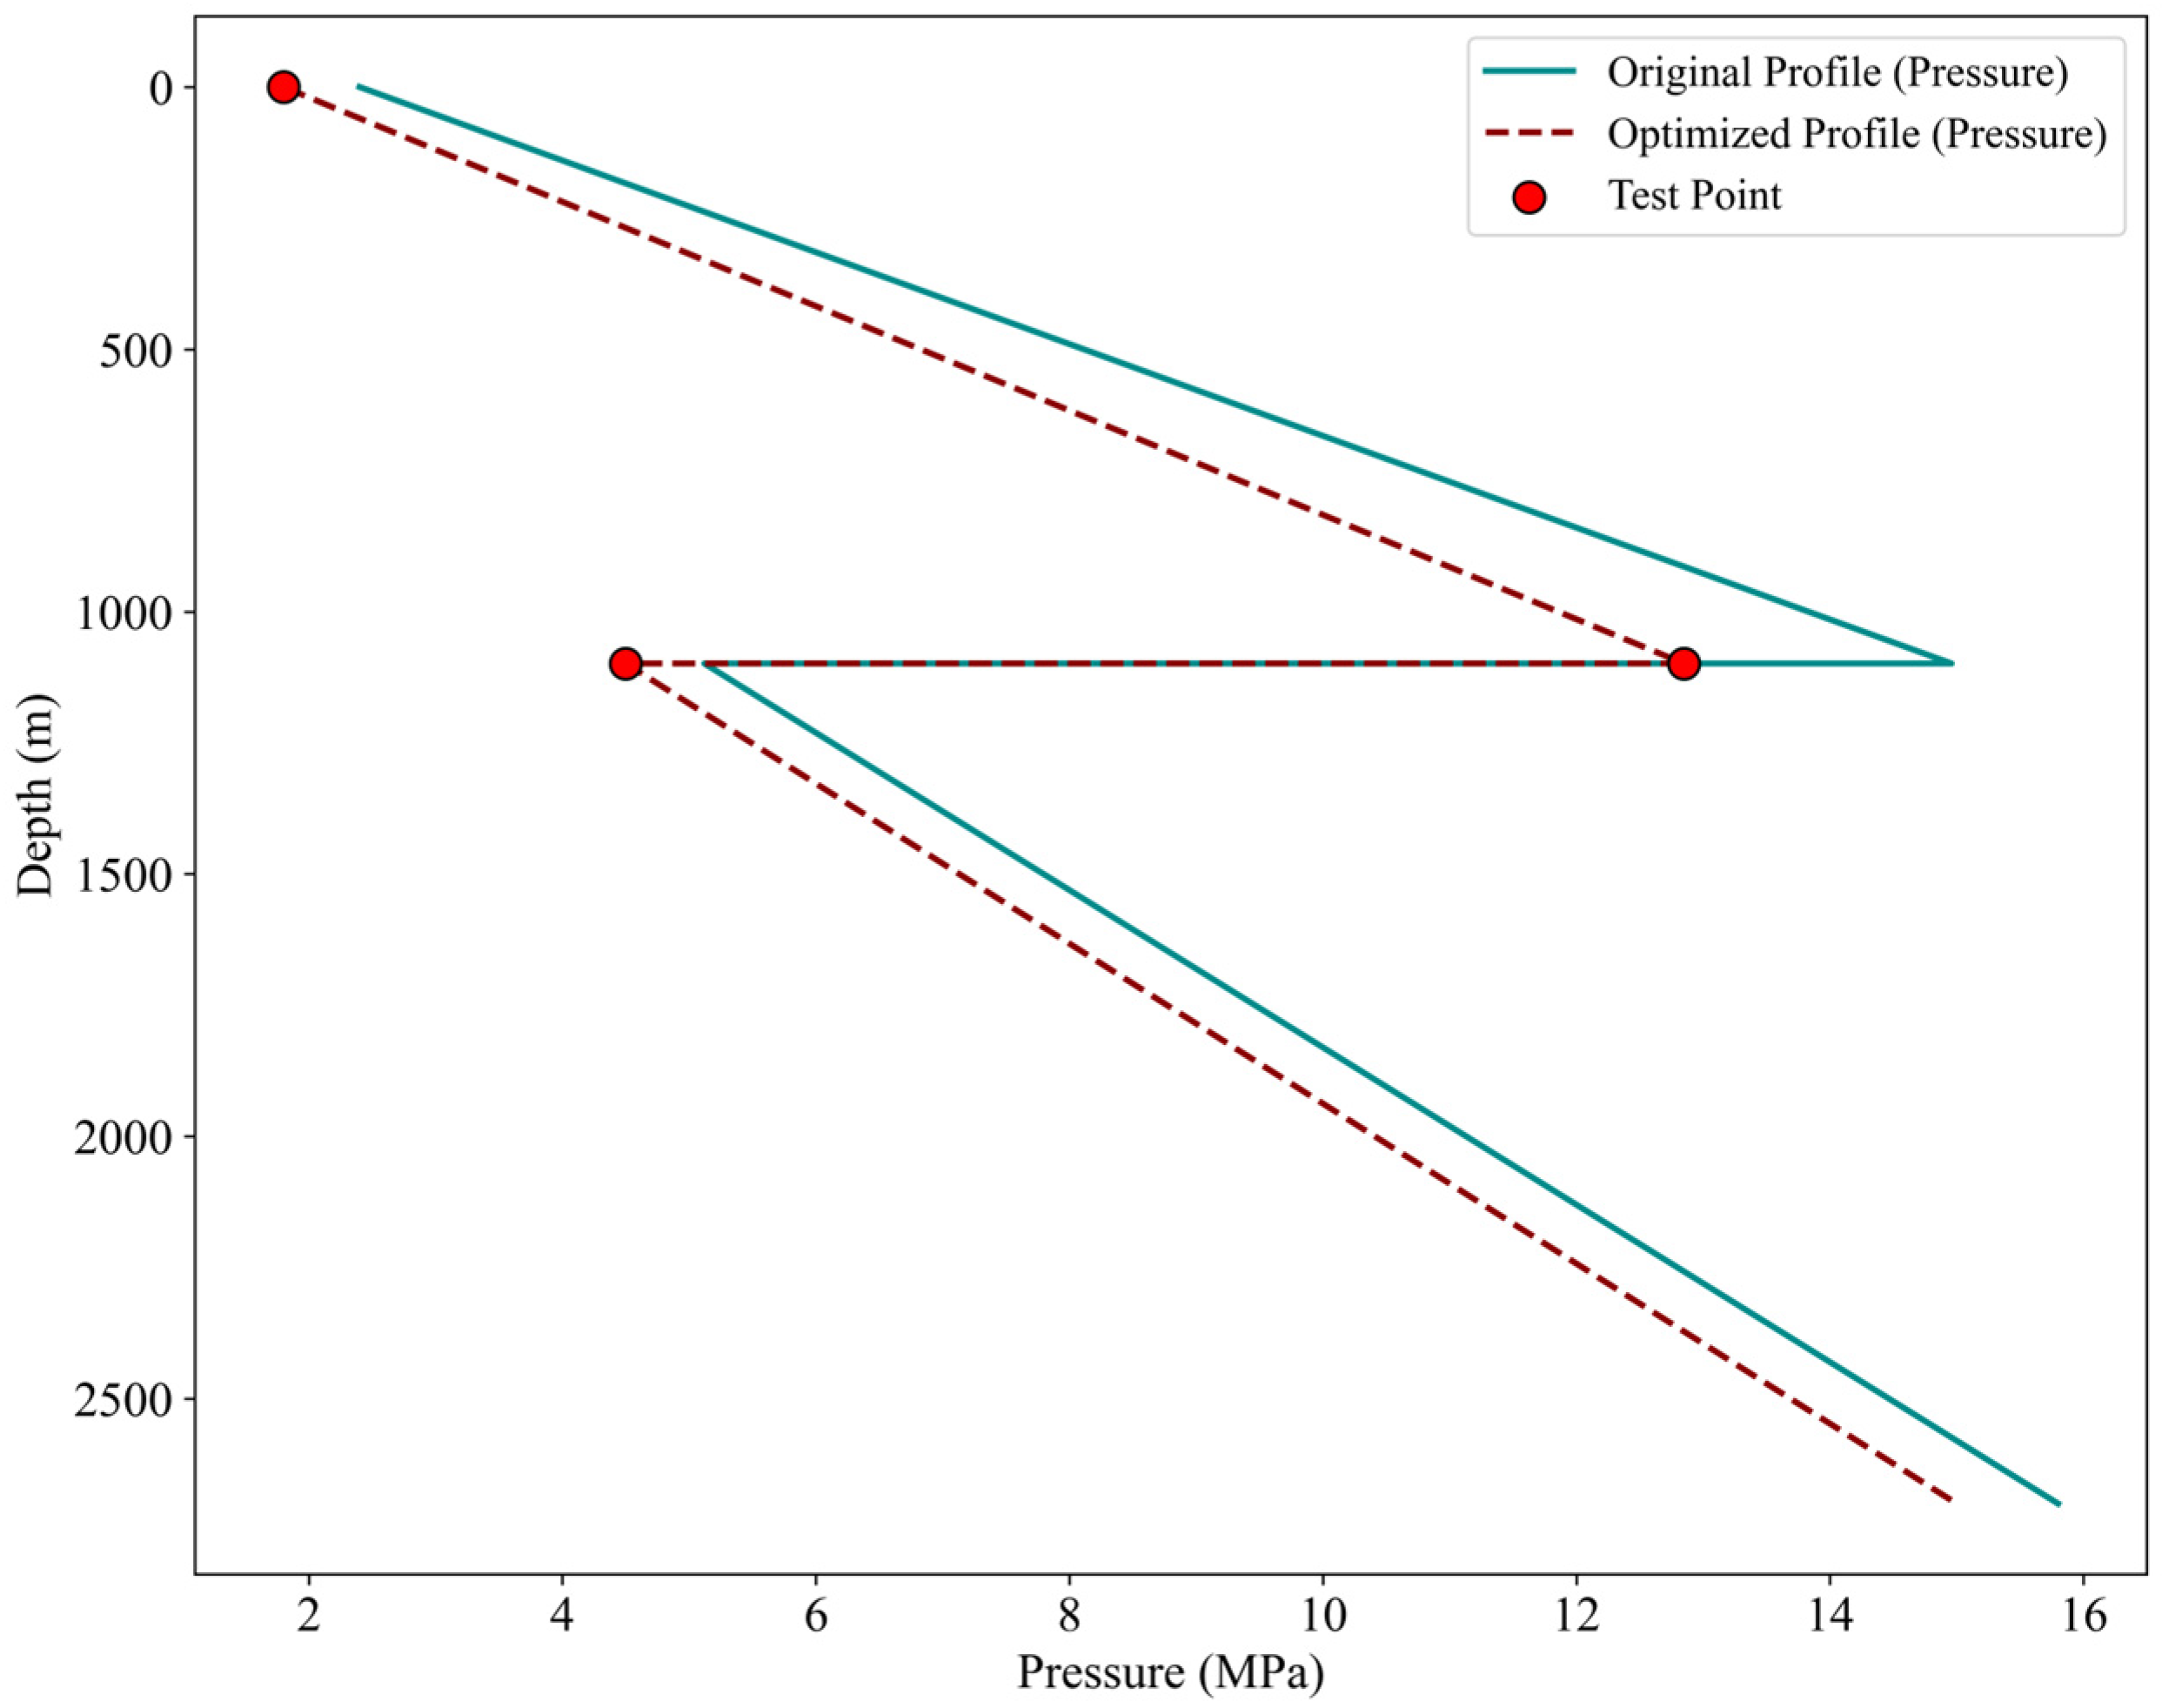
The profile data before and after optimization is shown in Figure 9 and Figure 10:
As shown in the figure, after implementing optimization measures, the system backpressure decreased from 14.96 MPa to 12.85 MPa, while the overall pressure drop across the wellbore also exhibited a certain reduction. Concurrently, the overall liquid holdup decreased by approximately 10%. This demonstrates that opening the throttle valve operation has increased the pump’s discharge capacity, thereby improving the low production issue.
(3)
Well A3:
This well is a directional well with a casing diameter of 176 mm in the oil layer. The surface crude oil density is 800 kg/m3, and the surface crude oil viscosity is 318.6 mPa.s, with a water cut of 40.7%. The relative density of the natural gas is 0.95, the wellhead oil pressure is 1.88 MPa, and the current formation static pressure is 3.2 MPa. The well’s current daily liquid production is 71.50 m3/d, with a production gas-oil ratio of 40.37 m3/m3. The nozzle diameter is 11.5 mm, and the pump depth is 1904.41 m. The rated discharge of the electric pump used is 850 m3/d, with a rated lift of 800 m, and the number of stages of the submersible pump is 145. The motor’s rated power is 160 KW with a rated voltage of 540 V, operating at a frequency of 50 Hz.
Through analysis of the fitted results, it was found that the pressure drop at the pump inlet occurred intermittently, indicating a periodic gas lock. So, in Well A3, the pump shutdown time was extended from 2 h to 3 h, which allowed sufficient liquid accumulation to prevent gas lock events while avoiding excessive downtime. This change improved operational stability without adversely affecting average daily production.
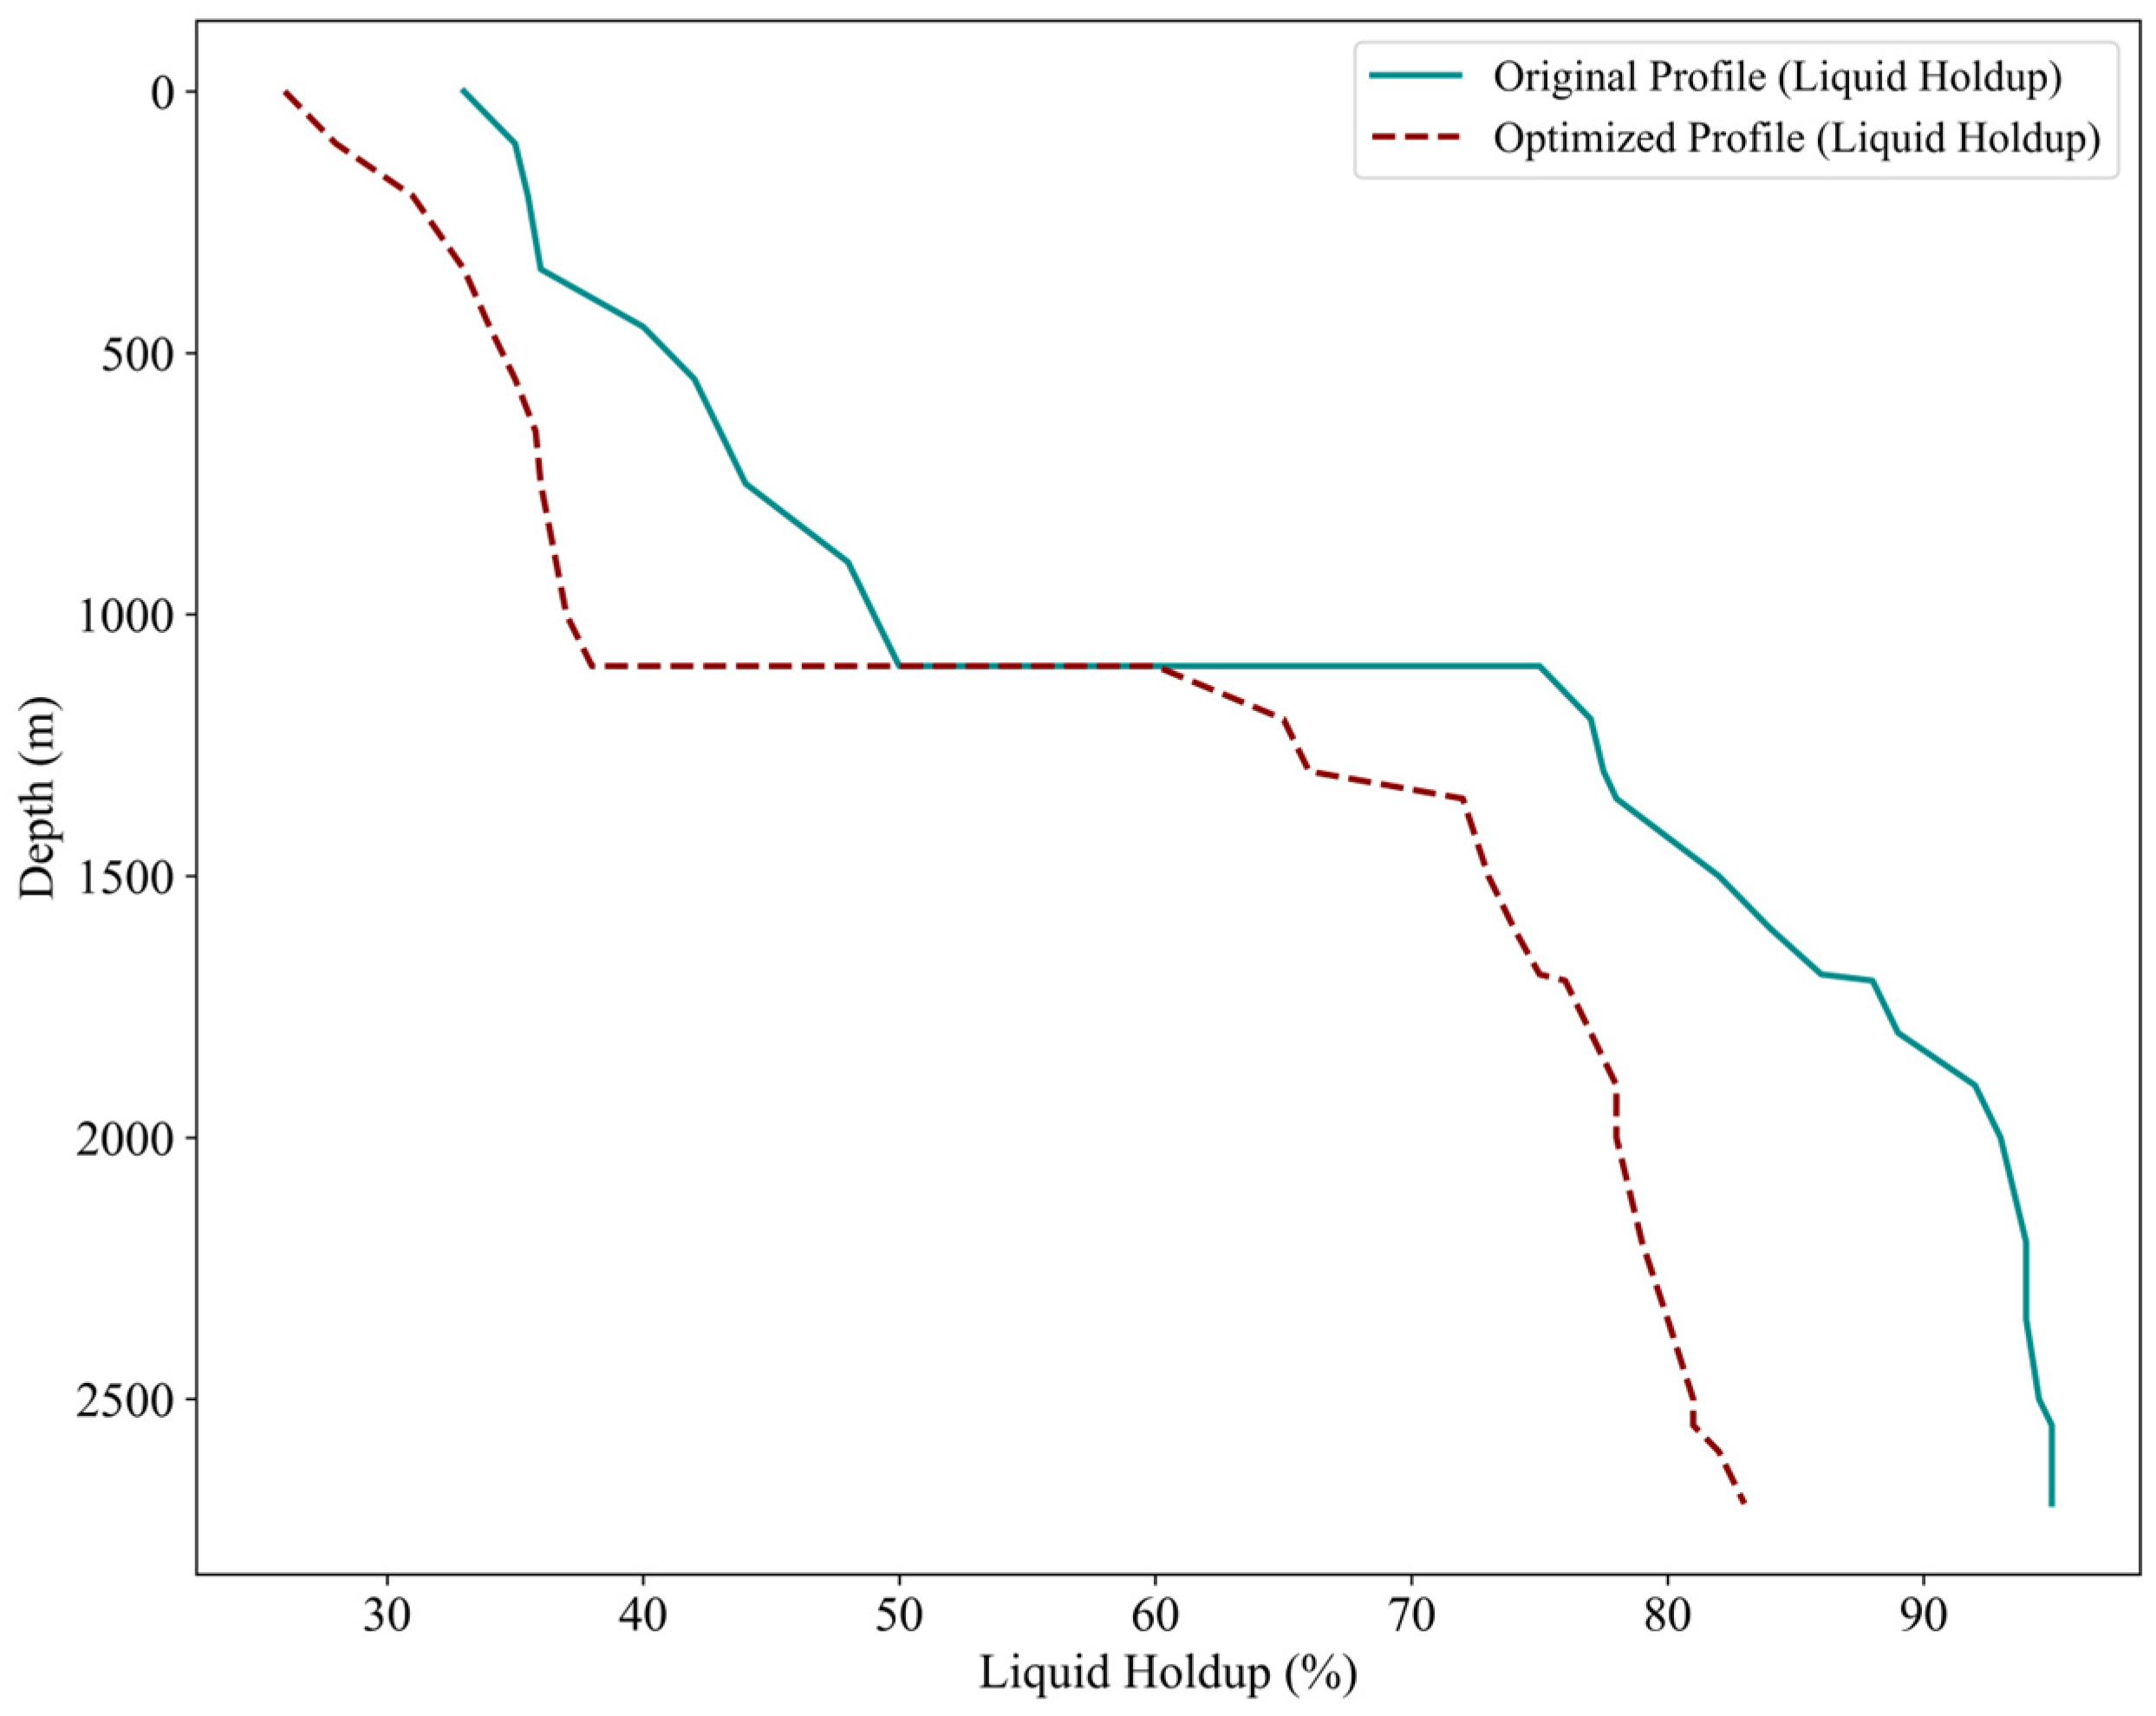
The profile data before and after optimization is shown in Figure 11 and Figure 12:
As shown in the figure, After the optimization operation, the pump suction pressure increased from 2.8 MPa to 5.6 MPa, while the liquid holdup in various sections of the wellbore showed improvement. This indicates that prolonging the pump shutdown duration has reduced the gas content in the pump suction section, thereby mitigating the gas locking issue.
Across the three case wells, the genetic algorithm demonstrated fast and stable convergence. On average, the optimization required about 90 generations to achieve convergence. The fastest case (Well A1) converged within 80 generations, while the slowest (Well A3) required approximately 100 generations. The relatively small difference in convergence speed across the wells indicates that the optimization procedure is consistently efficient under different well conditions.
At the beginning of the iterations, the theoretical pressure profiles showed a clear deviation from the measured points. With successive generations, the fitted profiles gradually shifted toward the measured data in a consistent direction, with the overall deviation steadily reduced until convergence was achieved. This behavior demonstrates that the matching process is robust and effective in correcting the initial discrepancy between calculated and measured wellbore profiles.
The overall optimization results of the experiment are as follows:
(1)
The average daily liquid production increased from 107 m3/d to 140 m3/d, indicating a certain improvement in yield.
(2)
The stable operating duration of the pump increased from 10.6 h to 22.3 h.
(3)
The coefficient of fluctuation in pump current decreased from 0.21 to 0.08, indicating a more stable operating state.
(4)
The energy consumption per unit of liquid produced decreased from 2.7 kWh/m3 to 2.2 kWh/m3, indicating a significant gain in energy efficiency and implying tangible economic benefits through reduced power expenditures.
A summary of the key well parameters before and after optimization is showed in Table 4:
Table 4 shows that optimization led to higher pump intake pressures in Wells A1 and A3 and a reduction in Well A2, contributing to more stable ESP operation. Liquid production increased in all wells, liquid holdup shifted toward more favorable ranges, and unit energy consumption decreased, indicating both improved efficiency and economic benefit.

4. Conclusions

(1)
The method proposed in this paper, based on the multi-phase flow fitting in the wellbore, can effectively reconstruct the gas–liquid profile, thereby identifying flow anomalies during operation. This innovative approach provides real-time monitoring of flow status for the ESP system, contributing to enhanced operational stability.
(2)
By analyzing the identified anomalies in the flow profile, this paper developed optimization control recommendations, including adjustments to frequency, choke valve opening, and start-stop durations. These recommendations not only improve the operational efficiency of the ESP but also provide scientific decision-making support for operators.
(3)
Compared with traditional alarm methods, the proposed profile-matching approach reduced the false alarm rate from ~25% to <10% and shortened the average response time from more than 10 min to less than 2 min. Relative to MCSA-based approaches, which report typical detection accuracies of around 80%, the proposed method achieved over 90% accuracy in identifying gas interference events. In contrast to sensor-based methods, which require additional hardware investment of 15–20% CAPEX, our approach relies solely on existing well data, thus significantly reducing implementation costs.
(4)
After applying the optimization methods, the continuity and stability of the ESP system have significantly improved. For wells experiencing insufficient pressure and suboptimal liquid holdup, post-optimization results show an average increase of 2 MPa in pump suction pressure and an average 10% improvement in liquid holdup. This enhancement effectively reduces the number of pump starts and stops, thereby minimizing equipment wear and failures caused by frequent switching.
(5)
Following the optimization of operating parameters, energy consumption can be significantly reduced average of 0.5 kWh/m3 while prolonging the lifespan of submersible pump equipment. This advantage not only presents considerable economic benefits but also aligns with the sustainability requirements advocated in the current industrial sector, providing new insights and references for future ESP system optimizations.

Author Contributions

Conceptualization, M.W. and G.H.; methodology, Y.S.; validation, Y.J., Y.L. and T.W.; data curation, Z.X.; writing—original draft preparation, Y.S.; writing—review and editing, X.Z.; supervision, M.W.; project administration, Y.J.; All authors have read and agreed to the published version of the manuscript.

Funding

This research received no external funding.

Data Availability Statement

The original contributions presented in this study are included in the article. Further inquiries can be directed to the corresponding author.

Conflicts of Interest

Authors Mingchun Wang, Xinrui Zhang, Yuchen Ji, Yupei Liu, Tianhao Wang and Zixiao Xing were employed by the company CNOOC Research Institute. The remaining authors declare that the research was conducted in the absence of any commercial or financial relationships that could be construed as a potential conflict of interest.

References

  1. Janadeleh, M.; Ghamarpoor, R.; Abbood, N.K.; Seyednooroldin, H.; Hasan, N.; Ali, Z.H. Evaluation and selection of the best artificial lift method for optimal production using pipesim software. Heliyon 2024, 10, e36934. [Google Scholar] [CrossRef] [PubMed]
  2. Leon, F.I.; Alvear, J.L.; Naranjo, R.R.; Vela, N.A.; Amores, D.A.; Perez, M.A.; Pancho, J.G.; Aguirre, L.X.; Sierra, O.G.; Villalobos, J.L.; et al. Comparative Study of the World’s First Deployment of a Compact Wide-Range ESP System with Induction Motor at MDC Field, Ecuador; ADIPEC: Abu Dhabi, United Arab Emirates, 2024. [Google Scholar]
  3. Pant, H. Best Pumping Practices to Optimize Dewatering in CBM wells: Lessons Learned Developing Raniganj East Field, India. In Proceedings of the SPE Unconventional Resources Conference and Exhibition-Asia Pacific, Brisbane, Australia, 11 November 2013. [Google Scholar]
  4. Wang, H. Electrical Submersible Pump Theory and Application; Petroleum Industry Press: Beijing, China, 1994. [Google Scholar]
  5. Han, G.; Chen, M.; Zhang, H.; Ling, K. Real-Time Monitoring and Diagnosis of Electrical Submersible Pump. In Proceedings of the SPE Annual Technical Conference and Exhibition, Houston, TX, USA, 28–30 September 2015. [Google Scholar]
  6. Hoefel, A.; Kelly, D.; Jin, R.; Meier, D.; Chu, T.; Anderson, J.; Chong, J. ESP System Monitoring and Diagnosis from Surface Power Acquisition. In Proceedings of the SPE Gulf Coast Section—Electric Submersible Pumps Symposium, The Woodlands, TX, USA, 2–6 October 2023. [Google Scholar]
  7. Lu, X.; Han, G.; Wang, L.; Zhang, Z.; Liang, X. Fault Diagnosis of Electric Submersible Pump System Based on Motor Current Signal Analysis and Deep Learning Method. SPE J. 2025, 30, 2238–2255. [Google Scholar] [CrossRef]
  8. Jiang, L.; Jiang, L.; Guo, S.; Xue, H.; Yang, L.; Tang, X. Intelligent ESPs Diagnostic Model Based on Big Data and Machine Learning; ADIPEC: Abu Dhabi, United Arab Emirates, 2024. [Google Scholar]
  9. Ulyanov, S.; Sagyndykov, R.; Davydov, D.; Dolinyuk, V.; Gilaev, G.; Totanov, A.; Nosov, S.; Ilyin, A. The Individual Certified Flowmeter of Liquid in the Well. In Proceedings of the SPE Russian Petroleum Technology Conference, Moscow, Russia, 15–17 October 2018. [Google Scholar]
  10. Cohen, D.J. Captain Field Electric Submersible Pump, Condition Monitoring And Completion Systems. In Proceedings of the Offshore Technology Conference, Houston, TX, USA, 5–8 May 1997. [Google Scholar]
  11. Nolen, K.B.; Glbbs, S.G. Analysis of Electric Submersible Pumping Systems, SPE16196. In Proceedings of the SPE Production Operations Symposium, Oklahoma City, OK, USA, 8–10 March 1987; Volume 2, pp. 114–115. [Google Scholar]
  12. Badkoubeh, A.; Waldner, L.B.; Imanfard, M. Field Validation: ESP Reliability Monitoring and Production Optimization by Trending Condition and Performance Data Extracted from ESP Surface Electrical Signals. In Proceedings of the SPE Gulf Coast Section—Electric Submersible Pumps Symposium, The Woodlands, TX, USA, 2–6 October 2023. [Google Scholar]
  13. El Mahbes, R.; Manfoumbi, W.; Kadio-Morokro, B. Real-Time Remote Monitoring to Enhance Electrical Submersible Pump System Run Life and Maximize Production. In Proceedings of the SPE Middle East Artificial Lift Conference and Exhibition, Manama, Bahrain, 28–30 November 2018. [Google Scholar]
  14. Beggs, D.H.; Brill, J.P. A study of two-phase flow in inclined pipes. J. Pet. Technol. 1973, 25, 607–617. [Google Scholar] [CrossRef]
  15. Rammay, M.H.; Alnuaim, S. Flow Regime Prediction Using Fuzzy Logic and Modification in Beggs and Brill Multiphase Correlation. In Proceedings of the International Petroleum Technology Conference, Doha, Qatar, 6–9 December 2015. [Google Scholar]
  16. Velez-Langs, O. Genetic algorithms in oil industry: An overview. J. Pet. Sci. Eng. 2005, 47, 15–22. [Google Scholar] [CrossRef]
  17. Costa, E.A.; Rebello, C.M.; Santana, V.V.; Reges, G.; Silva, T.O.; Abreu, O.S.L.; Ribeiro, M.P.; Foresti, B.P.; Fontana, M.; Nogueira, I.B.R.; et al. An uncertainty approach for Electric Submersible Pump modeling through Deep Neural Network. Heliyon 2024, 10, e24047. [Google Scholar] [CrossRef] [PubMed]
  18. Albori, M.; Alsadah, H. Comparative Simulation Studies of ESP Permanent Magnet and Induction Current Motors in ESP Selective Applications. In Proceedings of the Offshore Technology Conference, Houston, TX, USA, 1–4 May 2023. [Google Scholar]
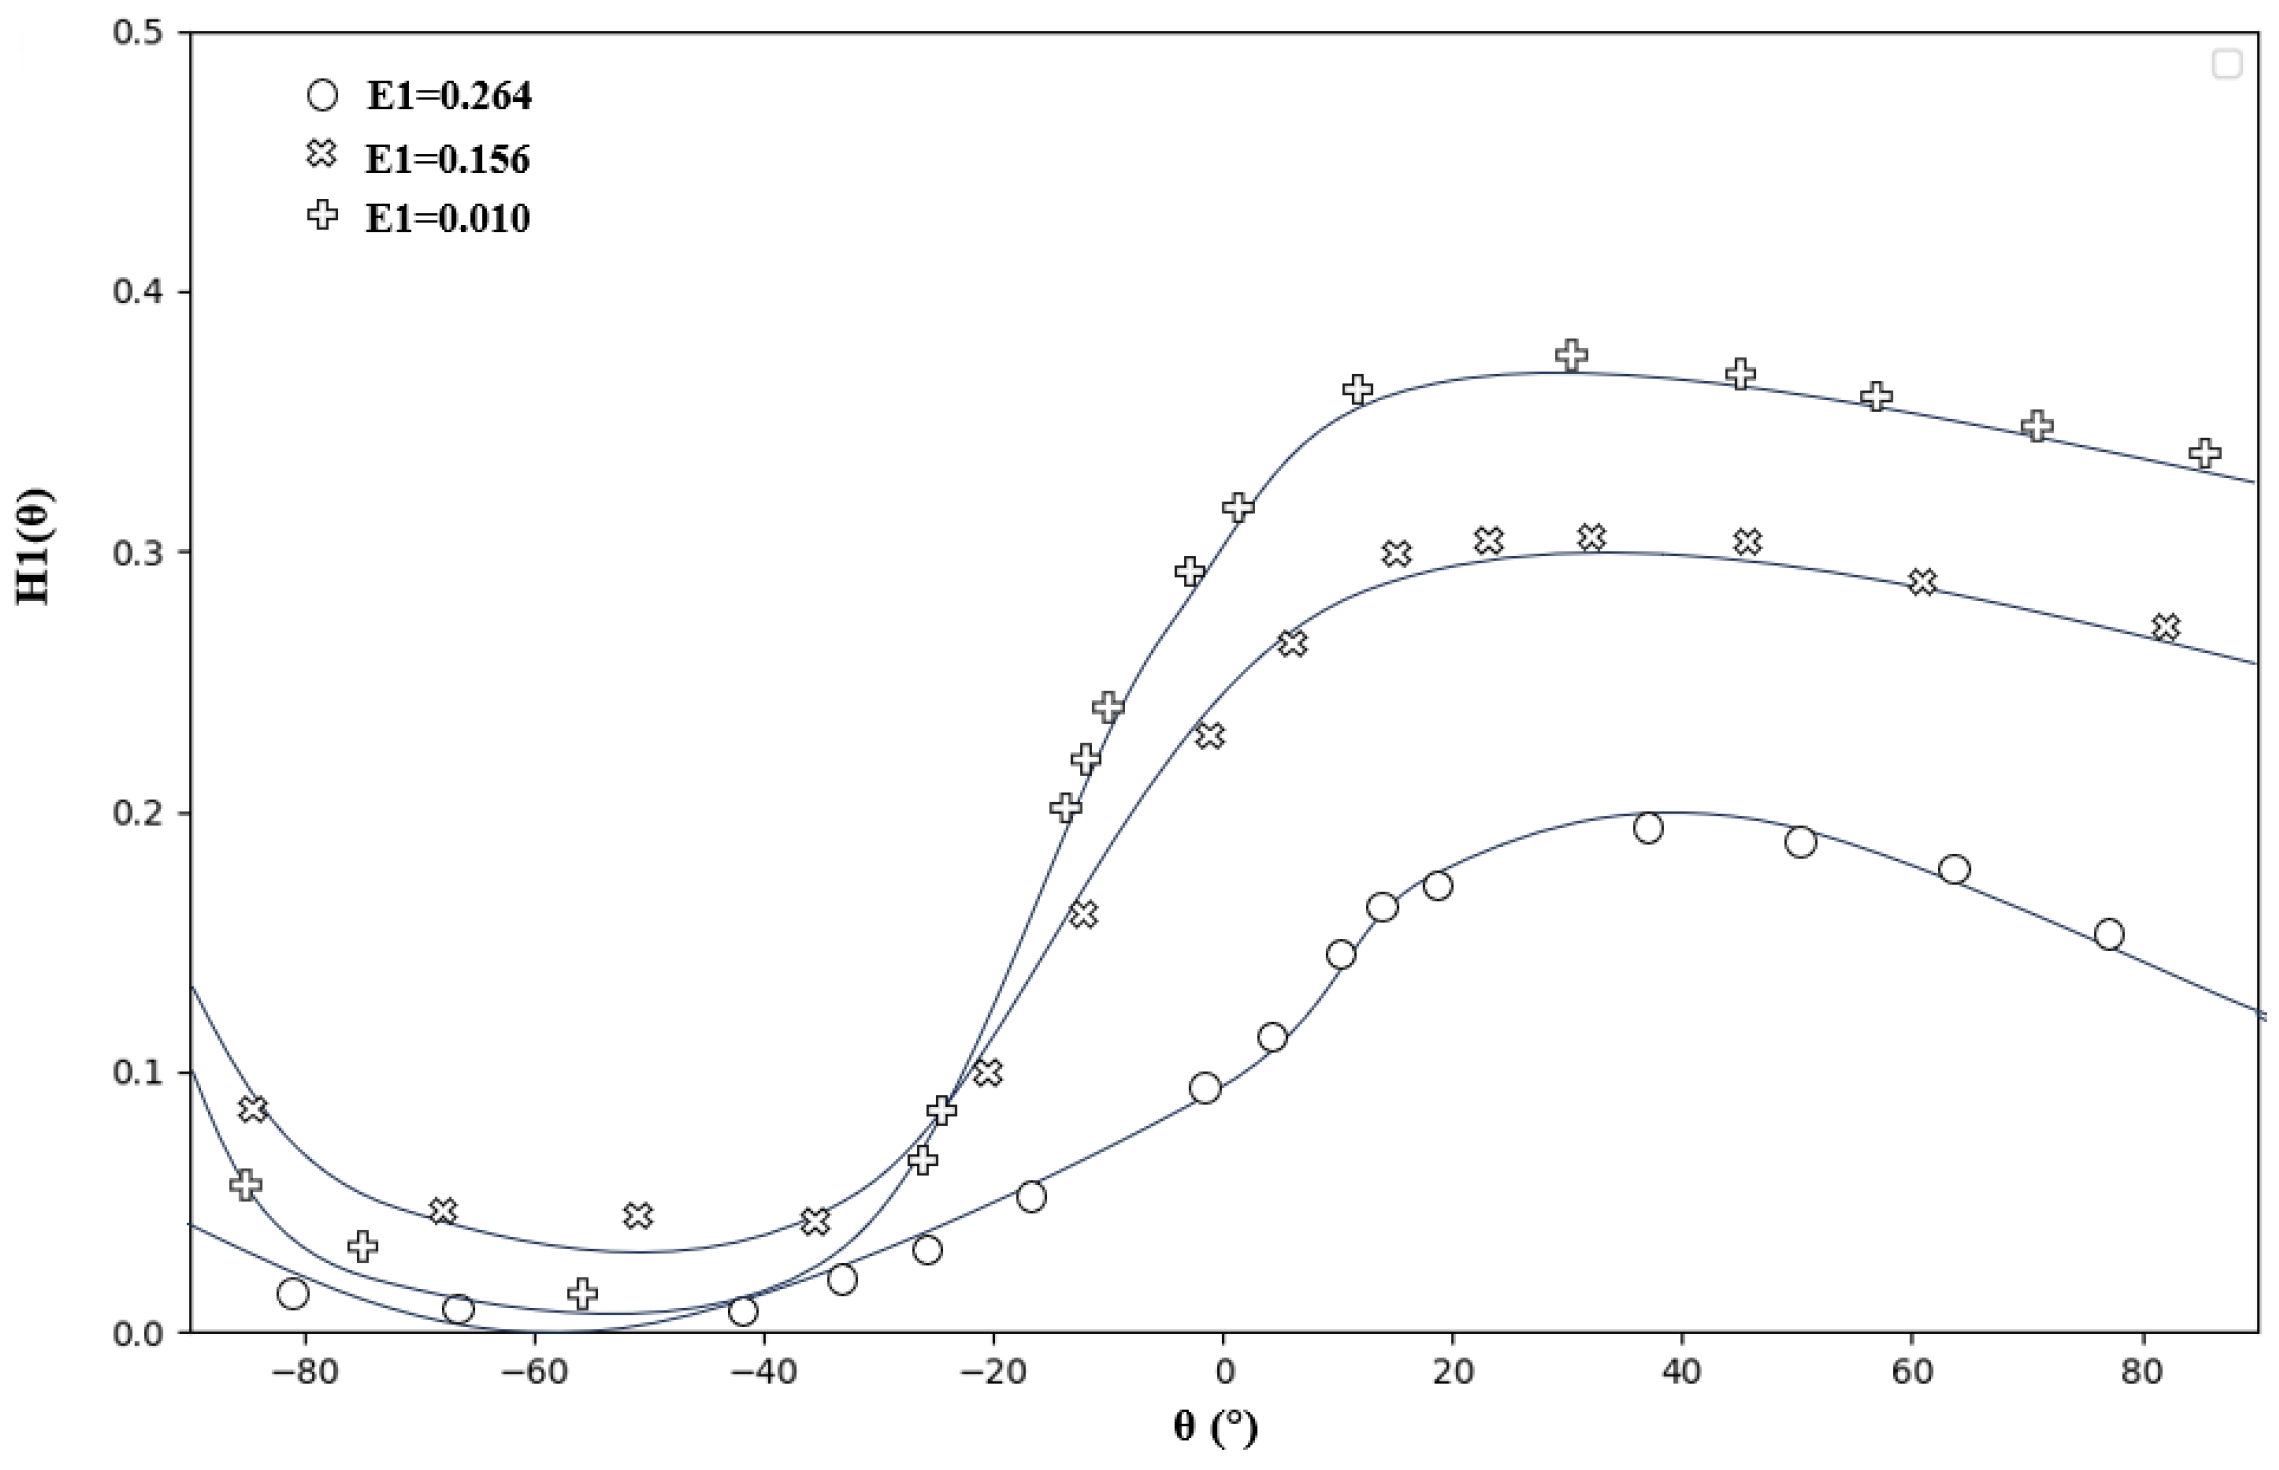
Figure 1. Relationship curve between liquid hold-up and angle.
Processes 13 03156 g001
Figure 2. Relationship curve between inclination correction factor and angle.
Processes 13 03156 g002
Figure 3. Beggs-Brill Method Flow Pattern Diagram.
Processes 13 03156 g003
Figure 4. Pressure Profile Fitting Results of Well X.
Processes 13 03156 g004
Figure 5. Liquid Holdup Profile Fitting Results of Well X.
Processes 13 03156 g005
Figure 6. Schematic Diagram of the Parameter Optimization Method for Electric Submersible Pump Wells.
Processes 13 03156 g006
Figure 7. Original Pressure Profile and Optimized Pressure Profile for Well A1.
Processes 13 03156 g007
Figure 8. Original Liquid Holdup Profile and Optimized Liquid Holdup Profile for Well A1.
Processes 13 03156 g008
Figure 9. Original Pressure Profile and Optimized Pressure Profile for Well A2.
Processes 13 03156 g009
Figure 10. Original Liquid Holdup Profile and Optimized Liquid Holdup Profile for Well A2.
Processes 13 03156 g010
Figure 11. Original Pressure Profile and Optimized Pressure Profile for Well A3.
Processes 13 03156 g011
Figure 12. Original Liquid Holdup Profile and Optimized Liquid Holdup Profile for Well A3.
Processes 13 03156 g012
Table 1. Frequency Optimization Logic.
Fitted Profile ConditionDetermination BasisRecommended Action
Liquid proportion at the inlet is lowThe liquid hold-up rate at the inlet segment is less than 30%, and the gravitational pressure drop in that segment is significantly reducedReduce pump frequency by 3 to 5 Hz
Inlet pressure is too lowThe pressure at the inlet segment is significantly lower than the minimum pressure required for stable liquid suction Reduce pump frequency by 2 Hz
Table 2. Nozzle Valve Opening Optimization Logic.
Fitted Profile ConditionDetermination BasisRecommended Action
Liquid column height is insufficientThe hold-up rate in the middle section is less than 30%, and the gravitational pressure drop is smallClose the nozzle by 5% to 10% to increase pump inlet pressure
Back pressure is too highOverall frictional pressure drop is large, hold-up rate is high, but there is no significant increase in current or shaft powerOpen the nozzle by 5% to reduce system back pressure and increase flow rate
Table 3. Pump Shutdown Time Optimization Logic.
Fitted Profile ConditionDetermination BasisRecommended Action
Periodic gas locking occursIntermittent abnormal pressure drop at the pump inletExtend the pump shutdown time to avoid frequent starts and stops that can damage the pump body
Table 4. Summary of well key parameters before and after optimization.
WellPump Intake Pressure (MPa)Liquid Production (m3/d)Liquid Holdup
(%)
Energy Consumption (kWh/m3)
A13.5 → 5.5168.68 → 177.830 → 402.7 → 2.2
A25.2 → 4.282.3 → 93.450 → 402.6 → 2.1
A32.8 → 5.671.5 → 8230 → 202.5 → 2.0
Disclaimer/Publisher’s Note: The statements, opinions and data contained in all publications are solely those of the individual author(s) and contributor(s) and not of MDPI and/or the editor(s). MDPI and/or the editor(s) disclaim responsibility for any injury to people or property resulting from any ideas, methods, instructions or products referred to in the content.