Article

Kinetic and Thermodynamic Study of Vacuum Residue Cracking over Cerium-Modified Metakaolinite Catalyst

by
Osamah Basil Al-Ameri
1,
Mohammed Alzuhairi
2,*,
Zaidoon Shakor
3,
Esther Bailón-García
1,
Francisco Carrasco-Marín
1 and
Juan Amaro-Gahete
1,*
1
Materiales Polifuncionales Basados en Carbono (UGR-Carbon), Departamento de Química Inorgánica, Unidad de Excelencia Química Aplicada a Biomedicina y Medioambiente, Universidad de Granada (UEQ-UGR), ES18071 Granada, Spain
2
College of Materials Engineering, University of Technology-Iraq, Baghdad 10066, Iraq
3
College of Chemical Engineering, University of Technology-Iraq, Baghdad 10066, Iraq
*
Authors to whom correspondence should be addressed.
Processes 2025, 13(10), 3126; https://doi.org/10.3390/pr13103126
Submission received: 8 August 2025 / Revised: 13 September 2025 / Accepted: 24 September 2025 / Published: 29 September 2025
(This article belongs to the Special Issue Biomass Pyrolysis Characterization and Energy Utilization)

Abstract

Catalytic upgrading of vacuum residue (VR) is critical for enhancing fuel yield and reducing waste in petroleum refining. This study explores VR cracking over a novel cerium-loaded acidified metakaolinite catalyst (MKA800–20%Ce) prepared via calcination at 800 °C, acid leaching, and wet impregnation with 20 wt.% Ce. The catalyst was characterized using FTIR, BET, XRD, TGA, and GC–MS to assess structural, textural, and thermal properties. Catalytic cracking was carried out in a fixed-bed batch reactor at 350 °C, 400 °C, and 450 °C. The MKA800@Ce20% catalyst showed excellent thermal stability and surface activity, especially at higher temperatures. At 450 °C, the catalyst yielded approximately 11.72 g of total liquid product per 20 g of VR (representing a ~61% yield), with ~3.81 g of coke (~19.1%) and the rest as gaseous products (~19.2%). GC-MS analysis revealed enhanced production of light naphtha (LN), heavy naphtha (HN), and kerosene in the 400–450 °C range, with a clear temperature-dependent shift in product distribution. Structural analysis confirmed that cerium incorporation enhanced surface acidity, redox activity, and thermal stability, promoting deeper cracking and better product selectivity. Kinetics were investigated using an eight-lump first-order model comprising 28 reactions, with kinetic parameters optimized through a genetic algorithm implemented in MATLAB. The model demonstrated strong predictive accuracy taking into account the mean relative error (MRE = 9.64%) and the mean absolute error (MAE = 0.015) [MAE: It is the absolute difference between experimental and predicted values; MAE is dimensionless (reported simply as a number, not %). MRE is relative to the experimental value; it is usually expressed as a percentage (%)] across multiple operating conditions. The above findings highlight the potential of Ce-modified kaolinite-based catalysts for efficient atmospheric pressure VR upgrading and provide validated kinetic parameters for process optimization.

1. Introduction

Catalytic cracking is an important part of refining that turns heavy hydrocarbon feedstocks like vacuum residue (VR) into lighter, more useful fractions like gasoline, diesel, and kerosene. This change makes oil refineries more cost-effective by cutting down on waste and increasing fuel yield. The type and design of the catalyst employed have a big effect on how well and selectively this process works. Zeolites, alumina, and silica are traditional catalysts that have been widely used in industry because they are very acidic, stable at high temperatures, and have large surface areas that make it easier to break carbon–carbon bonds in complex hydrocarbons [1,2]. Zeolites have demonstrated exceptional catalytic efficacy due to their well-defined microporous architectures and superior hydrothermal stability.
Nevertheless, constraints in the diffusion of substantial molecules via micropores have driven researchers to investigate alternate materials that exhibit improved mesoporosity and redox stability. Kaolinite that has been treated with acid, especially metakaolinite that has been heated to 800 °C (MKA800), is a good support material because it is more acidic on the surface, can withstand heat better, and is cheaper. Recent improvements have concentrated on altering MKA800 with transition and rare-earth metals, such as cerium (Ce), to augment its catalytic properties. The Ce3+/Ce4+ couple in cerium oxide (CeO2) gives it unique redox behavior, which allows it to store and release oxygen during cracking. This, in turn, promotes hydrogen transfer, stops coke formation, and makes the catalyst more stable under harsh conditions [3]. The primary catalytic uses of cerium are categorized into four major groups. Figure 1 summarizes the principal catalytic applications of ceria into four main categories.
Figure 1. Main applications of ceria-based catalysts [4].
Processes 13 03126 g001
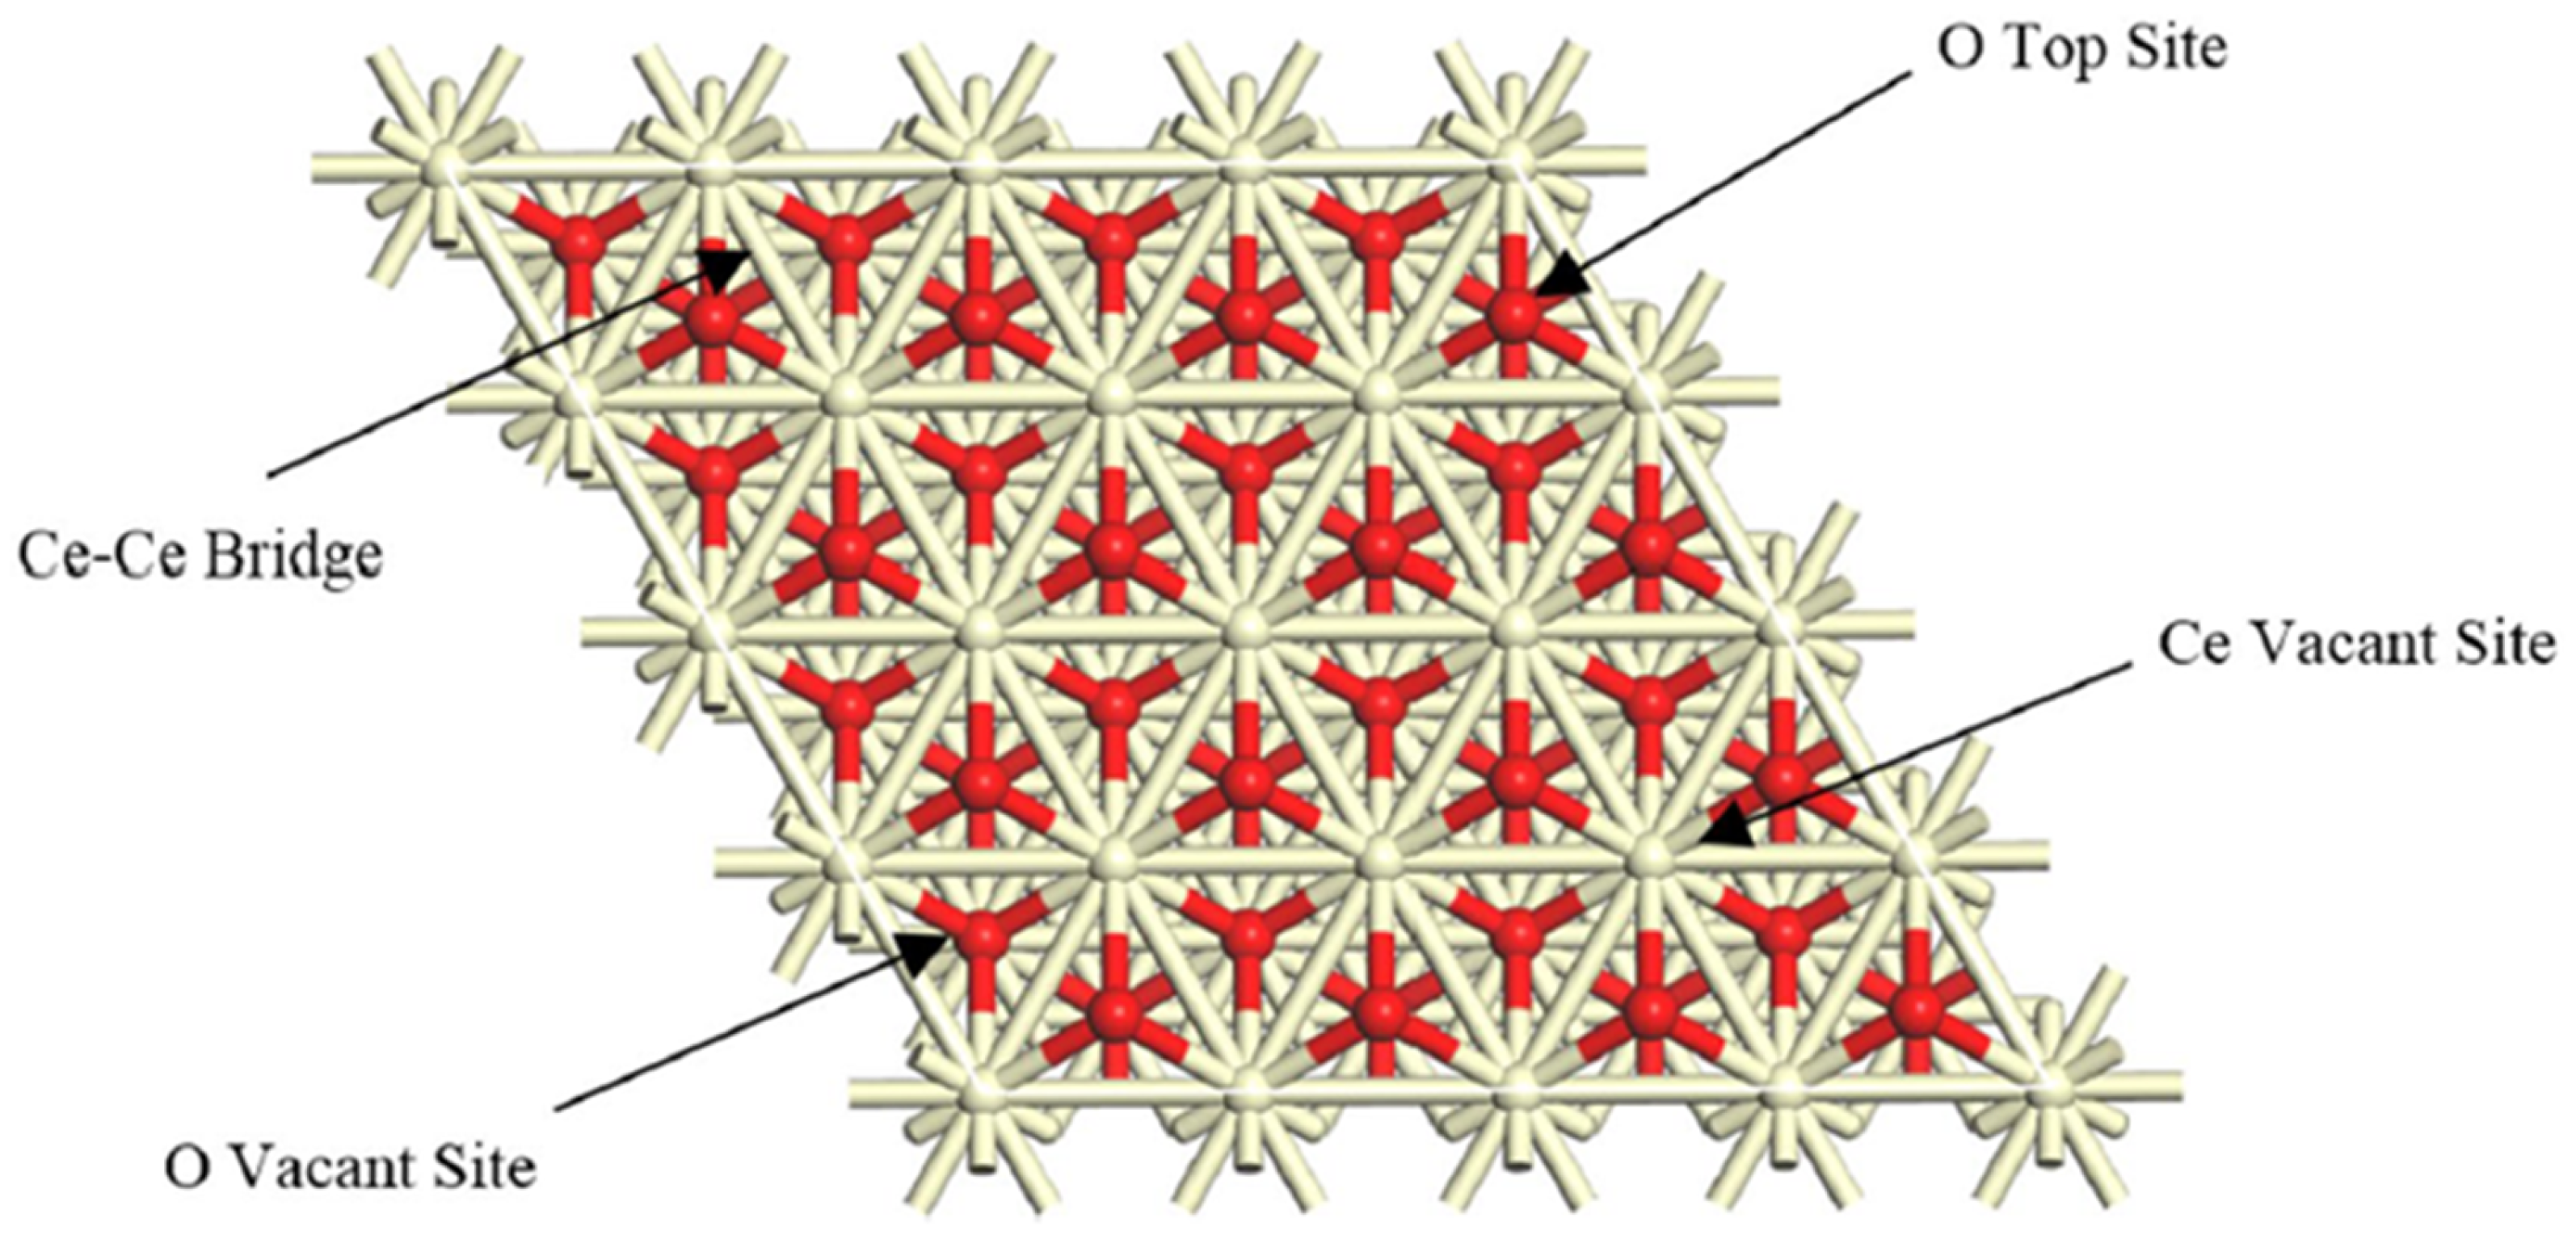
Cerium-modified catalysts have been studied in analogous hydroprocessing domains; however, their utilization in VR catalytic cracking, especially over MKA800, is still restricted. Razmgar et al. [4] underscored the adaptability of ceria in hydrogenation reactions. Figure 2 illustrates the adsorption sites for hydrogenation on the ceria surface as observed from a top–down perspective.
Figure 2. Adsorption sites for hydrogenation over the ceria surface from a top view [4].
Processes 13 03126 g002
Whilst Wang et al. [5] demonstrated the high effectiveness of Fe–Mn mixed metal oxide oxygen carriers in chemical looping processes for upgrading vacuum residue. Moreover, the capacity of ceria to augment asphaltene conversion by promoting hydrogen donation has been delineated in various recent investigations [3,6]. These characteristics render cerium an attractive option for enhancing cracking performance when incorporated into kaolinite-based supports.
Kinetic modeling is essential for comprehending the mechanistic facets of catalytic cracking. Lumped kinetic models, such as four-lump and eight-lump frameworks, are commonly employed to streamline the intricate mixing of heavy oils and forecast product distributions across diverse operating conditions [7,8]. These kinds of models make it possible to determine reaction rate constants, activation energies, and product selectivity, which are important for designing reactors and testing catalysts.
A summary of past kinetic modeling studies in Table 1 shows the many different catalytic systems and methods that have been used to crack VR and heavy oil. Consequently, this study seeks to formulate and test an eight-lump kinetic model to elucidate the cracking behavior of VR over cerium-modified MKA800 under atmospheric circumstances while simultaneously investigating its thermodynamic properties.
Table 1. Summary of the previous work concerning kinetic modeling of VR cracking.
Catalyst/SystemFeedstockReactorTemp. (°C)PressureHighlightsReference
Silica sandVacuum residue (VR)Fluidized bed600–750N/AHigh alkene/olefin yield[9]
CeZr, FeCoCeZrOil sand bitumenFixed bed470N/A↑ Gas oil, ↓ coke[10]
CoMo/γ-Al2O3THAI heavy crudeMicrowave425N/A↑ API, ↓ S, ↓ viscosity[11]
Mn-based catalystsAsalacha heavy oilDSC30–600N/A↓ Activation energy[12]
CoMoP, NiMoP/γ-Al2O3Mexican heavy crudeBatch (autoclave)38010.6 MPa↑ API, ↓ viscosity[13]
Fe–Mn oxideVRFixed bed5501 atm↑ Gasoline/diesel yield[14]
Ni-Mo/Al2O3VREbullated bed401–41218–20 MPaHigh conversion[3]
ZrO2VRBatch470N/A↑ Liquid yield[15]
Fe naphthenateResidual oilBatch (aquathermolysis)3403 MPa↓ Viscosity/sulfur[16]
Ionic liquids (IL)Heavy crude oilBatch (aquathermolysis)175N/A↓ Viscosity, ↓ asphaltenes[17]
MoS2Cold lake VRSemi-batch4155.5 MPa↑ Hydroconversion[18]
Fe2O3–ZrO2–Al2O3Atmospheric residue (AR)Fixed bed4751 atm↑ Reforming/cracking[19]
These works (which are present in Table 1) provide valuable insight into mass transfer limitations and reaction pathways relevant to the present VR catalytic cracking system.

2. Materials and Methods

2.1. Materials

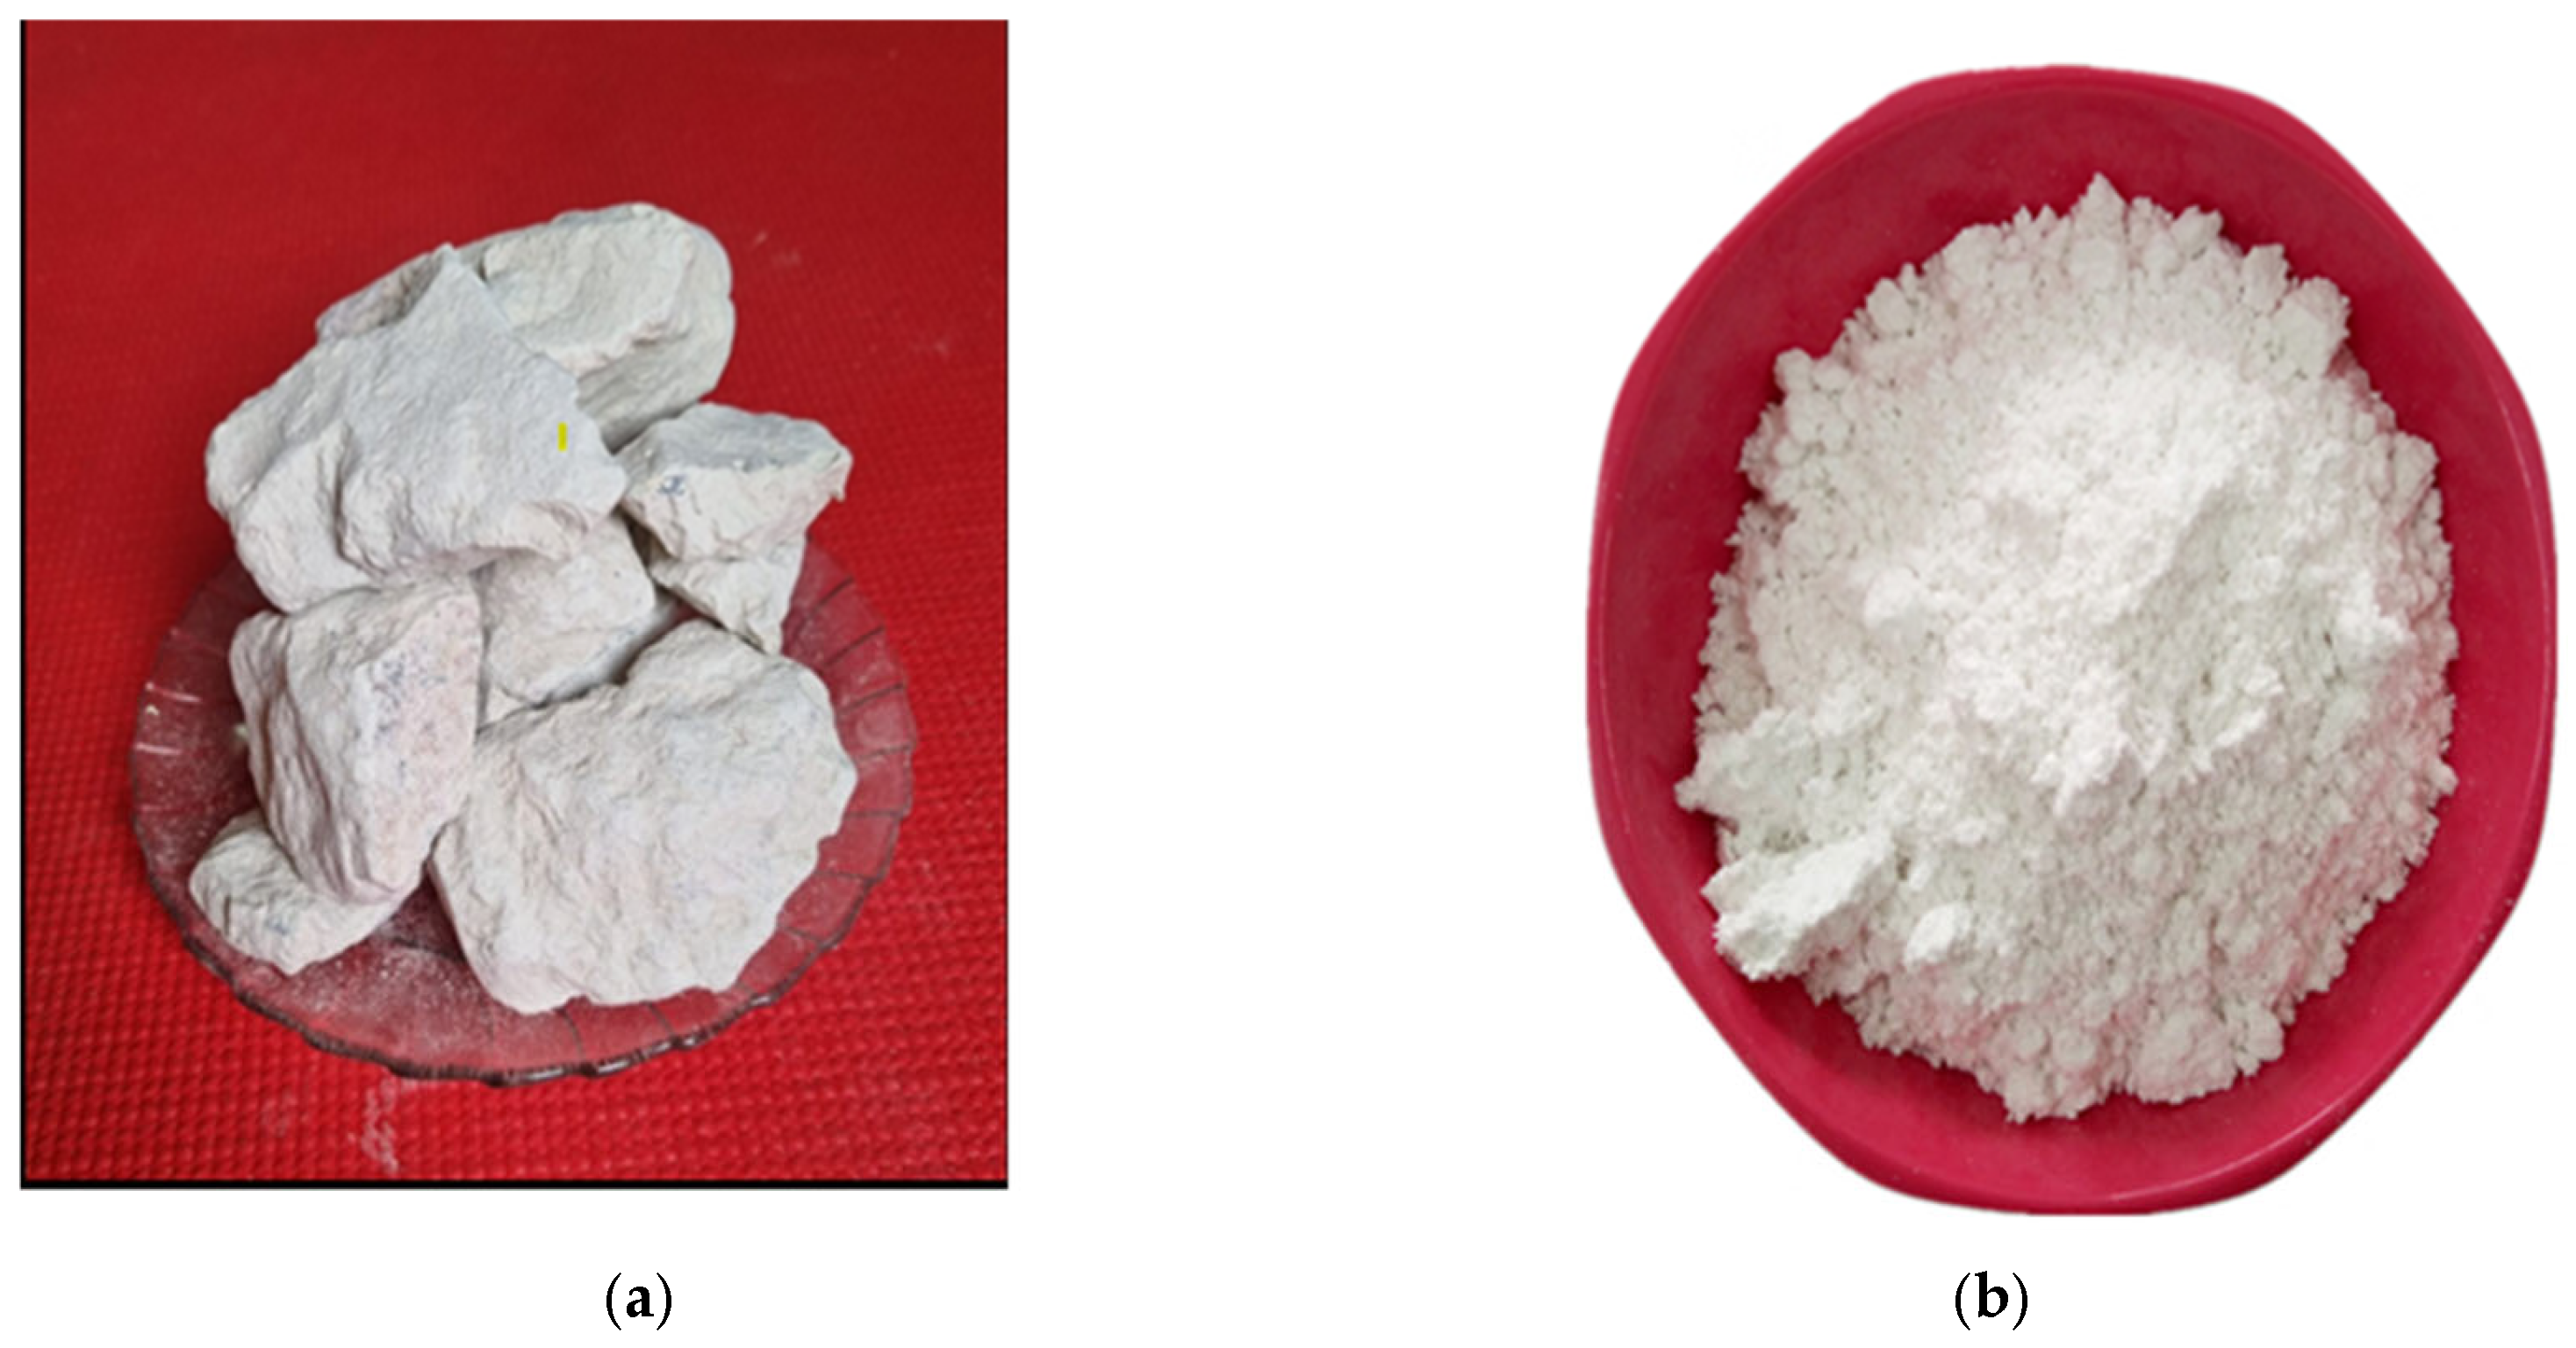
We obtained two different kinds of raw kaolin from the western desert of Al-Anbar, Iraq: red (KR) and white (KW), Figure 3a and Figure 4a To prepare them for more processing, the kaolin samples were first crushed and sieved to ensure that all the particles were the same size, which was approximately around 100 μm. We used hydrochloric acid (HCl, 37% purity) from Thomas Baker, India, in the acid leaching step to change the surface and structure of the kaolin materials. E.Merck, Darmstadt, Germany, provided cerium (III) nitrate hexahydrate (Ce (NO3)3·6H2O, 98.5% purity), which was used to make cerium for catalyst preparation. Along with these chemicals, a number of laboratory tools were used during the experiments. These included a precision-controlled furnace that heated kaolin to 800 °C, beakers, and a magnetic stirrer-heater with a magnetic bar, a ceramic eyelid, a condenser for vapor condensation, and a sensitive digital balance. We used a programmable temperature controller (model TFY4-M2 A) to manage the temperature during important steps. It took in TC/RTD/mV/Rt and had a power supply of AC/DC 100–240 V. This ensured that the temperature stayed the same during the calcination and catalytic preparation steps.

2.2. Catalysts Preparation

After heating red and white kaolin to 800 °C, the metakaolinite phases that formed were called MKR800 and MKW800, respectively, as shown in Figure 3b and Figure 4b. To improve the support’s structure and chemical qualities, 80% MKR800 and 20% MKW800 were mixed together to make a composite combination called MKRW800.

2.2.1. Acid Leaching

We used hydrochloric acid (18 wt.%. Note: To prepare a 100 mL acidic solution with a concentration of 18% HCl by the process of balancing the materials, the volume of the original acid with a concentration of 37% that we use is 48.65 mL, while the volume of water from which the salts were removed used here is 51.35 mL) at 80 °C and stirred it constantly for 5 h on a magnetic heater–stirrer to acid leach about 10 g of this combination.
The goal of this acid treatment was to remove contaminants and partially extract aluminum, which would make the surface more acidic and porous. The leached material was rinsed with deionized water many times until the pH level was neutral. Then, it was dried in an oven at 120 °C for 12 h, making the acid-modified support known as MKA800. We used cerium nitrate hexahydrate (Ce (NO3)3·6H2O) as the metal precursor and wet impregnation to add cerium to the cerium-based catalyst. The goal was to load 20 wt% of metal, and the material that was impregnated was dried and heated again to ensure the metal was evenly spread out on the MKA800 surface.

2.2.2. Impregnation Process

We used the wet impregnation approach to add cerium to the modified kaolin support (MKA800). To make a uniform precursor solution, cerium nitrate hexahydrate (Ce (NO3)3·6H2O) at weight about 0.252 g was first dissolved in a small amount of deionized water. This solution was then slowly added to the MKA800 (about 5 g) material while shaking it to ensure that the cerium ions were evenly spread out and stuck to the support surface. The material that was impregnated was permitted to dry at room temperature for 24 h. Then, it was put in a drying oven at 110 °C for another 24 h to dry even further. After drying, the catalyst was put in a desiccator to keep its qualities until it was needed. Before testing the catalyst in the batch reactor, it was heated up to 600 °C for 12 h in a flow of helium or hydrogen gas with a regulated heating rate of 5 °C/min.

2.3. Catalyst Characterization

We used advanced analytical methods such as GC-MS (Gas Chromatography–Mass Spectroscopy), XRD (X-Ray Diffraction), and XRF (X-Ray Fluorescence), BET (Brunauer–Emmett–Teller, FTIR (Fourier-Transform Infrared Spectroscopy), and TGA (Thermogravimetric Analysis) to fully characterize the generated kaolin-based catalysts. GC–MS analyses were carried out on a Shimadzu GC-2010 system equipped with a column oven at 60 °C, an injection temperature of 280 °C, helium carrier gas at 100 kPa, and a column flow of 1.61 mL min−1 to analyze the total liquid product of the process, from which the yields of light and heavy fractions were established (Tables 5–7). Phase identification and crystallographic structure were determined by XRD using a Bruker D8 diffractometer with Cu Kα radiation (λ = 1.541 Å). Textural properties were obtained from N2 adsorption–desorption isotherms (BET method). Thermal stability was examined by TGA on a Shimadzu TGA-50H in air up to 950 °C at a heating rate of 10 °C min−1. Chemical composition was measured by XRF using a PANalytical Axios spectrometer with a Rh anode X-ray tube and wavelength-dispersive detection. All analyses were conducted at the Scientific Instrumentation Center (SIC), University of Granada. We used (FTIR) with a Bruker TENSOR 27 spectrometer to obtain information about functional groups and chemical bonding, this method is accessible in the materials lab at the University of Technology-Baghdad.

2.4. Catalyst Evaluation

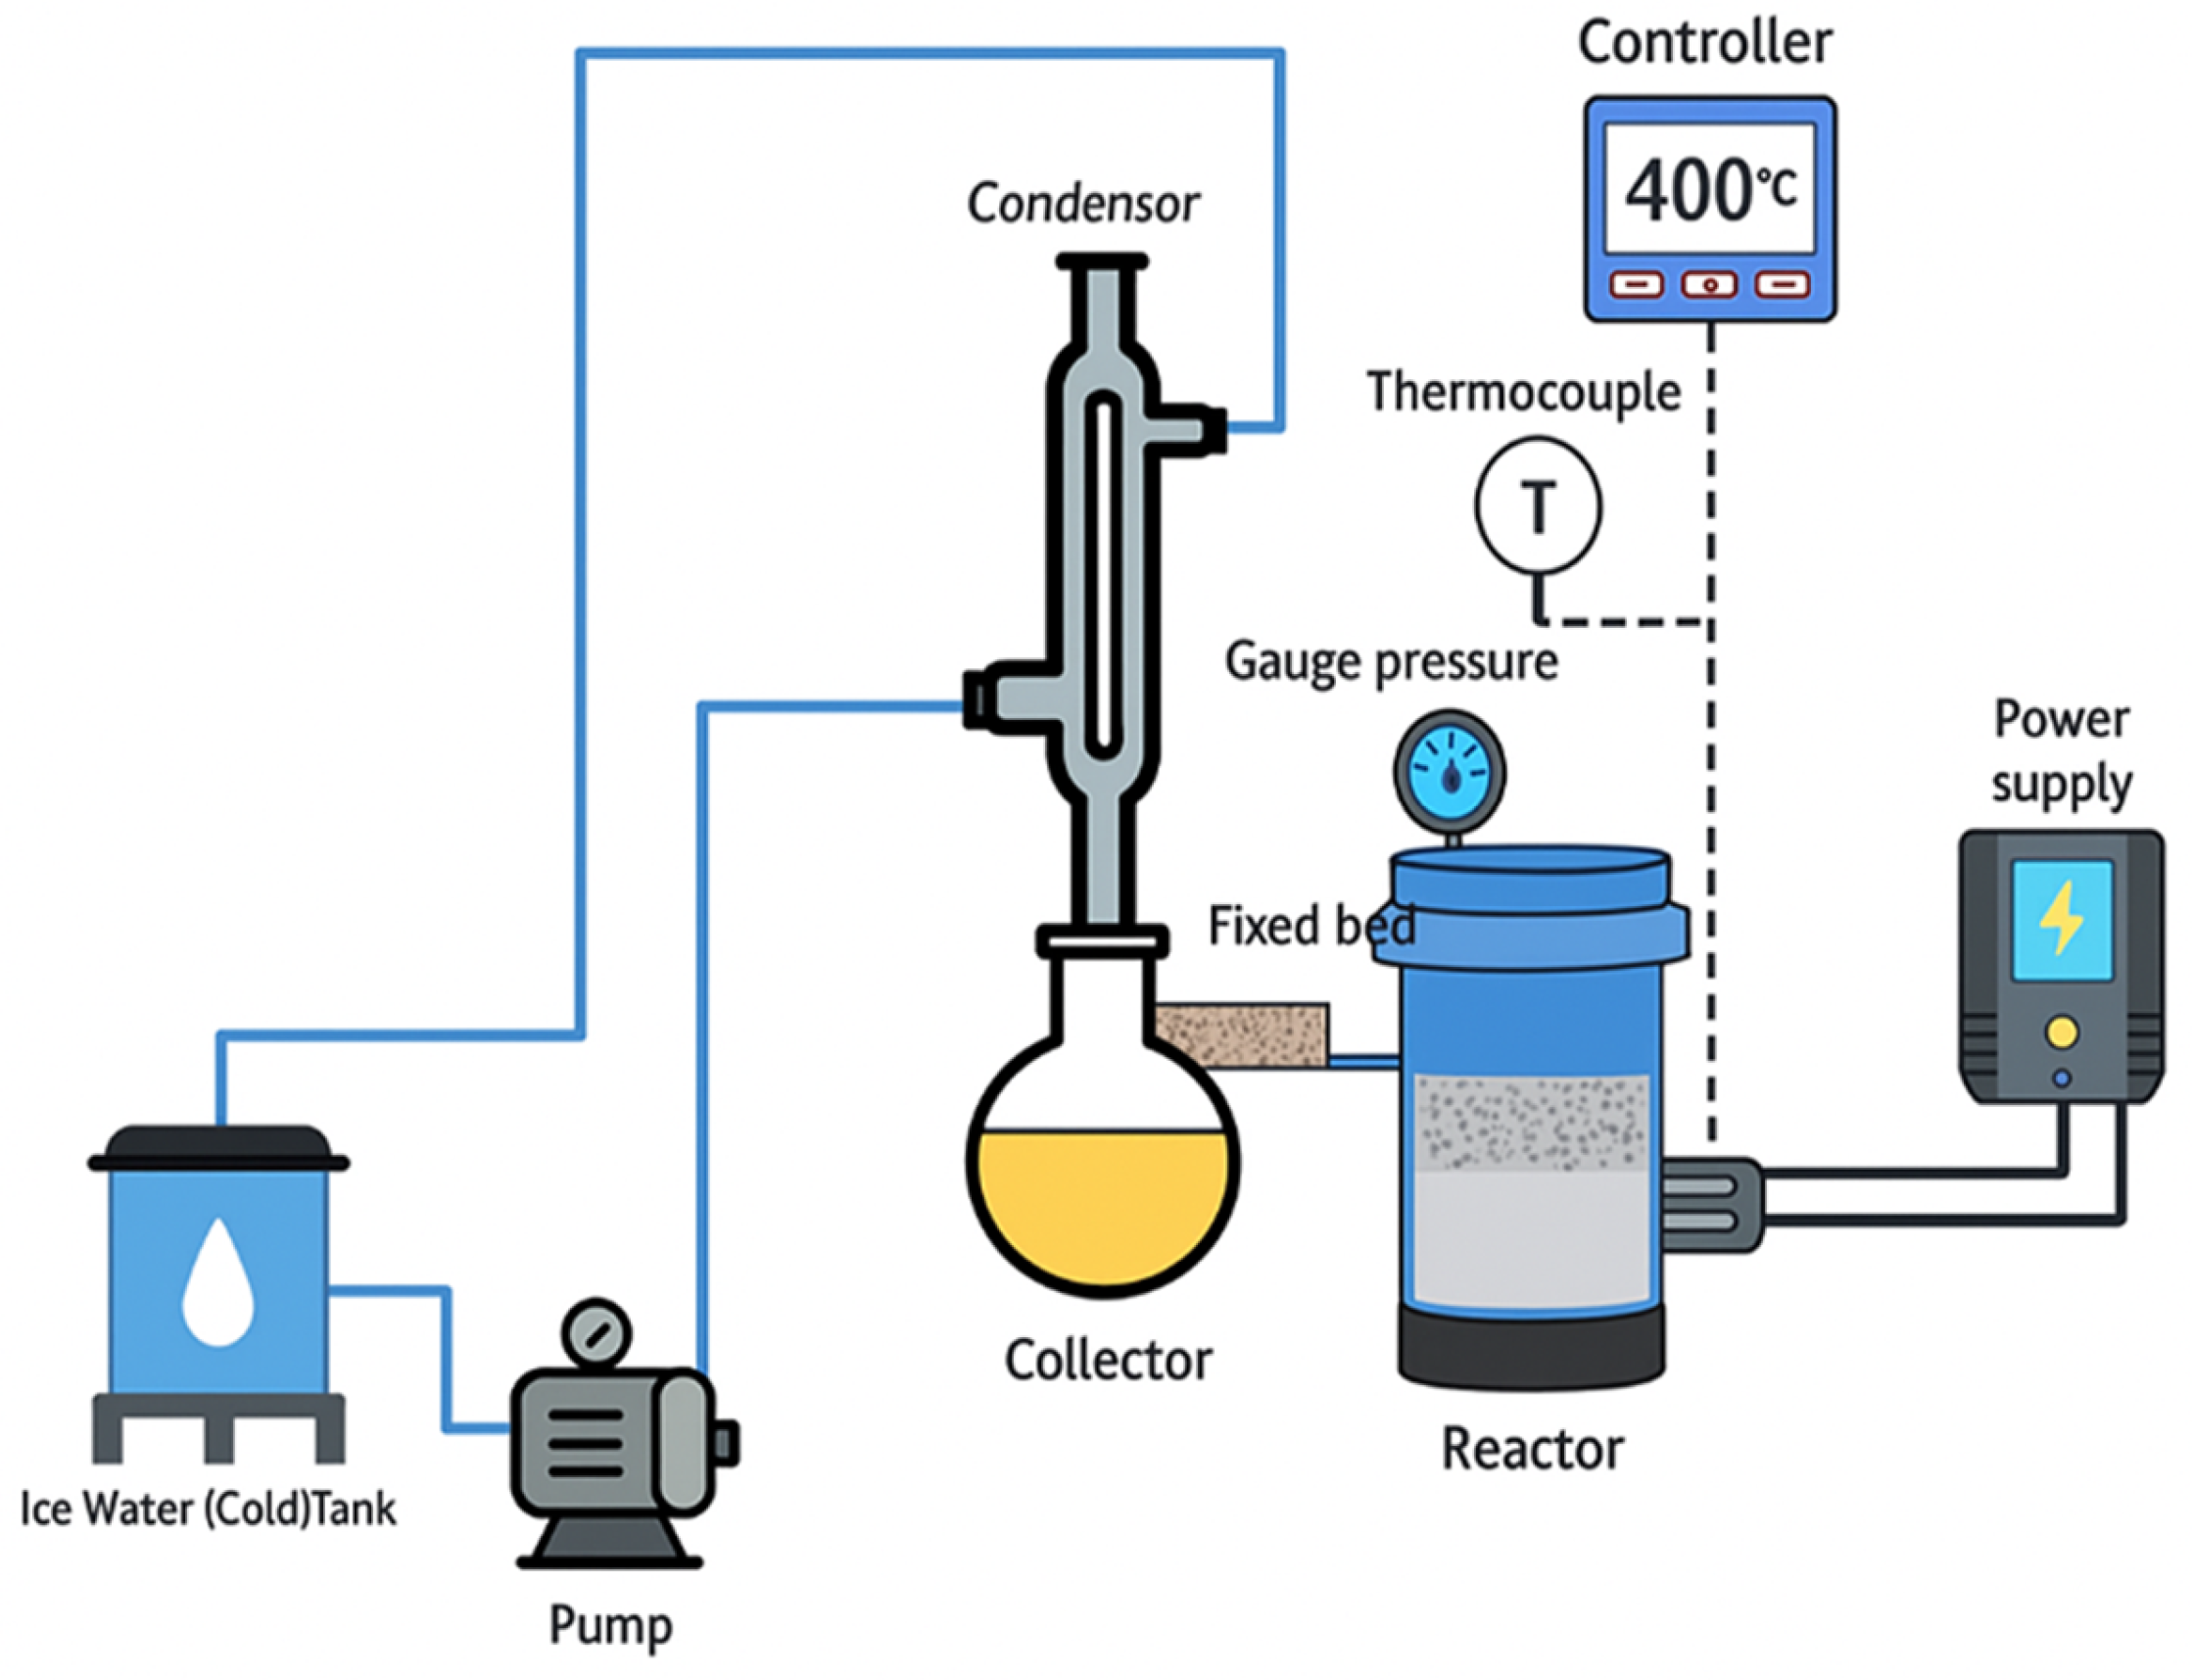
The reactor (fixed-bed, stainless steel, and batch) (Figure 5) commenced testing the fabricated catalyst (MKA800 + Ce (20%) in the materials lab at the University of Technology-Iraq at three distinct temperatures: 350 °C, 400 °C, and 450 °C.
Vacuum residue (VR) sourced from the Al-Durra refinery in Baghdad was utilized to evaluate catalysts in catalytic cracking for the production of light distillates. Table 2 presents the properties of VR.

2.5. Experimental Procedure

The produced distillation curves ASTM D1160 (vacuum distillation) were converted to ASTM D86 (atmospheric distillation) using Aspen Hysys software, v11 and then the light cuts were calculated using a typical crude oil cut point presented in Table 3.

3. Results and Discussion

3.1. Chemical Analysis of Kaolin by XRF Test

Table 4 (XRF test) shows a big difference between the two types of kaolin: red kaolin (KR) and white kaolin (KW). KR has a lot of Fe2O3 (14.74%), which makes it reddish and perhaps catalytic. KW has less Fe2O3 (1.62%) and more Al2O3 (34.69% vs. 21.51% in KR), which makes it purer, brighter, and more thermally stable. Both have about the same amount of SiO2 (~50%) and certain minor oxides, but KW is better for making ceramics and paper coatings, while KR is better for redox catalytic processes.

3.2. GC–Mass Spectroscopy Test

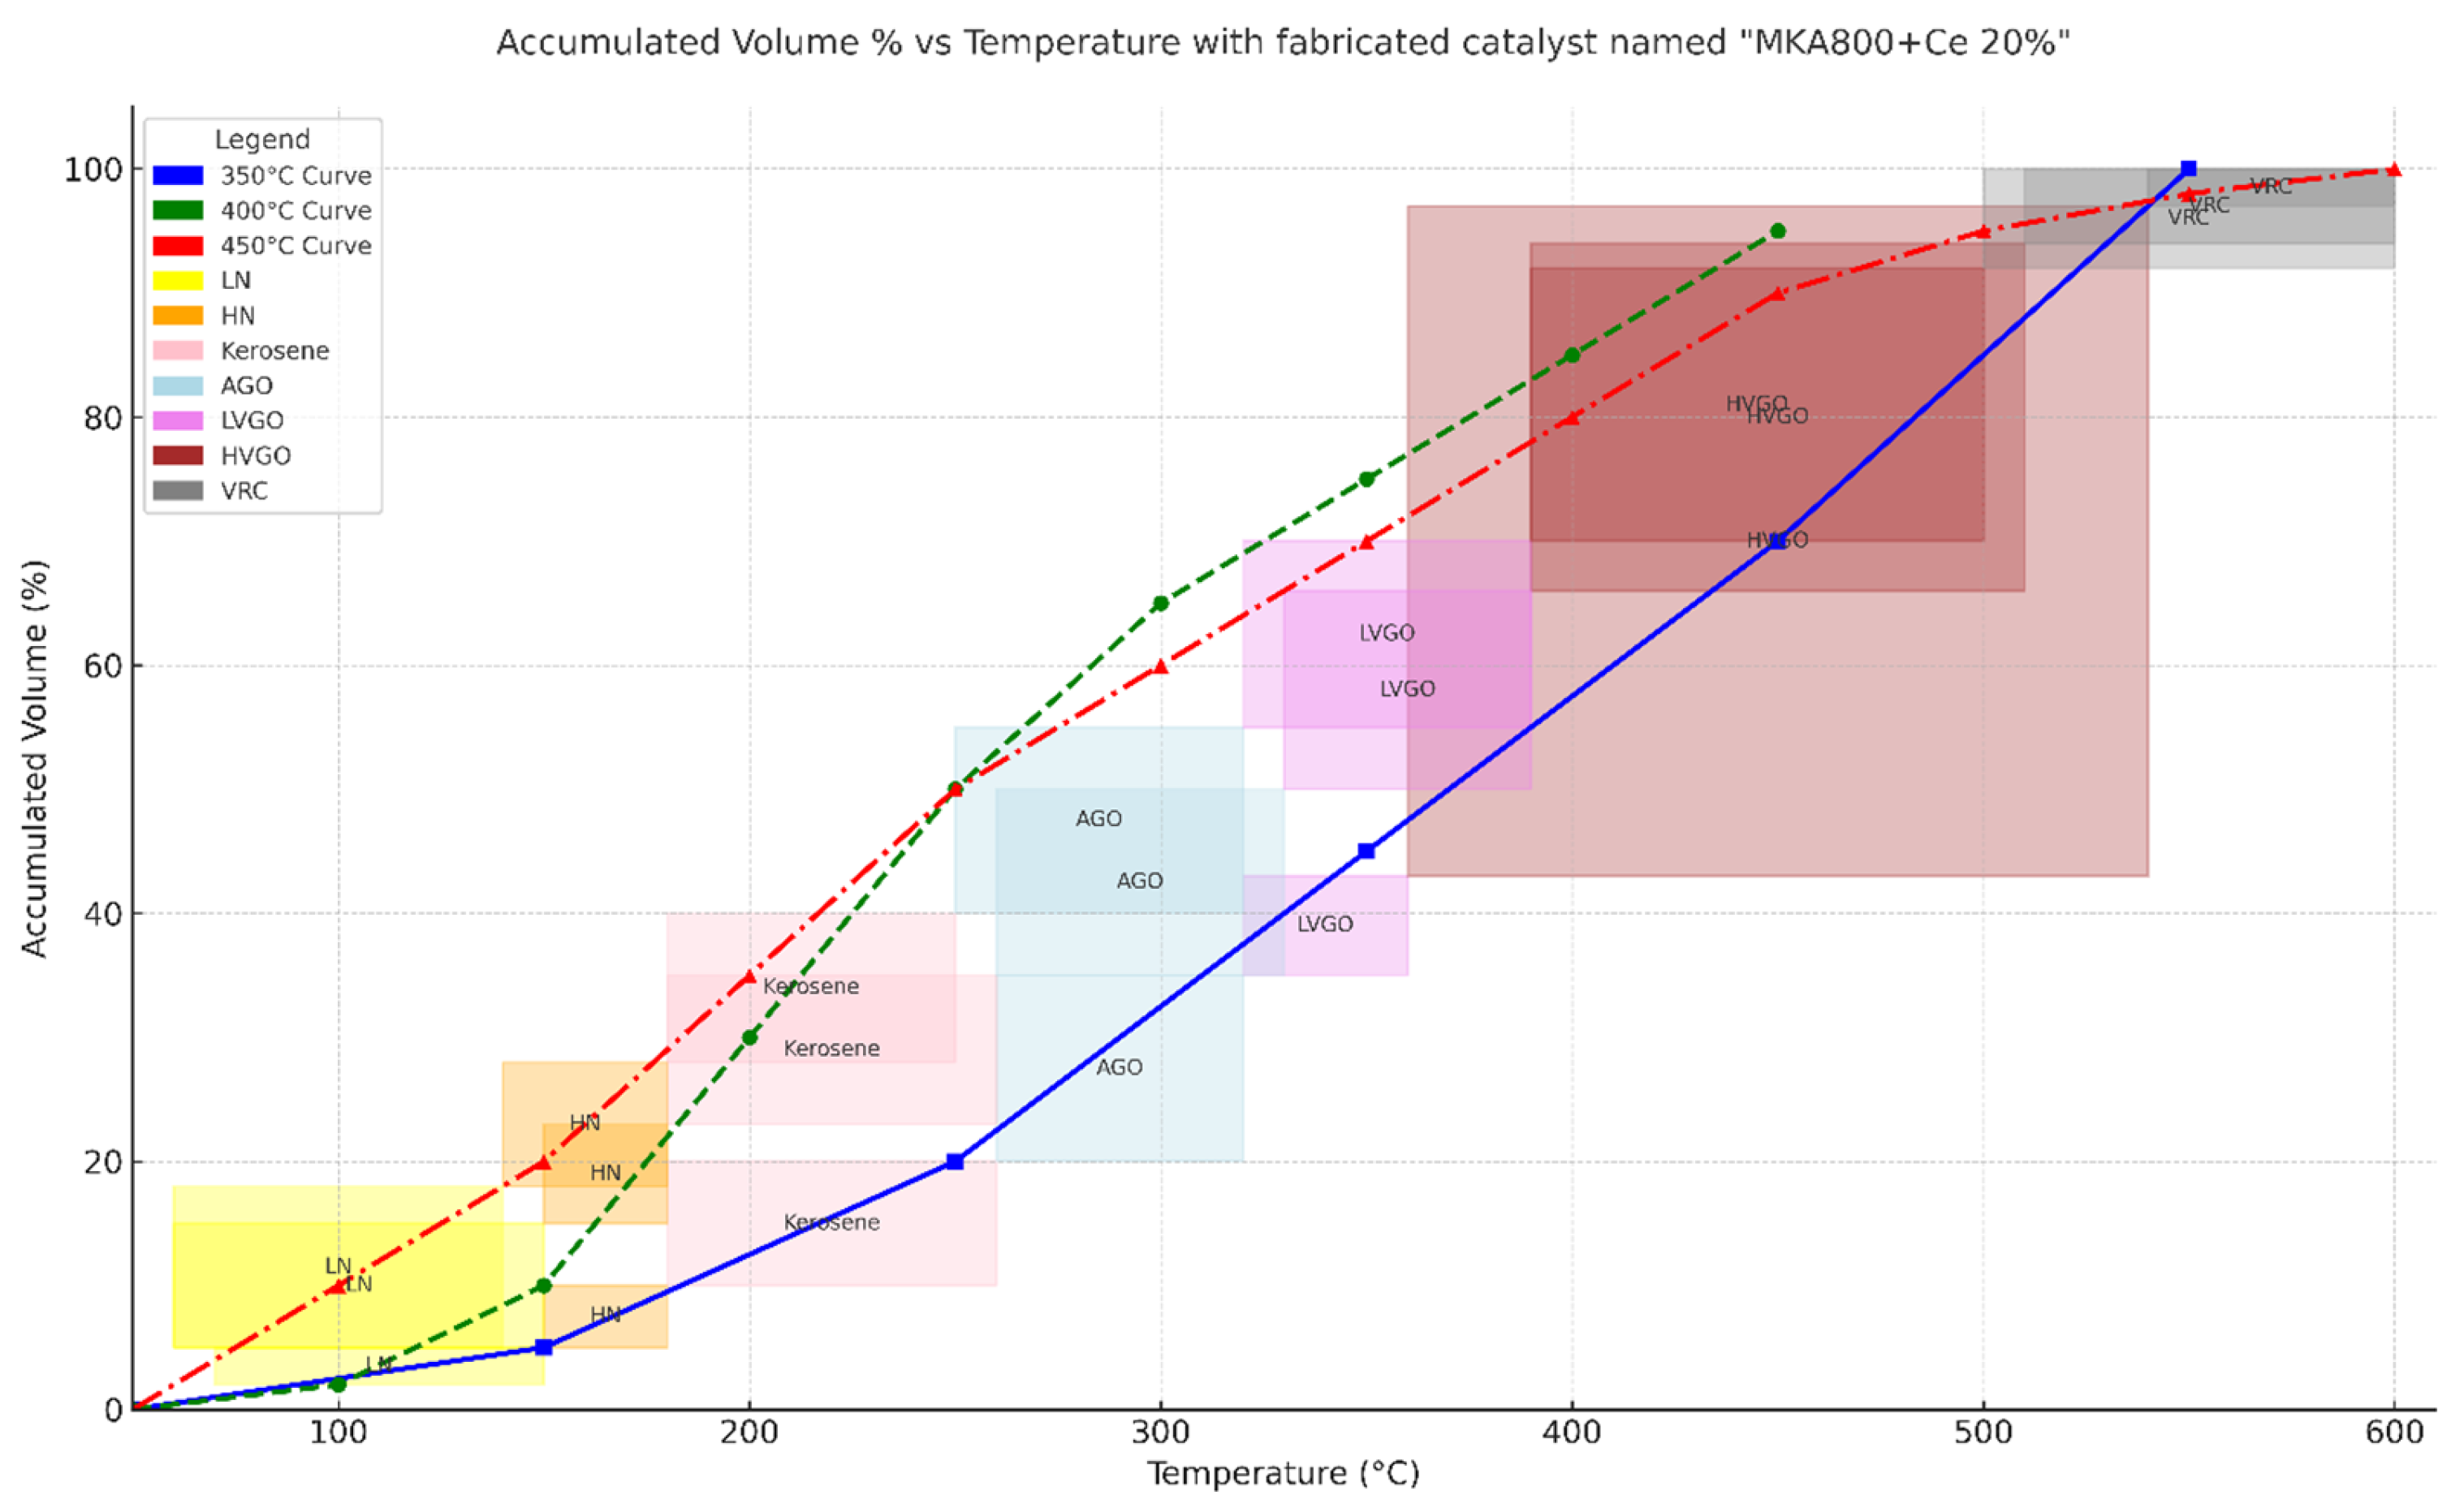
Table 5 and Figure 7 show the full GC-MS findings that show how the MKA800+Ce 20% catalyst changes vacuum residue (VR) into lighter hydrocarbon fractions at different reaction temperatures. The temperature profiles (blue for 350 °C, green for 400 °C, and red for 450 °C) show that the catalyst can increase the amount of useful light fractions. At 350 °C, the product distribution is mostly made up of heavier fractions like HVGO and VRC, which means that there is not much cracking activity. When the temperature rises to 400 °C, the creation of middle distillates (AGO and LVGO) increases significantly, showing that the catalyst works better. At 450 °C, the catalyst works best because the redox-active cerium oxide phase is fully activated. This leads to higher yields of light fractions like LN, HN, and kerosene. The cerium (Ce) in this catalyst makes it work better by increasing its redox characteristics (Ce4+/Ce3+ cycling) and creating surface oxygen vacancies, which help break down long-chain hydrocarbons [20,21]. This is in line with studies that suggest that rare-earth modifications improve acidity, diffusion, and cracking depth compared to regular kaolin or FCC catalysts [22]. The temperature-dependent product distribution shows that MKA800+Ce 20% is a good catalyst for refining since it successfully upgrades heavy residues.
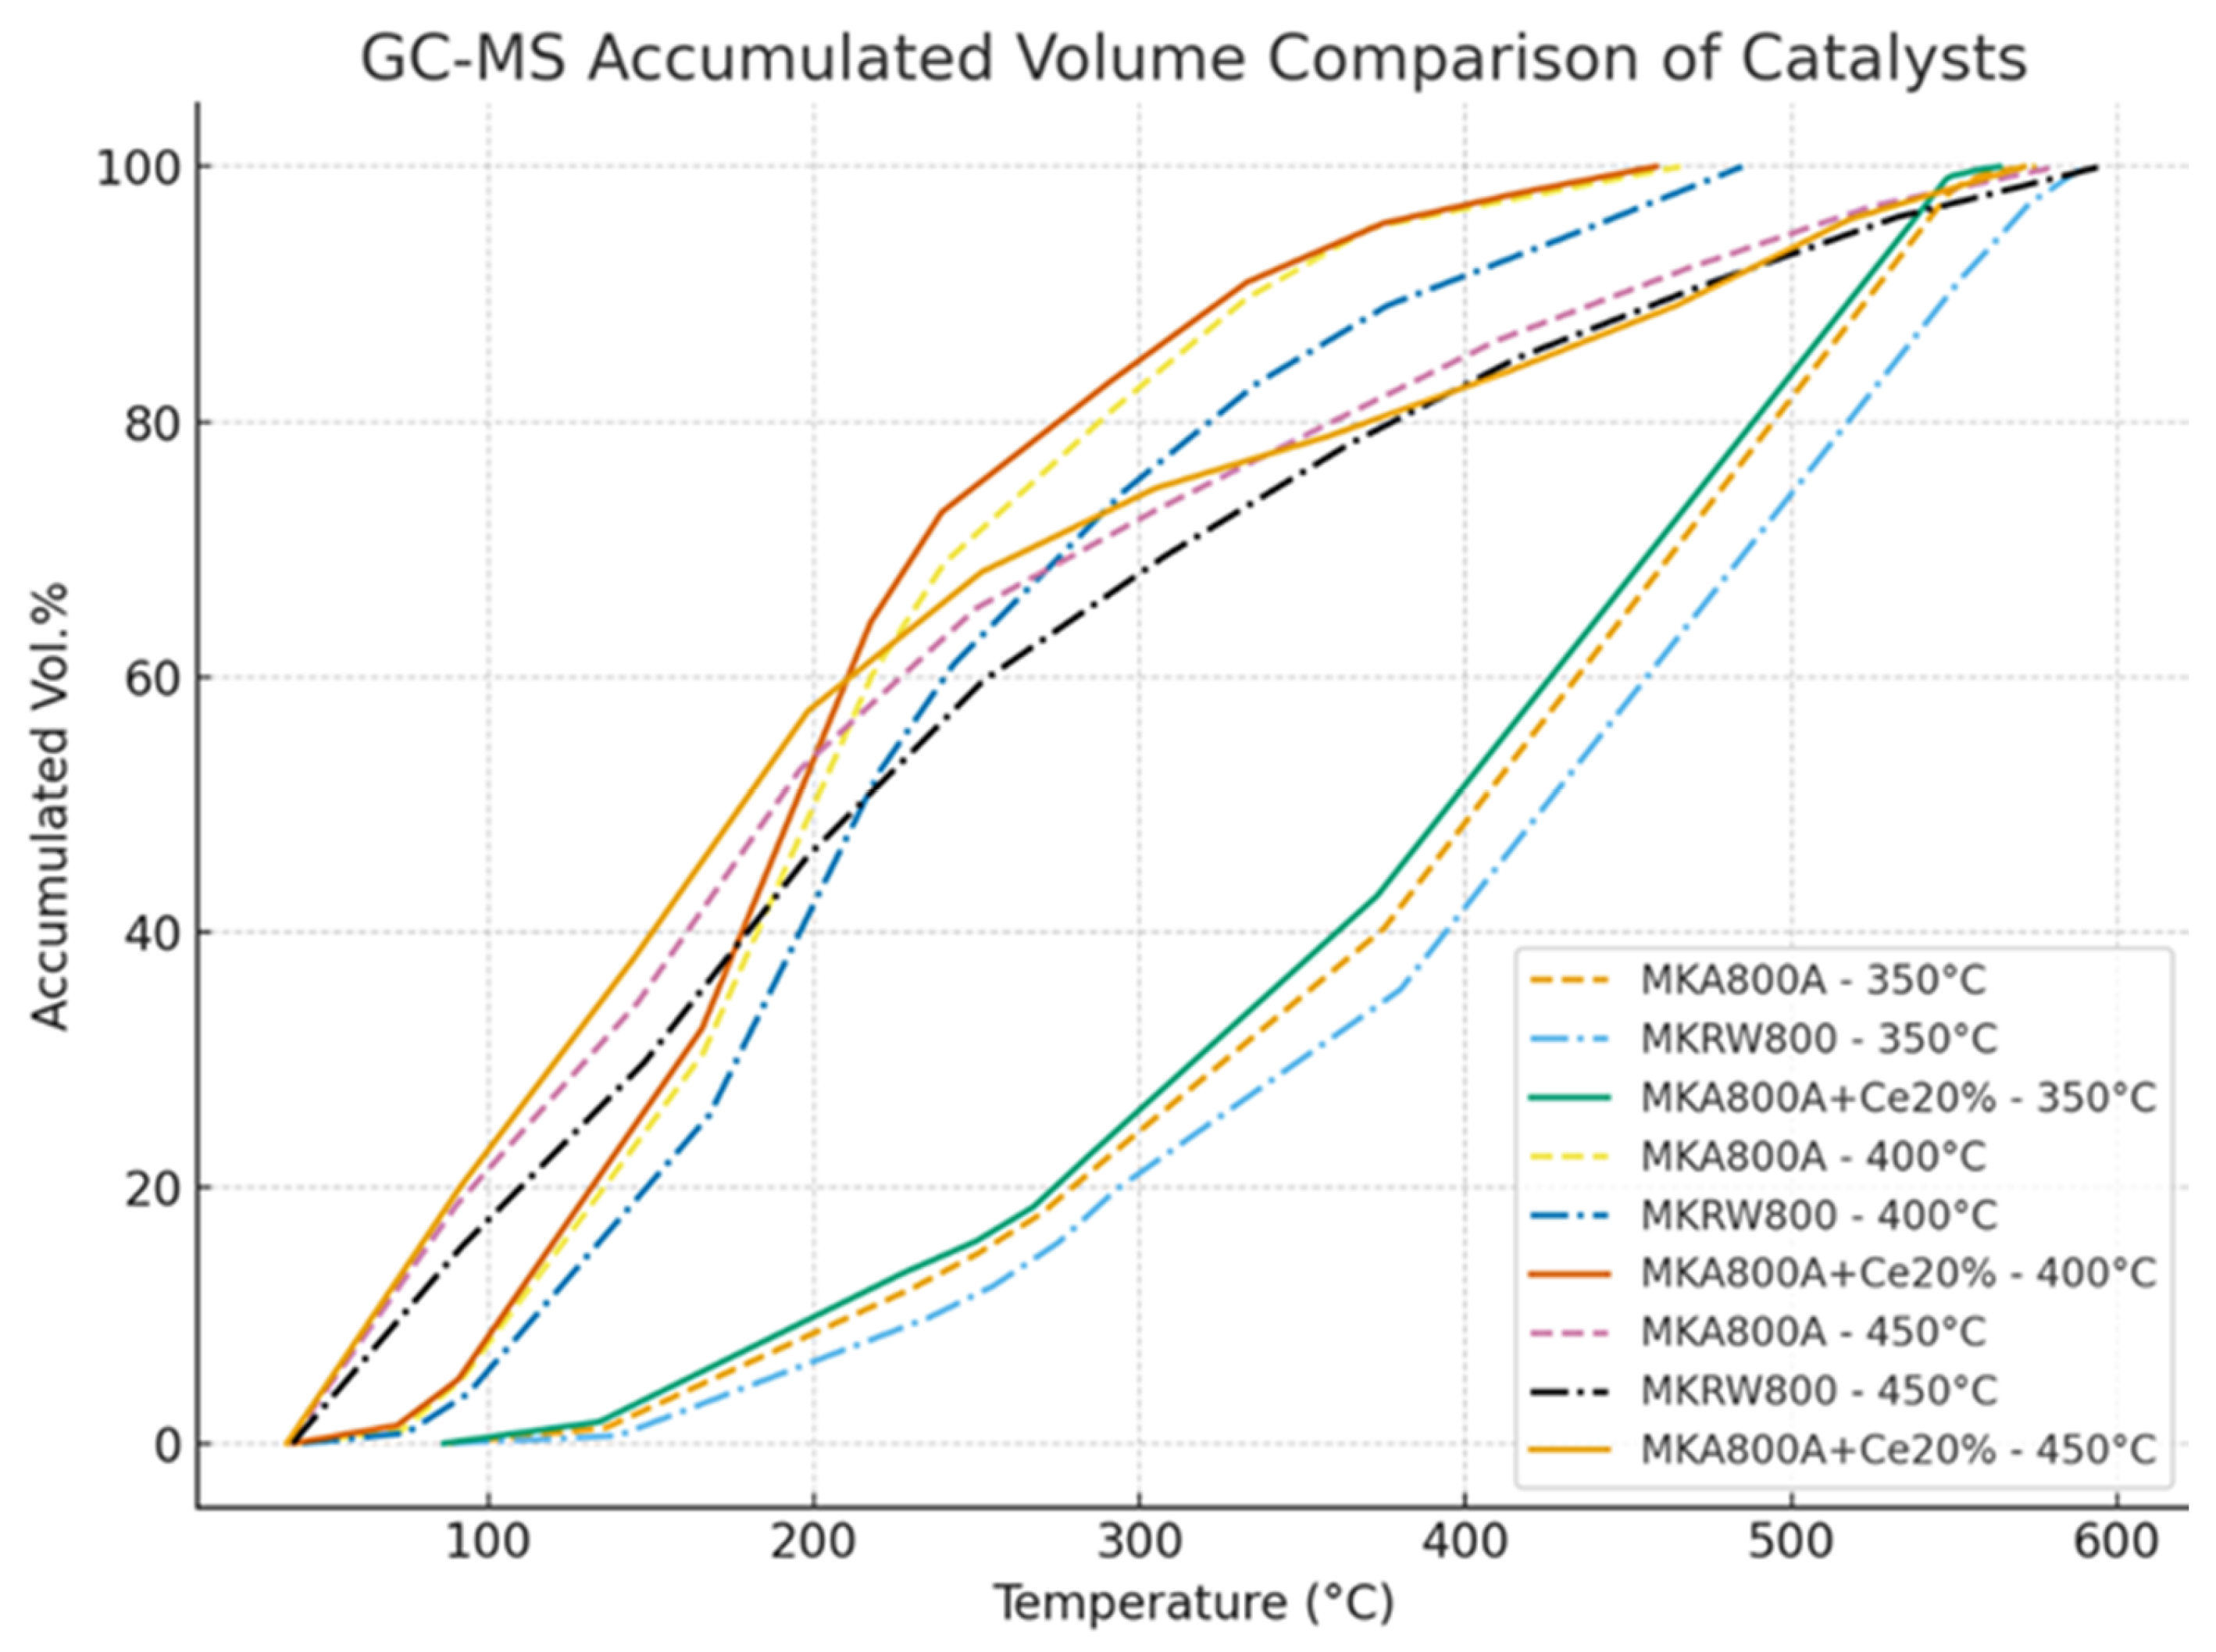
Table 6 and Table 7 (GC–mass spectroscopy results of (MKA800, MKRW800)) exist to compare with Table 5 (the results of MKA800+ Ce 20%). The comparison between the three catalysts clearly shows that MKA800A+Ce 20% performs better than MKA800A and MKRW800. At the same temperature zones, the Ce-loaded catalyst produces higher accumulated volumes earlier and reaches full conversion at lower endpoint temperatures. This indicates that cerium improves cracking efficiency, especially in the kerosene and AGO regions, by providing stronger acid sites and better redox behavior. Recent studies confirm that ceria promoters enhance hydrocarbon cracking by boosting acidity and stability while also limiting coke formation, which explains the superior performance observed here [20,21].
All results of three kinds of catalysts are presented in Figure 6 below, which also shows that the MKA800A+Ce 20% catalyst gives the best performance, reaching higher accumulated volumes at lower temperatures than both MKA800A and MKRW800. At 400–450 °C, the Ce-modified catalyst converts heavy fractions more effectively, while the others progress more slowly.
If the cracking process continues beyond 450 °C and reaches 500 °C, the product distribution shifts unfavorably. At 450 °C, the system is at its optimum: heavy residues are effectively converted, light fractions such as gasoline and kerosene are maximized, and coke formation is relatively low. Once the temperature rises further, the lighter fractions begin to undergo over-cracking, breaking into small gaseous molecules (C1–C4) instead of staying in the liquid range. At the same time, the higher energy favors aromatization and polycondensation reactions, which accelerate coke deposition on the catalyst surface, blocking its pores and reducing activity. Above this point, the process is driven more by thermal cracking than catalytic action, leading to lower selectivity and poorer liquid fuel yields. Studies show that while higher temperatures may increase overall conversion, they generally cause a decline in valuable liquid products and a sharp rise in gas and coke yields [20,23].
The colors on the curves in Figure 7 clearly show how the MKA800+Ce20% catalyst changes with temperature and how the hydrocarbon cuts are spread out. The blue curve (350 °C) shows a slower conversion process with a gradual increase in accumulated volume. At higher temperatures, it mostly produces heavier fractions (HVGO and VRC), as seen by the bigger shaded dark-red and gray sections. The green curve (400 °C) has a steeper slope, which means that cracking is more effective and more middle distillates (AGO and LVGO) are produced. The light blue and pink shaded areas demonstrate this. The red curve (450 °C) is the steepest, showing the maximum conversion rate and the dominance of light fractions (LN, HN, and kerosene). The yellow, orange, and red bands at lower temperatures show where these fractions are most common. These areas, which are color-coded, match the data in Table 5. They show that higher temperatures move the product spectrum toward lighter fractions because catalytic cracking works better and cerium’s redox phases are fully activated [21,24].

3.3. X-Ray Diffraction (XRD)

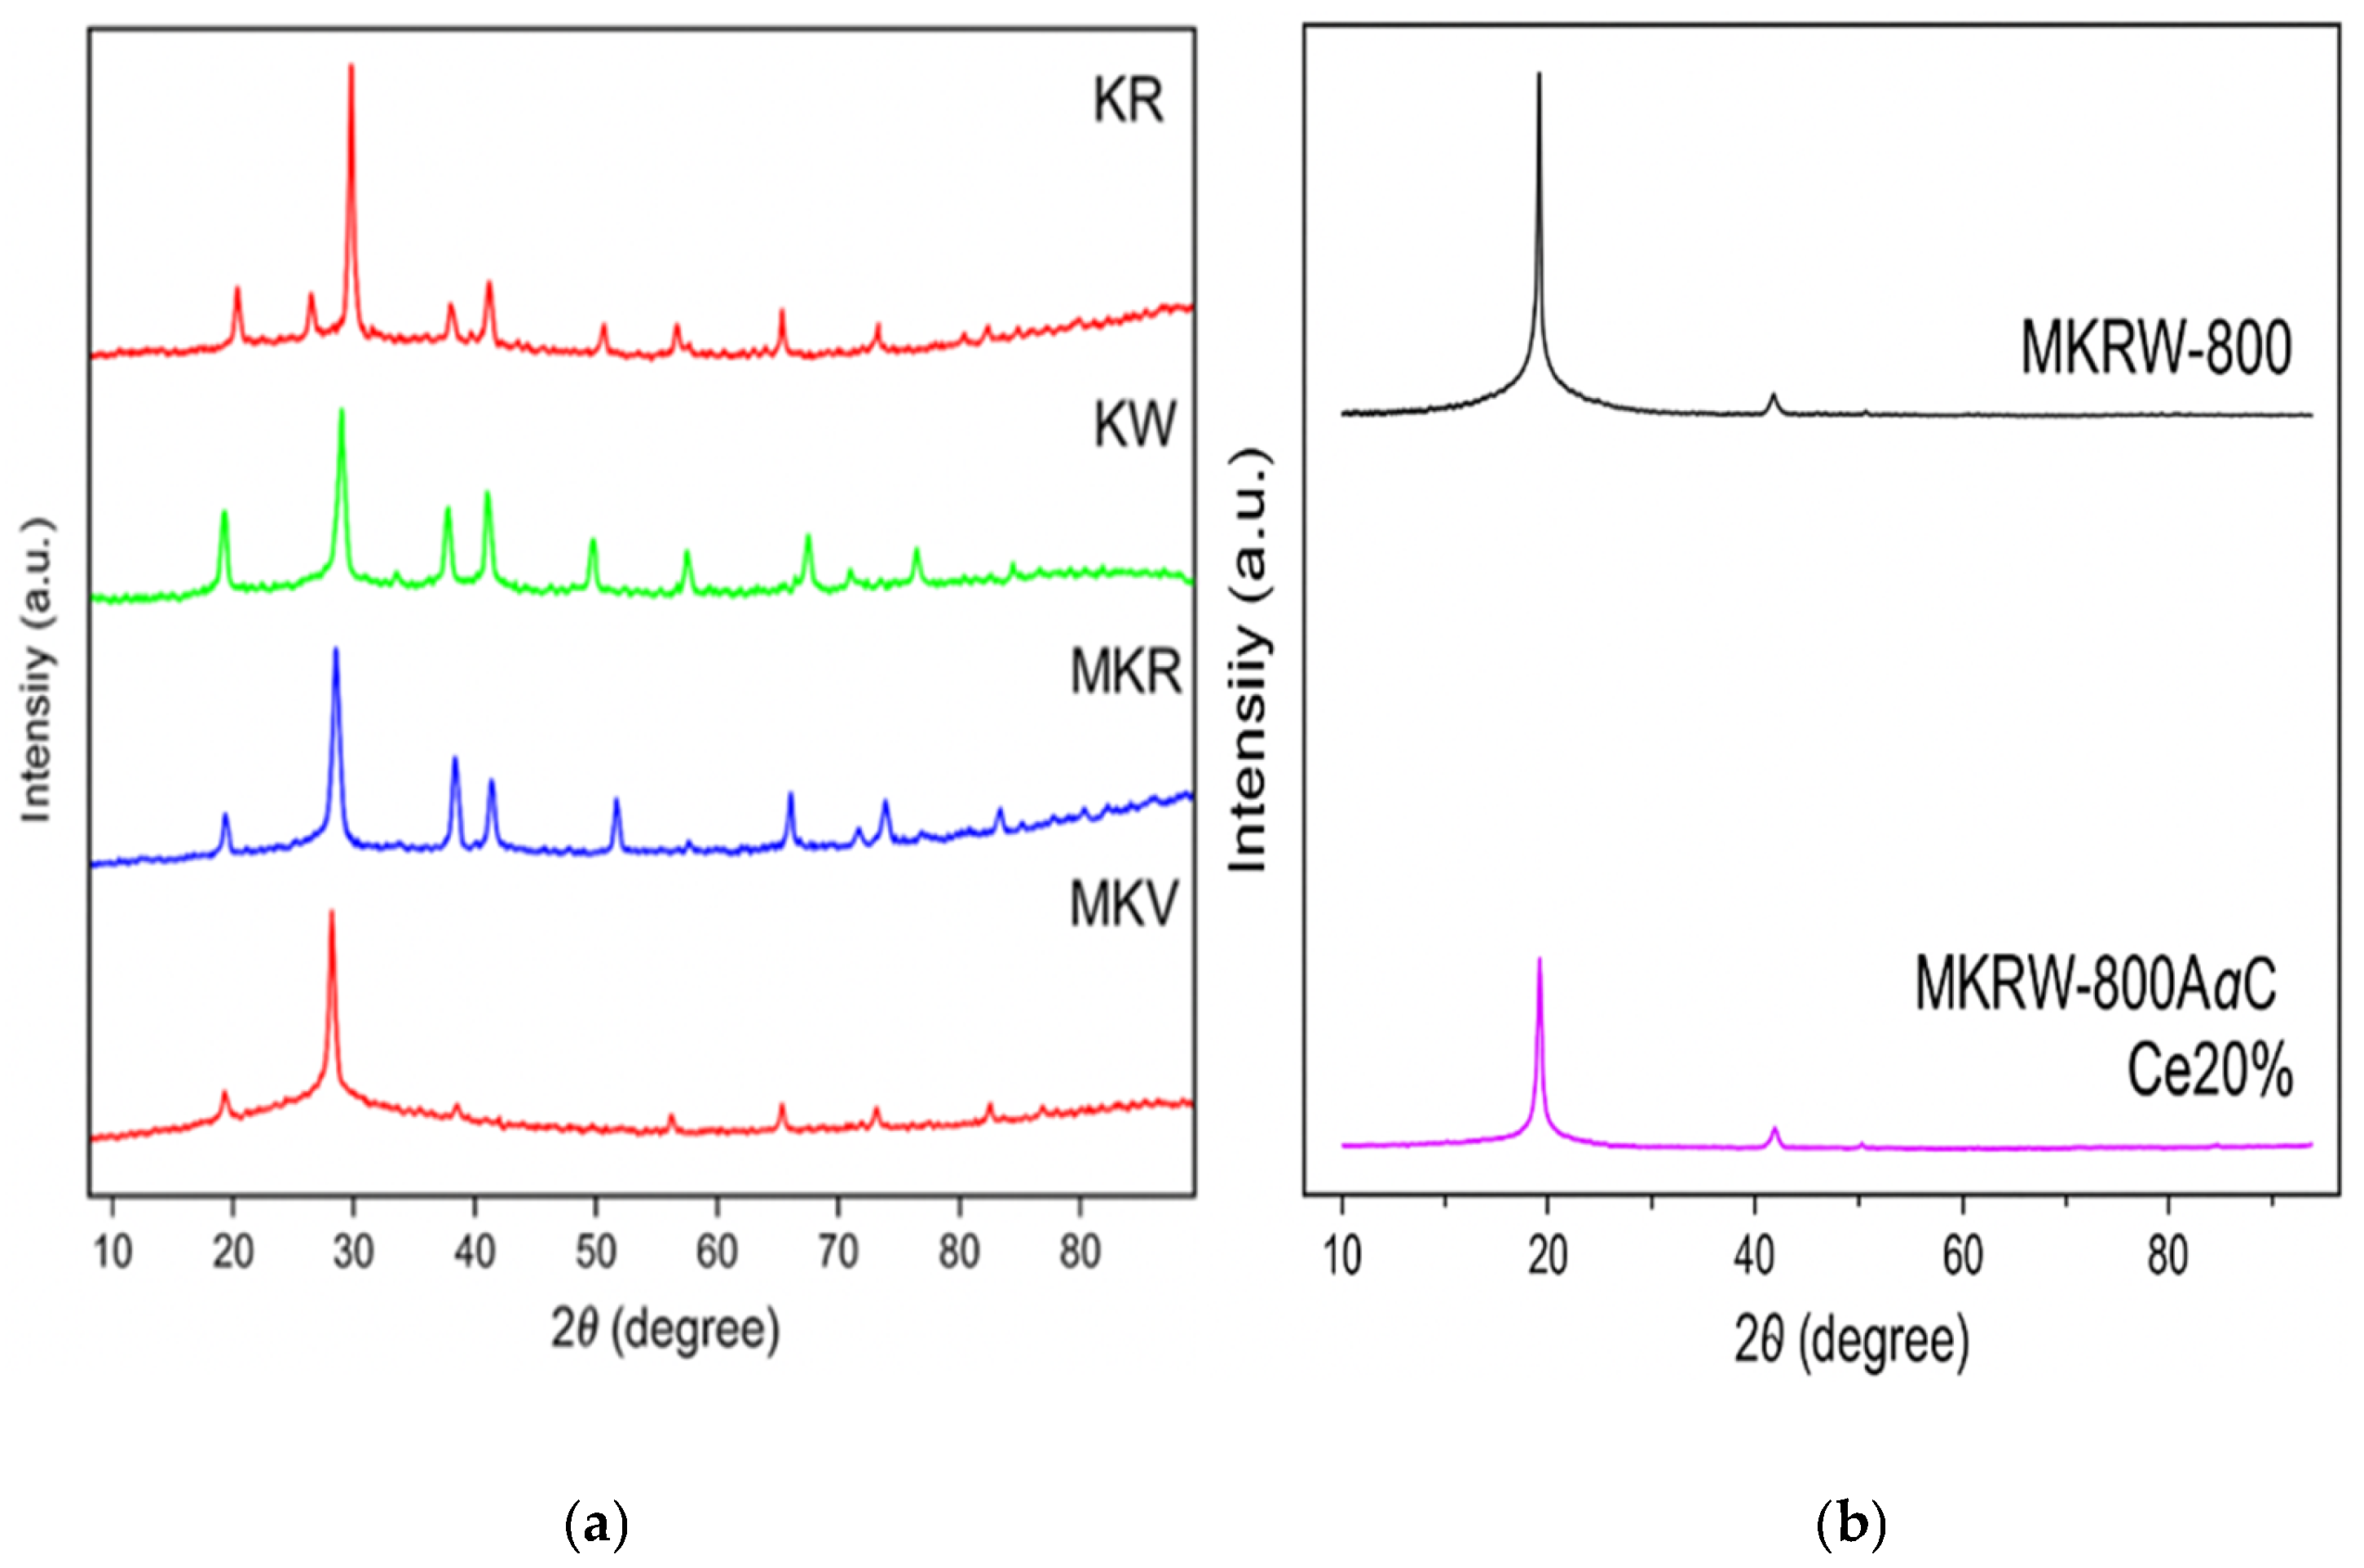
As shown in Figure 8 below, the XRD patterns of the raw kaolin samples (KR and KW) exhibit clear and crisp diffraction peaks that match the crystalline kaolinite and quartz phases. KW has a higher degree of crystallinity than KR, as shown by the sharper peak intensities [24]. When heated to 800 °C (MKR and MKW), the kaolinite peaks disappear and a broad hump forms in the region of 15–30° 2θ. This shows that kaolinite has changed into an amorphous metakaolinite phase [25].
After acid leaching (MKRW-800A), the diffraction peaks become even less clear. This shows that the structure has become more disordered and more porous because structural impurities have been removed [22]. When cerium (MKRW-800A@Ce20%) is added, separate CeO2 peaks appear at 28.5°, 33.1°, and 47.5°. These peaks are due to crystalline fluorite-phase ceria [26]. This change keeps the metakaolinite support’s general amorphous shape while adding active redox sites that are necessary for catalytic cracking operations. The existence of CeO2 peaks next to the broad amorphous background shows that cerium is spread out but still has nanocrystalline domains of the fluorite phase, which are active foci for oxidative and cracking reactions [27]. This mix of amorphous metakaolinite and CeO2 improves both acid and redox characteristics, which are very important for improving vacuum residue. Also, the acid treatment causes structural disorder, which makes it easier for big VR molecules to diffuse into the catalyst pores. This lowers the amount of coke that forms and increases the generation of light fractions [28].
The diffraction peaks of CeO2 (around 2θ ≈ 28.6°, 33.1°, 47.5°, and 56.3°) do not appear clearly in Figure 8. This is most likely due to their very low intensity and overlap with the broad amorphous background of metakaolinite. At a loading of 20 wt.%, CeO2 is probably dispersed in very fine or nanosized crystallites, which makes its reflections too weak to be easily detected.

3.4. Surface Area and Porosity of the Substance

Table 8 shows how strongly thermal and chemical treatments affect the texture of kaolin-based products. The raw kaolin samples (KR and KW) had surface areas of 63 and 23 m2/g, respectively. These are normal for natural kaolin, which has a layered structure. KR has a larger surface area and micropore volume (0.026 cm3/g) than KW (0.009 cm3/g), which suggests that it has a more open structure [29,30]. When heated to 800 °C, both forms of kaolin (MKR-800 and MKW-800) lose hydroxyl groups and partially collapse their structures.
This makes the microporosity lower but gives the surface areas a moderate 29 m2/g. At the same time, the mesopore volume increases slightly (0.072–0.093 cm3/g), which means that the material has changed into an amorphous metakaolinite phase that has better pore accessibility [29]. When acid leaches the calcined sample (MKRW-800A), the textural properties improve dramatically. The surface area increases to 190 m2/g, and the pore volume increases to 0.166 cm3/g because the alumina layers are removed and new pores are formed [30]. Although Ce loading reduces surface area and porosity, CeO2’s superior oxygen storage capacity and facile Ce3+/Ce4+ redox cycling enhance hydrogen transfer and coke resistance while maintaining strong Lewis acid activity—resulting in improved cracking performance despite diminished textural metrics [31,32,33]. This gradual change in surface area and porosity shows that thermal activation, acid treatment, and cerium loading work together to make kaolin-based catalysts work better and have a better structure.
Although the incorporation of cerium into kaolin reduces the specific surface area and micropore volume, the catalytic performance improves because activity is not governed solely by textural properties. Cerium oxide (CeO2) introduces strong redox behavior through the Ce3+/Ce4+ couple and generates oxygen vacancies that promote hydrogen transfer and coke suppression. These features enhance the cracking of heavy hydrocarbons even when the porous network becomes less developed. In addition, Ce species act as acid–redox multifunctional centers, providing both active adsorption sites and improved thermal stability. Therefore, the high catalytic activity of the Ce-modified kaolin is mainly attributed to the chemical functionality and redox dynamics imparted by cerium rather than to surface area alone [29,34].

3.5. Fourier-Transform Infrared Spectroscopy (FTIR)

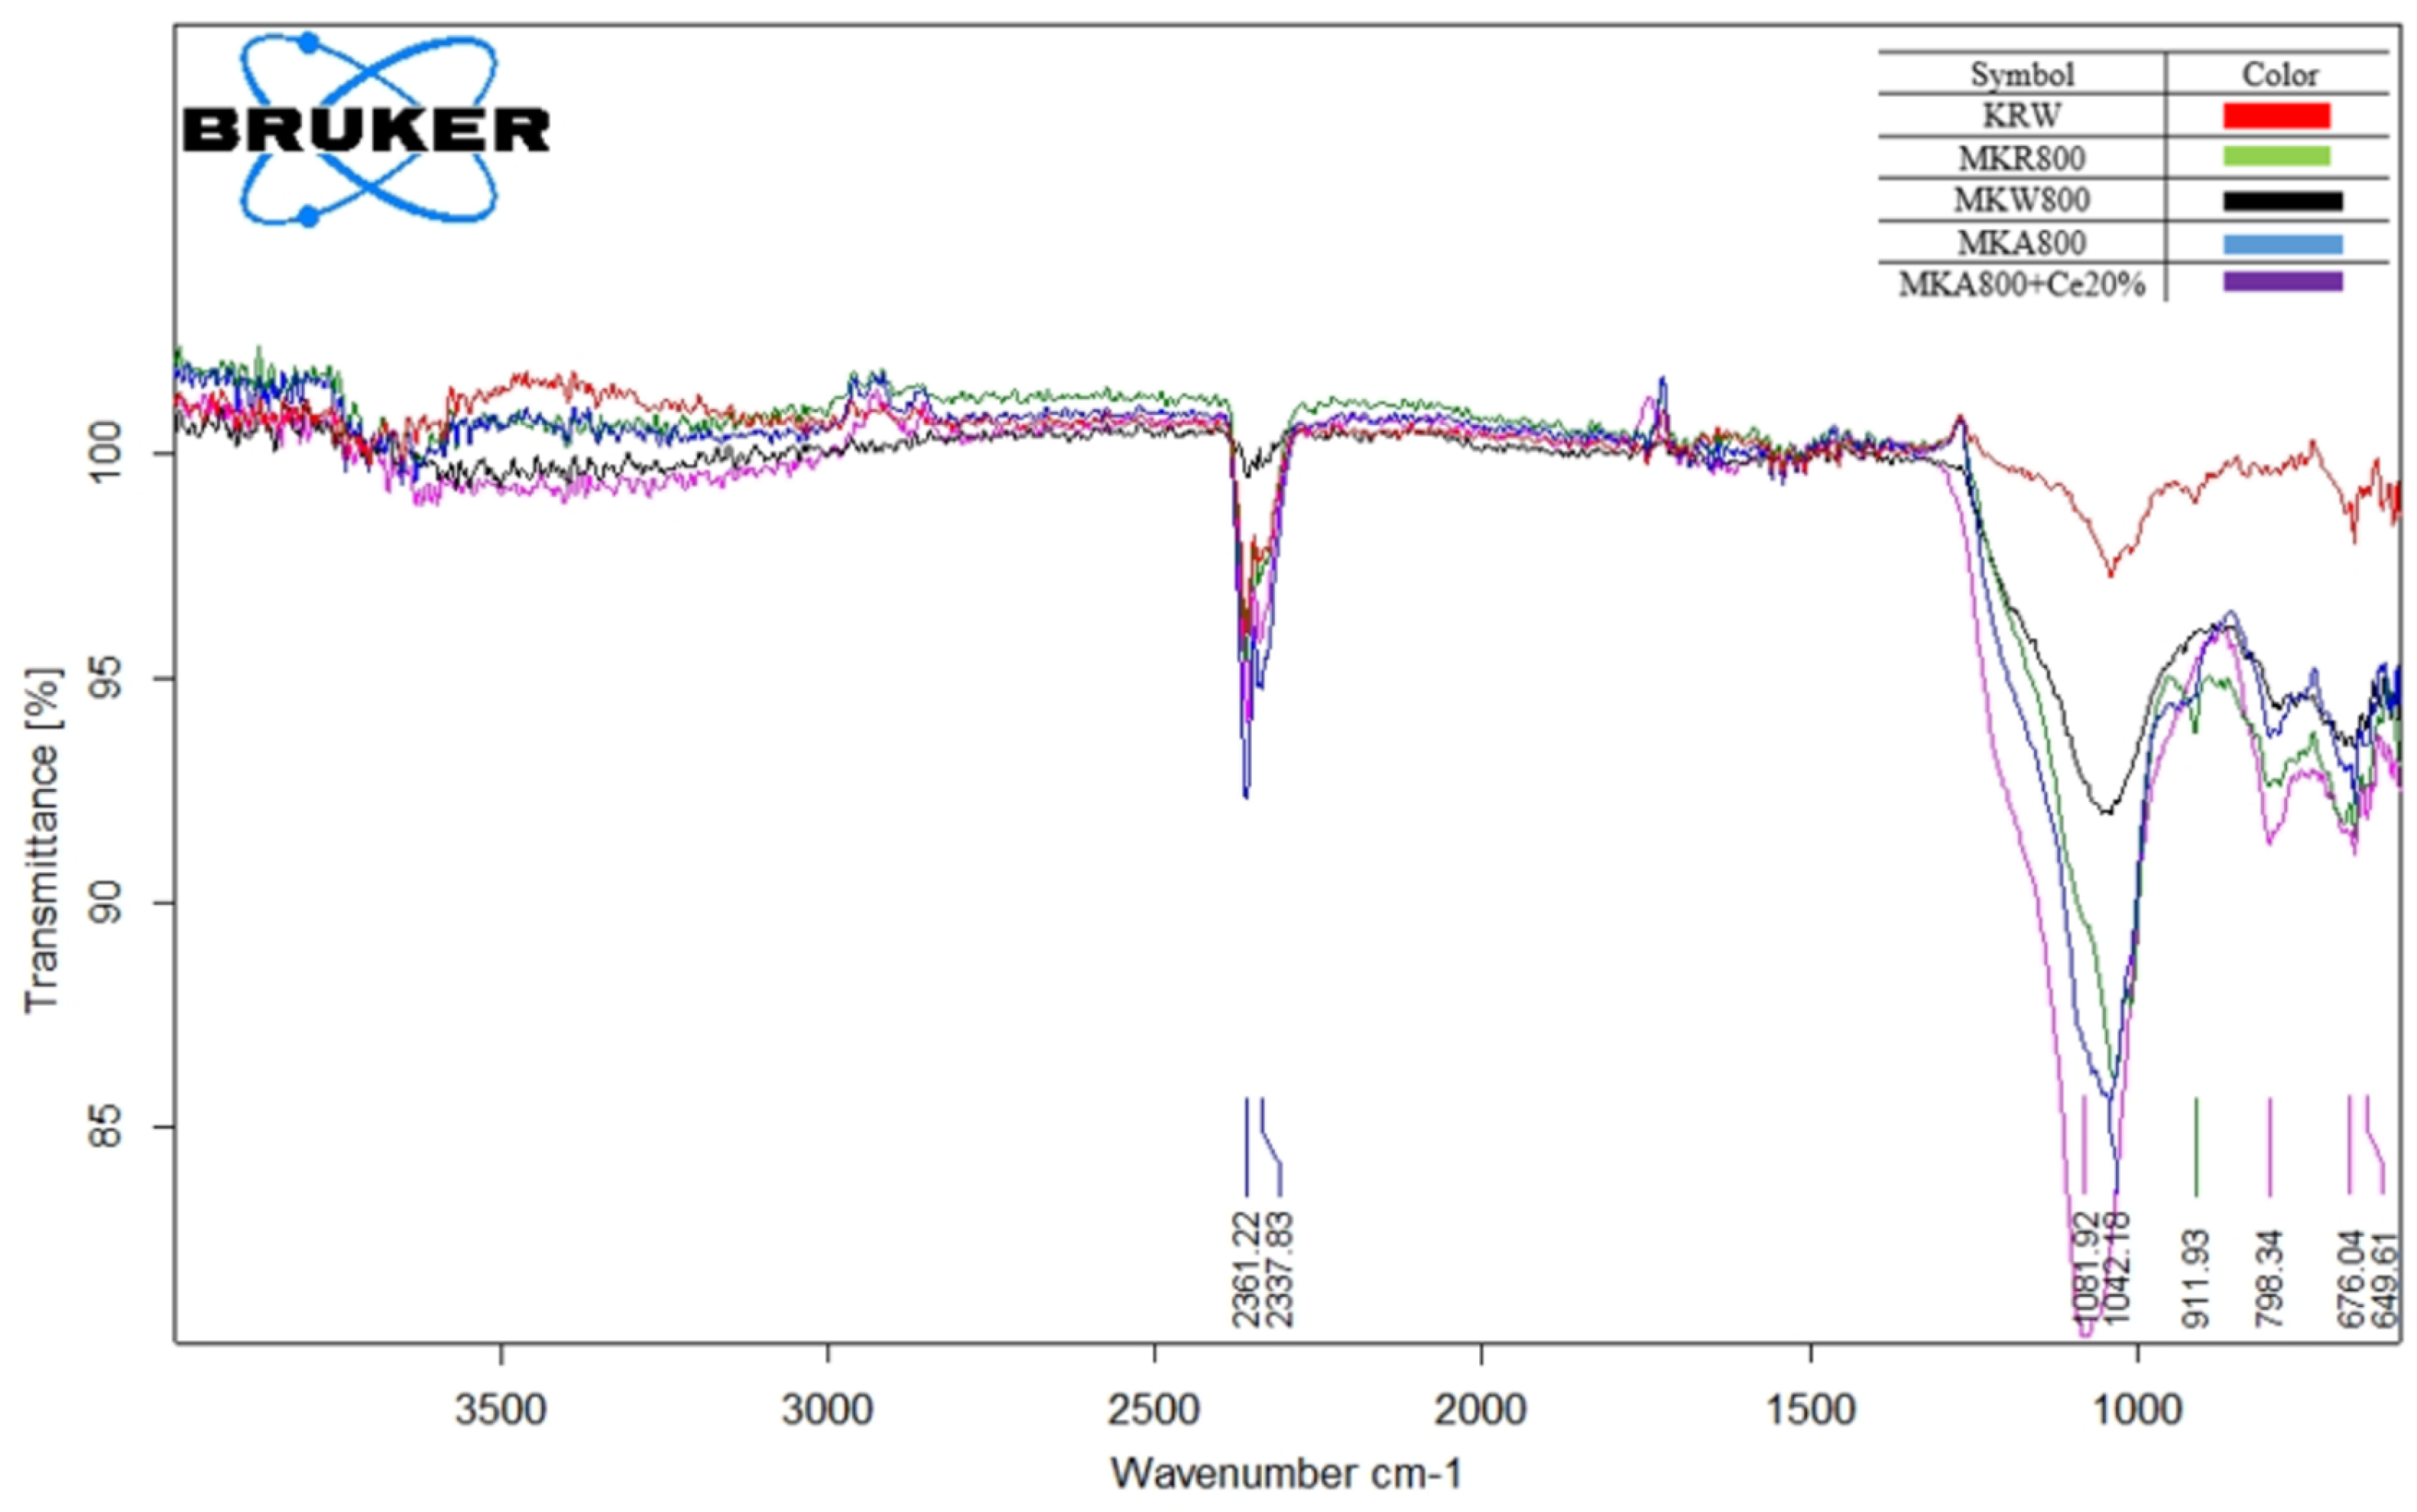
Figure 9 shows how the structure of kaolin changes over time as a result of thermal and chemical treatments, as shown by the FTIR spectra. The sharp and strong O–H stretching bands between 3695 and 3620 cm−1 and the clear Al–OH bending vibration near 910 cm−1 in the raw kaolin sample (KRW) show that there are well-ordered kaolinite layers and that the original crystalline structure is still there. When kaolin is heated to 800 °C, as seen in MKR800 and MKW800, these hydroxyl-related bands become weaker or disappear completely. This is because the kaolinite changes into an amorphous metakaolinite phase. The Si–O stretching bands also move from roughly 1114 cm−1 to lower wavenumbers (around 1001 cm−1) and become wider. This shows that the silicate network breaks down as the layered structure collapses during calcination [1].
The Si–O band is even wider for the acid-treated sample (MKA800), whereas the Al–OH band becomes a lot smaller. This suggests that alumina is being leached out in a selective way and that amorphous silica phases are forming at the same time. Acid activation causes this structural change by making the surface more disordered and creating more reactive sites [35]. The cerium-loaded catalyst (MKA800+Ce20%) has more modifications in the Si–O stretching area (about 1040 cm−1) and in the low-frequency bands between 670 and 780 cm−1. These changes are caused by Ce–O–Si interactions and the silicate framework being distorted [1]. These changes show that adding cerium changes the local chemical environment, which helps make new active redox centers.
The changes seen in FTIR, such as dehydroxylation, the formation of amorphous phases, alumina leaching, and cerium coordination, all show that the structure becomes more disordered and porous. This change in structure makes the surface more reactive and gives it more catalytic sites, which is especially helpful for catalytic processes like vacuum residue cracking [36].

3.6. Thermogravimetric Analysis (TGA)

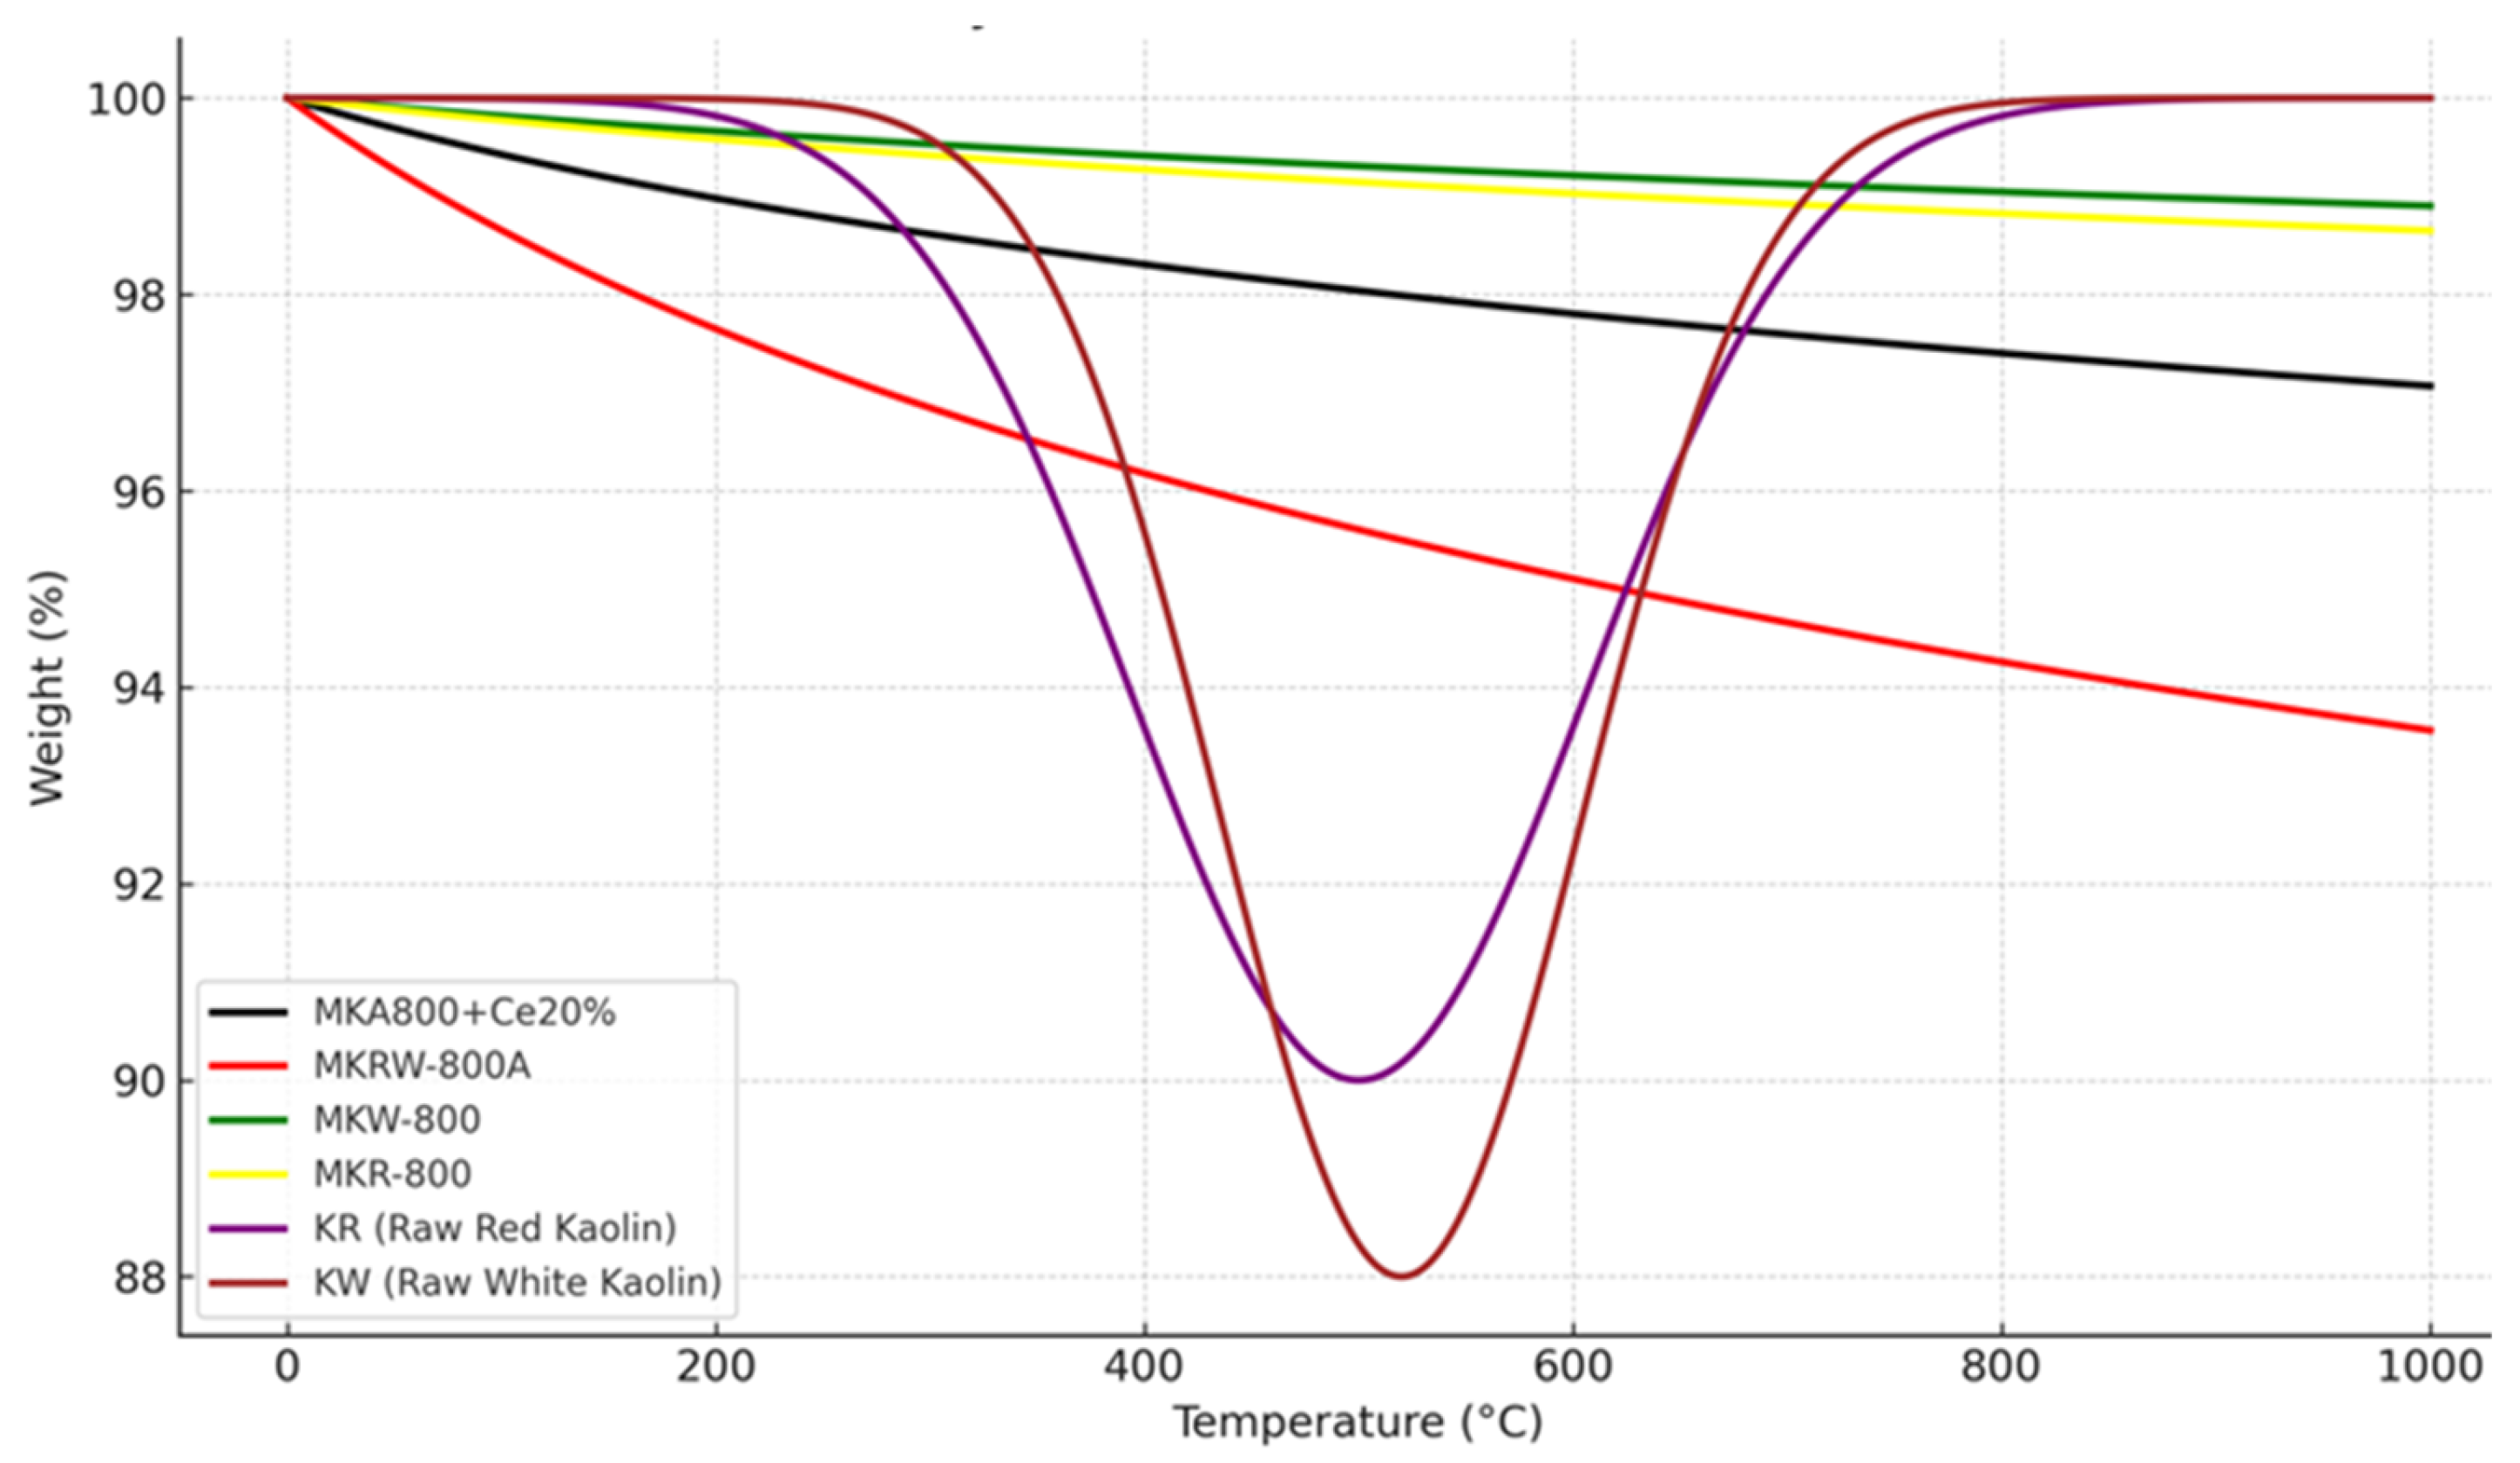
Figure 10 shows the thermogravimetric analysis (TGA) curves for raw kaolin (KR and KW), calcined kaolin (MKR-800 and MKW-800), acidified metakaolinite (MKRW-800A), and cerium-loaded metakaolinite (MKA800+Ce20%). These curves show that the thermal decomposition behaviors are different for each type of kaolin, depending on changes in structure and composition. The raw kaolin samples (KR and KW) lose a lot of weight between 400 and 650 °C. This is because kaolinite loses its hydroxyl groups and turns into metakaolinite. KR begins to dehydroxylate at a lower temperature than KW, meaning KR is less thermally stable and requires less energy for decomposition, most likely due to iron oxide impurities that promote early breakdown. A rigorous comparison of energy demand, however, should rely on kinetic analysis methods (such as Kissinger or Ozawa–Flynn–Wall) or DSC enthalpy rather than onset temperature alone. Our present data therefore indicate KR < KW in thermal stability for the main mass-loss step [37,38,39].
The apparent “return” of KR and KW to ~100% weight at 1000 °C is a baseline correction artifact, not an actual mass gain. After complete dehydroxylation, the samples stabilize, and the instrument software often normalizes the residual weight back to 100% for the plateau region. In reality, a permanent mass loss occurs due to structural water release [37].
The TGA curves of MKR-800 and MKW-800 show very little weight loss after being heated to 800 °C. This means that the material has already lost all of its hydroxyl groups and turned into thermally stable amorphous metakaolinite. The lack of considerable mass loss in this range shows that hydroxyl groups and structural water were effectively removed, which makes metakaolinite more reactive and useful for things like geopolymer production [40,41].
The sample that was treated with acid (MKRW-800A) shows a clear shift in weight loss to lower temperatures (around 100–500 °C) and a decrease in the overall residual mass. This means that acid leaching takes out alumina and disturbs the crystalline arrangement, making the structure more porous and weaker. This treatment makes MKRW-800A a better catalyst support because it increases the surface area and pore volume. The cerium-loaded sample (MKA800+Ce20%), on the other hand, loses the least amount of weight overall, about 3%, which shows that it is more thermally stable. This stabilization is due to the creation of cerium–oxygen bonds and the strengthening of the metakaolnite framework by cerium species. These species also improve the redox properties that are important for catalytic cracking [41,42].

4. Analysis of Kinetic Modeling

The following are earlier investigations pertaining to kinetic modeling for vacuum and atmospheric residue cracking:
Singh et al. [43] created a kinetic model for the thermal cracking of vacuum residue that included five lumps and ten reactions. According to estimates from Indian refineries, two leftover feedstocks were of Middle Eastern and Indian origin. Four distinct temperatures between 400 and 430 °C and a residence period ranging from 3 to 15 min were examined. The reaction route was identified using Delplot analysis.
Martinez and Ancheyta [44] examined five-lump kinetic models for the hydrocracking of heavy oil in a CSTR reactor within a temperature range of 380 to 420 °C. The findings indicate that lighter lumps exhibit greater sensitivity to temperature variations, whereas heavier lumps undergo hydrocracking with greater ease. The reaction pathway of naphtha to gases was determined to be the least favored step in hydrocracking. The mean absolute error of the developed kinetic model was below 5%.
Gao et al. [45] formulated an eight-lump kinetic model for the catalytic cracking of vacuum residue, comprising the components CP, CN, CA, HCO, LPG, dry gas, light oil, and coke. This model incorporates twenty-one kinetic parameters: twenty associated with reactions and one pertaining to catalyst deactivation. Experimental data were collected from a fixed-bed reactor and a pilot plant across four distinct temperatures (460, 480, 500, and 520 °C). The model demonstrates a high degree of simulation accuracy, with predicted yields closely aligning with the experimental findings. The eight-lump kinetic model is illustrated in Figure 11.
Based on information estimated from commercial scale residue hydrockracking units (RHC), Manek and Haydary [3] constructed a kinetic model of VR hydrocracking. The datasets reflect temperature, flow, and product yields. The temperature and pressure under study were between 401 and 412 °C and 18 and 20 MPa, respectively. VR, vacuum distillate, gas oil, kerosene, naphtha, and gas are the six fractions and eight reaction stages that make up the kinetic model. The model offers a range of potential product yield compositions and can be integrated into refinery production planning systems for mass balance computation.
Zheng et al. [46] employed a lumping strategy in the kinetic modeling of vacuum pyrolysis of POA within a pilot-scale semi-batch reactor. A five-lump kinetic model was proposed, and the Arrhenius kinetic parameters were estimated. The pyrolysis of biomass POA into biofuels was conducted at varying temperatures of 410, 430, and 450 °C, alongside different reaction durations of 10, 15, 20, 25, 40, 50, and 60 min.
Navarro and Almao [47] employed a Ni/K catalyst in the catalytic steam cracking of vacuum residue at operating temperatures ranging from 435 to 445 °C and a pressure of 300 psig. The evaluation of the lumped kinetic model encompassed the generation of asphaltenes. The selection of operating conditions was determined to be critically significant for ensuring catalytic activity in the steam cracking of vacuum residue. The alteration in the mechanism was noted under high selectivity from a kinetic perspective. The HVGO and LGVO fractions were found to exhibit significantly greater reactivity under the operational conditions of catalytic steam cracking. Figure 12 illustrates the reaction pathway for the kinetic model.
Kaminski and Hussein [23] employed three distinct schemes of a five-lump model, which encompasses gas, coke, asphaltene, maltene, and distillate fractions, in the thermal cracking of VR and AR. The procedure was conducted in a batch reactor at temperatures ranging from 400 to 420 °C and a pressure of 3 to 5 kPa. The kinetic parameters were derived through a comparative analysis of experimental and predicted outcomes. The observed compositional differences between AR and VR regarding asphaltene characteristics and hydrogen donor nature and content likely contributed to the swift deactivation of the catalyst and the subsequent loss of the selective cracking mechanism noted during AR cracking. Table 9 shows the summary of previous researchers who used kinetic models.
This study utilized a first-order simplified kinetic model, as depicted in Figure 11, comprising eight lumps (vacuum residue, heavy vacuum gas oil, light vacuum gas oil, heavy gas oil, light gas oils, heavy naphtha, and light naphtha) and twenty-eight reactions. The model was based on several assumptions: (1) uniform concentration and temperature, (2) a power law kinetic model, and (3) the neglect of gaseous products and pressure effects [10].

5. Current Study Kinetic Model

This section details this study’s assumptions, kinetic model equations, and evaluation criteria.

5.1. Assumptions

A first-order kinetic model is used in this study. The model is first simplified using some reasonable assumptions.
(1)
Uniform concentration.
(2)
Uniform temperature.
(3)
Power law kinetic model.
(4)
Neglecting gaseous products.
(5)
Neglecting the effect of pressure.

5.2. Kinetic Model Equations

The developed kinetic model contains eight-lump and twenty-eight reactions; these lumps re as follows: heavy vacuum gas oil, light vacuum gas oil, heavy naphtha, light naphtha, kerosene, atmospheric gas oil, vacuum reduced crude (VRC) and coke. The gaseous product is neglected due to its smaller weights comparing to other liquid products. Each heavy lump undergoes cracking reaction to lighter fractions (lumps). The developed kinetic model applied in this study is presented in Figure 13.
A mass balance conservation equation should be developed for each individual lump. The mass balance equations for each lump are represented in Equations (1)–(8);
d [ V R C ] d t = K 28 [ V R C ] K 29 [ V R C ] K 30 [ V R C ] K 31 [ V R C ] K 32 [ V R C ] K 33 [ V R C ] K 34 [ V R C ] K 35 [ V R C ]    
d [ H V G O ] d t = K 34 V R K 21 H V G O K 22 H V G O K 23 H V G O K 24 H V G O K 25 H V G O K 26 H V G O K 27 [ H V G O ]
d [ L V G O ] d t = K 33 V R + K 26 H V G O K 15 L V G O K 16 L V G O K 17 L V G O K 18 L V G O K 19 L V G O K 20 [ L V G O ]
d [ A G O ] d t = K 32 V R + K 25 H V G O + K 19 L V G O K 10 A G O K 11 A G O K 12 A G O K 13 [ A G O ] K 14 [ A G O ]
d [ K e ] d t = K 33 V R + K 24 H V G O + K 18 L V G O + K 13 A G O K 6 K e K 7 K e K 8 K e K 8 K e
d [ H N ] d t = K 32 V R + K 23 H V G O + K 17 L V G O + K 12 A G O + K 8 K e K 3 H N K 4 H N K 5 H N
d [ L N ] d t = K 31 V R + K 22 H V G O + K 16 L V G O + K 11 A G O + K 9 K e + K 1 H N K 1 L N K 2 L N
d [ C o k e ] d t = K 22 V R + K 16 H V G O + K 11 L V G O + K 7 H G O + K 4 L G O + K 2 K e + K 1 [ H N ]
In which;
K = Aₒ exp[−E/RT]
where Ao is the pre-exponential factor (mole/gm at.min), E is the activation energy (j/mol), R is the universal gas constant (8.314 j/mol K) and T is the absolute temperature (K).

5.3. Evaluation Criteria

Two statistical criteria were used in order to evaluate the effectiveness of developed kinetic model in this study; they are mean relative error and mean absolute error. The mean absolute error (MAE) and mean relative error (MRE) were calculated using Equations (9) and (10), respectively. [Note that MAE is the absolute difference between experimental and predicted values; MAE is dimensionless (reported simply as a number, not %). MRE is relative to the experimental value; it is usually expressed as a percentage (%)].
M A E = 1 N × M j = 1 M i = 1 N y i , j e x p y i , j p r e d
M R E = 1 N × M j = 1 M i = 1 N y i , j e x p y i , j p r e d y i , j e x p
where N, M, y i , j e x p and y i , j p r e d are the components’ number, dataset number, experimental weight fraction values and predicted weight fraction values, respectively.
The percentage VR conversion was calculated using Equation (11), and percentage yield in weight fraction for cracking products was calculated using Equation (12).
% VR conversion   ( W t ) = ( Weight VR feed Weight VR Out Weight VR feed ) × 100
% Desired product yield   ( W t ) = ( Weight of desired product Weight VR feed ) × 100
Average molecular weights were used to convert the reactant and products weights to moles and vice versa.

6. Kinetic Parameters Prediction by Genetic Algorithm (GA)

To broaden and deepen the search space of choice variables, stochastic optimization algorithms use probabilistic (i.e., random) components. And when looking for a global optimum, the added randomness could be just what you need to push past a local solution. Several stochastic optimization approaches fall into this category. These include evolutionary algorithms (such as genetic algorithms, differential evolution), particle swarm optimization, simulated annealing, harmony search, and PSO.
A genetic algorithm (GA) is a stochastic method that mimics natural evolution within the solution space of optimization problems. It functions on a set of possible solutions (i.e., individuals) during each iteration (i.e., generation). Through the integration of select individuals from the existing population based on established procedures, a subsequent generation emerges, featuring individuals of enhanced quality. Initially developed by John Holland in the 1960s, genetic algorithms have undergone extensive study, experimentation, and application across various domains within the engineering sector.
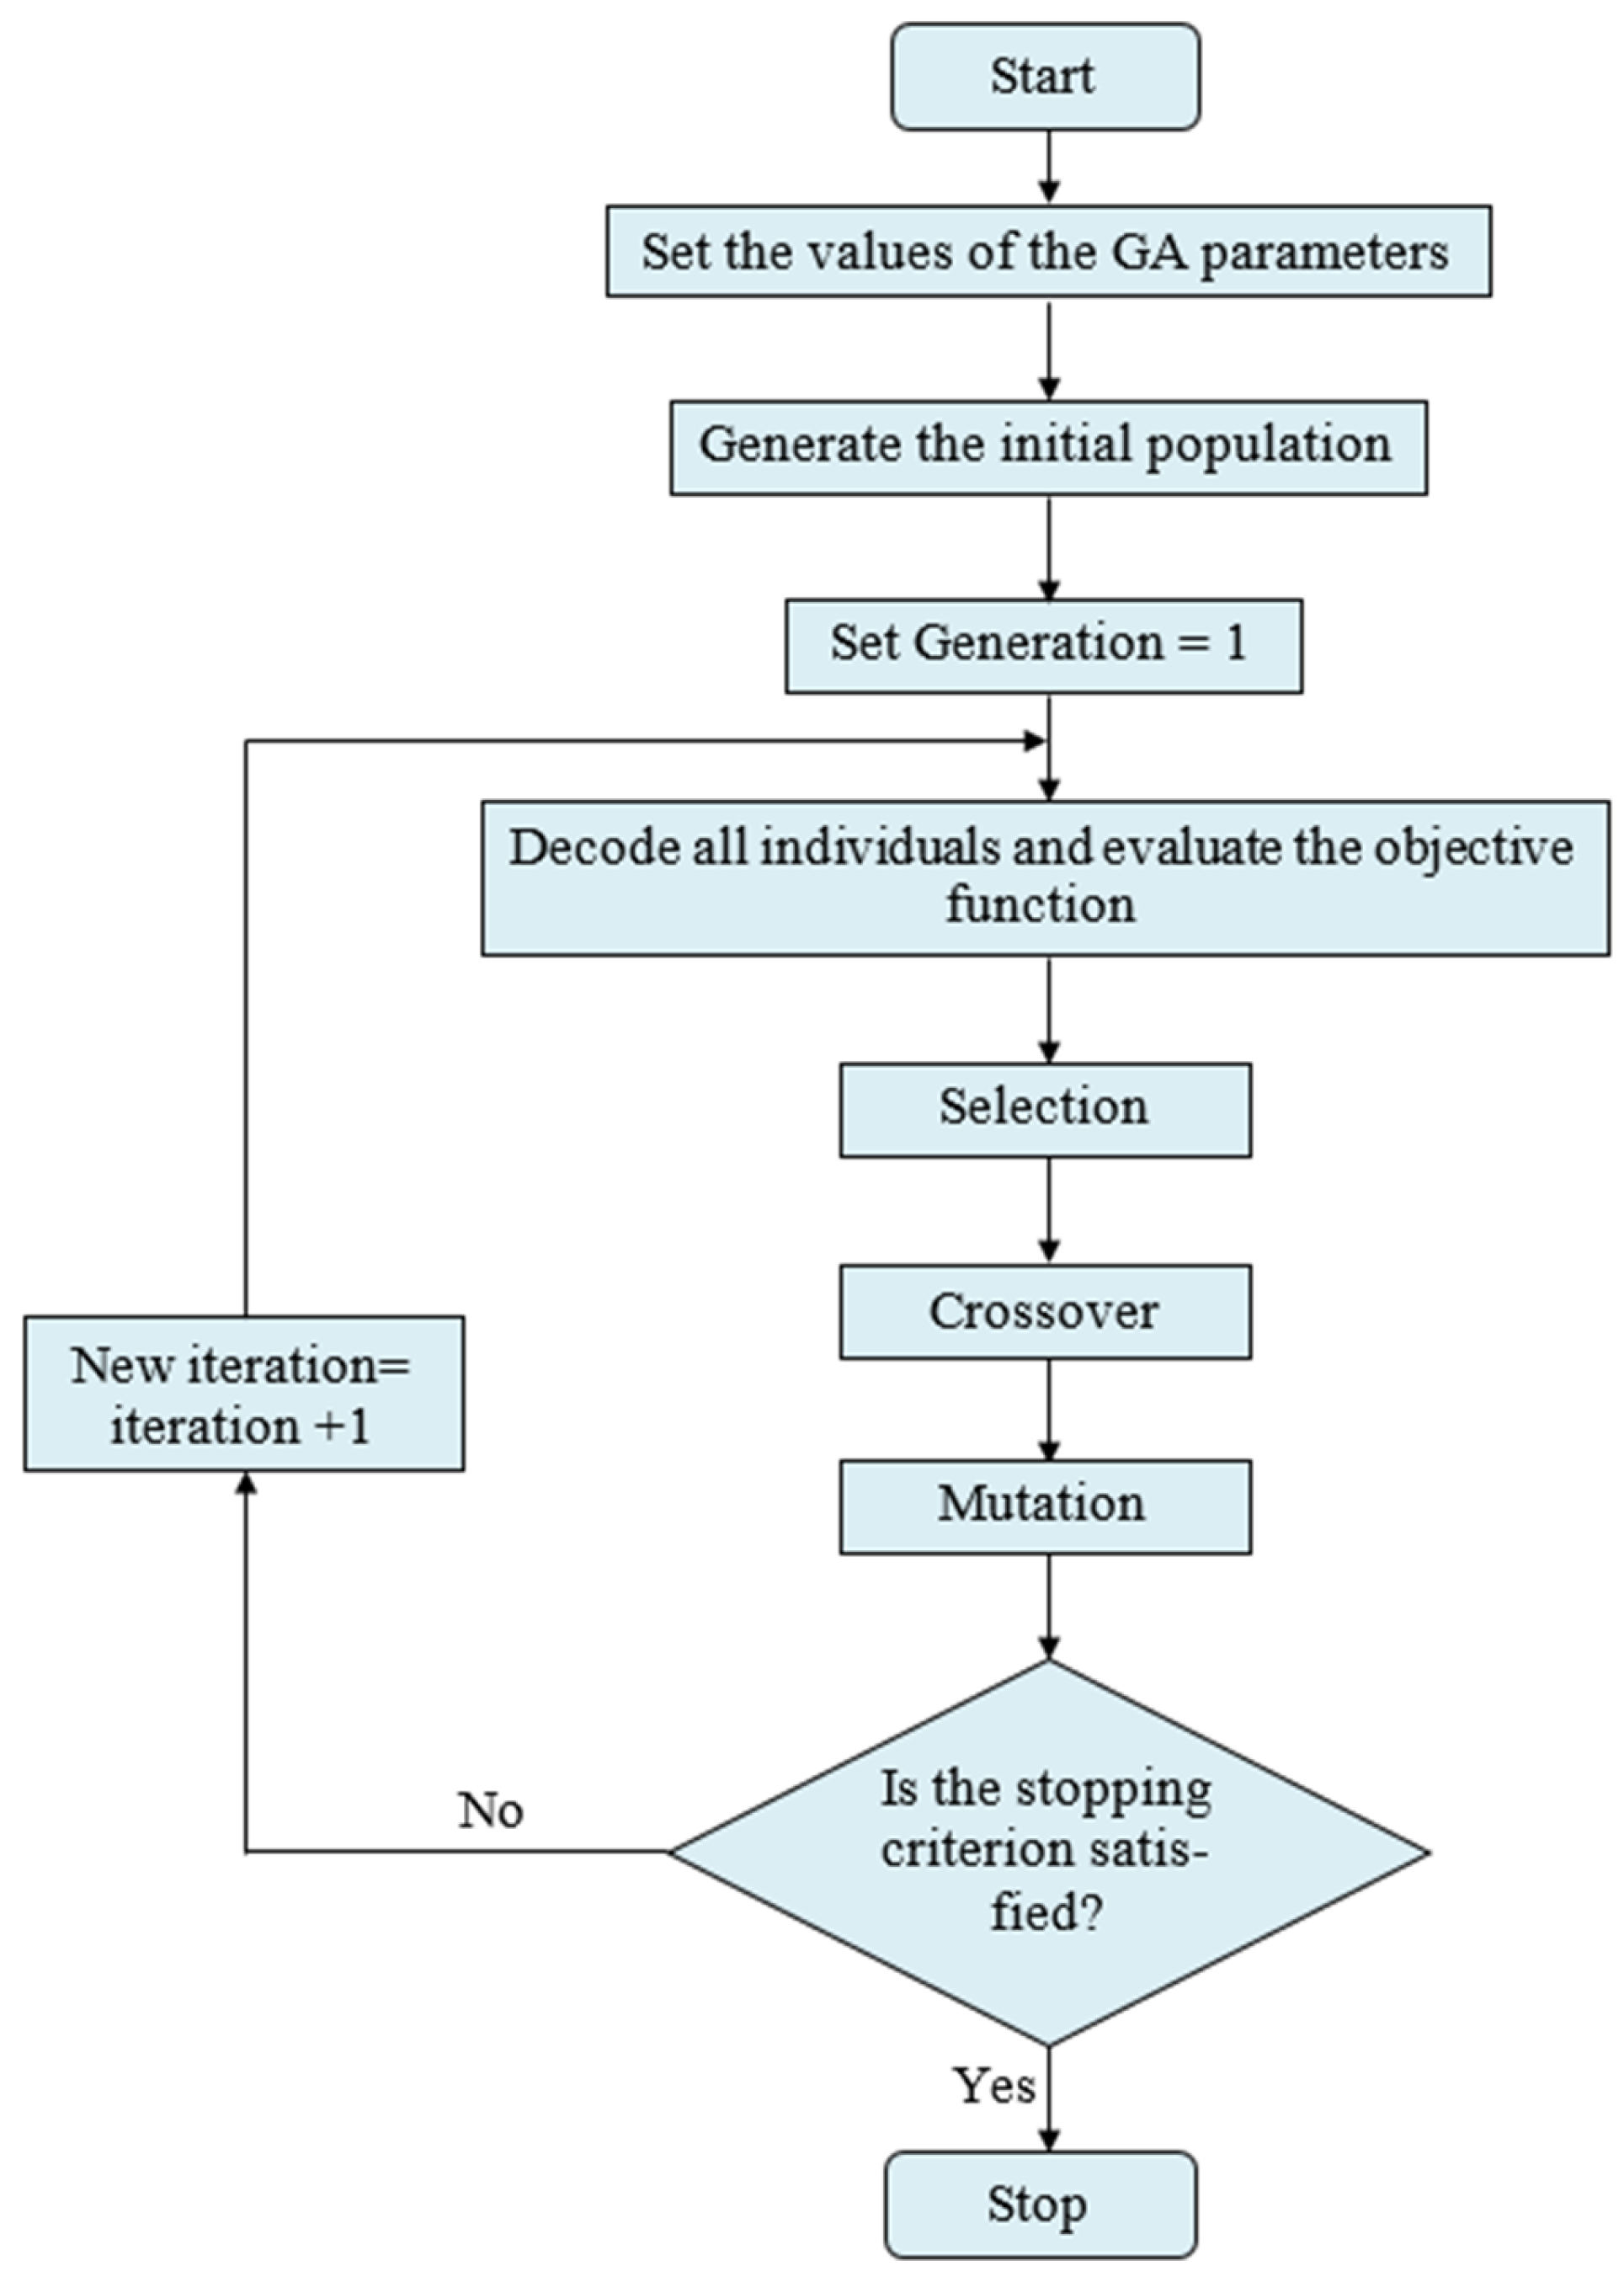
The initial phase of the genetic algorithm involves the random generation of an initial population comprising Npop solutions inside the viable region. Genetic algorithms operate on this population by employing crossover and mutation to alter certain chromosomes according to defined genetic operations, so producing a new population with enhanced attributes. Reproductive candidates are chosen according to their objective function values and the Darwinian concept of survival of the fittest [49]. The algorithm of the genetic algorithm stochastic optimization method is illustrated in Figure 14.
The results of the vacuum residue’s steam catalytic cracking were demonstrated using kinetic modeling. There were twenty-eight reactions in the recently created kinetic model, which was divided into eight groups: heavy vacuum gas oil, light vacuum gas oil, kerosene, light naphtha, heavy naphtha, atmospheric gas oil, vacuum reduced crude (VRC) and coke. These eight lumps all react in their own unique way. The model results were predicted using the fourth-order Runge–Kutta integration method, and the ideal kinetic parameters were estimated using the genetic algorithm optimization approach. The code for each program was written in MATLAB 2015a with the ga command used for stochastic optimization and the ode45 utility for numerical integration.
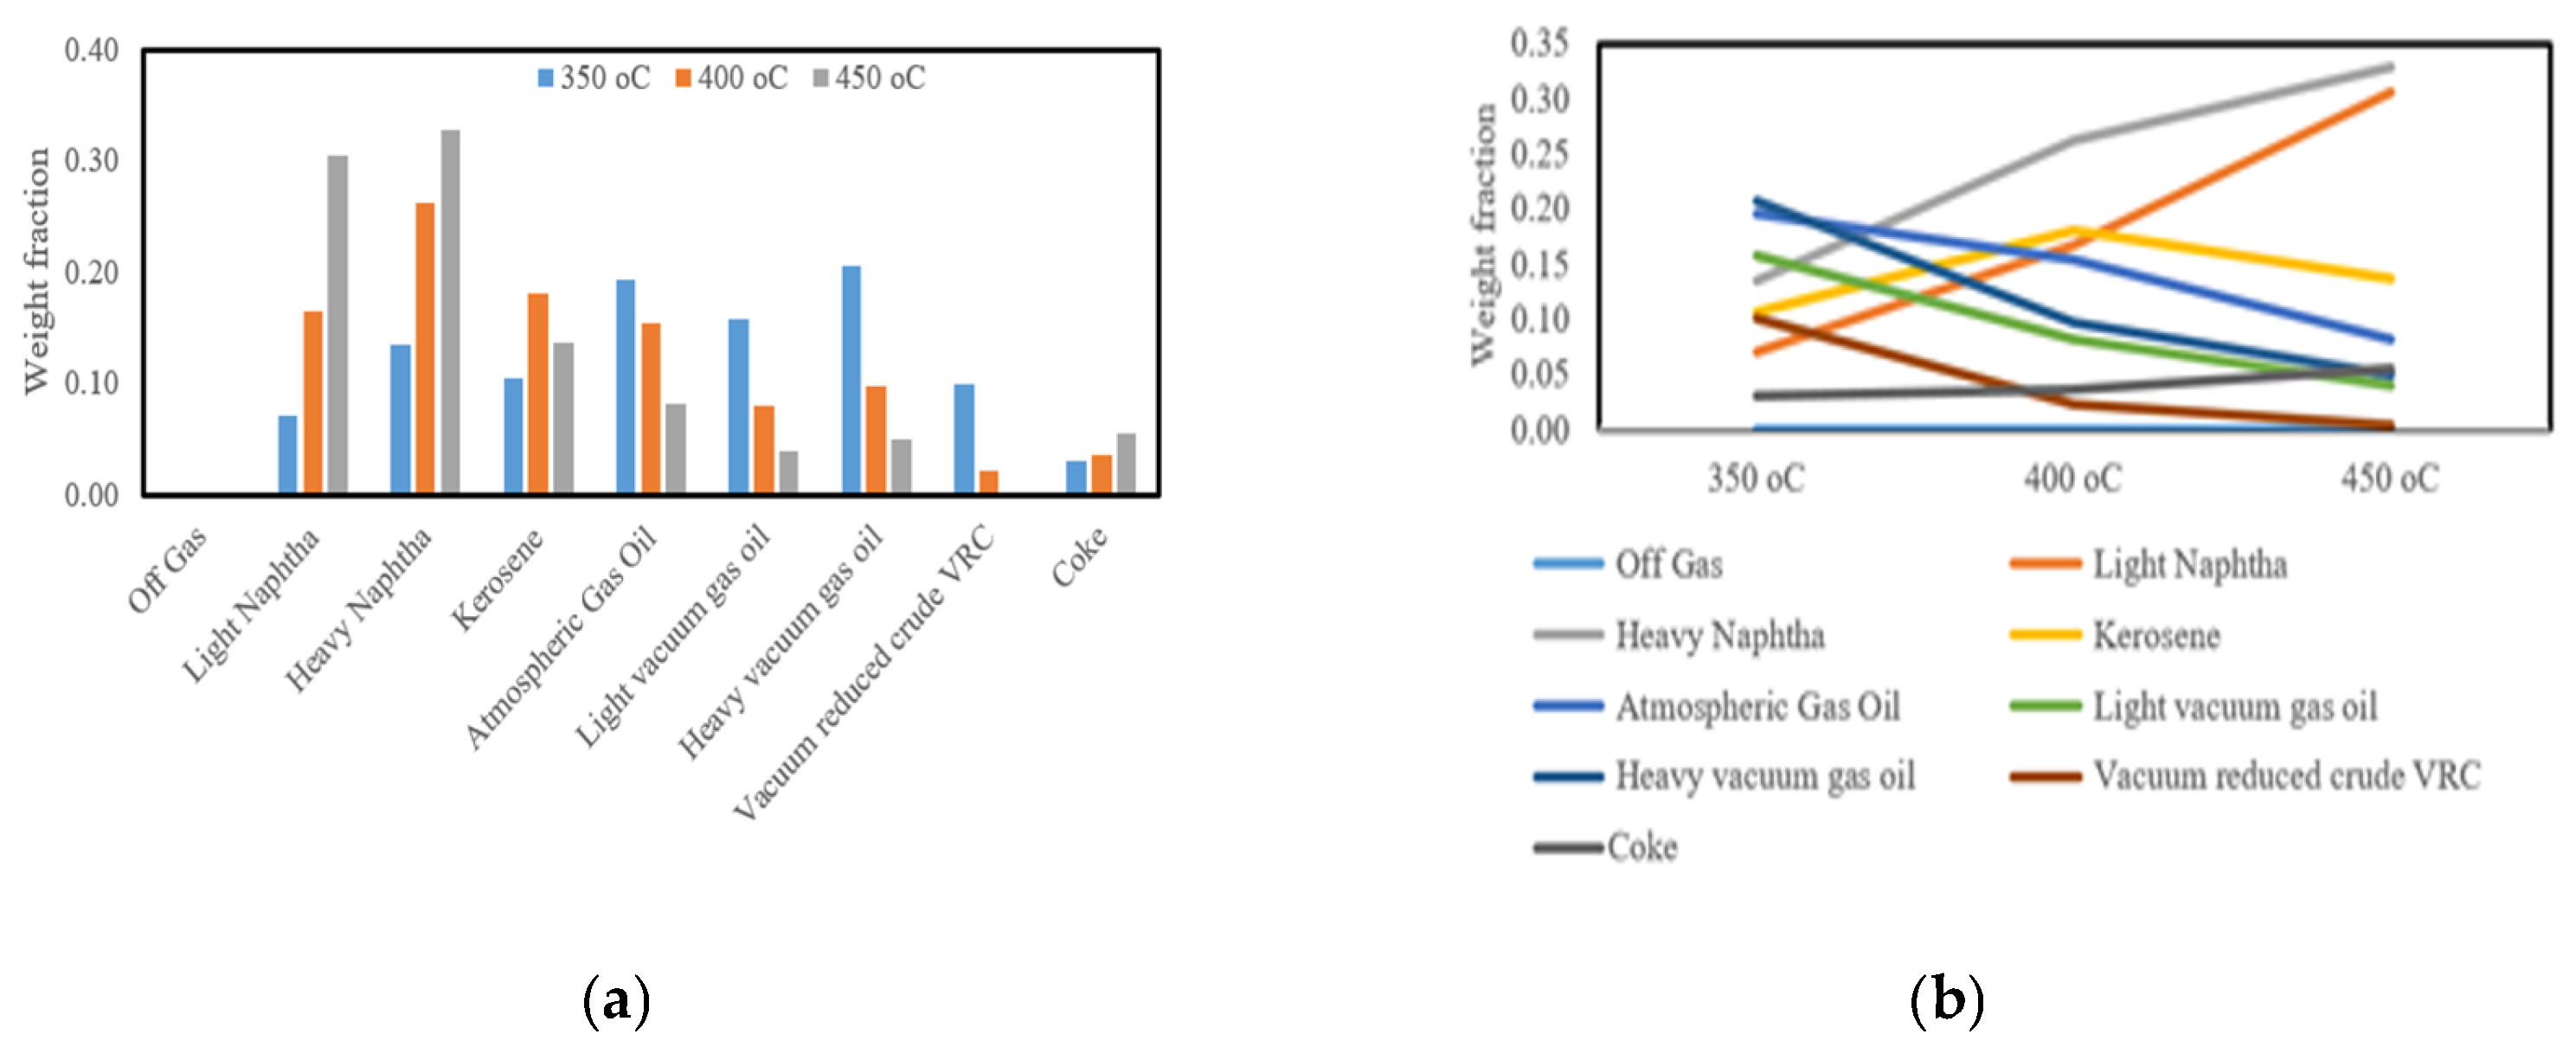
Figure 15 illustrates the influence of temperature on product distribution during vacuum residue cracking. As the reaction temperature increases from 350 °C to 450 °C, the formation of light products such as light and heavy naphtha becomes more pronounced, while kerosene and atmospheric gas oil fractions gradually decline. At higher temperatures, off-gas yields also rise significantly, reflecting deeper molecular scission and enhanced conversion of heavier hydrocarbons into lighter fragments. Coke yield, although relatively small, shows a slight increase at 450 °C, indicating the growing role of condensation and polyaromatic stability under severe conditions. These results highlight the balance between promoting liquid fuel generation and avoiding over-cracking into gas and coke, a behavior consistent with recent findings on residue pyrolysis and cracking kinetics [50,51,52].
Figure 16 shows a comparison of the experimental and anticipated weight percentages of cracking products, while Table 10 shows the comparison between experimental and predicted weight percent of cracking products at different temperatures. The kinetic model shows an adequate depiction of the experimental results. The input data covered a wide range of operating variables, which led to a moderate mean relative error (MRE) of 9.64% and mean absolute error (MAE) of 0.015052, as in Table 12 below.
As shown in Table 11, the reaction kinetic parameters were predicted using eight separate tests, ranging from five to twelve, which effectively covered all model variables.
The kinetic trends reflected in Table 11 capture the core mechanics of vacuum residue cracking: reactions with lower activation energy (Ea) proceed readily under mild conditions, favoring liquid fuel formation, whereas higher Ea pathways require severe conditions and lead to gaseous products. The pre-exponential factor (A) further shapes this behavior: a high A combined with high Ea accelerates gas yield once enough heat is applied; moderate A paired with lower Ea supports selective liquid production. Meanwhile, coke formation typically involves low Ea and low A, pointing to slow yet thermodynamically driven accumulation of stable polyaromatics. These patterns are supported by recent experimental findings: Pyrolysis of vacuum residue via Friedman and distributed activation energy modeling (DAEM) showed an average Ea of ~180 kJ/mol, rising with conversion, and revealed significant interactions among SARA fractions (SARA is a standard method of classifying crude oil or heavy fractions (like vacuum residue) into four chemical groups: Saturates (S), Aromatics (A), Resins (R), Asphaltenes (A)) that modulate Ea values (one-parallel DAEM: 227.6 kJ/mol; four-parallel: 204.6 kJ/mol) [53]. Thermogravimetric analysis with a nanocatalyst likewise demonstrated a reduction in Ea—from ~91.54 kJ/mol to ~89.68 kJ/mol—highlighting the catalyst’s role in accelerating decomposition and potentially reducing coke formation [54].
As shown in Table 12, the kinetic model achieved a mean relative error (MRE) of 9.64% and a mean absolute error (MAE) of 0.01505. In modeling studies, such low error values are generally taken as evidence that the predictions reproduce the experimental data with reasonable accuracy. Several recent works confirm that smaller MRE and MAE values reflect a closer match between the predicted and observed results, supporting the reliability of the developed model in describing product distributions during residue cracking [55,56]. This research advances sustainability by recycling waste materials into alternative fuels and useful materials while valorizing local raw materials like Iraqi kaolin to develop innovative geopolymeric systems and reduce reliance on imports [57,58,59,60,61,62].

7. Conclusions

The experimental evaluation of the MKA800@Ce20% catalyst for VR cracking has shown promising results across varying temperatures. At 350 °C, the cracking was minimal, with the majority of the product consisting of unconverted VR and heavy fractions (VRC, HVGO). At 400 °C, moderate catalytic activity was observed, leading to an increased yield of middle distillates, including light vacuum gas oil (LVGO) and atmospheric gas oil (AGO). The best catalytic performance was obtained at 450 °C, where the total liquid yield reached 11.72 g per 20 g of VR feedstock (61% conversion to liquid), with coke formation limited to 3.81 g (19.1%) and gases making up the remainder. GC-MS confirmed that the major fractions in the liquid were light hydrocarbons, including LN, HN, and kerosene. The high yield and selectivity at elevated temperatures were attributed to the synergistic effect of acid-leached metakaolin and cerium impregnation, which enhanced redox cycling (Ce4+/Ce3+) and reduced coke formation. These results demonstrate that MKA800@Ce20% is a cost-effective and thermally robust catalyst suitable for heavy residue upgrading under atmospheric conditions. The eight-lump kinetic model that was created was tested and found to be correct for both product distribution and reaction kinetics because it had low MAE and MRE values. Genetic algorithms were also used to find valid kinetic constants for 28 different cracking reactions. The evaluation of the catalyst indicated that cerium was effectively added, which improved the surface characteristics and increased the thermal stability.

Author Contributions

O.B.A.-A.: Investigation, Writing—Original Draft Preparation; M.A.: Conceptualization, Supervision; Z.S.: Software; E.B.-G.: Conceptualization, Formal Analysis; J.A.-G.: Supervision, Writing—Review and Editing; F.C.-M.: Conceptualization, Project Administration. All authors have read and agreed to the published version of the manuscript.

Funding

This research received no external funding.

Data Availability Statement

The data presented in this study are available on request from the corresponding author. The data are not publicly available due to institutional restrictions.

Conflicts of Interest

The authors declare that they have no known competing financial interest or personal relationships that could have appeared to influence the work reported in this paper.

Abbreviations

The following abbreviations are used in this manuscript:
APDAverage pore diameter
ARAtmospheric residue
ASTMAtmospheric standard test method
BETBrunauer–Emmett–Teller
CICCentral Instruments Center
GAGenetic algorithms
HGOHeavy gas oil
HNHeavy naphtha
HVGOHeavy vacuum gas oil
KeKerosene
LGOLight gas oil
LNLight naphtha
LVGOLight vacuum gas oil
MAEMean absolute error
MKA800 (MKRW-800A)Acidified metakaolnite calcined at 800 °C
MKA-800A@Ce20%Acidified metakaolnite calcined at 800 °C loaded with 20% Cerium
MREMean relative error
PIDProportional integral derivative
SEMScanning electron microscopy
VRVacuum residue
VRCVacuum reduced crude
XRDX-ray diffraction

References

  1. Alrubaye, S.M.; Mohammed, S.H.; Abdulkareem, D. Affat Studying Thermal Cracking Behavior of Vacuum Residue. Iraqi J. Chem. Pet. Eng. 2020, 21, 45–49. [Google Scholar] [CrossRef]
  2. Vogt, E.T.; Bert, M. Weckhuysen Fluid catalytic cracking: Recent developments on the grand old lady of zeolite catalysis. Chem. Soc. Rev. 2015, 44, 7342–7370. [Google Scholar] [CrossRef]
  3. Manek, E.; Juma, H. Modelling of catalytic hydrocracking and fractionation of refinery vacuum residue. Chem. Pap. 2014, 68, 1716–1724. [Google Scholar] [CrossRef]
  4. Razmgar, K.; Altarawneh, M.; Oluwoye, I.; Senanayake, G. Ceria-based catalysts for selective hydrogenation reactions: A critical review. Catal. Surv. Asia 2021, 25, 27–47. [Google Scholar] [CrossRef]
  5. Wang, D.; Jin, L.; Li, Y.; Wei, B.; Yao, D.; Hu, H. Upgrading of vacuum residue with chemical looping partial oxidation over Fe-Mn mixed metal oxides. Fuel 2019, 239, 764–773. [Google Scholar] [CrossRef]
  6. Medina Erazo, O. Development of Multifunctional Nanomaterials for the Co-Production of Upgraded Heavy Crude Oil and Hydrogen at Different Pressures and Temperatures. Ph.D. Thesis, Universidad de Granada, Granada, Spain, 2023. [Google Scholar]
  7. Song, W.; Zhong, W.; Yang, M.; Du, W.; Qian, F. A new lumped kinetic model of an industrial hydrocracking process. Chem. Eng. Trans. 2017, 61, 673–678. [Google Scholar]
  8. O’Connor, P. Kinetics and mechanisms of fluid catalytic cracking. In Practical Advances in Petroleum Processing; Springer: New York, NY, USA, 2006; pp. 169–175. [Google Scholar]
  9. Che, Y.; Hao, J.; Zhang, J.; Qiao, Y.; Li, D.; Tian, Y. Vacuum residue thermal cracking: Product yield determination and characterization using thermogravimetry–fourier transform infrared spectrometry and a fluidized bed reactor. Energy Fuels 2018, 32, 1348–1357. [Google Scholar] [CrossRef]
  10. Ajumobi, O.O.; Muraza, O.; Kondoh, H.; Hasegawa, N.; Nakasaka, Y.; Yoshikawa, T.; Al Amer, A.M.; Masuda, T. Upgrading oil sand bitumen under superheated steam over ceria-based nanocomposite catalysts. Appl. Energy 2018, 218, 1–9. [Google Scholar] [CrossRef]
  11. Adam, M.; Anbari, H.; Hart, A.; Wood, J.; Robinson, J.P.; Rigby, S.P. In-situ microwave-assisted catalytic upgrading of heavy oil: Experimental validation and effect of catalyst pore structure on activity. Chem. Eng. J. 2021, 413, 127420. [Google Scholar] [CrossRef] [PubMed]
  12. Djouadi, Y.; Chemam, M.-S.; Khelkhal, C.; Ostolopovskaya, O.V.; Khelkhal, M.A.; Vakhin, A.V. Improving In Situ Combustion for Heavy Oil Recovery: Thermal Behavior and Reaction Kinetics of Mn (acac) 3 and Mn-TO Catalysts. Energies 2024, 17, 5240. [Google Scholar] [CrossRef]
  13. Schacht-Hernandez, P.; Romo, P.P.; Laredo, G.C. Laredo Comparative catalytic study for upgrading Mexican heavy crude oil. Pet. Chem. 2023, 63, 510–517. [Google Scholar] [CrossRef]
  14. Lee, H.S.; Nguyen-Huy, C.; Pham, T.-T.; Shin, E.W. ZrO2-impregnated red mud as a novel catalyst for steam catalytic cracking of vacuum residue. Fuel 2016, 165, 462–467. [Google Scholar] [CrossRef]
  15. Yu, X.; Zhou, X.; Jiang, H.; Wang, N.; Hu, Y.; Yu, T. Catalytic aquathermolysis of emulsified residual oils with naphthenates. ACS Omega 2024, 9, 17681–17690. [Google Scholar] [CrossRef] [PubMed]
  16. Al-Karim, A.A.; Shakor, Z.M.; Al-Sheikh, F.; Anderson, W.A. Experimental and kinetic study of vacuum residue cracking over zirconium based catalysts. React. Kinet. Mech. Catal. 2022, 135, 847–865.17. [Google Scholar] [CrossRef]
  17. Rezaei, H.; Liu, X.; Ardakani, S.J.; Smith, K.J.; Bricker, M. A study of Cold Lake Vacuum Residue hydroconversion in batch and semi-batch reactors using unsupported MoS2 catalysts. Catal. Today 2010, 150, 244–254. [Google Scholar] [CrossRef]
  18. Fumoto, E.; Sugimoto, Y.; Sato, S.; Takanohashi, T. Catalytic cracking of heavy oil with iron oxide-based catalysts using hydrogen and oxygen species from steam. J. Jpn. Pet. Inst. 2015, 58, 329–335. [Google Scholar] [CrossRef]
  19. Liu, B.; Zhao, K.; Chai, Y.; Li, Y.; Liu, D.; Liu, Y.; Liu, C. Slurry phase hydrocracking of vacuum residue in the presence of presulfided oil-soluble MoS2 catalyst. Fuel 2019, 246, 133–140. [Google Scholar] [CrossRef]
  20. Wang, H.; Yoskamtorn, T.; Zheng, J.; Ho, P.-L.; Ng, B.; Tsang, S.C.E. Ce-Promoted PtSn-Based catalyst for hydrocracking of polyolefin plastic waste into high yield of Gasoline-Range products. ACS Catal. 2023, 13, 15886–15898. [Google Scholar] [CrossRef]
  21. Sun, J.A.; Selvam, E.; Bregvadze, A.; Zheng, W.; Vlachos, D.G. Hydrocracking of polyolefins over ceria-promoted Ni/BEA catalysts. Green Chem. 2025, 27, 3905–3915. [Google Scholar] [CrossRef]
  22. Buyondo, A.K.; Kasedde, H.; Kirabira, J.B.; Bongomin, O. Characterization and treatment effects on Mutaka kaolin for additive in coatings: Mineral composition, thermal and structural modifications. Heliyon 2024, 10, e24238. [Google Scholar] [CrossRef]
  23. Kaminski, T.; Husein, M.M. Kinetic modelling of thermal cracking of Arabian atmospheric and vacuum residue. Fuel Process. Technol. 2019, 189, 89–97. [Google Scholar] [CrossRef]
  24. Stratiev, D.; Toteva, V.; Shishkova, I.; Nenov, S.; Pilev, D.; Atanassov, K.; Bureva, V.; Vasilev, S.; Stratiev, D.D. Industrial investigation of the combined action of vacuum residue hydrocracking and vacuum gas oil catalytic cracking while processing different feeds and operating under distinct conditions. Processes 2023, 11, 3174. [Google Scholar] [CrossRef]
  25. Xue, H.; Dong, X.; Fan, Y.; Ma, X.; Yao, S. Study of structural transformation and chemical reactivity of kaolinite-based high ash slime during calcination. Minerals 2023, 13, 466. [Google Scholar] [CrossRef]
  26. Qi, Y.; Cai, C.-F.; Sun, P.; Wang, D.-W.; Zhu, H.-J. Crude oil cracking in deep reservoirs: A review of the controlling factors and estimation methods. Pet. Sci. 2023, 20, 1978–1997. [Google Scholar] [CrossRef]
  27. Giuseppe, M.; Caccamo, M.T.; Mavilia, L.; Magazù, S. XRD, FTIR and RAMAN Characterizations of Metakaolin Geopolymers. Mod. Concept. Mater. Sci. 2024, 5, 620. [Google Scholar]
  28. Al-Ameri, O.B.; Alzuhairi, M.; Bailón-García, E.; Carrasco-Marín, F.; Amaro-Gahete, J. Transforming petrochemical processes: Cutting-edge advances in kaolin catalyst fabrication. Appl. Sci. 2024, 14, 9080. [Google Scholar] [CrossRef]
  29. Aimdate, K.; Srifa, A.; Koo-Amornpattana, W.; Sakdaronnarong, C.; Klysubun, W.; Kiatphuengporn, S.; Assabumrungrat, S.; Wongsakulphasatch, S.; Kaveevivitchai, W.; Sudoh, M.; et al. Natural kaolin-based Ni catalysts for CO2 methanation: On the effect of ce enhancement and microwave-assisted hydrothermal synthesis. ACS Omega 2021, 6, 13779–13794. [Google Scholar] [CrossRef]
  30. Abu, T.O.; Adegoke, H.I.; Odebunmi, E.O.; Shehzad, M.A. Enhancing adsorption capacity of a kaolinite mineral through acid activation and manual blending with a 2:1 clay. Niger. J. Technol. Dev. 2024, 21, 131–151. [Google Scholar] [CrossRef]
  31. Wang, X.; Wang, J.; Sun, Y.; Li, K.; Shang, T.; Wan, Y. Recent advances and perspectives of CeO2-based catalysts: Electronic properties and applications for energy storage and conversion. Front. Chem. 2022, 10, 1089708. [Google Scholar] [CrossRef]
  32. Abbasi, A.; Darian, J.T.; Emami, M.J.; Yazd, M.S. Mechanistic insights into coke suppression in the methanol-to-olefins process via CeO2 doping to SAPO-34. RSC Adv. 2025, 15, 30312–30325. [Google Scholar] [CrossRef]
  33. Dias, B.P.; Bieseki, L.; de Longe, C.; Pergher, S.B.C. The Application of Al-Pillared Clays Impregnated with Cerium and Al/Ce-Pillared Clays for the Treatment of Simulated Textile Effluents through Photocatalysis. Minerals 2025, 15, 152. [Google Scholar] [CrossRef]
  34. Courtalón, N.L.; Milt, V.G.; Dieuzeide, M.L.; Miró, E.E.; Banús, E.D.; Bortolozzi, J.P. Co-Ce Clay-Based Materials: Their Feasibility as Catalysts for Soot and CO Oxidation Reactions. Catalysts 2024, 14, 882. [Google Scholar] [CrossRef]
  35. Chu, L.; Guo, J.; Huang, Z.; Yang, H.; Yang, M.; Wang, G. Excellent catalytic performance over acid-treated MOF-808 (Ce) for oxidative desulfurization of dibenzothiophene. Fuel 2023, 332, 126012. [Google Scholar] [CrossRef]
  36. Esgair, K.K. Investigating the Influence of the Cerium loading in prepared Y zeolite from Iraqi kaolin on its Catalytic Performance. J. Eng. 2018, 24, 70–82. [Google Scholar] [CrossRef]
  37. Polcowñuk Iriarte, I.A.; Mocciaro, A.; Rendtorff, N.M.; Richard, D. Dehydroxylation of Kaolinite: Evaluation of Activation Energy by Thermogravimetric Analysis and Density Functional Theory Insights. Minerals 2025, 15, 607. [Google Scholar] [CrossRef]
  38. Adeniyi, F.I.; Ogundiran, M.B.; Hemalatha, T.; Hanumantrai, B.B. Characterization of raw and thermally treated Nigerian kaolinite-containing clays using instrumental techniques. SN Appl. Sci. 2020, 2, 821. [Google Scholar] [CrossRef]
  39. da Silva, M.R.C.; Andrade Neto, J.D.S.; Walkley, B.; Kirchheim, A.P. Effects of kaolinite and montmorillonite calcined clays on the sulfate balance, early hydration, and artificial pore solution of limestone calcined clay cements (LC3). Mater. Struct. 2024, 57, 187. [Google Scholar] [CrossRef]
  40. Hanein, T.; Thienel, K.-C.; Zunino, F.; Marsh, A.T.M.; Maier, M.; Wang, B.; Canut, M.; Juenger, M.C.G.; Ben Haha, M.; Avet, F.; et al. Clay calcination technology: State-of-the-art review by the RILEM TC 282-CCL. Mater. Struct. 2022, 55, 3. [Google Scholar] [CrossRef]
  41. Liu, X.; Liu, X.; Hu, Y. Investigation of the thermal behaviour and decomposition kinetics of kaolinite. Clay Miner. 2015, 50, 199–209. [Google Scholar] [CrossRef]
  42. Addison, G. Novel Use of Zinc Oxide and Cerium Oxide Nanoparticle Additives on the Quality and Sustainability of Hemp Biodiesel. Ph.D. Thesis, Delaware State University, Dover, DE, USA, 2024. [Google Scholar]
  43. Singh, J.; Kumar, M.; Saxena, A.K.; Kumar, S. Reaction pathways and product yields in mild thermal cracking of vacuum residues: A multi-lump kinetic model. Chem. Eng. J. 2005, 108, 239–248. [Google Scholar] [CrossRef]
  44. Martínez, J.; Jorge, A. Kinetic model for hydrocracking of heavy oil in a CSTR involving short term catalyst deactivation. Fuel 2012, 100, 193–199. [Google Scholar] [CrossRef]
  45. Gao, H.; Wang, G.; Xu, C.; Gao, J. Eight-lump kinetic modeling of vacuum residue catalytic cracking in an independent fluid bed reactor. Energy Fuels 2014, 28, 6554–6562. [Google Scholar] [CrossRef]
  46. Zheng, Y.; Tang, Q.; Wang, T.; Wang, J. Lumping strategy in kinetic modeling of vacuum pyrolysis of plant oil asphalt. Energy Fuels 2015, 29, 1729–1734. [Google Scholar] [CrossRef]
  47. Cabrales-Navarro, F.A.; Pereira-Almao, P. Catalytic steam cracking of a deasphalted vacuum residue using a Ni/K ultradispersed catalyst. Energy Fuels 2017, 31, 3121–3131. [Google Scholar] [CrossRef]
  48. AlHumaidan, F.; Lababidi, H.M.; Al-Rabiah, H. Thermal cracking kinetics of Kuwaiti vacuum residues in Eureka process. Fuel 2013, 103, 923–931. [Google Scholar] [CrossRef]
  49. Asaee, S.D.S.; Vafajoo, L.; Khorasheh, F. A new approach to estimate parameters of a lumped kinetic model for hydroconversion of heavy residue. Fuel 2014, 134, 343–353. [Google Scholar] [CrossRef]
  50. Sampson, J.R. Adaptation in natural and artificial systems (John H. Holland). SIAM Rev. 1976, 18, 529. [Google Scholar] [CrossRef]
  51. PR, P.; Mondal, S.; Sau, M.; Bhatia, D.; Pant, K.K. Thermal cracking behavior of petroleum residues by multivariate regression, kinetic analysis and molecular characterization. J. Therm. Anal. Calorim. 2025. [CrossRef]
  52. Li, J.-G.; Xin, G.; Hou, H.-D. A molecular insight into coke formation process of vacuum residue in thermal cracking reaction. Pet. Sci. 2024, 21, 2130–2138. [Google Scholar] [CrossRef]
  53. Xiong, Q.-A.; Zhang, Y.-M.; Qiao, P.; Li, G.-T.; Li, J.-Z.; Zhang, W. Comparative pyrolysis kinetics of heavy oil and its SARA fractions using distributed activation energy model. Pet. Sci. 2023, 20, 3231–3239. [Google Scholar] [CrossRef]
  54. Makenov, D.; Tusipkhan, A.; Sarsenbekova, A.Z.; Baikenov, M.; Balpanova, N.; Aitbekova, D.; Tateeva, A.; Izbastenova, D.; Kokzhalova, B.; Ma, F. Evaluation of Vacuum Residue Decomposition Kinetics with a Catalyst by Thermogravimetric Analysis. Catalysts 2025, 15, 493. [Google Scholar] [CrossRef]
  55. Chai, T.; Roland, R. Draxler Root mean square error (RMSE) or mean absolute error (MAE)? Arguments against avoiding RMSE in the literature. Geosci. Model Dev. 2014, 7, 1247–1250. [Google Scholar] [CrossRef]
  56. Willmott, C.J.; Kenji, M. Advantages of the mean absolute error (MAE) over the root mean square error (RMSE) in assessing average model performance. Clim. Res. 2005, 30, 79–82. [Google Scholar] [CrossRef]
  57. Jabar, T.A.; Abed, M.S.; Alzuhairi, M.A. A comprehensive review on geopolymer materials: Preparation, properties, applications, and challenges. AIP Conf. Proc. 2025, 3169, 040072. [Google Scholar] [CrossRef]
  58. Alzuhairi, M. Bubble column and CFD simulation for chemical recycling of polyethylene terephthalate. AIP Conf. Proc. 2018, 1968, 030041. [Google Scholar] [CrossRef]
  59. Mohammed, H.; Alzuhairi, M.; Ibrahim, S.I.; Hussein, S.S. Ternary waste plastic blends for binding and adhesion. Int. J. Environ. Stud. 2023, 80, 978–988. [Google Scholar] [CrossRef]
  60. Alzuhairi, M.; Al-Kaisy, H.; Khdheer, M. Depolymerization of Waste Plastic Using Bubble Column for Nano Alumina Blended Coating. Fluids 2022, 7, 127. [Google Scholar] [CrossRef]
  61. Jabar, T.A.; Alzuhairi, M.A.; Abed, M.S. Acidic Influence on Geopolymerization: A Thorough Study Using HCl and Iraqi Kaolin. Russ. J. Appl. Chem. 2024, 97, 104–113. [Google Scholar] [CrossRef]
  62. Almutalabi, S.N.; Alzuhairi, M.; Hashim, F.A. Two stages thermal and catalytic cracking of polyethylene terephthalate to fuel production. Int. J. Des. Nat. Ecodyn. 2021, 16, 725–732. Available online: http://iieta.org/journals/ijdne (accessed on 21 August 2025). [CrossRef]
Figure 3. Raw red kaolin (KR) (a), red metakaolinite (MKR800) (b).
Processes 13 03126 g003
Figure 4. Raw white kaolin (KW) (a), white metakaolinite (MKW800) (b).
Processes 13 03126 g004
Figure 5. Schematic diagram of fixed-bed, stainless steel reactor and its accessories.
Processes 13 03126 g005
Figure 6. GC–mass spectroscopy for different catalysts at different temperatures.
Processes 13 03126 g006
Figure 7. Variation accumulated vol. % with temperature at different reaction temperatures.
Processes 13 03126 g007
Figure 8. XRD for (a) (KR, KW) and (MKR800, MKW 800), (b) MKRW800 A, MKRW800A@ Ce 20%.
Processes 13 03126 g008
Figure 9. FTIR for raw and modified kaolin.
Processes 13 03126 g009
Figure 10. TGA for raw (R & W) kaolin, calcined kaolin (MKR & MKW), acidified metakaolinite (MKRW-800A), MKRW-800A loaded with 20%Ce.
Processes 13 03126 g010
Figure 11. Eight-lump model developed by Gao et al. [45].
Processes 13 03126 g011
Figure 12. Reaction pathway developed by Navarro and Almao [47].
Processes 13 03126 g012
Figure 13. Eight-lump kinetic model applied in this study.
Processes 13 03126 g013
Figure 14. The algorithm of the genetic algorithm stochastic optimization method.
Processes 13 03126 g014
Figure 15. Represents (a) the yield of cuts at different temperature, (b) the temperature vs. weight fraction using different cuts.
Processes 13 03126 g015
Figure 16. Comparison between experimental and predicted weight percent of cracking products.
Processes 13 03126 g016
Table 2. Properties of VR used for catalytic cracking.
PropertyValue
Flash point COC (°C)314
Pour point (°C)+39
API Gravity10
Density @15 °C (g/cm3)1.019
Viscosity cSt@100 °C782
Sulfur (wt.%)6.55
Table 3. Typical crude oil cut points (ASTMD86) [16].
CutIBP (°C)EP (°C)
Off Gas-32
Light Naphtha3288
Heavy Naphtha88193
Kerosene193271
Light Gas Oil271321
Heavy Gas Oil321425
Light Vacuum Gas Oil425510
Heavy Vacuum Gas Oil510564
Vacuum Residue565-
Table 4. The composition of two types of kaolin [red (KR) and white (KW)] by XRF test [from CIC of Granada university].
SamplesSiO2 (%)Al2O3 (%)Fe2O3 (%)MgO (%)CaO (%)Na2O (%)K2O (%)TiO2 (%)P2O5 (%)
KR50.2221.5114.741.550.430.091.471.620.06
KW48.5134.691.620.330.130.290.431.630.03
Note: The total does not reach 100% because the table lists only the major oxides detected by XRF. The remaining percentage is mainly due to loss on ignition (structural water, moisture, and volatile species) together with minor oxides present below the detection limit.
Table 5. GC–mass spectroscopy results for MKA800+ Ce 20%.
Temp. (350 °C)Accum. Vol.% 1CutsTemp. (400 °C)Accum. Vol.%CutsTemp. (450 °C)Accum. Vol.%Cuts
86.50H.N 240.30H.N38.30L.N 6
134.21.6872.111.491.6120.1
227.913.3890.925144.9238H.N
249.715.8Kerosene165.732.46Kerosene198.2357.32
267.418.5217.564.29251.5468.22Kerosene
285.222.7A.G.O 3239.372.91A.G.O304.8574.78
372.942.85291.188.3358.1678.88A.G.O
547.699.05H.V.G.O 4332.993.09H.V.G.O411.4783.78
549.499.27374.795.55464.7889.12L.V.G.O 7
558.199.78V.R.C 5416.597.93518.0995.88H.V.G.O
563.9100458.4100571.4100V.R.C
1 Accum. Vol. % = accumulated volume %, 2 H.N = heavy Naphtha, 3 A.G.O = atmospheric Gas Oil, 4 H.V.G.O = Heavy Vacuum Gas Oil, 5 V.R.C = Vacuum Reduced Crude, 6 L.N = Light Naphtha, 7 L.V.G.O = Light Vacuum Gas Oil.
Table 6. GC–mass spectroscopy results for MKA800 only.
Temp. (350 °C)Accum. Vol.% 1CutsTemp. (400 °C)Accum. Vol.%CutsTemp. (450 °C)Accum. Vol.%Cuts
88.00.0L.N 241.00.0L.N39.00.0L.N
136.01.2H.N 373.51.0H.N90.518.7H.N
230.012.1H.N92.05.0H.N146.034.5H.N
250.014.8Kerosene166.030.5Kerosene196.052.8Kerosene
270.018.0Kerosene218.060.2Kerosene250.065.4Kerosene
288.021.9A.G.O 4240.068.9A.G.O306.073.2A.G.O
375.040.3A.G.O292.081.0A.G.O360.080.1A.G.O
548.097.8H.V.G.O 5333.089.7H.V.G.O410.086.4H.V.G.O
552.098.6H.V.G.O371.095.2H.V.G.O468.092.0H.V.G.O
561.099.6V.R.C 6418.097.6V.R.C525.096.9V.R.C
575.0100.0V.R.C466.0100.0V.R.C582.0100.0V.R.C
1 Accum. Vol. % = accumulated volume %, 2 L.N = light Naphtha, 3 H.N = heavy Naphtha, 4 A.G.O = atmospheric gas oil, 5 H.V.G.O = heavy vacuum gas oil, 6 V.R.C = vacuum reduced crud.
Table 7. GC–mass spectroscopy results for MKRW800 only.
Temp. (350 °C)Accum. Vol.% 1CutsTemp. (400 °C)Accum. Vol.%CutsTemp. (450 °C)Accum. Vol.%Cuts
89.00.0L.N 243.00.0L.N40.00.0L.N
140.00.6H.N 375.00.8H.N92.015.4H.N
235.09.8H.N94.03.9H.N148.029.8H.N
255.012.3Kerosene168.025.7Kerosene198.045.9Kerosene
275.015.7Kerosene220.052.5Kerosene252.059.7Kerosene
293.019.9A.G.O 4243.061.0A.G.O308.069.5A.G.O
380.035.5A.G.O295.074.5A.G.O364.078.2A.G.O
552.091.2H.V.G.O 5336.083.0H.V.G.O416.085.0H.V.G.O
560.093.4H.V.G.O376.089.1H.V.G.O472.090.6H.V.G.O
573.097.1V.R.C 6428.094.2V.R.C532.096.0V.R.C
590.0100.0V.R.C485.0100.0V.R.C595.0100.0V.R.C
1 Accum. Vol. % = accumulated volume %, 2 L.N = light naphtha, 3 H.N = heavy naphtha, 4 A.G.O = atmospheric gas oil, 5 H.V.G.O = heavy vacuum gas oil, 6 V.R.C = vacuum reduced crud.
Table 8. Surface area for raw, modified, kaolin and MKA800 loaded with Ce 20%.
SampleS_BET (m2/g)W0 (N2) (cm3/g)L0 (N2) (nm)V0.95 (cm3/g)V_mesa (cm3/g)
KR630.0261.590.0970.071
KW230.0091.560.0630.059
MKR-800290.0121.730.0720.060
MKW-800290.0131.810.0930.080
MKRW-800A1900.0791.490.1660.087
MKRW-800A@Ce20%360.0151.860.0610.046
The specific surface area (S_BET), micropore volume (W0), and micropore width (L0) of the samples were determined using the Brunauer–Emmett–Teller (BET) method and the Dubinin–Radushkevich (DR) equation. The mesopore volume was calculated as the difference between the amounts of N2 adsorbed at a relative pressure of 0.95 (V0.95) and the micropore volume (Gurvitch Rule).
Table 9. Key Studies on Kinetic Modeling of Vacuum Residue Conversion.
CatalystFuel TypeReactor TypeTemp. °CPressureNo. LumpsReferences
NaNO3, KNO3 and NaNO2VRBatch400–53012 kg/cm2Five[1]
NiO/Ni and MoO3/MoHeavy oilCSTR380–420100 kg/cm2Five[44]
Without catalystKuwaiti VRSemi batch400–430atmFive[38]
Commercial equilibrium catalyst LVRVRFixed fluidized bed460–520N/AEight[48]
Ni-Mo/Al2O3VRCSTR401–41218–20 MPaSix[3]
Ammonium phosphomolybdateHeavy residueBatch405–4357.0 MPaSix[25]
Without catalystVacuum pyrolysis of POASemi batch410–45040 KPaFive[40]
Without catalystVRBatch400–43012 kg/cm2Six[46]
Ni/KDeasphalted VRBatch435–445300 psigEight[47]
Without catalystAR and VRBatch400–4203–5 kpaFive[28]
Table 10. Comparison between experimental and predicted weight percent of cracking products at different temperatures.
Exp.Exp.Exp.PredictedPredictedPredicted
350 °C400 °C450 °C350 °C400 °C450 °C
Off gas1.12 × 1034.89 × 1071.73 × 1061.12 × 1076.12 × 1072.16 × 106
Light naphtha0.07080.16580.30550.08690.18330.3044
Heavy naphtha0.13480.26210.32740.13580.22580.3274
Kerosene0.10560.18050.13720.10550.15270.1387
Atmospheric gas oil0.19440.15430.08130.18230.15560.0813
Light vacuum gas oil0.15810.08120.03980.14460.09500.0398
Heavy vacuum gas oil0.20610.09730.04990.19380.11980.0496
Vacuum reduced crude VRC0.09940.02220.00320.12230.02780.0032
Coke0.03080.03660.05560.02880.04000.0556
Table 11. Predicted kinetic parameters.
Kinetic Rate Constant
ReactionKinetic ParameterA (s−1)Ea (kJ·mol−1)
Light naphtha → GasesK13037.517265.5
Light naphtha → CokeK220,899,699259.6
Heavy naphtha → GasesK37,378,625252.3
Heavy naphtha → Light naphthaK416,782.46139.0
Heavy naphtha → CokeK553,956.58264.7
Kerosene → GasesK650.2081999.5
Kerosene → Light naphthaK71208.57449.5
Kerosene → Heavy naphthaK8364,123.995.0
Kerosene → CokeK912,889.62180.2
Atmospheric gas oil → GasesK10909.4475225.3
Atmospheric gas oil → Light naphthaK11149,507.7121.4
Atmospheric gas oil → Heavy naphthaK12511.407944.9
Atmospheric gas oil → KeroseneK1314,778.0870.9
Atmospheric gas oil → CokeK14824.740462.2
Light vacuum gas oil → GasesK1565.36871103.8
Light vacuum gas oil → Light naphthaK16515.205542.6
Light vacuum gas oil → Heavy naphthaK1724,788.3187.2
Light vacuum gas oil → KeroseneK181,771,486126.0
Light vacuum gas oil → Atmospheric gas oilK19173,775.3180.5
Light vacuum gas oil → CokeK20122,550.390.6
Heavy vacuum gas oil → GasesK2145,981.66261.6
Heavy vacuum gas oil → Light naphthaK22143,200.3276.2
Heavy vacuum gas oil → Heavy naphthaK23282,326.9238.7
Heavy vacuum gas oil → KeroseneK24531.561441.9
Heavy vacuum gas oil → Atmospheric gas oilK255406.332274.8
Heavy vacuum gas oil → Light vacuum gas oilK26671,080.9181.9
Heavy vacuum gas oil → CokeK274163.856208.5
Vacuum residue → GasesK285,859,150246.0
Vacuum residue → Light naphthaK293274.9354285.1
Vacuum residue → Heavy naphthaK30163.894242.6
Vacuum residue → KeroseneK31144,032.5149.4
Vacuum residue → Atmospheric gas oilK321302.6347.5
Vacuum residue → Light vacuum gas oilK3360.04285332.1
Vacuum residue → Heavy vacuum gas oilK3453.3904629.9
Vacuum residue → CokeK359.7871234.3
Table 12. Statistical error values of the developed kinetic model predictions.
Error CorrelationValueUnit
MRE9.64%
MAE0.01505
Note: The dash (–) under MAE Unit shows that it is dimensionless, since it was calculated from weight fractions.
Disclaimer/Publisher’s Note: The statements, opinions and data contained in all publications are solely those of the individual author(s) and contributor(s) and not of MDPI and/or the editor(s). MDPI and/or the editor(s) disclaim responsibility for any injury to people or property resulting from any ideas, methods, instructions or products referred to in the content.