Article

Bi-Level Optimization Method for Frequency Regulation Performance of Industrial Extraction Heating Units Under Deep Peak Shaving Conditions

1
Electric Power Research Institute of Guangxi Power Grid Co., Ltd., Nanning 530032, China
2
Guangxi Key Laboratory of Intelligent Control and Maintenance of Power Equipment, Nanning 530032, China
3
School of Electrical Engineering and Automation, Wuhan University, Wuhan 430072, China
4
Power Dispatching and Control Center Guangxi Power Grid Co., Ltd., Nanning 530032, China
*
Author to whom correspondence should be addressed.
Processes 2025, 13(10), 3111; https://doi.org/10.3390/pr13103111
Submission received: 19 August 2025 / Revised: 22 September 2025 / Accepted: 24 September 2025 / Published: 28 September 2025
(This article belongs to the Special Issue Hybrid Artificial Intelligence for Smart Process Control)

Abstract

This paper proposes a multi-objective collaborative optimization method based on a two-layer optimization framework to address the problem of difficult coordinated optimization of multi-parameter coupling in the frequency regulation performance of heating units under deep peak shaving conditions. The upper-level optimization of this method focuses on the dynamic performance of primary frequency modulation and improves the fast response capability through multi-objective optimization of overshoot and adjustment time. Lower-level optimization is based on the optimal control parameter set output by the upper level, with comprehensive power deviation as the indicator, focusing on suppressing the deviation of frequency modulation power and the steady-state deviation of heating power. Propose a comprehensive quantitative index for frequency modulation performance and characterize the optimization effect of frequency modulation performance. Introducing a dynamic perturbation factor mechanism to generate an improved HO algorithm for dual-layer optimization solutions, preventing it from getting stuck in local optima and solving the problem of global search capability imbalance. The effectiveness of the method was verified based on actual unit calculations, and the obtained control parameter set met the objectives of optimal primary frequency regulation dynamic performance and optimal comprehensive power deviation performance, significantly improving the frequency regulation performance of heating units under deep peak shaving. After optimization, the overshoot performance score of the unit increased by 16.9%, the regulation time performance score increased by 25.1%, the frequency modulation power deviation score increased by 14.2%, the heating power deviation score increased by 17.7%, and the total frequency modulation performance score increased from 75.26 to 95.95, with a comprehensive optimization range of 27.5%.

1. Introduction

Facing the exponential growth trend of new energy grid integration scale [1,2], the power grid is facing an increasingly urgent demand for flexible regulation resources. Thermal power units have gradually evolved from main power sources to peak and frequency regulation resources. Many power plants have carried out flexibility transformation with the goal of reducing minimum output, rapid response, and Thermoelectric decoupling. Especially for thermal power units serving industrial steam and heating, the problems of delayed response and insufficient peak shaving depth during deep peak shaving and frequency regulation are particularly prominent. Therefore, it is urgent to carry out research on frequency regulation performance optimization technology [3].
Some scholars have conducted research on modeling the frequency regulation performance of thermal power units. Reference [4] proposes a variable parameter modeling and identification method for the deviation problem of the primary frequency regulation model of traditional thermal power units under deep peak shaving conditions. By deriving the nonlinear relationship between parameters and main steam pressure, parameter reduction is achieved. In response to the strong nonlinear characteristics of power response in thermal power units, reference [5] constructed a refined primary frequency modulation power response model based on a typical steam turbine model by introducing valve flow characteristics and main steam pressure coupling function, main steam pressure model, and regulating stage pressure load dynamic conversion coefficient. In the direction of improving frequency regulation performance under deep peak shaving conditions, reference [6] innovatively designs a feedforward–feedback coordinated control system based on the time delay characteristics of thermal network energy storage. Reference [7] breaks through the limitations of traditional mechanism modeling and develops a parameter identification system for thermal power units based on an improved particle swarm optimization algorithm. By introducing the Levenberg–Marquardt local search operator, the convergence speed of the turbine speed control system model is improved by 60%. Reference [8] applied the mutation particle swarm algorithm to optimize the flow characteristics of high-pressure valves, enhancing the response capability of the unit to power grid frequency deviation disturbances. Reference [9] has studied the frequency division control strategy, decomposing the frequency signal of the original primary frequency modulation negative feedback channel into two frequency bands through the frequency divider, setting reasonable dead zone links, differential adjustment coefficients, and adding a PD controller to advance regulation in different frequency bands, which improves the primary frequency regulation capability and stability of the unit. Reference [10] proposed a multi-variable collaborative optimization scheme for thermal power units under deep peak shaving, including technologies such as throttling of main steam control valve, condensate variable load regulation, bypass feedwater regulation, and Auxiliary extraction regulation. The above literature studied the impact of various control strategies on the primary frequency regulation of thermal power units, but did not fully consider the dynamic characteristics of the superposition of multiple frequency regulation control parameters in the heating process, and lacked a multi-parameter strategy, a collaborative, complementary optimization control method. Therefore, the following key issues in this research field urgently need to be addressed: the existing evaluation system has a strong subjectivity in weight allocation, which leads to parameter tuning relying on experience and making it difficult to balance sensitivity and system stability [11,12,13].
This article proposes a deep peak shaving heating unit frequency regulation performance optimization method based on a two-layer optimization framework [14]: the frequency regulation problem is decomposed into upper level primary frequency regulation dynamic performance optimization and lower level comprehensive power deviation optimization, and a hierarchical multi-objective collaborative mechanism is constructed-different from the traditional hierarchical optimization that only has a one-way logic of “upper level direction determination and lower level fine adjustment”. This article achieves the goal of collaboration through a dynamic feedback loop (lower-level optimal parameters feedback upper-level secondary optimization); Using an improved HO algorithm to solve the optimal frequency modulation performance, output a set of control parameters that satisfy the optimal performance of primary frequency modulation dynamics and comprehensive power deviation. The proposed method was also simulated to verify its effectiveness in improving the frequency regulation performance of heating units.

2. Bi-Level Optimization Architecture for Frequency Regulation Performance Under Deep Peak Shaving Condition of Heating Units

2.1. Bi-Level Optimization Framework for Deep Peak Shaving and Frequency Regulation Performance of Heating Units [15]

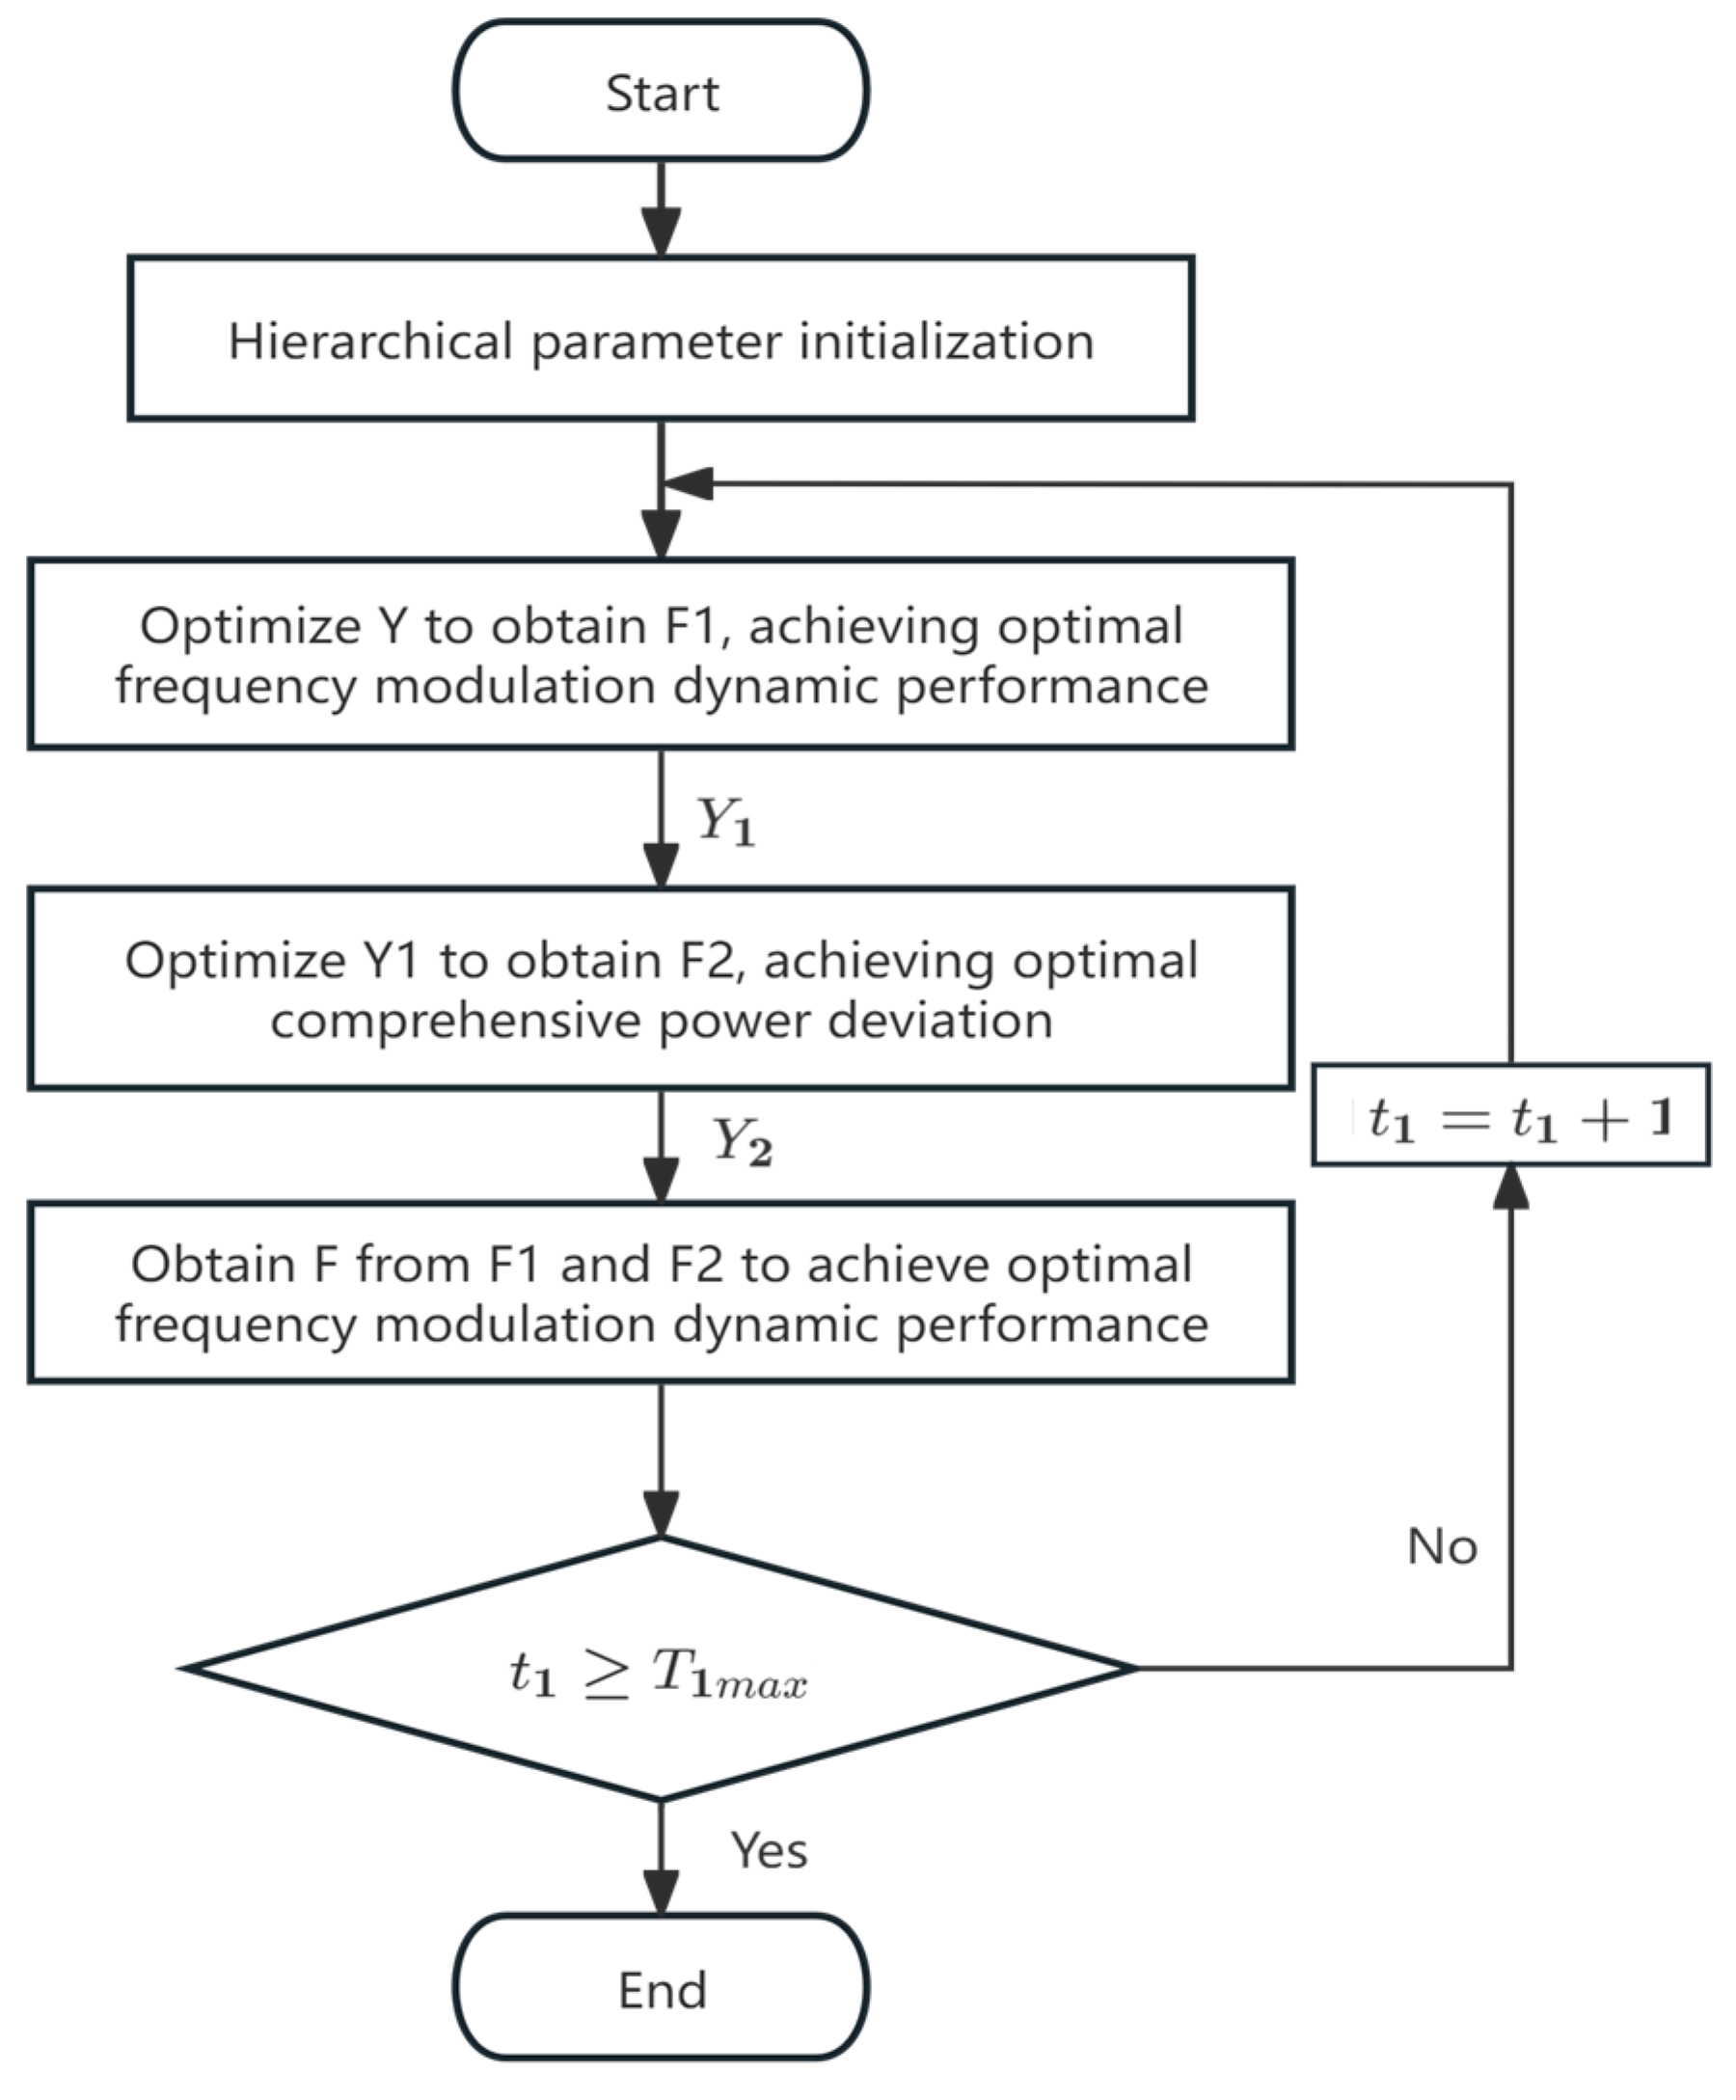
There are multiple key control parameters that significantly affect the frequency regulation performance of deep peak shaving heating units in terms of operation and multi-objective control, mainly including: amplification factor of speed deviation K , PID proportional coefficient of the speed control system K P , time constant of the hydraulic servo motor T c , steam volume time constant T c h , proportional coefficient of high-pressure cylinder F H P , extraction volume time constant T e , PID proportional coefficient of the butterfly valve K P d v , time constant of the butterfly valve hydraulic servo motor, T d v etc. According to the influence mechanism of parameter effects, two types of control objectives are divided: (1) the dynamic performance parameters of primary frequency regulation in transient processes, including overshoot and regulation time during frequency regulation; (2) the steady-state power deviation value of the steady-state process and the deviation of the heating power output value from the set value. For these two objectives, a two-layer optimization method can be used, and the transfer relationship is shown in Figure 1.
Develop an optimization process for the frequency regulation performance of deep peak shaving heating units [16], as shown in Figure 2. The main process of the double-layer optimization of this model is:
(1)
Initialize and analyze the sensitivity of the unit model, and construct a set of control parameters.
(2)
In the optimization of primary frequency regulation dynamic performance in the upper layer, an evaluation score system F 1 is defined to characterize the performance of the unit’s primary frequency regulation dynamic performance (with decision variables of overshoot and regulation time), as shown in Equation (1).
F 1 = ω 1 F J + ω 2 F t s
In the formula: F J is the overshoot score of the frequency modulation process; F t s Score the adjustment time for the frequency modulation process; ω 1 And ω 2 is the corresponding weight.
Use intelligent algorithms to optimize the dynamic performance of frequency modulation, based on the initialization of the control parameter set Y . And calculate the optimal F 1 and corresponding optimal control parameter sets Y 1 according to Equation (1).
(3)
In the optimization of comprehensive power deviation at the lower level, an evaluation score system F 2 is defined to characterize the magnitude of power deviation of the unit under stable operating conditions (the decision variables are frequency modulation power deviation and heating power deviation), as shown in Equation (2).
F 2 = θ 1 F P + θ 2 F P H
In the formula: F P is the score of the power deviation value after primary frequency modulation; F P H Score the deviation between the output value of heating power and the set value θ 1 And θ 2 is the corresponding weight.
Based on the control parameter set Y 1 output from the upper layer, intelligent algorithms are used to further optimize the comprehensive power deviation. According to Formula (2), the optimal F 2 and the corresponding optimal control parameter set Y 2 are obtained to minimize the frequency modulation power deviation under current conditions and achieve the output heating power as close as possible to the set heating power.
(4)
For the overall unit, an evaluation score system F is defined to characterize the performance of frequency regulation (the decision variables are the current primary frequency regulation dynamic performance score and the comprehensive power deviation score), as shown in Equation (3)
F = ζ 1 F 1 + ζ 2 F 2
In the formula ζ 1 and ζ 2 represent the weights of the optimization scores for the upper and lower layers, respectively.
(5)
In the case of output F , let the maximum loop parameter set Y 2 feedback back to the upper layer for further optimization. All the involved weights ( ω 1 , ω 2 ; θ 1 , θ 2 ; ζ 1 , ζ 2 ) are constructed based on power grid experts’ opinions and engineering requirements. The upper-layer dynamic performance weights, i.e., ω 1 (overshoot weight) and ω 2 (settling time weight), can be set to 0.55 and 0.45, respectively. For the lower-layer comprehensive power deviation weights, θ 2 (heating power deviation weight) can be increased to 0.65, while θ 1 (frequency modulation power deviation weight) is set to 0.35. As for the overall performance weights ζ 1 and ζ 2 , they need to balance “dynamic response” and “steady-state accuracy”. In the example, ζ 1 (upper-layer dynamic performance weight) is set to 0.4 and ζ 2 (lower-layer power deviation weight) to 0.6, which is in line with the engineering requirement of “steady-state power accuracy taking precedence over short-term dynamic fluctuations” under deep peak shaving.

2.2. Comprehensive Quantification Method for Deep Peak Shaving and Frequency Regulation Performance of Heating Units

A globally differentiable scoring function is constructed for the frequency regulation performance score system F 1 ,   F 2 and F of deep peak shaving heating units, which can be applied to engineering practice by progressively punishing the degree of constraint violations, as shown below.
(1)
Normalized standard deviation measure
Firstly, define the evaluation interval Ω = X min , X max , whose geometric center and the radius of allowable deviation can be characterized as,
C = X max + X min 2 R = X max X min 2
In the formula: C is the geometric center of the evaluation interval; R is the allowable deviation radius
Calculate the normalized standard deviation σ n for n sample data X i
σ n = 1 R 1 n i = 1 n ( X i C ) 2
In the formula, σ n is the normalized standard deviation, which quantifies the degree of deviation between the data distribution and the ideal concentration state. σ n = 1 represents that the sample standard deviation is equal to the allowable deviation. To compute the normalized standard deviation σ n and other relevant indicators, sample data points are extracted at fixed intervals from the frequency modulation process. Each sample point, denoted as X i , corresponds to an instantaneous value measured during the system’s response to a frequency disturbance. The sampling window is defined as a fixed time interval, typically during the steady-state or transient phases of the system’s response, allowing for the collection of data under stable operating conditions. Single-scalar indicators are initially calculated for the system’s response to a frequency modulation event. These indicators are then expanded into a sample set X i by collecting multiple measurements of the relevant variables.
(2)
Basic rating function
Construct a basic score using an exponential decay model,
S b = 100 e k d σ n 2
In the formula: S b is the basic score; k d is the attenuation coefficient. When σ n = 1 , S b = 60 , solve for k d = ln ( 0.6 ) . The constant ln (0.6) is derived from the exponential decay model used to calculate the basic score in the scoring function. This model is based on engineering standards that require a minimum score of 60 when the normalized standard deviation is equal to 1, representing the worst-case deviation. The choice ensures that as the deviation approaches 0, the score asymptotically approaches 100, aligning with the engineering requirement that smaller deviations result in higher scores.
The second-order sensitivity of σ n can be characterized as,
2 S b σ n 2 = 2 k d ( 1 2 k d σ n 2 ) S b
This indicates that when σ n > ( 2 k d ) 1 , the rating enters an accelerated decline phase.
(3)
Out-of-bounds penalty function
The definition of relative exceedance is,
ε i = | X i C | R 1
In the formula, ε i is the relative out-of-bounds quantity.
Construct penalty items as follows:
P f = e b ε max 2
In the formula: P f is the penalty term; b is the penalty coefficient; ε m a x is the maximum out-of-bounds quantity. When it is allowed to exceed the range by 50%, it will result in significant penalties. Solve for b = 9.21. The constant b = 9.21 is determined through a penalty function that penalizes deviations outside the acceptable bounds. The penalty coefficient ensures that deviations greater than 50% are heavily penalized, with the penalty function designed to be smooth for small deviations and more severe for larger deviations. The choice of b = 9.21 is calibrated based on grid requirements that specify a maximum allowable penalty of 10 points when the deviation exceeds 50%. This value is critical to ensuring that the penalty function behaves appropriately under different operational conditions and provides a balanced penalty for frequency regulation performance.
(4)
Comprehensive rating function
By combining the basic scoring function with the penalty function for crossing boundaries, the final function can be obtained,
S = max 0 , S b * P f = max 0 , 100 e ln ( 0.6 ) σ n 2 9.21 ε max 2
After verification, when ε m a x = 0, the left and right derivatives of the function are equal and both are 0, ensuring the smoothness of the function.
The basic process of frequency regulation performance evaluation includes:
(1)
Determine the optimal value for the variable to be evaluated, and define the evaluation interval range based on the characteristics of the variable;
(2)
Solve the comprehensive scoring function based on the optimal value and evaluation interval;
(3)
Find the score value corresponding to the current variable to be scored based on the obtained function, and comprehensively compare the scores of various parameters.

3. Multi-Objective Optimization of Frequency Regulation Performance of Heating Units Based on HO Algorithm

3.1. Multi-Objective Optimization of Frequency Regulation Dynamic Performance

According to the optimization requirements for frequency regulation performance of heating units, based on the initialization of the control parameter set Y , the upper layer optimizes the frequency regulation dynamic performance of the system.
(1)
Objective function
In order to objectively evaluate overshoot and adjustment time, the evaluation score of overshoots in the frequency modulation process is proposed as F J and the evaluation score of the adjustment time in the frequency modulation process is F t s , and the comprehensive score of the dynamic performance of frequency modulation is determined as F 1 It can be concluded that,
max F 1 = ω 1 F J + ω 2 F t s F J = max 0 , S b J ( σ J n ) · P f J ( ε J max ) F t s = max 0 , S b t s ( σ t s n ) · P f t s ( ε t s max )
In the formula: F J is the evaluation score of overshoot in the frequency modulation process; F t s is the evaluation score for the adjustment time of the frequency modulation process; ω 1 and ω 2 are corresponding weights; S b J and S b t s are the basic scoring stages of the scoring function; P f J and P f t s are the out-of-bounds penalty score segments of the scoring function; σ J n and σ t s n are the normalized standard deviation of overshoot during the frequency modulation process and the normalized standard deviation of adjustment time during the frequency modulation process, respectively; ε J m a x and ε t s m a x are the maximum overshoot and longest overshoot during the frequency modulation process, respectively.
(2)
Constraint conditions
  • (1)
    Frequency modulation rise time constraint
The time required for the system power to rise from the initial value to the target value, expressed as
T r T r max
In the formula: T r is the rise time of the system; T r m a x = 20 s is the maximum allowed rise time.
  • (2)
    Frequency modulation action time constraint
The system response speed constraint during frequency modulation action is expressed as
t r t r max
In the formula: t r is the time for the system to respond to frequency modulation actions; t r m a x = 5 s is the maximum action time allowed by the system.
  • (3)
    Upper and lower limit constraints on frequency modulation control parameters
The frequency modulation control parameters of the speed control system include: amplification factor k of speed deviation, PID proportional adjustment coefficient K p of the speed controller, and the time constant T c of the hydraulic servo motor, whose constraints are expressed as
k min k k max K p min K p K p max T c min T c T c max
In the formula: k m i n = 8 and k m a x = 30 are the upper and lower limits of the amplification factor of the speed deviation; K p m i n = 0.3 and K p m a x = 0.8 are the upper and lower limits of the PID proportional adjustment coefficient of the speed controller; T c m i n = 3 and T c m a x = 6 are the lower and upper limits of the time constant of the hydraulic engine.
The frequency modulation control parameters of the prime mover heating system include: high-pressure cylinder proportional coefficient F H P , steam turbine, steam volume time constant T c h , extraction butterfly valve PID proportional adjustment coefficient K p d v , extraction steam volume time constant T e , butterfly valve hydraulic motor time constant T d v , whose constraints are expressed as
F H P min F H P F H P max T c h min T c h T c h max K p d v min K p d v K p d v max T e min T e T e max T d v min T d v T d v max
In the formula: F H P m i n = 0.25 and F H P m a x = 0.4 are the upper and lower limits of the proportional coefficient of the high-pressure cylinder; T c h m i n =0.2 and T c h m a x = 0.5 are the upper and lower limits of the steam turbine steam volume time constant; K p d v m i n = 2 and K p d v m a x = 5 are the upper and lower limits of the PID proportional adjustment coefficient for the extraction butterfly valve; T e m i n = 6 and T e m a x = 12 are the upper and lower limits of the extraction volume time constant; T d v m i n = 3 and T d v m a x = 6 are the upper and lower limits of the time constant of the butterfly valve hydraulic servo motor.

3.2. Multi-Objective Optimization of Comprehensive Power Deviation

On the basis of the optimal control parameter set Y 1 output by the upper layer, the lower layer uses intelligent algorithms to optimize the comprehensive power deviation of the system. The specific method is as follows:
(1)
Objective function
According to the research on the comprehensive scoring scheme, in order to objectively evaluate the comprehensive power deviation situation, it is necessary to integrate the evaluation score F P of the power deviation value after frequency regulation and the evaluation score F P H of the deviation between the heating power output value and the set value into the comprehensive power deviation score F 2 . It can be concluded that,
max F 2 = θ 1 F P + θ 2 F P H F P = max 0 , S b P ( σ P n ) · P f P ( ε P max ) F P H = max 0 , S b P H ( σ P H n ) · P f P H ( ε P H max )
In the formula: F P is the evaluation score of power deviation value after primary frequency modulation; F P H is the evaluation score for the deviation between the output value of heating power and the set value; θ 1 and θ 2 are corresponding weights; S b P and S b P H are the basic scoring stages of the scoring function; P f P and P f P H are the out of bounds penalty score segments of the scoring function; H and h are the normalized standard deviation of the power deviation value after frequency modulation and the normalized standard deviation of the heating power output value from the set value, respectively; ε P m a x and ε P H m a x are, respectively, the maximum overshoot and longest overshoot during the frequency modulation process.
(2)
Constraint conditions
  • (1)
    Steady-state error constraint
Ensuring that the deviation between the actual power of the unit and the set value is within the allowable range is characterized by,
P ( t ) P s e t ( t ) e max
In the formula: P ( t ) is the actual output power; P s e t ( t ) is the set power; e m a x is the maximum allowable steady-state error
  • (2)
    Frequency deviation power constraint
Limiting the power deviation of the unit in response to frequency modulation commands can be characterized as
P ( t ) P ( t Δ t ) Δ P r e ( t ) Δ P max
In the formula: Δ P r e ( t ) is the change in frequency modulation demand power, and Δ t is the response time window; Δ P m a x is the maximum allowable deviation value for frequency modulation.
  • (3)
    Unit power constraint
Ensure that the output power of the unit is not lower than the lower limit of peak shaving depth, characterized as,
P ( t ) P min ( t )
In the formula, P m i n is the allowed minimum peak shaving depth.

3.3. Dual Layer Optimization Solution for Frequency Modulation Performance

Due to the simulation environment of the heating unit model, the optimization of the frequency regulation performance of the unit needs to converge as soon as possible and has high accuracy requirements. Select the Hippopotamus Optimization (HO) algorithm as the basis for optimizing the relevant control parameters of the unit [17].
The first stage of the HO algorithm (dynamic adjustment of group position) focuses on global search and covers a wide search space through group dynamics. In stage two (threat response mechanism), Lévy flight random disturbance is introduced to simulate the sudden change in predator position and prevent falling into local optima; Defined as the objective function and a factor f P j related to the distance of predators, the position of defensive behavior is as follows
X i , j D e f e n s e = r X j P + ( e m n cos ( 2 π q ) ) · ( 1 L ) , ( f P j < f i ) r X j P + ( e m n cos ( 2 π q ) ) · ( 1 2 × L + p 6 ) , ( f P j f i ) i = [ N 2 ] + 1 , [ N 2 ] + 2 , N , j = 1 , 2 , D
In Equation (20):   X j P is the location of the predator,   r is a random vector with a Levy distribution, used to simulate the sudden changes in the position of predators during the attack process;   p 6 is a random vector of 1*D; e is a uniform random variable within the interval of [2,4]; m is a uniform random variable within the interval of [1,1.5]; n is a uniform random variable within the interval of [2,3]; q is a uniform random variable within the interval of [−1,1]. During stage three (escaping predators), focus on local development and refine the search for the most promising areas currently available. The HO algorithm not only preserves the ecological logic of biological instinctual behavior but also achieves efficient solving of complex optimization problems through mathematical modeling, fully reflecting the unique advantages of heuristic algorithms.
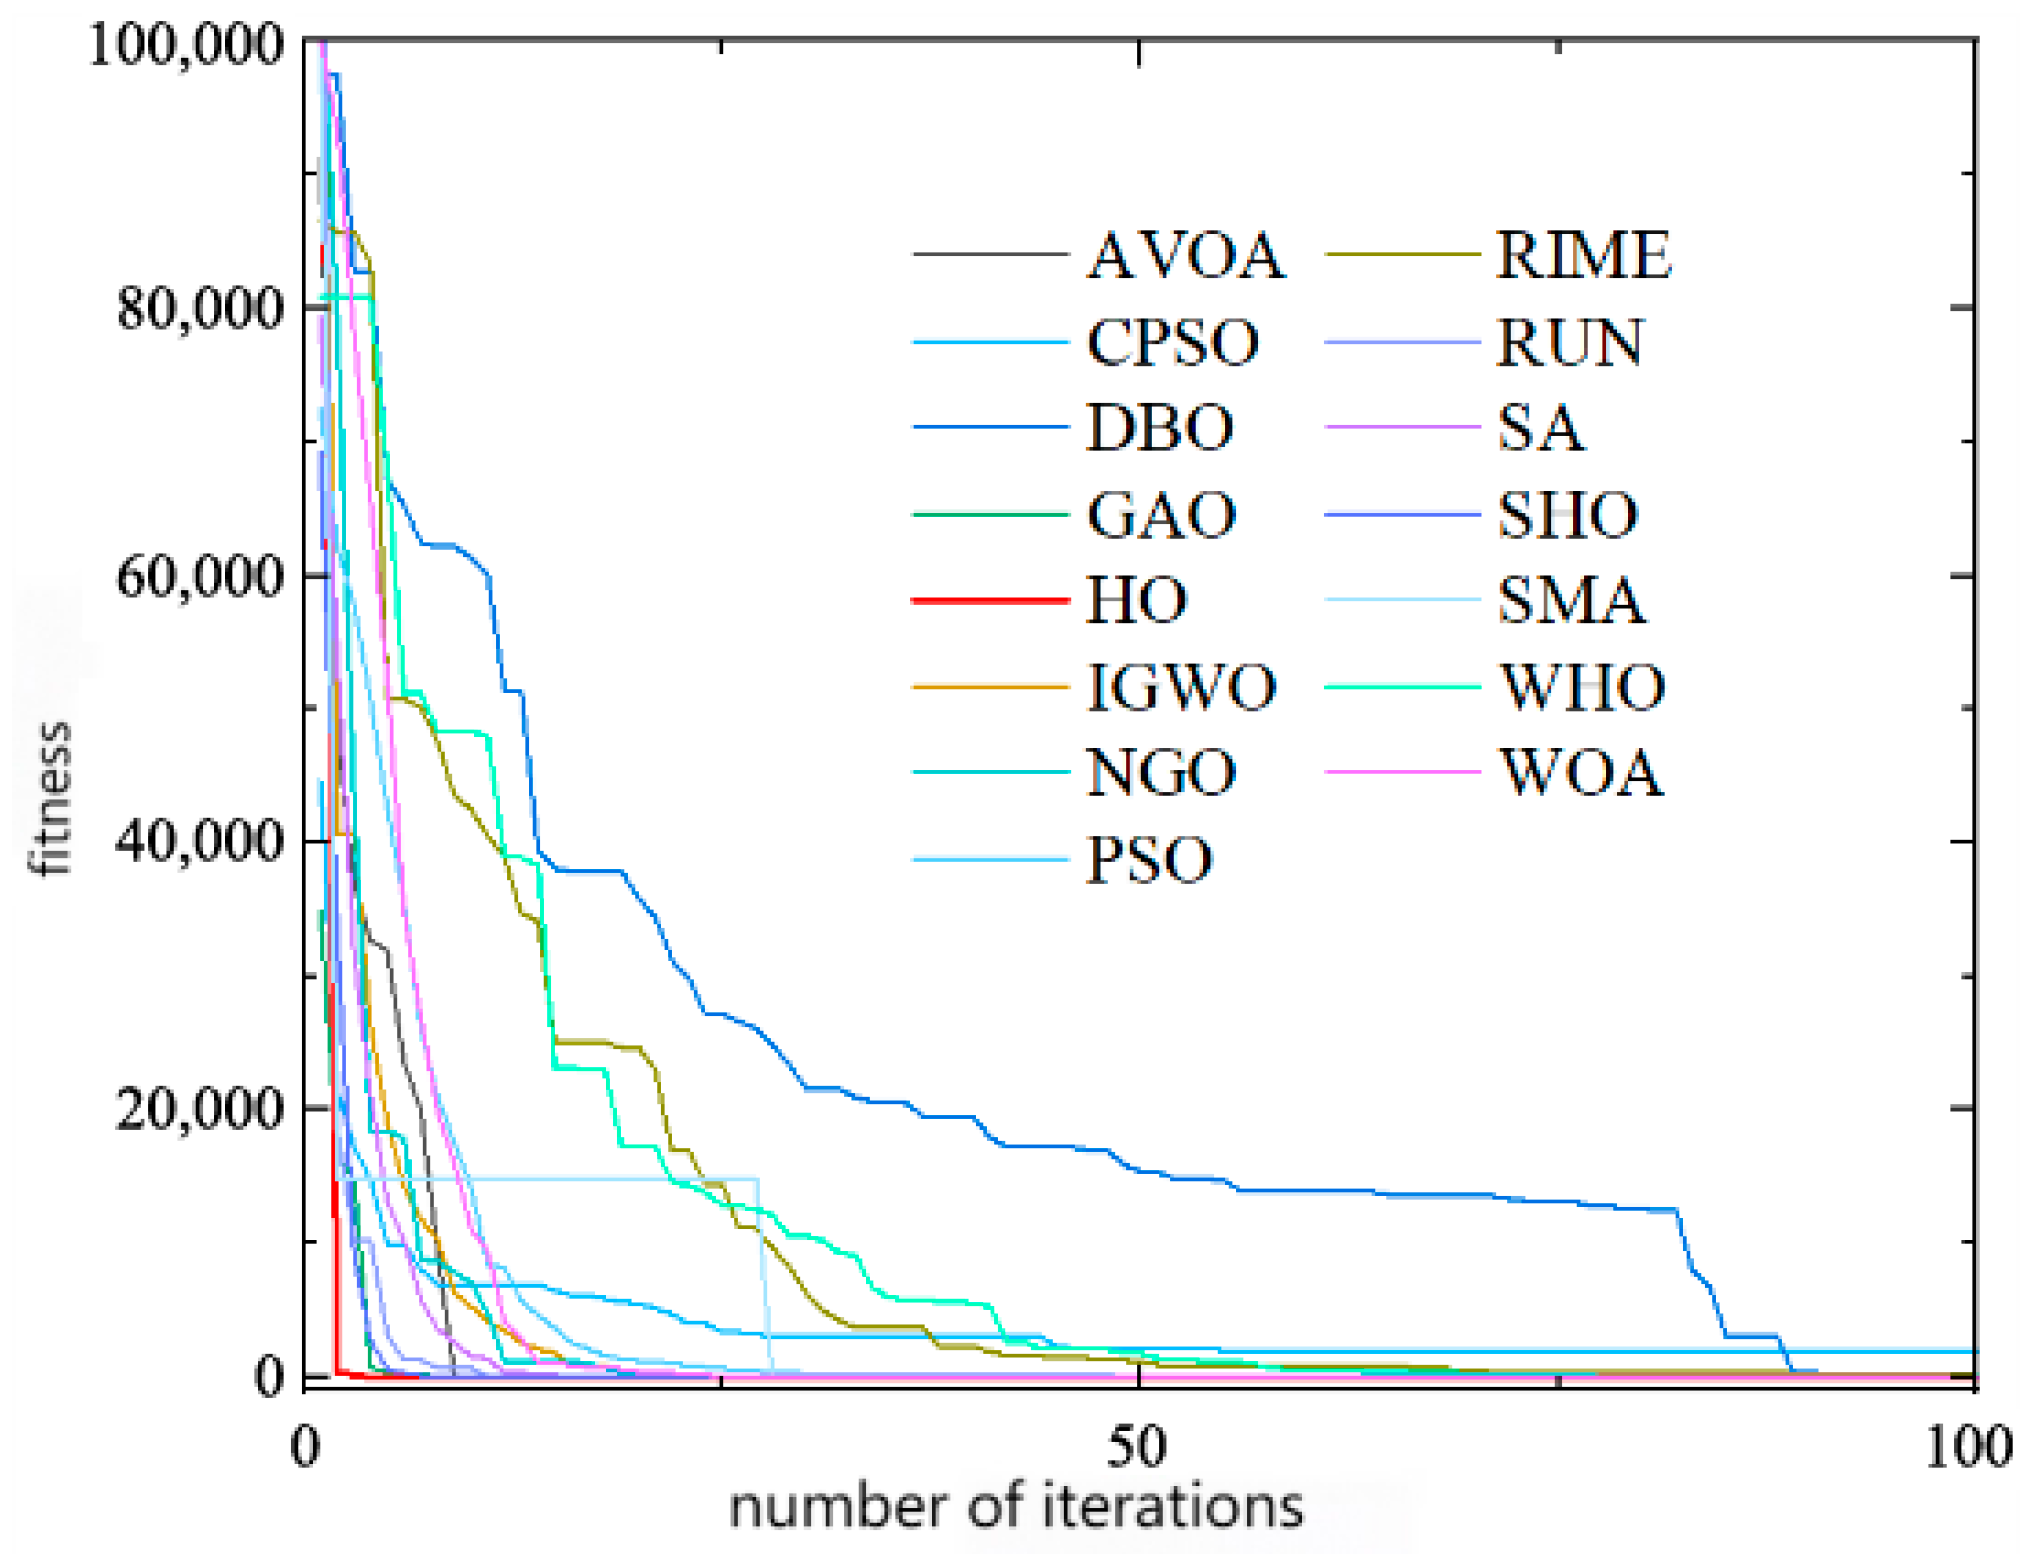
The HO algorithm has strong robustness in diversified benchmark tests and significantly outperforms algorithms such as WOA, GWO, and PSO in global convergence ability, maintaining efficient convergence in high-dimensional adaptability, overcoming the curse of dimensionality in high-dimensional spaces caused by algorithms such as PSO. For multimodal problems, the HO algorithm jumps out of local optima by dynamically adjusting the search direction. Analyzing and comparing the convergence of the HO algorithm with other major algorithms, as shown in Figure 3.
It can be clearly seen from Figure 3 that the HO algorithm has a good convergence effect for complex objective functions, which can meet the optimization requirements of unit frequency regulation performance. The HO algorithm outperforms other algorithms in global convergence, especially in the optimization of 8-dimensional control parameters in this paper. Its high-dimensional adaptability is significantly better than PSO and GA, and its multimodal processing ability (avoiding local optima) is better than NSGA-II [18]. With fewer tuning parameters, the difficulty of project implementation is low, making it more suitable for the dual-layer optimization requirements of heating unit frequency regulation performance.
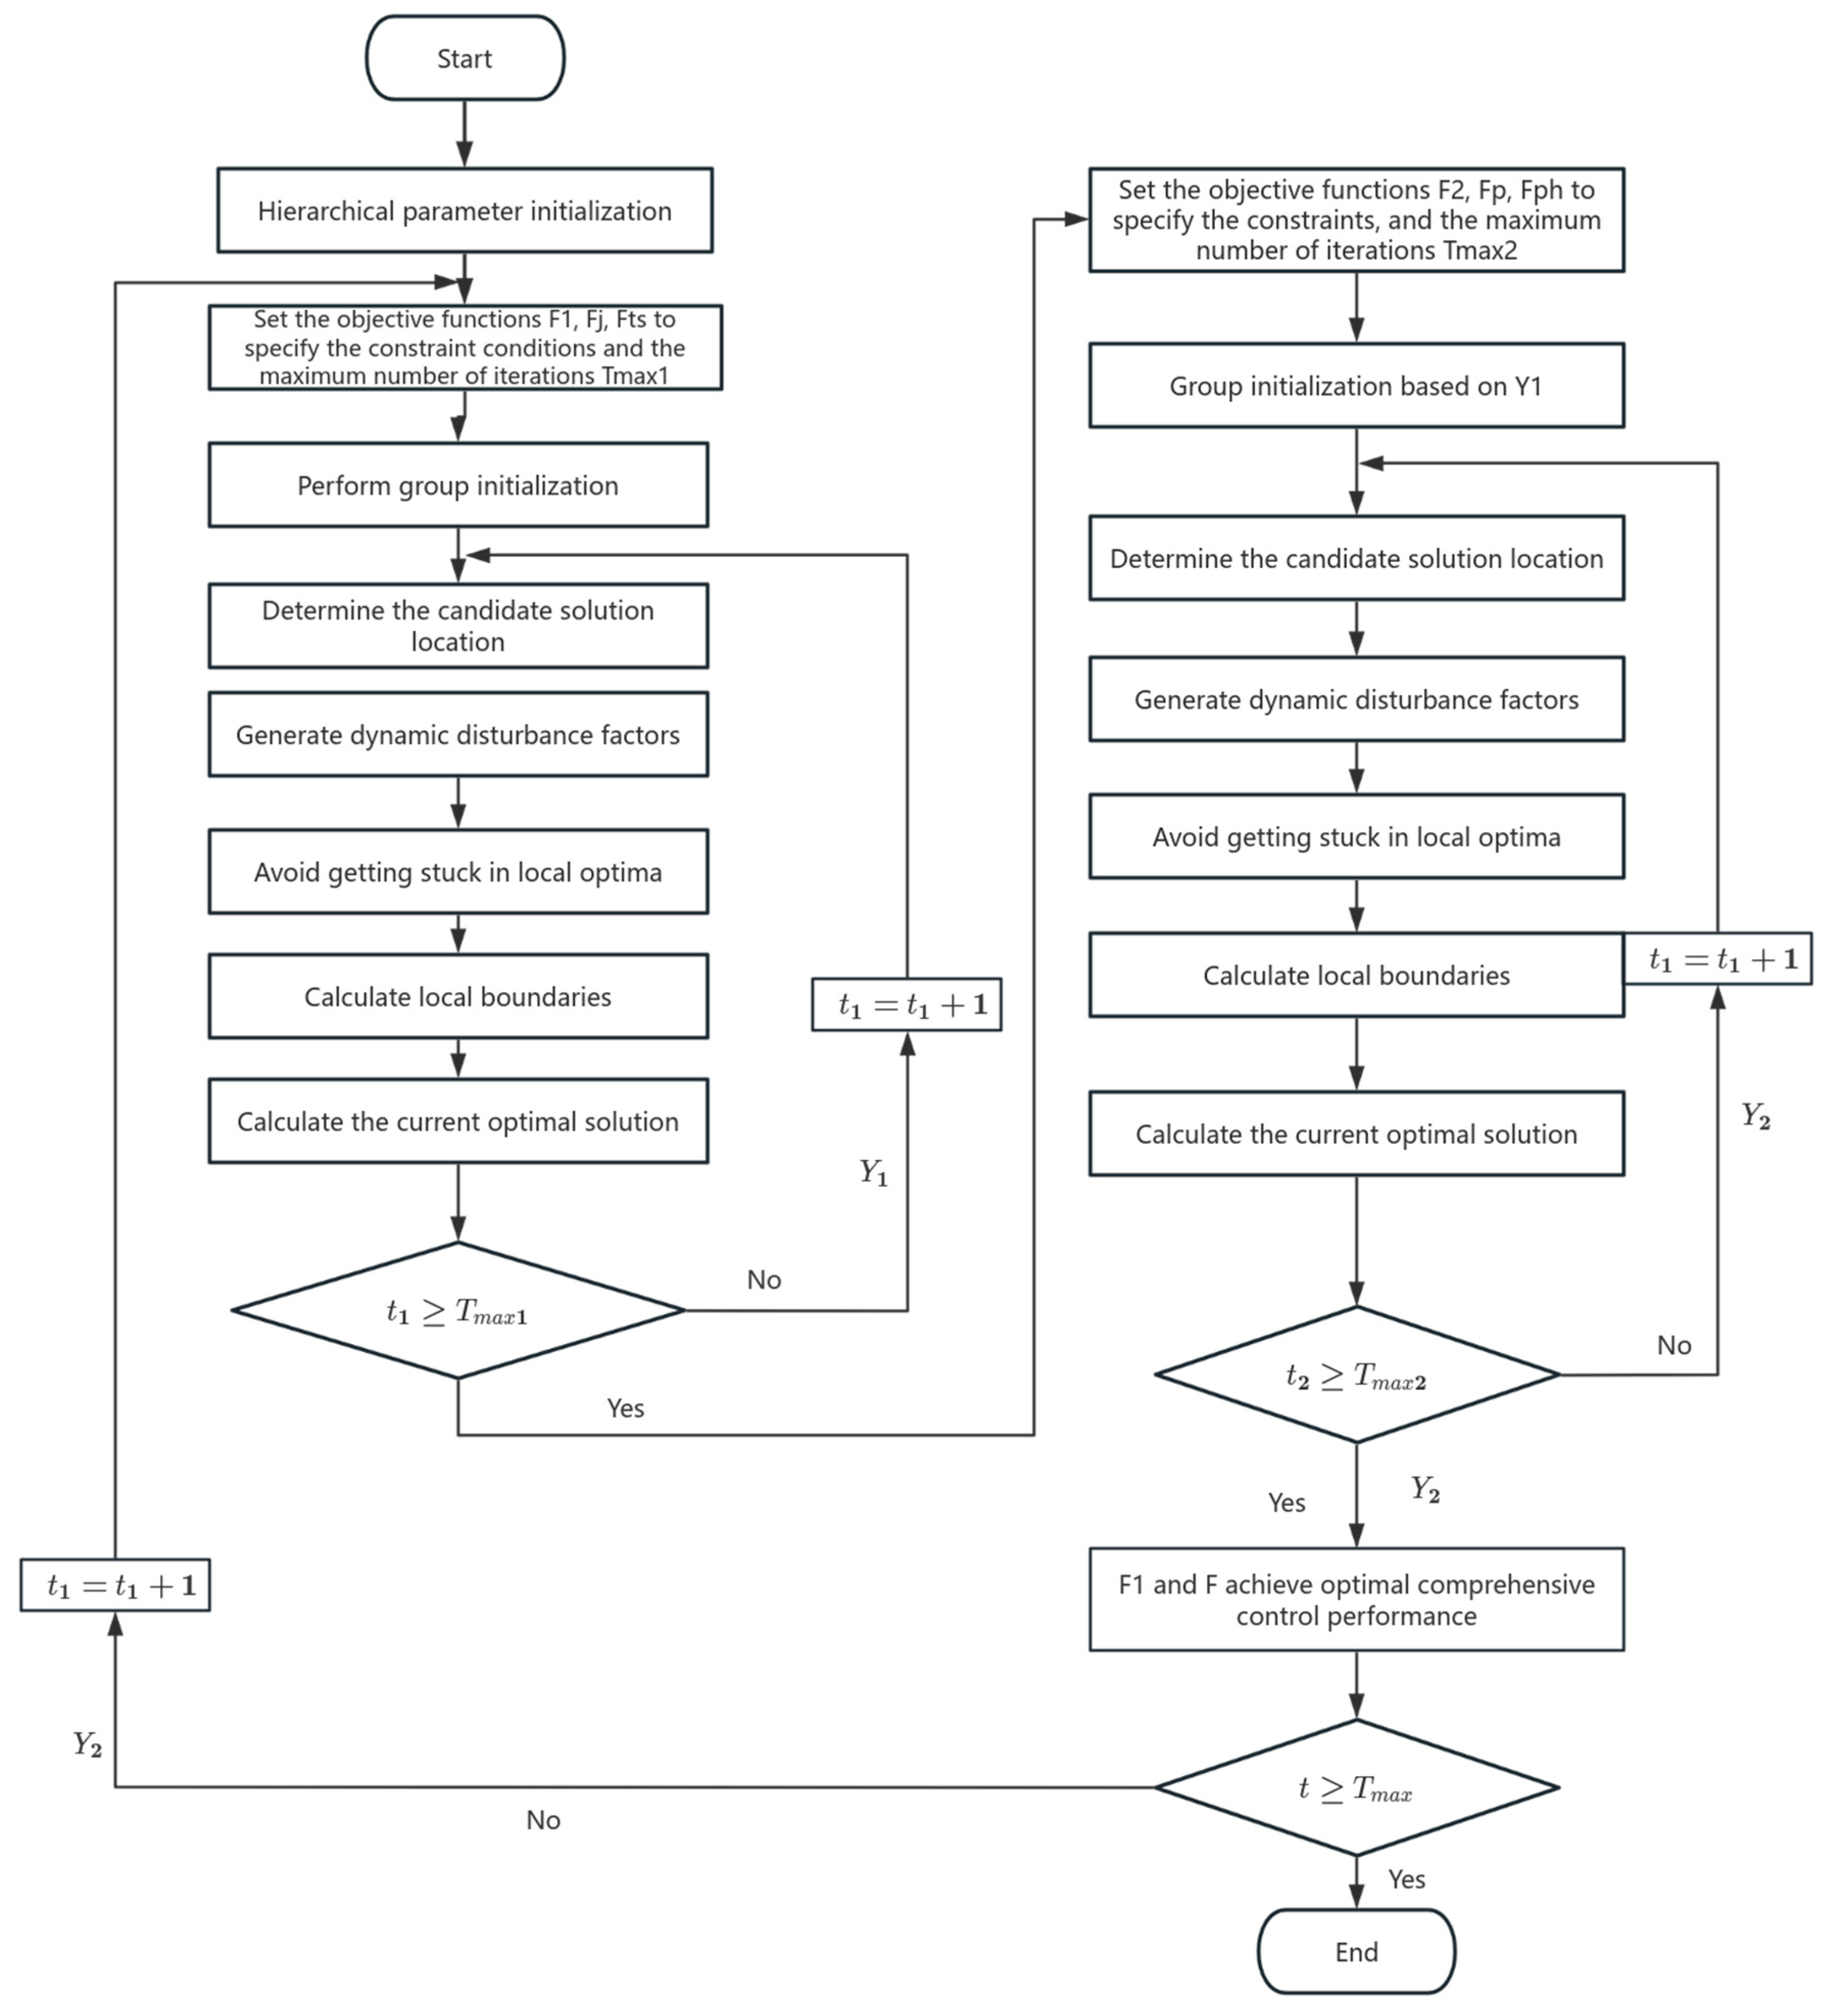
After determining the optimization objective functions and constraints for the upper and lower layers, the optimization process is as follows.
(1)
Upper-level optimization process
On the basis of determining the optimization objectives of the overshoot evaluation score F J and the adjustment time evaluation score F t s in the frequency modulation process, the dynamic performance optimization process of the unit frequency modulation is as follows:
(1)
Set objective functions F J , F t s , and F 1 , specify constraints and maximum iteration times;
(2)
Perform group initialization and determine candidate solution positions;
(3)
Generate disturbance factors to avoid getting stuck in local optima;
(4)
Calculate the local boundary to obtain the current optimal solution, output the optimal control parameter set Y 1 , and return to continue optimization when the number of solving iterations is less than the maximum number of iterations.
(2)
On the basis of the optimal control parameter set Y 1 outputted by the upper layer, the optimization process of the lower layer is as follows:
(1)
Set objective functions F P , F P H and F 2 , specify constraints and maximum iteration times;
(2)
Perform group initialization based on Y 1 and determine candidate solution positions;
(3)
Generate disturbance factors to avoid getting stuck in local optima;
Calculate the local boundary to obtain the current optimal solution. If it is less than the maximum number of iterations, return to continue the optimization process.
By integrating the optimization processes of the upper and lower layers, as well as the dual layer optimization scheme, the optimization process for the frequency regulation performance of deep peak shaving heating units can be obtained, as shown in Figure 4.

4. Example Analysis

4.1. Example Introduction

Based on the above theoretical analysis and technical principles, the N300-16.7/38/538-9 steam turbine and its regulating system of a heating unit in Guangxi are taken as the research object to optimize its frequency regulation dynamic performance. The structural configuration of the steam turbine body is as follows: one high-pressure main steam valve and one intermediate-pressure combined steam valve are installed on each side. Among them, the high-pressure regulating valve hydraulic servo motor, the right high-pressure main steam valve hydraulic servo motor, and the medium-pressure regulating valve hydraulic servo motor all use continuous hydraulic actuators, which can achieve precise valve opening control. The main technical parameters of the unit are as follows: the rated power is 300 MW, and the maximum continuous output can reach 312 MW. The supporting generator model is QFSN-303-2-20D, with rated parameters of frequency 50 Hz, speed 3000 r/min, active power of 300 MW, and corresponding voltage level of 22 kV. The regulating system adopts XDPS-400+distributed control system, which has functions such as multivariable coordinated control, fast load response, and optimized operating parameters.

4.2. Upper-Level Optimization Analysis

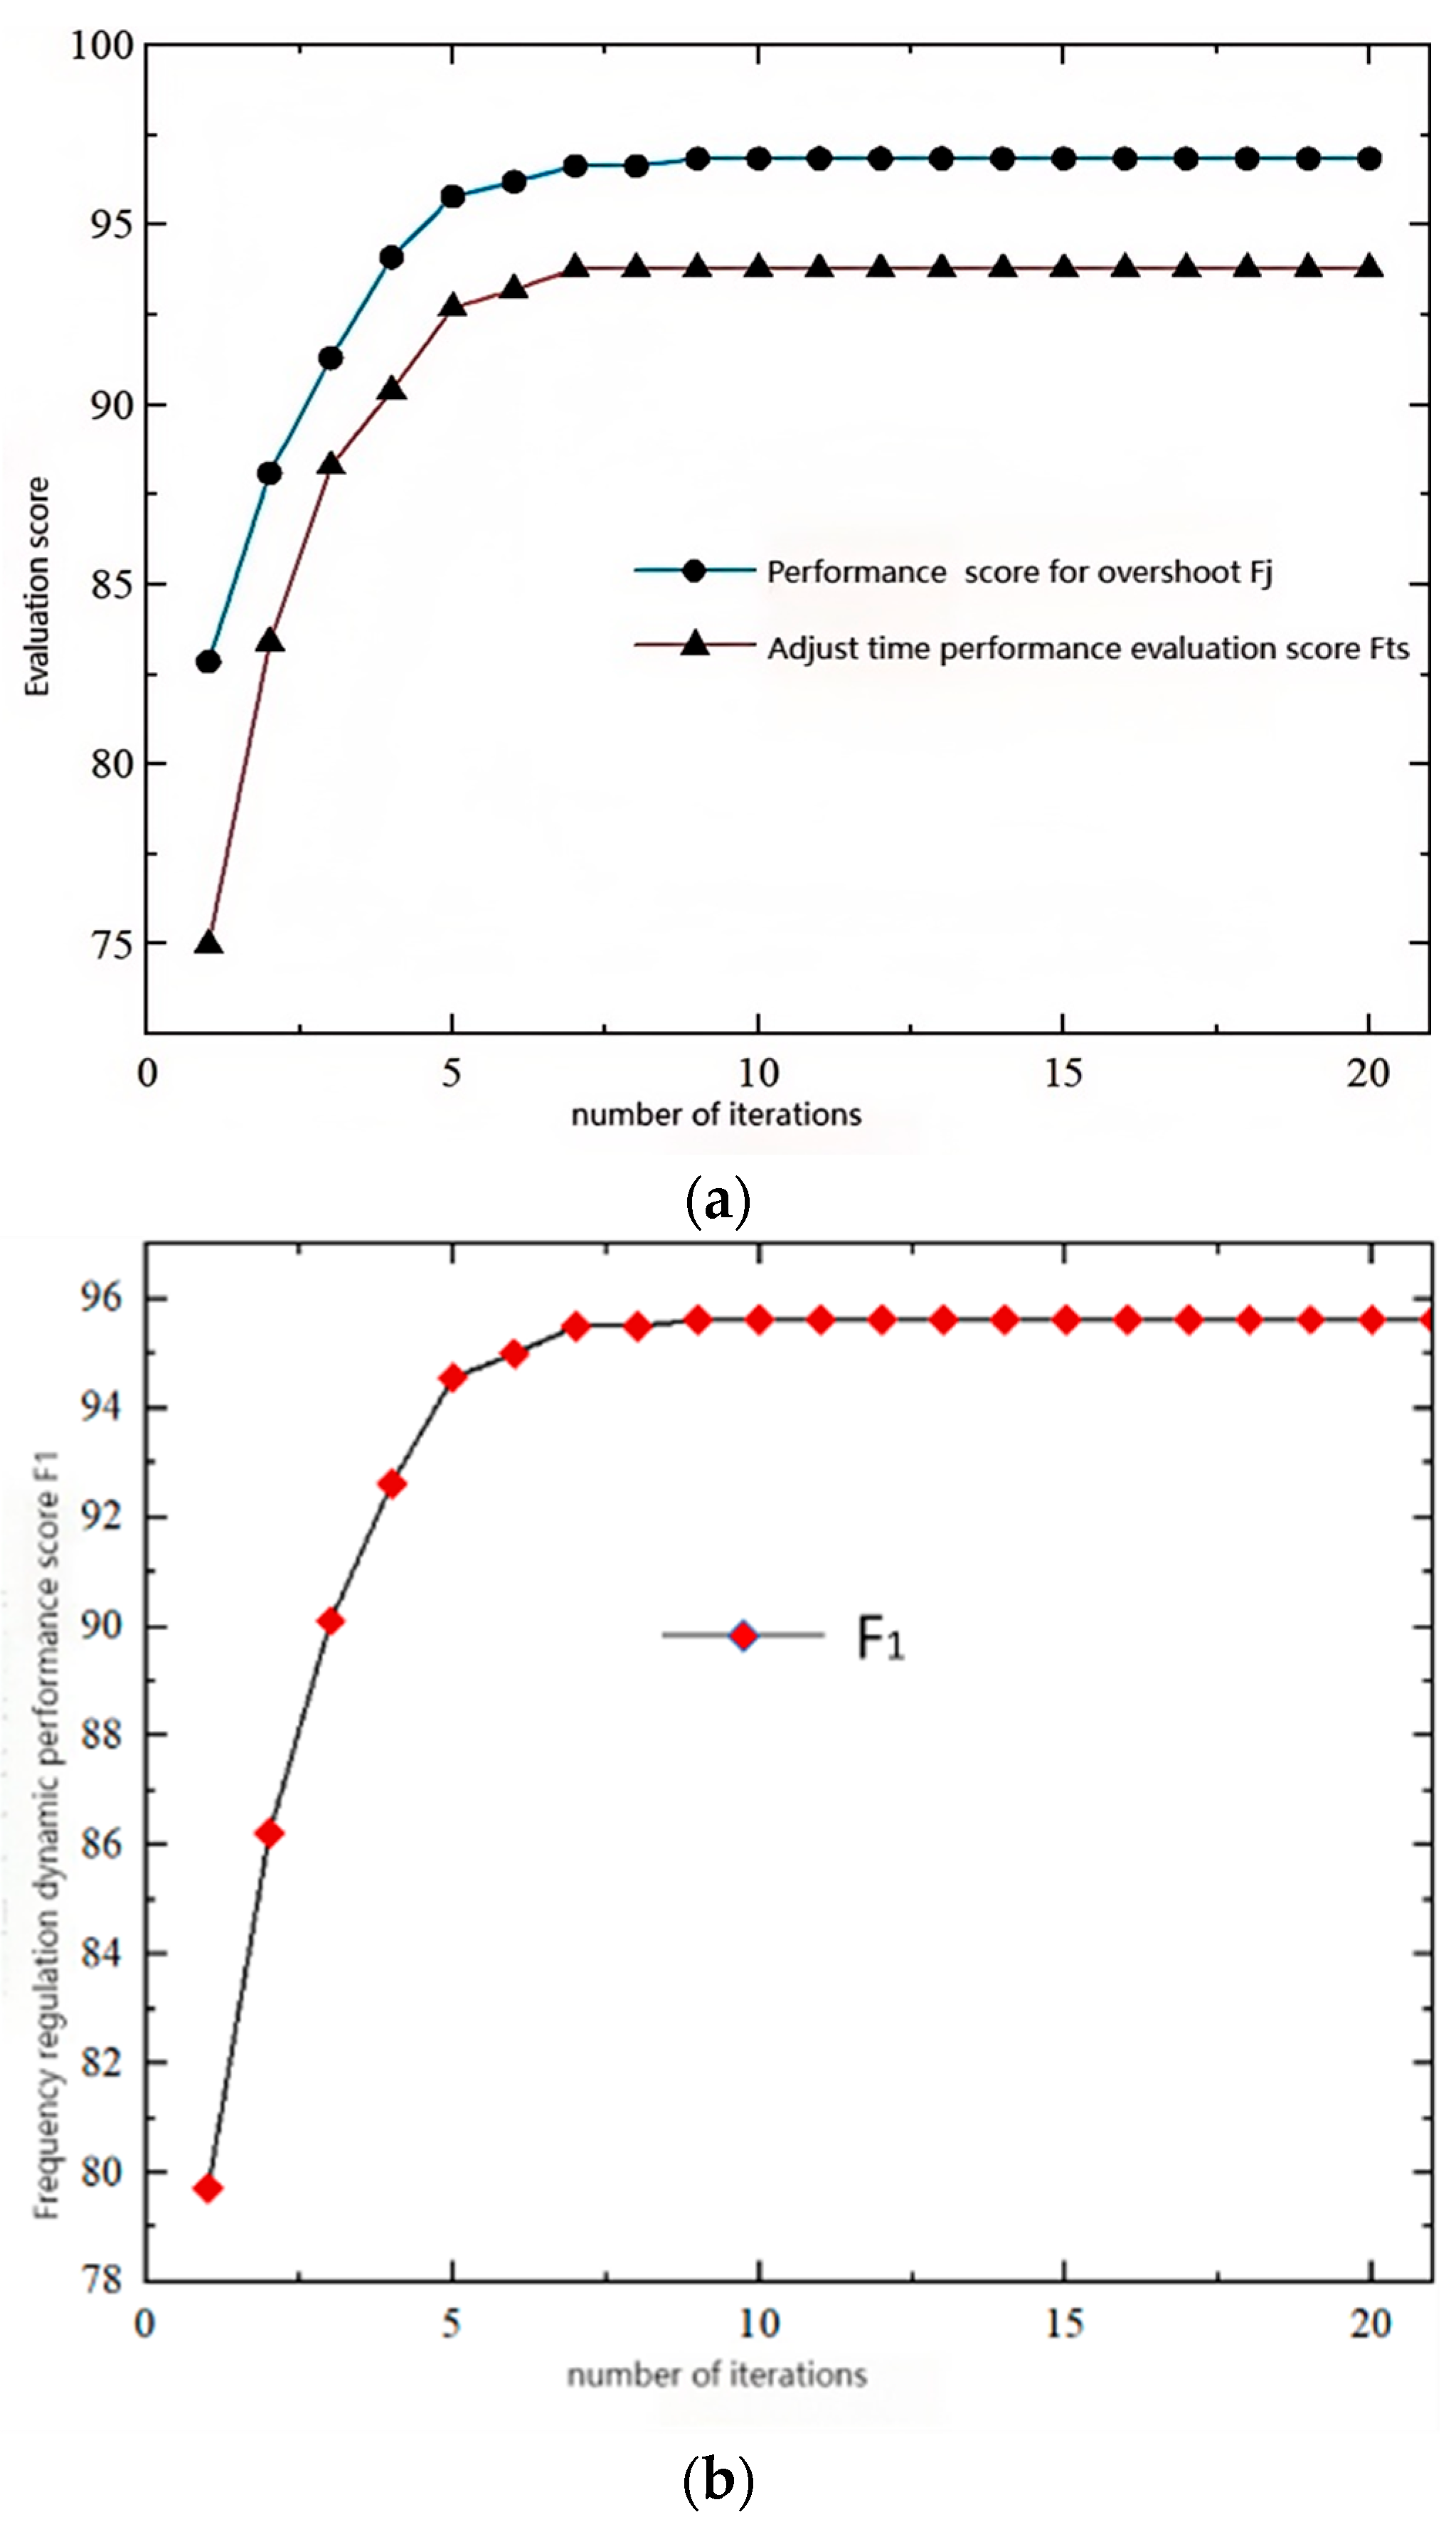
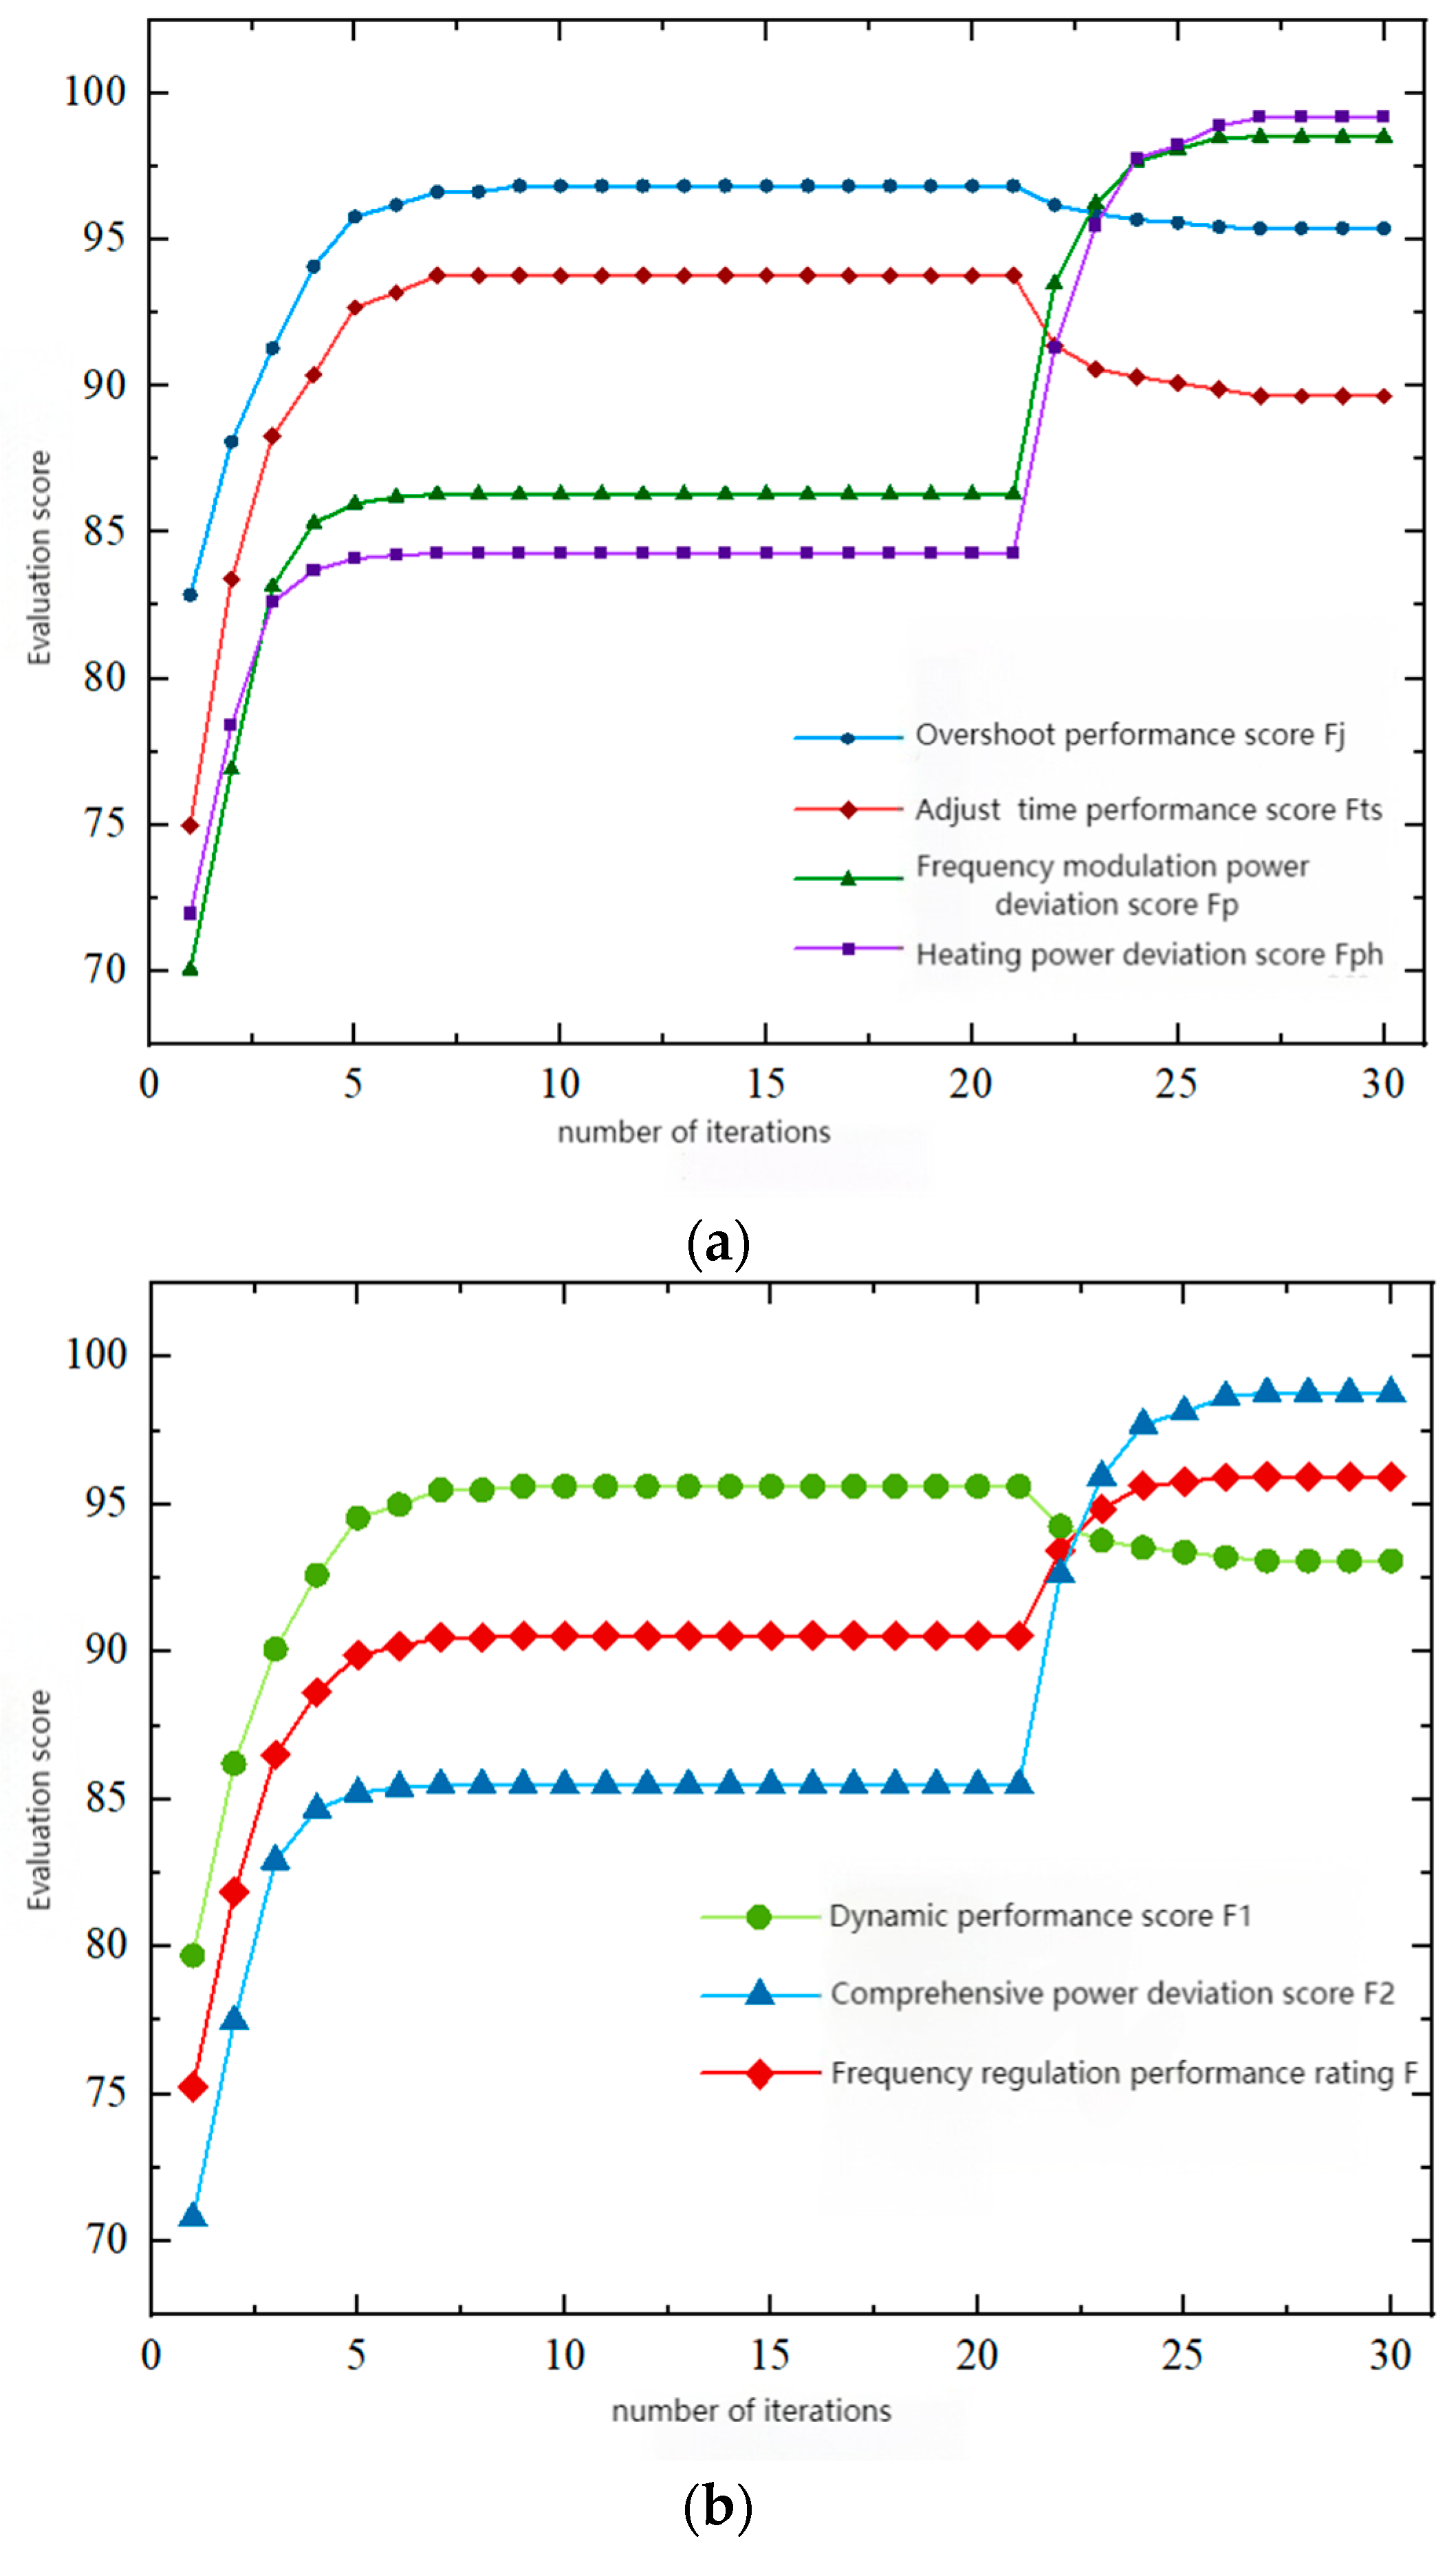
At a set operating condition value of 0.35 (p.u.) and a reference value of 300 MW, the device heats and extracts steam during the simulation time of t = 100 s. At simulation time t = 200 s, the frequency reference step size changes from 3000 r/min to 3011 r/min. At the input end of the speed control system, a step disturbance with a unit value of Δ ω 1 = 11 ÷ 3000 = 0.0036 is set. The maximum number of iterations for upper-level optimization is set to 20. During the optimization process, the overshoot evaluation score F J and tuning time evaluation score F t s obtained from each iteration of the frequency modulation process are recorded as shown in Figure 5.
From Figure 5, it can be seen that in the initial condition without optimization, the overshoot performance score of the unit is 82.86, the regulation time performance score is 74.98, and the frequency modulation dynamic performance score is 79.71. As the number of iterations increases, the scores show a rapid growth trend at first, and then slowly approach the current optimal trend. When the number of iterations is 7, the iteration process tends to stabilize, and the overshoot performance score of the unit is 96.85, the adjustment time performance score is 93.78, and the frequency modulation dynamic performance score is calculated to be 95.62. In terms of overshoot performance, it has been optimized by 16.9%, adjustment time performance by 25.1%, and frequency modulation dynamic performance by 19.9%.
Based on the current optimal evaluation score obtained after 7 iterations, the corresponding current optimal control parameter set Y 1 in the upper layer, optimization can be further obtained as shown in Table 1.
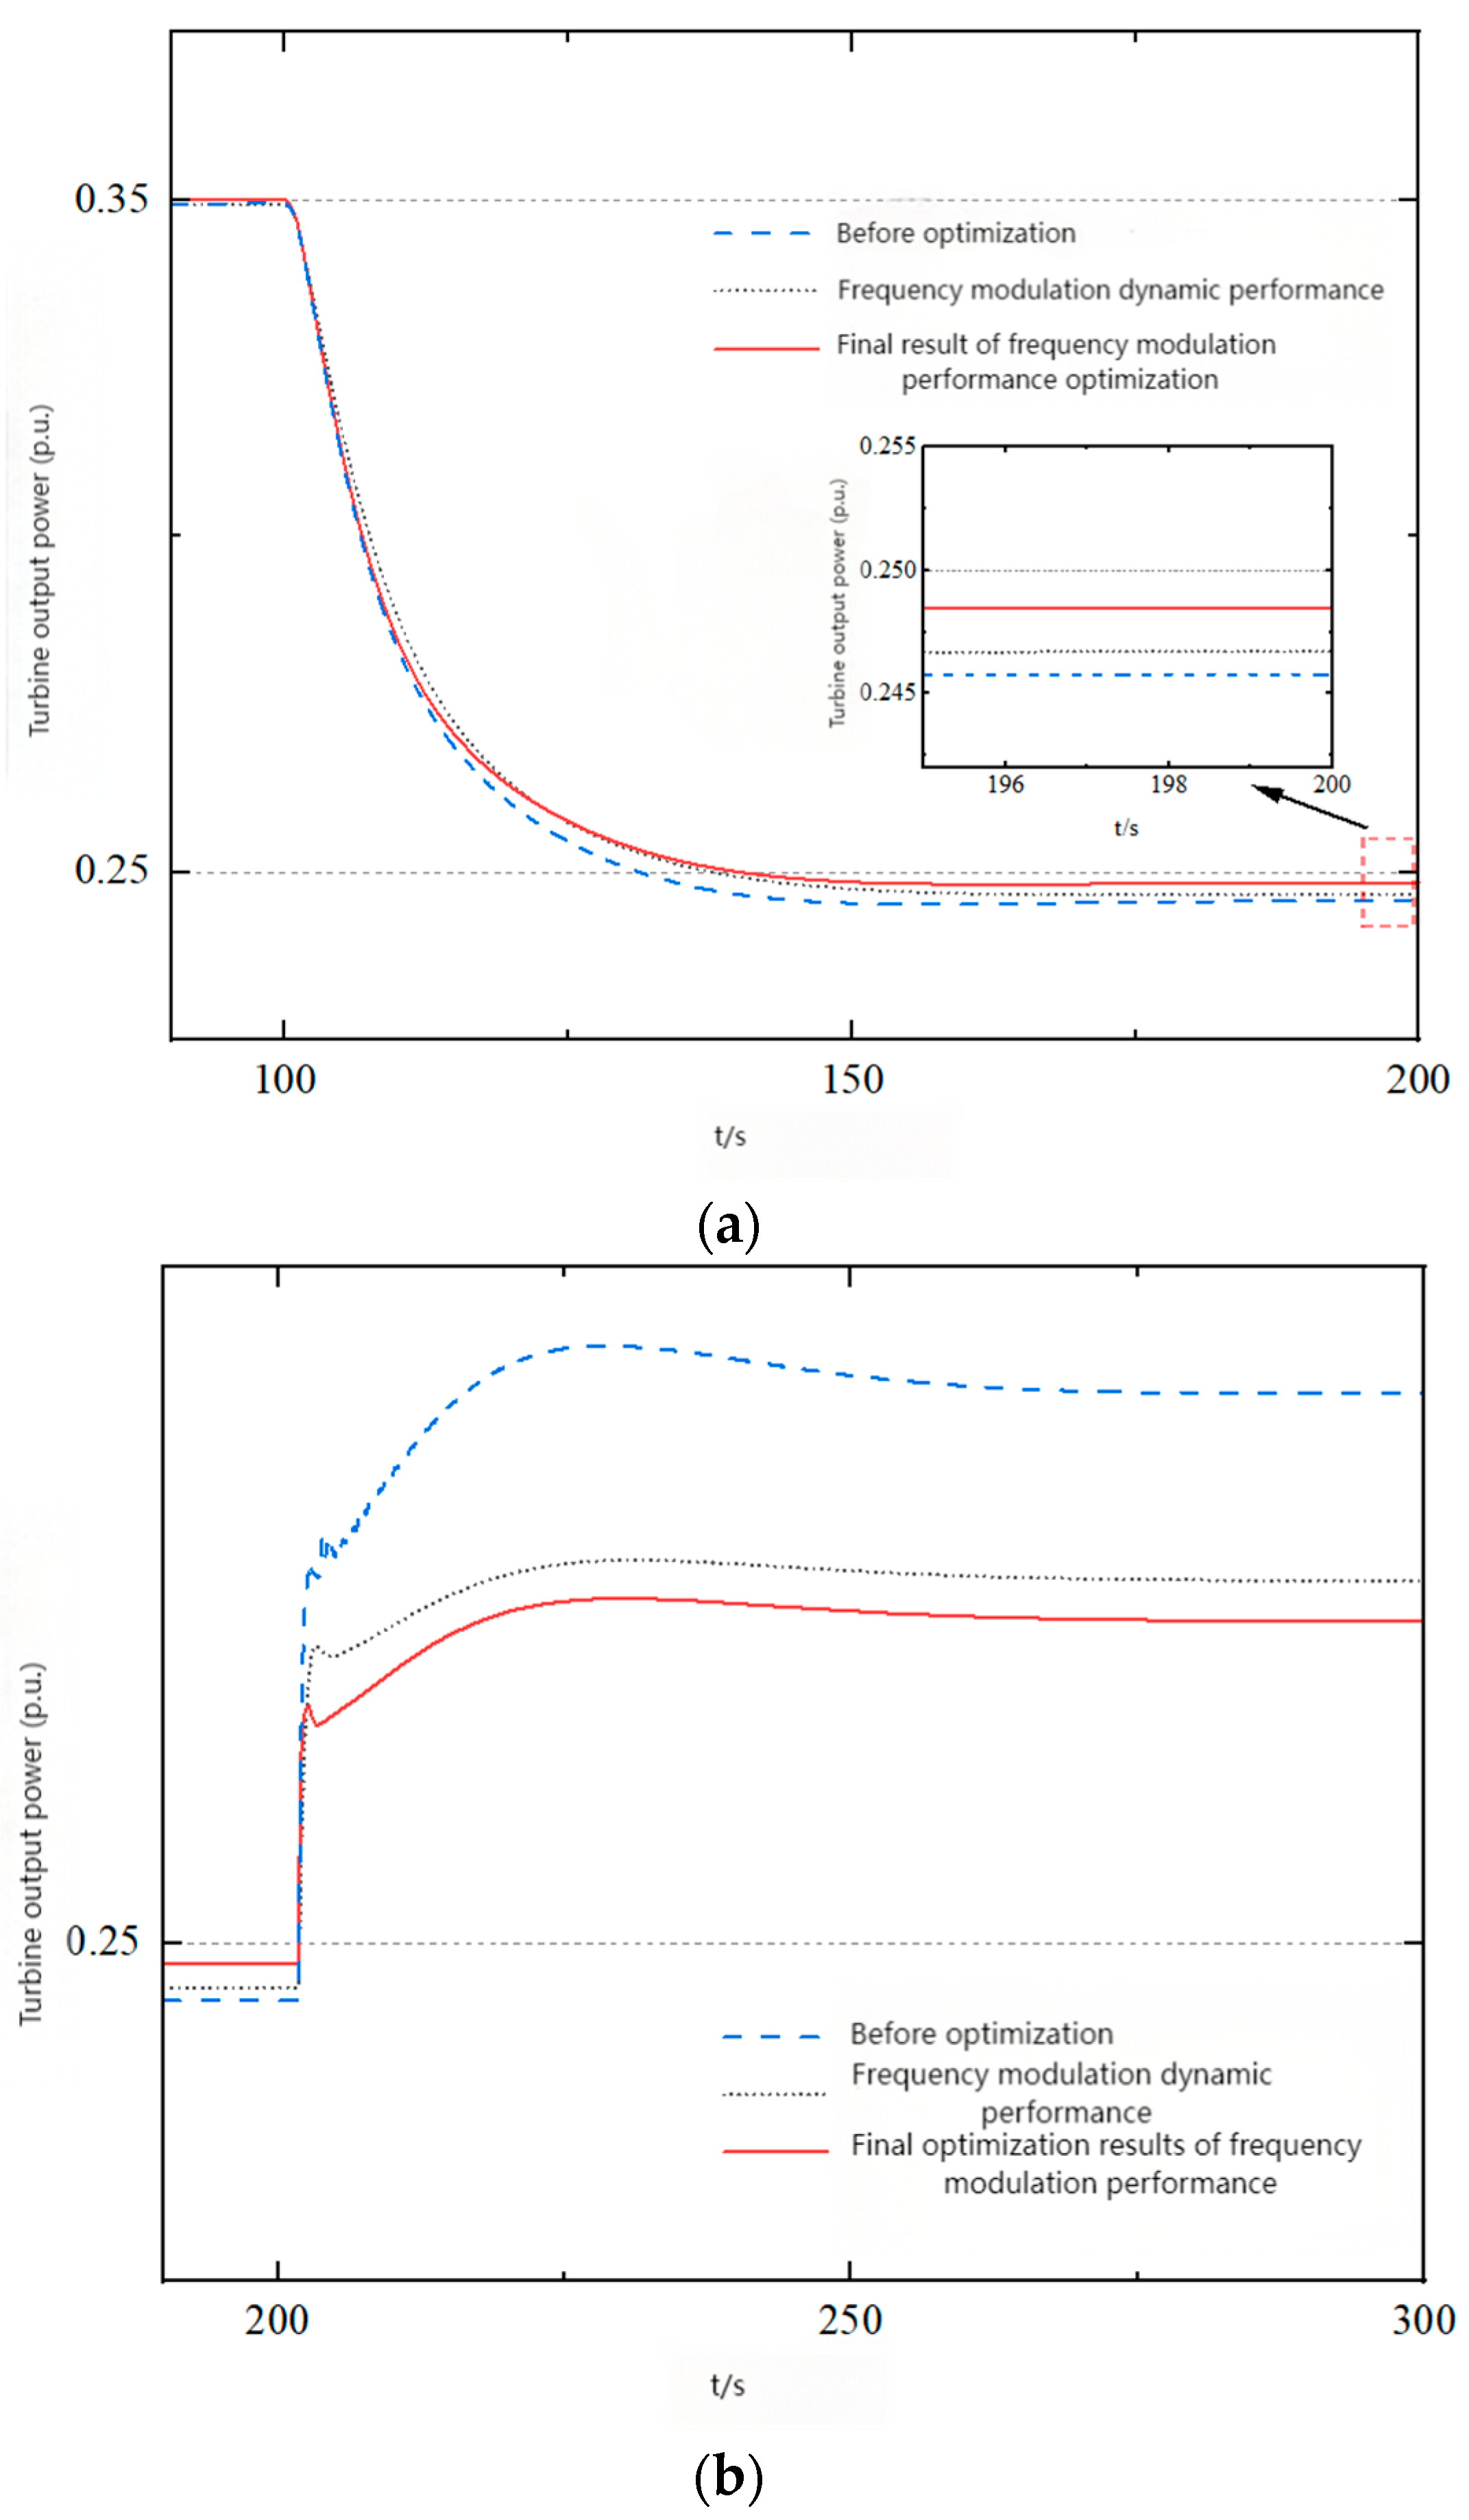
Based on the upper-level optimization of the optimal control parameter set Y 1 , the output results of the deep peak shaving heating unit are shown in Figure 6. According to the information in the figure, the overshoot after upper layer optimization is 0.55%, the adjustment time is 77 s, the heating power deviation is 0.0033 (p.u.), and the frequency modulation power deviation is 0.02833 (p.u.). Based on the comparison of the optimization results of the upper layer during the heating process of the unit, it can be concluded that the power curve and heating power deviation of the turbine output after the heating process optimization have been slightly optimized, which is reflected in slightly reducing the adjustment time, overshoot, and heating power deviation; The main optimization part occurred during a frequency modulation process at t = 200 s. Compared with before optimization, the overshoot and adjustment time were significantly reduced, which is in line with the optimization strength of overshoot performance, adjustment time performance, and frequency modulation dynamic performance.

4.3. Analysis of Multi-Objective Optimization Results for Comprehensive Power Deviation and Frequency Modulation Performance

The optimal control parameter set obtained from upper-level optimization is used as Y 1 premise for optimizing the comprehensive power deviation of the unit. The frequency modulation power deviation and heating power deviation will be further optimized. The overall evaluation results of the optimization process vary with the number of iterations, and the maximum number of iterations for the entire optimization process is set at 30, which means that the lower level can be iterated up to 10 times, as shown in Figure 7. When the number of iterations reached 20 in the upper layer, due to the optimization process in the upper layer, a portion of the comprehensive power deviation score was also improved, resulting in an increase in the frequency modulation power deviation score from 70.05 when it was not optimized to 86.31, and the heating power deviation score from 71.95 when it was not optimized to 84.28. At this point, the lower layer optimization was entered. Due to the main objective of optimization being comprehensive power deviation, the frequency modulation power deviation score has increased from 86.31 to 98.53, with an optimization intensity of 14.2%; The deviation score of heating power has increased from 84.28 to 99.19, with an optimization intensity of 17.7%; The comprehensive power deviation score has increased from 85.49 to 98.79, with a comprehensive optimization intensity of 15.5%. However, the dynamic performance of frequency modulation will be affected, and the rating will experience a certain degree of attenuation. The overshoot dynamic performance score will decrease from 96.85 to 95.4, the tuning time performance score will decrease from 93.78 to 89.66, and the frequency modulation dynamic performance score will decrease from 95.62 to 93.10. The overall decrease is 2.6%, and the reduced performance is within an acceptable range. For the entire optimization process, the frequency regulation performance score of the unit can be calculated as a function of the number of iterations. From the initial score of 75.26 without optimization, to the score of 90.56 obtained by upper-level optimization, and then to the score of 95.95 obtained by lower-level optimization, the comprehensive optimization strength of the entire process reaches 27.5%.
Based on the current optimal evaluation score obtained after 26 iterations, the corresponding current optimal control parameter set Y 2 in the overall optimization, further improvements can be obtained as shown in Table 2.
By comparing the corresponding control parameters in Table 1 with the actual working conditions of the unit, the unit can adjust according to the values of the control parameter set Y 2 . Based on the optimal control parameter set Y 2 , the output results of the deep peak shaving heating unit are shown in Figure 8.
In Figure 8, the optimized overshoot is 0.59%, the adjustment time is 83 s, the heating power deviation is 0.0015 (p.u.), and the frequency modulation power deviation is 0.0255 (p.u.). After optimization, the deviation of heating power has significantly decreased compared to before optimization and after upper-level optimization. The deviation of frequency modulation power after the primary frequency regulation process has significantly decreased compared to before optimization and after upper-level optimization. However, compared to the results of upper-level optimization, the overshoot and adjustment time have slightly increased. Compared with that before optimization, the dynamic performance is significantly improved, and the comprehensive power deviation is significantly reduced, which is in line with the situation that the optimization strength of the whole process reaches 27.5%.

5. Conclusions

Aiming at the multi-objective optimization problem of frequency regulation performance under deep peak shaving of heating units, a multi-objective frequency regulation performance optimization method based on a double-layer optimization framework is proposed, which achieves a balance between dynamic response and steady-state accuracy, and the effectiveness of the method is verified by simulation. And the following conclusions were drawn:
(1)
The comprehensive quantification method for frequency regulation performance developed eliminates the influence of dimensionality in the system, and combines the dynamic characteristics of heating units under deep peak shaving conditions to develop a layered optimization strategy, achieving coordinated optimization of dynamic response and steady-state accuracy.
(2)
The optimization of the upper-level frequency modulation dynamic performance has improved the overshoot score and adjustment time score; The comprehensive power deviation optimization at the lower level has improved the frequency modulation power deviation score and heating power deviation score.
(3)
The frequency regulation performance score of the example heating unit has been improved by 27.5%, which has good engineering application value. Before the power deviation optimization, the frequency modulation power deviation is 8.5 MW, after the optimization, it is 7.65 MW, reducing 0.85 MW, meeting the grid regulation of “frequency modulation power deviation ≤ 8 MW”; The deviation of heating power before optimization is 0.99 MW, and after optimization it is 0.45 MW, a decrease of 0.54 MW, which meets the demand of industrial users with a heating deviation of ≤1 MW, which has good engineering application value.

Author Contributions

Conceptualization, L.W. and H.H.; methodology, J.X. and L.X.; formal analysis, L.W., H.H. and L.X.; writing—original draft preparation, L.W., H.H., J.X. and L.X. All authors have read and agreed to the published version of the manuscript.

Funding

This research was funded by Science and Technology Project of Guangxi Power Grid Co., Ltd. (No. GXKJXM20230090).

Data Availability Statement

The original contributions presented in this study are included in the article. Further inquiries can be directed to the corresponding author.

Conflicts of Interest

Authors Libin Wen, Hong Hu, and Jinji Xi were employed by Electric Power Research Institute of Guangxi Power Grid Co., Ltd. Author Libin Wen and Jinji Xi were employed by Guangxi Key Laboratory of Intelligent. Control and Maintenance of Power Equipment. Author Hong Hu was employed by the School of Electrical Engineering and Automation, Wuhan University. Li Xiong was employed by Power Dispatching and Control Center, Guangxi Power Grid Co., Ltd. All of the authors declare that the research was conducted in the absence of any commercial or financial relationships that could be construed as a potential conflict of interest.

References

  1. Shu, Y.B. Creating a first-class academic journal, forging new quality productive forces and building a new-type energy system. Energy Internet 2024, 1, 1–2. [Google Scholar] [CrossRef]
  2. Li, D.D.; Sun, Y.R.; Xu, B.; Zhang, J.L.; Liu, Q. Minimum inertia and primary frequency capacity assessment for a new energy high permeability power system considering frequency stability. Power Syst. Prot. Control 2021, 49, 54–61. [Google Scholar] [CrossRef]
  3. Yang, L.; Cao, X.; Zhou, Y.; Lin, Z.; Zhou, J.; Guan, X.; Wu, Q. Frequency-Constrained Coordinated Scheduling for Asynchronous AC Systems under Uncertainty via Distributional Robustness. IEEE Trans. Netw. Sci. Eng. 2025. [Google Scholar] [CrossRef]
  4. Zhang, X.K.; Wang, Z.J.; Xia, D.W.; Wang, J.G.; Hu, H.Z. New Modeling for Primary Frequency Regulation Capability of Thermal Power Units Under Deep Peak Regulation. Power Syst. Technol. 2022, 46, 4947–4954. [Google Scholar] [CrossRef]
  5. Sheng, K. Refined modeling of primary frequency regulation power response characteristics for thermal power units. Electr. Power 2021, 54, 111–118. [Google Scholar] [CrossRef]
  6. Deng, T.Y.; Tian, L.; Liu, J.Z. Control method for improving frequency and peak regulation capabilities of heating units using heat network energy storage. Proc. CSEE (Chin. Soc. Electr. Eng.) 2015, 35, 3626–3633. [Google Scholar] [CrossRef]
  7. Wang, R.Y. Modeling and Performance Improvement of Primary Frequency Regulation System for Thermal Power Units Based on Particle Swarm Optimization Identification. Master’s Thesis, Shandong University, Jinan, China, 2020. [Google Scholar] [CrossRef]
  8. Liu, Z.Z. Performance Analysis and Improvement of Primary Frequency Regulation for Coal-Fired Power Units. Master’s Thesis, Shandong University, Jinan, China, 2024. [Google Scholar] [CrossRef]
  9. Shen, Y.Y. Primary frequency regulation strategy for thermal power units based on frequency division and adaptive dead zone control. Sci. Technol. Eng. 2023, 23, 15498–15505. [Google Scholar] [CrossRef]
  10. Chang, D.F.; Wang, W.; Jiang, H.; Wang, Q.; Fu, Y.W.; Gao, L.; Liu, H. Multi-variable coordinated optimization of primary frequency regulation for 1000MW units. Therm. Power Gener. 2018, 47, 123–128. [Google Scholar] [CrossRef]
  11. Deng, X.; Sun, W.; Xiao, H.W. Comprehensive control method for energy storage batteries participating in primary frequency regulation. High Volt. Eng. 2018, 44, 1157–1165. [Google Scholar] [CrossRef]
  12. Liu, B.L.; Xu, X.W. Optimal setting of generator excitation system droop coefficient based on power grid operation dataset. Power Syst. Technol. 2017, 41, 508–513. [Google Scholar] [CrossRef]
  13. Xia, Y.; Li, Z.; Xi, Y.; Wu, G.; Peng, W.; Mu, L. Accurate Fault Location Method for Multiple Faults in Transmission Networks Using Travelling Waves. IEEE Trans. Ind. Inform. 2024, 20, 8717–8728. [Google Scholar] [CrossRef]
  14. Fang, X. Energy equity-aware load shedding optimization methodology. Energy Internet 2025, 2, 45–54. [Google Scholar] [CrossRef]
  15. Shang, Y.P.; Ma, S.X. Simulation study on primary frequency regulation based on dynamic characteristics of combined heat and power units. J. Taiyuan Univ. Technol. 2010, 41, 83–86. [Google Scholar] [CrossRef]
  16. Qi, W. Study on dynamic characteristics of primary frequency regulation load response for heating steam turbines. Turbine Technol. 2018, 60, 303–306. [Google Scholar] [CrossRef]
  17. Amiri, M.H.; Mehrabian Hashing, N.; Montaner, M.; Mirjalili, S.; Khodadadi, N. Hippopotamus optimization algorithm: A novel nature-inspired optimization algorithm. Sci. Rep. 2024, 14, 5032. [Google Scholar] [CrossRef] [PubMed]
  18. Deb, K.; Pratap, A.; Agarwal, S.; Marivan, T. A fast and elitist multi objective genetic algorithm: NSGA-II. IEEE Trans. Evol. Comput. 2002, 6, 182–197. [Google Scholar] [CrossRef]
Figure 1. Schematic diagram of the Bi-level optimization model for frequency modulation performance.
Processes 13 03111 g001
Figure 2. Bi-level optimization flowchart for frequency modulation performance.
Processes 13 03111 g002
Figure 3. Analysis of the convergence effect comparison of the HO algorithm.
Processes 13 03111 g003
Figure 4. Bi-level optimization for frequency modulation performance based on HO algorithm.
Processes 13 03111 g004
Figure 5. Changes in scores during the upper-level optimization process. (a) Score of overshoot and adjustment time in the upper-level optimization process, (b) Dynamic performance rating of frequency regulation during upper-level optimization process.
Processes 13 03111 g005
Figure 6. Comparison of upper-level optimization results of unit model based on HO algorithm before and after. (a) Comparison of results before and after optimization in heating stage, (b) Comparison of results before and after optimization in a frequency modulation stage.
Processes 13 03111 g006
Figure 7. The variation in scores with the number of iterations during the optimization process. (a) Changes in various scores, (b) Changes in comprehensive scores.
Processes 13 03111 g007
Figure 8. Comparison of lower-level optimization results of unit model based on HO algorithm before and after. (a) Comparison of Heating Process Results, (b) Comparison of the results of frequency modulation process.
Processes 13 03111 g008
Table 1. Results of Control Parameter Set Y1 Corresponding to Upper-Level Optimization.
Module NameParameterValueParameterValue
Speed control system moduleAmplification factor of speed deviation12.5Oil engine time constant4.294
PID control proportional coefficient0.628
Turbine moduleSteam volume time constant0.34Proportional coefficient of high-pressure cylinder0.341
Heating extraction moduleExtraction volume time constant9.042Butterfly valve PID control parameters2.827
Butterfly valve hydraulic motor time constant9.231
Table 2. Control parameter set Y2 results corresponding to lower-level optimization.
Module NameParameterValueParameterValue
Speed control system moduleAmplification factor of speed deviation11.1Oil engine time constant5.244
PID control proportional coefficient0.45
Turbine moduleSteam volume time constant0.21Proportional coefficient of high-pressure cylinder0.312
Heating extraction moduleExtraction volume time constant6.782Butterfly valve PID control parameters4.5
Butterfly valve hydraulic motor time constant6.8
Disclaimer/Publisher’s Note: The statements, opinions and data contained in all publications are solely those of the individual author(s) and contributor(s) and not of MDPI and/or the editor(s). MDPI and/or the editor(s) disclaim responsibility for any injury to people or property resulting from any ideas, methods, instructions or products referred to in the content.