Article

Dynamic Modeling, Control, and Upscaling of Solar-Hybridized Biomass Gasification for Continuous and Stabilized Syngas Fuel Production

1
CNRS Processes, Materials and Solar Energy Laboratory, PROMES—CNRS, 7 Rue du Four Solaire, 66120 Font-Romeu Odeillo, France
2
Univ. Grenoble Alpes, INES—CEA, 50 Avenue Lac Léman, 73375 Le Bourget-du-Lac, France
*
Author to whom correspondence should be addressed.
Processes 2025, 13(10), 3109; https://doi.org/10.3390/pr13103109
Submission received: 29 August 2025 / Revised: 11 September 2025 / Accepted: 26 September 2025 / Published: 28 September 2025
(This article belongs to the Special Issue Biomass to Renewable Energy Processes, 2nd Edition)

Abstract

Solar biomass gasification results in reducing CO2 emissions while saving biomass resources and producing higher-quality syngas when compared with conventional autothermal processes that require partial feedstock combustion for supplying the process heat. However, the solar process suffers from inherent barriers related to the variability of solar energy caused by cloud passages and shutdowns at night. The concept of hybrid solar gasification thus appears attractive for continuous and stabilized operation under intermittent or variable solar irradiation. This study addresses the dynamic simulation and control of hybrid solar–autothermal biomass gasification for continuous and stabilized syngas fuel production. A hybridization path with a constant H2 + CO production was retained, and this control strategy was implemented in a second-by-second dynamic optimization problem using a model predictive control (MPC) algorithm. Its feasibility was demonstrated both at the small scale and industrial scale, and daily to yearly performance results were provided. For a 10 MW hybrid gasifier, the yearly solar heat share was 22% for a controlled 1000 NL/s production rate of H2 + CO (corresponding to the complete allothermal gasification of ~2 t/h of wood at 1200 K), and this decreased with increasing H2 + CO production objectives (17.4% at 1300 NL/s). A total of 24,200 t of wood feedstock and 8290 t of O2 were required annually to generate 1410 t of H2 and 19,200 t of CO, with a 1.03 average H2:CO molar ratio. In addition, solar-only gasification and hybridization with external heating were also assessed. External auxiliary heating might be as efficient as in situ oxy-combustion and would not affect syngas composition by contamination from combustion products throughout hybridization. However, similar to external heat storage, the related thermal efficiency and heat losses must be considered.

Graphical Abstract

1. Introduction

Solar gasification aims to convert carbonaceous feedstocks into a value-added syngas via an endothermic reaction using an oxidizing agent (H2O or CO2), where process heat is provided by concentrated sunlight. The use of concentrated solar energy to drive endothermal reactions results in reduced CO2 emissions and biomass resource savings, with potential for more syngas produced per unit of feedstock and no contamination caused by combustion by-products, in comparison with conventional autothermal processes requiring partial feedstock combustion [1,2]. However, solar thermochemical processes require the handling of solar power fluctuations for continuous day and night processing. Several methods have been proposed to mitigate the effects of fluctuating solar power availability on solar gasification. The benefit of heat storage in maintaining a sufficiently high temperature throughout day–night operations can be considered. The thermal inertia of reactors can be improved to buffer solar power variations. Internal heat storage can be achieved in molten-salt reactor designs [3]. Several small-scale molten salt reactors have been developed [4,5]; however, they revealed technical obstacles such as the reactivity of salts with other species. Such molten-salt gasifiers have shown promising experimental performance and thermal efficiency [6,7]. Regarding external heat storage, solutions have been considered to integrate heat storage devices in solar thermochemical plants [8], featuring the cycling of heat transfer fluids at the expense of moderate storage temperatures (around 700 °C) [9]. Only particle-based storage has been reported to be feasible up to 900 °C. In this context, relevant dual-fluidized bed processes have been proposed [10,11,12,13,14] due to favorable heat transfer characteristics. Solar-driven steam gasification of biomass was also recently proposed with indirect heat transfer to solid particles used as solar heat carrier media [15,16].
Regarding the gasification reaction, the solar–autothermal hybridization concept is another option for round-the-clock operation [17]. Continuous syngas production can thus be achieved, while gradually replacing solar heating through in situ partial feedstock combustion whenever the incoming solar power is not sufficient. Autothermal–solar reactor heating reduces the requirements for heat storage capacity [18] and, thereby, the oversizing of solar collectors. Conventional autothermal processes can be solarized via the integration of a concentrated solar energy source in the gasification plant [19,20], which can lead to competitive H2 production costs while saving feedstock resources. The economic assessment of hybridized gasification was considered in [21,22]. A detailed techno-economic analysis of the hybridized gasification process was previously carried out, and a comparison with autothermal and solar gasification was also proposed. H2 production costs from solar-only, hybrid, and conventional autothermal biomass gasification were assessed under different economic scenarios. Considering a biomass reference cost of EUR 0.1/kg and a land cost of EUR 12.9/m2, the H2 minimum cost was estimated to be EUR 2.99/kgH2 and EUR 2.48/kgH2 for solar–allothermal and hybrid processes, respectively, and EUR 2.25/kgH2 for the conventional process. Potential cost savings for solar processes can arise from a decrease in solar tower and heliostat costs, combined with a lower land cost. The analysis also showed that a slight increase in the feedstock price penalized the autothermal process, thereby favoring solar-only and solar hybrid gasification. This is because solar processes favor better utilization of the biomass feedstock, thus reducing fuel production costs. In the case of waste gasification (such as agricultural and crop waste, food waste, and Solid Recovered Fuels), solar processes reduce CO2 emissions, thus enabling lower environmental impacts for non-renewable feedstocks (for instance, plastic waste). The direct CO2 emissions of solar-driven processes remain negligible or significantly lower than those of conventional autothermal processes. Thus, solar-driven gasification processes have promising long-term potential since they avoid or alleviate the costs associated with pollutants abatement and CO2 mitigation.
Different studies have investigated the hybridization of existing solar reactors (vortex flow [23]; dual fluidized bed [24]) with the injection of oxygen. Alternatively, different studies have considered solar power integration for steam heating [25,26], thus limiting the impacts of solarization on the whole process. These studies considered hybridization at the process scale. Another approach consists of considering the gasifier alone to characterize its responses to varying solar conditions. A hybridized molten-salt reactor with high heat storage capacity was proposed in [18]. The control of a hybridized reactor was also studied in [27] by adding biomass feedstock and oxygen to maintain a temperature above 1100 K. During day periods, the consumption of the feedstock and oxygen was reduced, thus enhancing the energy upgrade factor from 0.88 to 1.20 and reducing CO2 production and feedstock consumption when compared to the autothermal process. A stable H2 + CO molar flow rate can be obtained, while the H2:CO molar ratio can be tuned downstream. Other simulations have studied the effect of H2O and O2 injection rates on a hybrid 300 kWth solar reactor [17], but feedstock injection regulation has not been addressed, which would enable control of the total H2 + CO production rate.
The implementation and development of dynamic control methods have been considered to evaluate the practical applicability of solar-only and hybridized control strategies. In the field of solar reactors, dynamic control aims at stabilizing thermal and chemical reactor performance, despite the fluctuating availability of solar power [27,28,29,30]. For example, models of solar-packed bed [31] and vortex flow reactors [32] were proposed using a feedback-based controller to stabilize the produced gas composition and optimize the control parameters and the reactor’s efficiency, thanks to the improved management of solar transients [33]. In a different work, Boujjat et al. [29] carried out yearly simulations (hourly time steps) to compare the hybridized and solar-only production of an upscaled process (at 10 MWth scale) and to determine the total syngas production rate using real DNI data (Direct Normal Irradiation). The decrease in solar heat was directly balanced by an appropriate addition of biomass feedstock and O2. Cloudy periods were thus managed by switching between solar, hybridized, and autothermal operation, without diminishing temperature control capabilities. Annual simulations were finally carried out to determine H2 production costs [21]. This methodology and research effort should be continued by utilizing a shorter sampling time and suitable control strategies, including control of syngas quantity or quality. Additional implementation was carried out in a solar electrical gasification reactor in [30]. The obtained experimental results demonstrated the feasibility of on-site dynamic control. Suitable feedback was given, highlighting the benefits of short sampling times for the control of temperature. Longer sampling times may be suited for integrating weather forecasting in order to anticipate long-term variations in DNI.
Different experimental studies of hybridized reactors have also been performed. Varying O2:C and H2O:C molar ratios have been considered, and oxygen addition increases reactor temperatures at the expense of reduced H2 production [5]. Similarly, the gasification of beechwood particles in a hybridized solar spouted-bed reactor [34] showed that a decrease in the reactor temperature due to decreasing solar power input could be counteracted by additional feedstock and oxygen injection. Similar results were obtained regarding solid recovered fuel particle gasification [34]. Finally, in a molten-salt reactor, injecting oxygen maintained the medium temperature at about 1210 K while decreasing the solar power input [35]. Again, the production of H2 decreased significantly (by 25%), whereas the production of CO2 increased 2-fold. The role of steam addition was considered in particular, as it can enhance H2:CO molar ratios at the expense of higher solar heat consumption for steam generation. Hence, the H2:CO mole ratio should not be a controlled parameter to be considered during process hybridization, whereas downstream water–gas shift reaction (WGS) should be encouraged for such applications [27].
Dynamic control of solar hybrid gasification is proposed for continuous day and night operation. The hybridization strategy applied in previous studies involved constant H2 + CO production [36,37]. However, it has only been validated for steady-state operations in a lab-scale gasifier model, which does not imply its feasibility during transients. This is why a dynamic control study appears interesting in discussing the practical application of hybridization under real solar power input conditions. Controlling H2 + CO production seems essential to integrating hybridized gasifiers in a continuous process. However, the practical application of solar heating requires demonstrating the feasibility of continuous control to cope with fluctuating solar power inputs. A continuous control code is thus developed and applied in this study. In particular, an application to an upscaled gasification plant is proposed, yielding daily to yearly performance results. The goal is to promote solar energy integration with thermochemical conversion processes. The objective of this study is to provide dynamic control validations and to assess the management of transient regimes between autothermal (night) and allothermal (day) operations. This represents a major innovation in the design of biomass gasification reactors at a large scale using dynamic control strategies based on high-resolution model predictive control, industrial-scale validation, and exploration of alternative hybridization strategies. A continuous optimization problem is formulated comprising two inputs and two constraints for the simultaneous control of both H2 + CO production and reactor’s content temperature (at 1.5 kW scale). Upscaling to the industrial scale (10 MWth) is then performed to identify the potential yearly performance results of hybridized gasification and to highlight the impact of design choices on these results. In particular, the role of potential sunlight defocusing during clear days is addressed to maintain a constant syngas production rate while avoiding reactor overheating. The dynamic model uses high time resolutions (1 s for direct solar irradiance data) and chemical dynamics integration to yield yearly results. To date, such a dynamic control tool applied to solar thermochemical fuel production processes under various operation strategies has never been developed. The control tool can be used to simulate solar–autothermal hybridized gasification, enabling a controlled H2 + CO production rate under a stabilized reactor content temperature. Finally, alternative control strategies are assessed: (i) solar-only gasification and (ii) hybridization thanks to another external heat source. Even though the goal is not to yield complete performance results, these cases might provide further insights into the design and controllability of solar-heated processes.

2. Model Principle and Application at Laboratory Scale

This section describes the principle of model predictive control, which is implemented to optimize the gasifier’s performance during hybrid operations. The dynamic model is employed to forecast reactor outputs and determine the optimal inputs at each time step. Dynamic control is applied at the lab scale for daily syngas production to validate the feasibility of a constant H2 + CO production strategy. The associated results are provided and discussed, and a method is described to parallelize calculations for several-day periods.

2.1. Model Predictive Control

2.1.1. Principle of the Control Code

The continuous control of the gasifier is performed using a model predictive control (MPC) algorithm. MPC aims at updating the reactor inputs once per sampling period (duration tsampl) based on reactor state forecasts carried out over several sampling periods (duration H × tsampl). The number, H, of periods considered for forecasting is called the horizon. MPC aims at granting a robust control ability, preventing instabilities that could emerge during step-by-step optimization (i.e., H = 1). In this study, a persistence model was considered to forecast DNI (more refined DNI forecasting models were assessed by Karout et al. [38]).
Several characteristic times were, therefore, featured, as depicted in Figure S1 (Supplementary Material). They comprised the time step of the dynamic model (tmodel = 0.2 s), the DNI actualization time step (tDNI = 1 s), and the control algorithm sampling time (tsampl = 5 s in Figure S1). At each sampling period (tsampl), an ideal set of reactor inputs was determined for the H periods to come. The DNI was considered constant during forecasting, and the reactor’s outputs were computed using the reactor’s dynamic model. Once this set of inputs was determined, the reactor’s state was updated over one sampling period by considering the actual DNI data variations (tDNI) instead of the persistence model value.

2.1.2. Cost Function

The optimal set of reactor inputs was determined by minimizing a cost function over the forecasting horizon (H × tsampl). A general formulation is proposed in Equation (1). The error function (in square brackets) features reactor outputs (vi or vj), forecasted at the instants t0 + tsampl to t0 + H·tsampl. Some of these outputs were intended to remain at a target value viobj (e.g., temperatures, gas production objectives), and some were intended to be minimized (e.g., CO2 production, feedstock consumption). The constraints were prioritized using a set of weights (wi or wj).
min u 1 u H · n inputs t = t 0 + t s a m p l t 0 + H · t s a m p l i = 1 n t a r g e t s w i · v i t v i o b j 2 + j = 1 n m i n i m i z e d w j · v j
The error function was minimized by modifying the reactor inputs, ui. If different inputs (ninputs) were considered, a total of H·ninputs inputs were adjusted over the entire forecast horizon. The optimization problem dimension was, therefore, determined by both ninputs and H, and so was its algorithmic complexity. In order to minimize the cost function, a Sequential Least Squares Programming (SLSQP) optimization algorithm was first implemented. It was based on the calculation of Jacobian matrices (dimension H·ninputs) that could be parallelized. However, this parallelization did not bring satisfying time gains, and the two parameters (the precision goal and step size for numerical Jacobian approximation) could not be tuned efficiently to generate robust results. A Nelder–Mead [39] optimization algorithm was implemented instead. This simplex algorithm can be tuned by modifying a single parameter (the precision goal for the cost function) and brings robust and fast-enough results. All calculations below were performed using this Nelder–Mead algorithm.

2.1.3. Comparison with Previous Works

Dynamic control was already performed by Boujjat et al. [29] and by Karout et al. [38], with the same spouted-bed reactor design and dimensions. The present work had distinct objectives and followed different assumptions, as summed up in Table S1. The aim of Boujjat et al. was to establish yearly prediction results for hybridized operation, which were further used to create an economic analysis of the process [21]. Hybridized operation was compared with solar-only operation. The reactor was modeled using thermodynamic equilibrium calculations. Unsteady thermal dynamics controlled the evolution of the unique-temperature Treactor. Conductive losses were determined using a globalized thermal resistance model (R) and were completed using radiative losses at the reactor aperture. A detailed model of the solar field efficiency, ηfield, was featured, depending on the solar zenith (α) and azimuth (γ) angles. Long sampling times were featured to achieve daily (tsampl = 10 min) and yearly (tsampl = 1 h) results. In the model developed by Karout et al. (similar to the model created by Boujjat et al.), the objective was to assess the impact of the DNI forecast method on temperature controllability, leaving aside the gasifier’s chemical efficiency. No precise ηfield model was featured. Sampling times of around 30 s were assessed to ensure satisfying control precision. An MPC algorithm, featuring an SLSQP optimization method, was employed and compared to an adaptive PID-based algorithm.
The present work was based on a dynamic model previously described [36], featuring detailed thermal and chemical unsteady equations. The case of woody biomass gasification was considered in this work, but the proposed control strategy could be applied to other biomass types (e.g., agricultural residues, energy crops, or mixed feedstocks) by adapting the dynamic model to other feedstock compositions. The temperatures of the reactor content, Tgas+char; internal reactor wall, Twall; and aperture plate, Tplate (the latter only for indirect solar heating mode) were distinguished, and the char gasification dynamics were separately modeled. In particular, the conduction of heat through the wall and insulation was modeled using the finite volume method. A scheme of the reactor model is provided in Figure S2. At the laboratory scale, in a beam-down solar furnace, no field efficiency had to be considered. At the industrial scale, a simplified estimation of the cosine effect was proposed (see Supplementary Material), depending on the zenith angle (α) only. A sampling time shorter than that of other works was considered (as detailed in Figure S1). The implementation of solar prediction models was not tackled, and did not seem necessary at such a short sampling time. The goal was, rather, to assess advanced control criteria, with multiple inputs and multiple outputs (MIMO), and to investigate the impact of design choices on the performance of controlled reactors.

2.2. Dynamic Simulation at Laboratory Scale

2.2.1. Problem Definition for the Controlled Hybridized Process

A dynamic optimization problem was formulated for the hybrid production of syngas. In practice, this consisted of listing the reactor inputs of interest, with their respective initial values and boundaries, and defining a cost function out of the reactor outputs available. Several optimization parameters had to be fixed as well, such as the sampling time (tsampl), the forecast horizon (H), and the cost function minimization precision goal. Control robustness was ensured by the careful definition of the problem.
In this work, hybridization was ensured by controlling the feedstock and oxygen injection rates, coupled with solar field defocusing when necessary. The steam injection flow was kept constant. As a target, H2 + CO production was regulated throughout hybridization. The Tgas+char temperature was kept constant as well, as a constraint. With two variables and two constraints, the optimization problem yielded robust and repeatable results. An application to small-scale gasification is detailed in the following by considering the cost function of Equation (2). The ṅH2+CO target was set to 2 NL/min, and the Tgas+char objective was set to 1500 K. The value of w1 was empirically set to 1 × 10⁹, against 1 for w2, to yield comparable penalties for both constraints.
min m ˙ feed m ˙ O 2 / defoc t w 1 · n ˙ H 2 + C O t n ˙ H 2 + C O o b j 2   + w 2 · T g a s + c h a r t T g a s + c h a r o b j 2
The first input considered was the feedstock injection rate, ṁfeed. The second input controlled both the oxygen injection rate (ṁO2) and the fraction of solar power admission (defoc). A fraction of sunlight could indeed be rejected to prevent reactor overheating during high DNI periods, using a partial defocusing of the heliostat field. The response of this second input is described in Figure S3: positive values controlled the progressive addition of O2 (insufficient DNI), and negative values controlled sunlight defocusing (excess DNI).
The cost function precision goal was set to 0.1, corresponding to a H2 + CO flow-rate variation of 6 × 10⁻⁴ NL/min or a Tgas+char variation of 0.1 K. The sampling time, tsampl, was 5 s, and the MPC horizon, H, was set to 1, which was equivalent to a step-by-step optimization algorithm. Increasing the H value led to increased calculation times, while no positive impact on the control precision was noticed. Hence, step-by-step optimization was suitable (H = 1) since higher H values did not turn out to be necessary to enhance control precision. Furthermore, the reactor was subjected to a direct solar heating mode. The usual 2.7 NL/min flow rate of argon was simulated, and the H2O injection rate was maintained as being equal to 0.2 g/min during hybridization.
Aperture obstruction at low DNI was applied in order to avoid radiative heat losses during autothermal operation. Therefore, an obstruction in the reactor’s upper aperture was simulated by closing the cavity. This was applied whenever the DNI was below 150 W/m2. At such a low DNI, radiative heat losses were generally higher than the solar power input, Qsun,2 [38]. This obstruction was assumed to be instantaneous.

2.2.2. Daily Gasification Profile at Laboratory Scale

An example of controlled daily operation is detailed in Figure 1. The solar power input was based on the DNI records of 25 June 2018, recorded in Targasonne (France) at the THEMIS solar tower site. Figure 1a displays the available solar power (Qsun available) and the admitted solar power after defocusing (Qsun admitted). Both included the receiver efficiency, ηopt,receiver (as with Qsun,2). Figure 1b represents the reactor temperatures (Tgas+char and Twall) and the mass of char (mchar) circulating in the cavity at each time; Figure 1c shows the input flow rates of the reactants (feedstock, H2O(l), and O2) and the defocusing factor (defocusing, varying from 0 to 1); and Figure 1d shows the output flow rates of the gases (H2, CO, CO2, and H2O).
The initial state was determined by steady autothermal operation, optimized according to the cost function (Equation (2)). Then, the increasing solar power input started to heat the reactor wall and content, gradually lowering the feedstock and oxygen requirements. This can, in turn, induce potential cost savings due to reduced feedstock and oxygen consumption. Char accumulation started rising and plateaued at a mass value of 262 mg. Eventually, oxygen injection (plain line) was stopped and replaced by a gradual defocusing of the available solar flux (dashed line), which let the wall temperature plateau around 1620 K. At the end of the day, all the temperatures went back to their initial levels, along with the flow rates of the feedstock, oxygen, and output gases. The accumulation of char also dropped to 5.86 mg.
Considering the assumptions of the model, day–night hybrid operation with constant H2 + CO production was feasible. Such a hybridization strategy was confirmed, with solar-only gasification around mid-day, autothermal gasification at night, and hybridized gasification during transient periods. During solar operations, excess solar power was rejected by defocusing, so the admitted power remained around a constant value. During autothermal operations, the O2 injection rate reached 1.66 NL/min, and the wood injection rate reached 2.94 g/min instead of 1.10 g/min during solar operation (2.67-fold increase). As already highlighted, the wall’s temperature was lower during autothermal operation (1240 K instead of 1620 K), even though the reactor’s content was maintained at 1500 K. Finally, during transient periods, the gasification rate was successfully leveled despite some sharp DNI variations. In comparison, solar experiments in [37] showed that reaching 2 NL/min of H2 + CO production would require a wood feedstock injection value higher than 1.2 g/min (approximately 1.5 g/min, instead of 1.1 g/min here). This was due to the incomplete mass conversion extent determined in practice, which was not modeled.

2.2.3. Control Code Performance

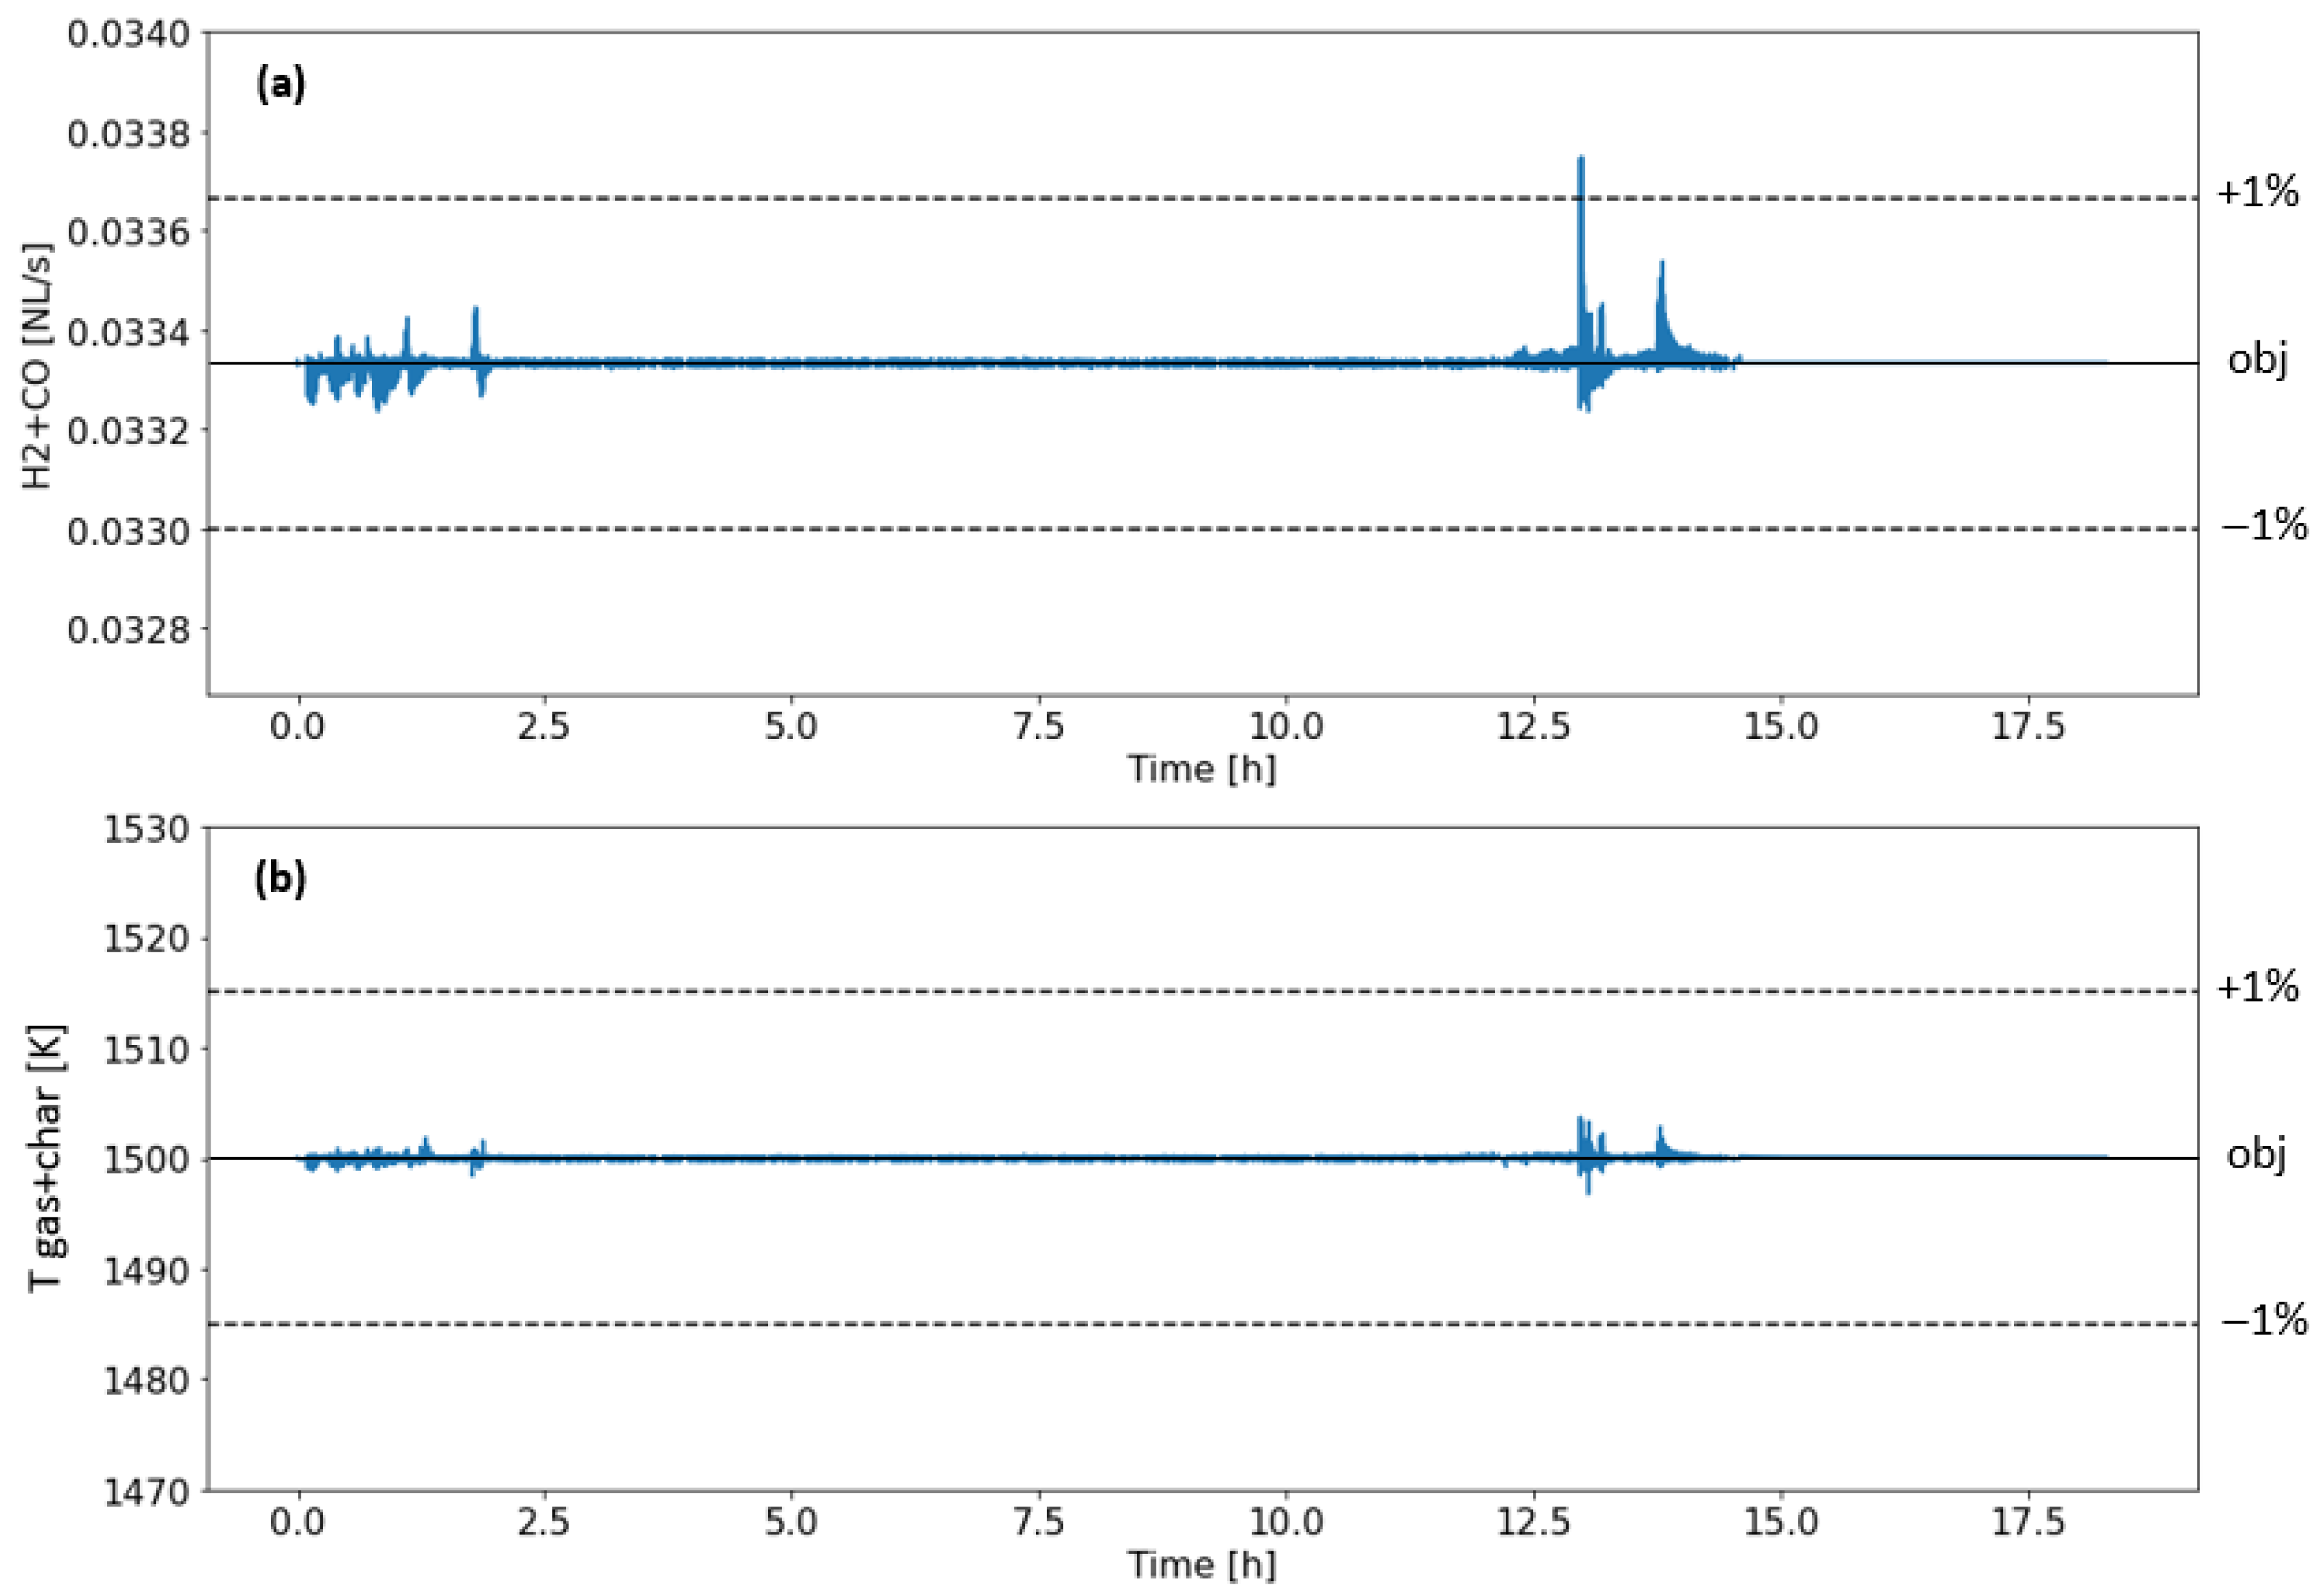
The constraints regarding H2 + CO production and Tgas+char were accurately fulfilled. Figure 2 shows the evolution of both outputs compared with the target value (plain line) and the ±1% values (dashed lines). Relative errors remained below 1%, except for one peak at 1.2% for H2 + CO control, showing satisfying control performance. The RMSE values (Root Mean Square Error, Equation (3)) equaled 0.74 × 10⁻³ NL/min and 0.18 K.
R M S E v = 1 n o b s i = 0 n o b s v t i v o b j 2
The Central Processing Unit (CPU) calculation time (Intel® Xeon® CPU E7-4890 v2 @ 2.80 GHz (x86_64)) was around 1 min per minute of operation simulated, showing that the MPC code was compatible with on-site implementation. Furthermore, the memory use was not constraining. Only the writing of records as CSV files was memory-consuming.

2.3. Management of Several-Day Periods

2.3.1. Principle of Dynamic Control over Different Days

Yearly DNI records were available, as measured at the solar tower site (THEMIS plant) in the French Pyrenees. They covered the year 2018, representing a total yearly DNI of 1785 kWh/m2/year. The sampling time was 1 s, which was compatible with a precise dynamic control application. The records of the sun’s position were also available, allowing the potential efficiency calculation of the heliostat field to be made for further industrial-scale applications. Dynamically controlled operation was thus simulated over several-day periods based on real meteorological data to generate performance metrics representative of the geographical location. To that end, calculation times had to be reduced as much as possible.
  • No dynamic calculations were performed when the gasifier was at a steady state during nighttime operations. Figure 3 illustrates the periods when dynamic simulation was carried out (blue boxes). These started right at sunrise and ended several hours after sunset, when all inputs and state variables converged.
  • Moreover, it was noticed that the nighttime gasifier state was always the same, regardless of the temperature history during the day. This property is verified in Figure 1, as all reactor inputs and outputs went back to their initial values at night. As a result, the daily calculations could be decorrelated and computed in parallel.
Therefore, multiple-day calculations could be performed in parallel. The nighttime steady state was computed before all and was used as a starting point for all days. All daily simulations thus started right at sunrise (t = 0 h in Figure 1) and ended when the conditions returned to the steady state. The remaining nighttime hours, during which steady autothermal operation occurred, were completed afterward.
With the method given above, computing yearly data required simulating around 5500 h of controlled operation. This could be performed in one week, with a parallelization of over ~33 machines. Nevertheless, such computational costs would not enable conducting advanced parametric studies in a reasonable time. A sample of 8 days was thus proposed (Figure S4) to perform parametric studies more quickly. These 8 days covered various characteristic DNI profiles, corresponding to variable weather conditions. Two days were featured near each solstice and equinox of the year. In comparison with yearly solar power availability (DNI = 1785 kWh/m2/year), the 8-day sample was, however, representative of particularly favorable sunlight conditions (DNI = 2600 kWh/m2/year).
By including cloudy days with particularly abrupt DNI variations, possible flaws in the optimization code were easily detected at a glance. A badly designed control strategy could lead to punctual peaks in the reactor outputs, persistent gaps in the target values, or oscillating behaviors. Simulation at the laboratory scale was successfully performed over the 8 days in Figure S4 without observing such flaws. The worst daily RMSE values for both control metrics were 2.48 × 10⁻³ NL/min (H2 + CO) and 0.48 K (Tgas+char), observed on 19 March and 23 March, respectively.

2.3.2. Performance Assessment

The reactor performance outputs over the 8-day sample are summarized in Table 1. The values of interest were the input and output mass flow rates, which allowed us to deduce the input and output total calorific contents (CCs). The solar power admitted to the cavity (Qsun,2, impacted by sunlight defocusing) was also provided, and the heat released by combustion (Qcomb) was determined using the feedstock’s Lower Heating Value (LHV). Typical steady autothermal and allothermal operating conditions were assessed in the first two columns, providing mass flow rates and heat fluxes, as observed at t = 17.5 h and t = 7.5 h in Figure 1 (all curves are flat, even the solar power admitted, due to the controlled defocusing). The autothermal and hybridized operation results, totalized over the 8-day sample, are compared in the last two columns, providing masses (kg) and energies (MJ).
  • The steady autothermal data (column 1) corresponded to night-time operations. The CGE was 0.44, which was about two times lower than that of industrial autothermal gasifiers due to unsuitable lab-scale cavity optimization. No significant CH4 production was recorded.
  • The steady allothermal data (column 2) were collected on June 25, at t = 7.5 h. The CGE was higher than 1 (1.13) owing to the upgrading of the feedstock CC. The required solar power (Qsun,2 = 45.9 kJ/min) was higher than the combustion power necessary during autothermal gasification (Qcomb = 33.5 kJ/min) due to the higher wall temperature, leading to higher thermal losses. The SFE equaled 34.7% when calculated with the power absorbed by the cavity Qsun,2, and it equaled 25.3% when calculated with the power delivered by the concentrator Qsun,1 (comparable to the experimental results).
  • Autothermal operations during 8 days (column 3) yielded a 0.44 CGE, as observed for the steady autothermal operations (column 1). All data in column 3 are indeed multiples of column 1, as integrated over 8 × 24 h.
  • Hybridized operations over 8 days (column 4) yielded some gains in comparison to the autothermal operations (column 3). An identical H2 + CO molar flow rate was obtained while decreasing the feedstock and oxygen requirements by 20.6% and 33.0%, respectively. Accordingly, the provided combustion heat decreased by 33.0%. The H2O and CO2 outputs were decreased as well, by 32.2% and 33.2%, respectively. This reduces the environmental impact of the process (compared to the autothermal process), while potentially offering cost savings due to reduced feedstock and oxygen consumption. The overall CGE, integrated over the yearly operation, was 0.55. In total, 41.1% of the heat was provided by the solar power input (solar heat share, Qsun2 over Qsun,2 + Qcomb), but 9.0% of the solar energy was rejected by defocusing to avoid reactor overheating. The SFE equaled 40.4% when calculated with Qsun,2 and 35.3% when calculated with Qsun,1.
In summary, dynamic control allowed us to assess hybrid gasification in the lab-scale reactor. Model predictive control was implemented, based on reactor state forecasting over multiple time steps, even though a step-by-step optimization scheme seemed precise enough in the scope of this study. A H2 + CO production constraint was successfully applied despite daily DNI variations, along with a temperature constraint on the reactor’s content. This was ensured by the conjoint control of the feedstock and oxygen injection rates and required a fraction of the solar power input to be rejected in order to avoid overheating. The errors with respect to both control targets were generally lower than 1%. Eventually, a method was defined to parallelize calculations over multiple days and was used to compute reference results over an 8-day sample. This method opened the path toward yearly calculations, as enabled by the low model computational costs and the parallelization method. Yearly calculation with such low sampling times is a novelty based on the current literature. Moreover, the assessment of an upscaled hybrid gasifier with this method might provide precious insights into plant dimensioning and control design choices, essential for the development of the hybridized process. In the following, the dynamic control method was applied to compute yearly results using an upscaled gasifier model.

3. Dynamic Control of an Upscaled Hybrid Gasifier

This section proposes a 10 MWth upscaled reactor model upon which the dynamic control code can be assessed. In particular, difficulties regarding insufficient wall-to-content heat transfer are pointed out, suggesting technological upgrades to ensure operation in an upscaled spouted bed. Daily and yearly hybrid operation results are then assessed to evaluate the potential gains in comparison with autothermal gasification. The impact of some design choices is discussed to provide elementary keys for hybrid solar-autothermal plant upscaling.

3.1. Reactor Upscaling

3.1.1. Dimensioning

A reactor size dimensioning was proposed for industrial syngas production (Table 2). The characteristics are compared with those of the lab-scale reactor and those used by Boujjat et al. [29]. The nominal power input, Qsun,1, delivered by the solar concentrator at DNI = 1 kW/m2 equaled 10 MW multiplied by the solar field optical efficiency (using the zenith-angle-dependent cosine effect, detailed in the Supplementary Materials). As for Boujjat et al., a 92% beam-down optical efficiency was considered for the calculation of Qsun,2 (admitted into the cavity). The nominal concentration factor (C) was 3000. As a result, the reactor’s upper aperture diameter was set to 2.06 m. The typical solar feedstock conversion rate was around 2 t/h.
Contrary to previous work, the cavity’s diameter was decreased from 6.40 to 4.12 m. This would reduce investment costs (at a constant wall thickness) while maintaining identical biomass conversion capacities. The corresponding gas-phase average residence time was below 10 s (vs. ~40 s in [29]). Decreasing the cavity’s size naturally reduced the wall–gas contact area (Awall-gas, not including the alumina cap area) and the total weight of the wall (mwall, for a 7.3 mm wall thickness).

3.1.2. Problem of the Wall-to-Content Heat Transfer

In practice, a strong gap was noticed between the Twall and Tgas+char temperatures during solar operations. The wall temperature was often too high to handle material constraints (a maximum allowed temperature of 1400 °C for FeCrAl alloy), while the content temperature was often too low to ensure a suitable conversion (<900 °C). This temperature gap was the result of an insufficient wall area in comparison to the incident solar power, hindering restitution of heat from the wall to the cavity content. Indeed, in comparison with the lab-scale reactor, the solar power input, Qsun,2 (at ηfield = 0.7), was multiplied by ~6600, while the inner wall area was only multiplied by ~2700. This issue was not raised previously [29], as a unique Treactor temperature was considered.
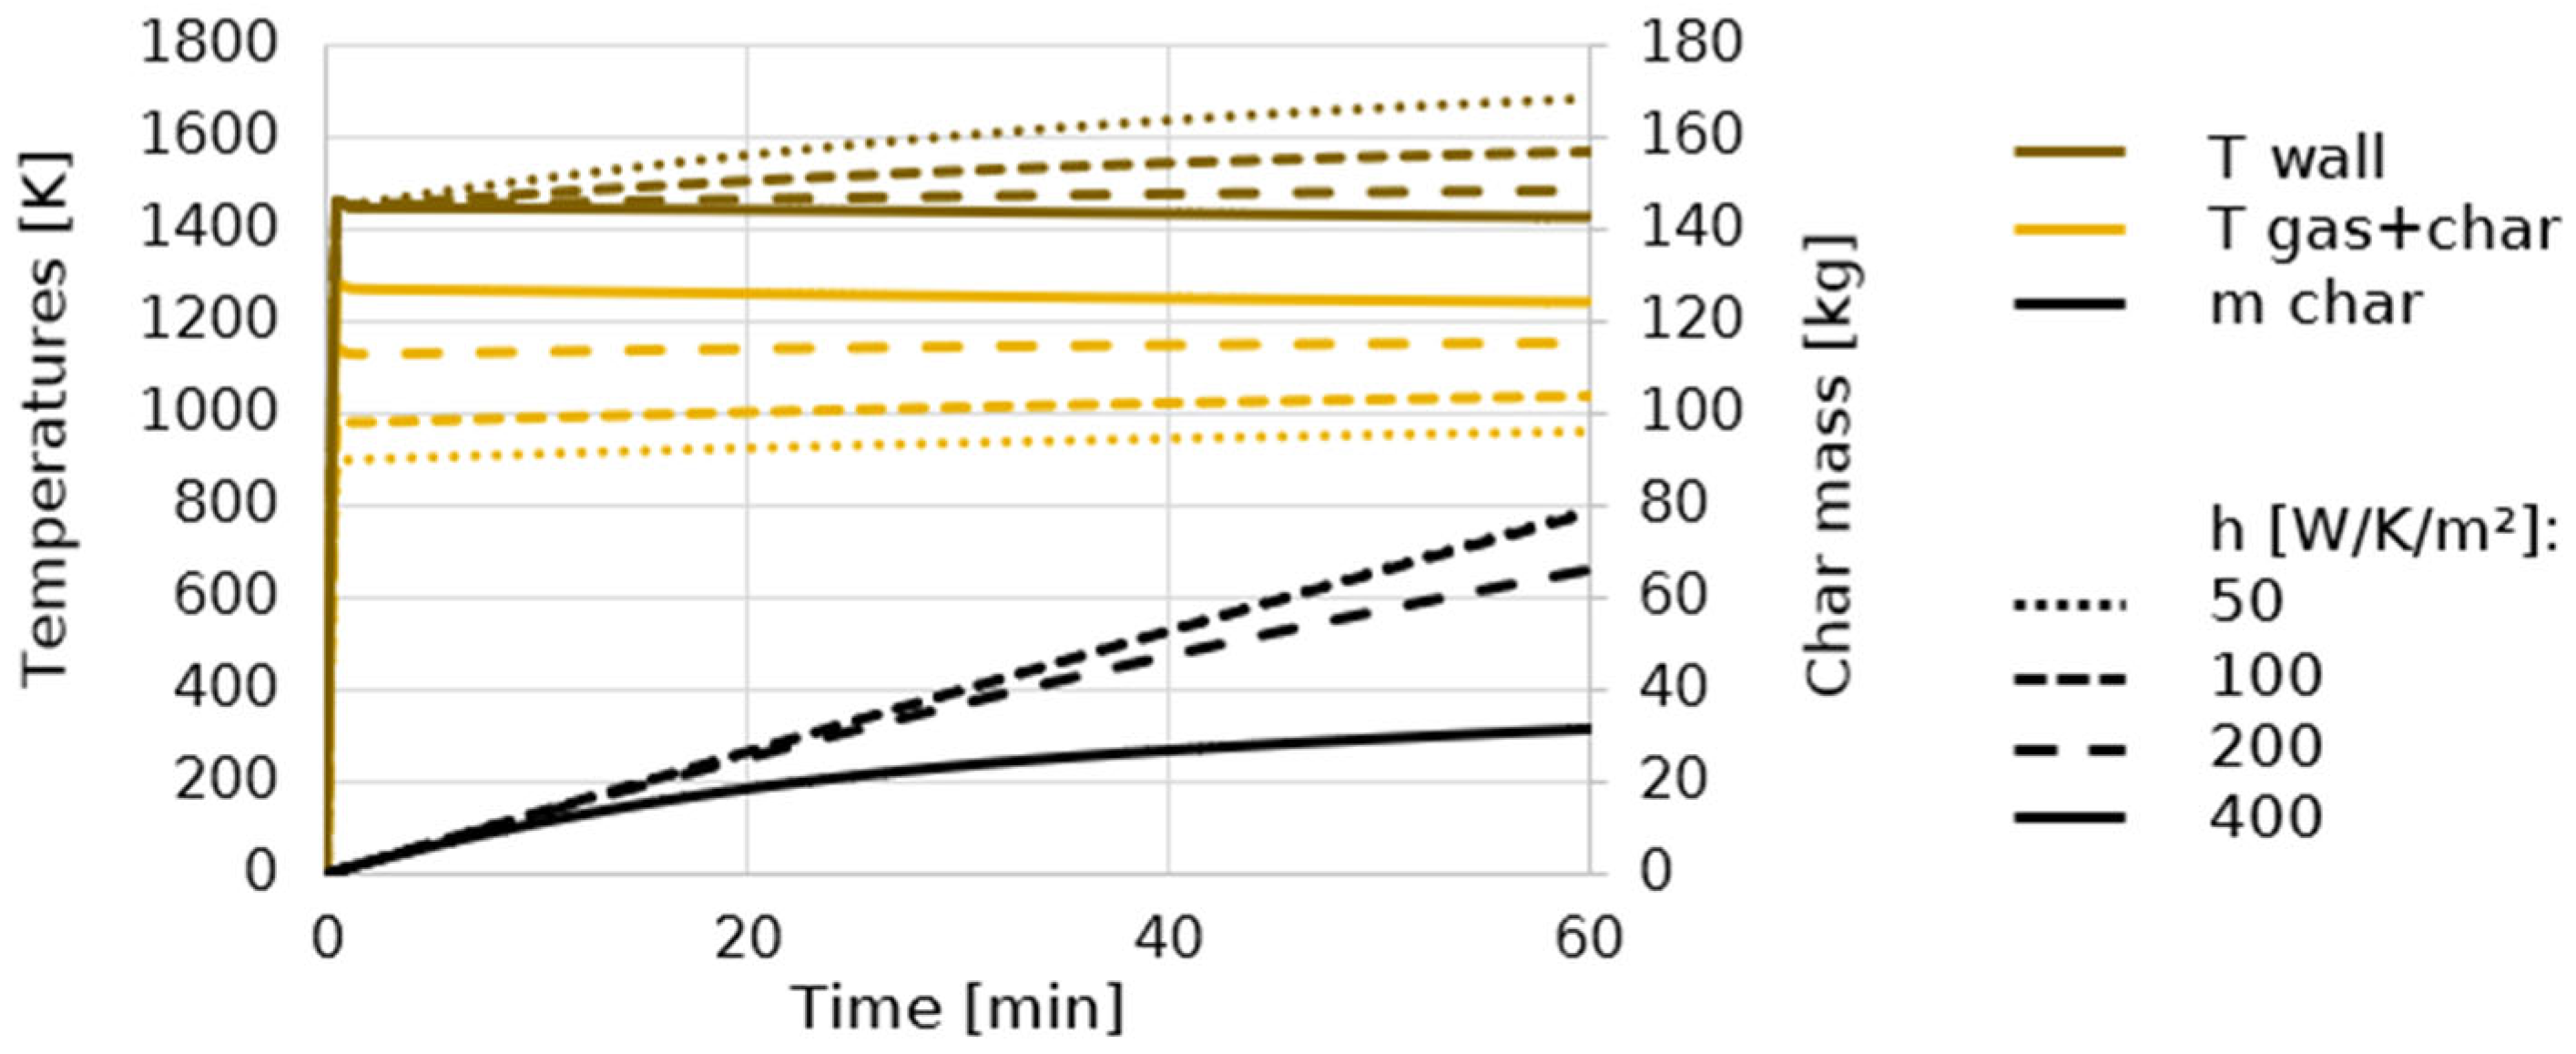
This observation required modifying thermal assumptions. In particular, the impact of the wall–gas convective heat transfer coefficient, h (from 50 to 400 W/K/m2), is assessed in Figure 4. The gasification of 2 t/h of wood by 0.5 t/h of steam was simulated, under an 800 W/m2 DNI and a typical 0.7 ηfield value. After 60 min of operation, at h values of 50, 100, 200, and 400 W/K/m2, the Twall − Tgas+char temperature gap reached, respectively, 731, 537, 330, and 186 K. Two modifications were, therefore, made to the thermal model to reduce this temperature gap.
  • The convective heat transfer coefficient, h, was increased from 50 to 200 W/K/m2. In practice, this would imply modifying the wall surface geometry, including fins, increasing its roughness, or adding an inert bed material for improved heat transfer.
  • Pre-heating of gas input streams was simulated by implementing a wall–gas heat exchanger. In practice, this would consist of letting the gases flow along the wall’s outer side before injection. In addition to heating reactants, this cooled down the wall to avoid overheating. A simplified heat transfer equation was solved for each volume of gas injected (Equation (4)). With high U.A values (2 kW/K in this case, U being the exchanger’s overall heat transfer coefficient and A the contact surface area), the gas temperatures are almost homogeneous with the wall temperature before reaching the reactive volume. The heat balance was ensured at each time step.
    Q = U · A · T w a l l T g a s , i n T w a l l T g a s , o u t l n T w a l l T g a s , i n T w a l l T g a s , o u t

3.1.3. Update of the Control Code

Upscaling the reactor did not change the principle of dynamic control. The target values for Tgas+char and H2 + CO production were, however, modified. The Tgas+char target was set to 1200 K, although it was higher at the laboratory scale. This new temperature corresponded to the recommendation of M. J. Prins [40]. The H2 + CO production target was set to 1000 NL/s, corresponding to the complete allothermal gasification of ~2 t/h of wood at 1200 K. The injection of H2O was kept constant at 0.5 t/h (day and night) so that ~50% over-stoichiometry was reached during solar operation (which is necessary to restrict char accumulation). The O2 consumption would have been 3.3% lower without H2O, but the syngas molar H2:CO ratio would have decreased from 1.0 to 0.8.
Both weights of the cost function (w1 and w2, Equation (2)) were set to 1. The reference parameters of the dynamic control algorithm are provided in Table S2. In particular, a 0.1 precision regarding cost function minimization was retained. In comparison with [29], the wall thickness was increased from 7.3 mm (likely too thin) to 2 cm, thus increasing the wall mass up to 7.12 t.

3.2. Dynamic Simulation at Industrial Scale

3.2.1. Daily Gasification Profile and Performance Assessment

As for the laboratory-scale simulation, typical daily production results for a sunny day were computed and are plotted in Figure S6. The responses obtained over more cloudy days are provided in Figures S7 and S8. The general comments were not different from Section 2.2.2. However, the Twall and reactant flow rate evolution values were more smoothened than in Figure 1 due to a higher thermal inertia at the industrial scale. During solar operation, defocusing occurred and caused the wall temperature to stabilize around 1500 K.
The reactor performance results over the 8-day sample are detailed in Table 3. In particular, the SFE value determined during solar operations surged to 73.9%, compared with 34.7% at the small scale. This was due to the much lower temperature constraint and to enhanced thermal efficiency enabled by reactor upscaling. The CGE during autothermal operations was also higher for the same reasons, reaching 77% (versus 80% in [29]). Hybridization saved 8.9% of the biomass consumption and 28.2% of the O2 consumption during the 8-day sample, in comparison with autothermal-only production. The H2O and CO2 outputs were reduced by around 24%. The solar heat share was 31.3%, and 8.4% of the solar heat available was rejected by field defocusing.

3.2.2. Annual Mass and Energy Balances

The previous results were compared to the yearly data, provided in Table 4 [41]. The steady-state results remained unchanged in comparison to Table 3. However, the results of hybridized gasification were less advantageous than for the 8-day sample due to globally worse weather conditions throughout the year. The feedstock and O2 savings were only 6.2% and 19.5%, respectively, and the solar heat share was 22.0% instead of 31.3%. Therefore, the 8-day sample cannot be considered a representative sample of the yearly DNI data. It was, rather, a sample of relatively favorable days, useful for performing general parametric analyses.
According to hybridized gasification results, 24,200 t of wood feedstock and 8290 t of O2 were required annually to generate 1410 t of H2 and 19,200 t of CO, with a 1.03 average H2:CO molar ratio. Meanwhile, 10,300 t of CO2 was produced yearly, as well as 2.43 t of CH4. The SFE achieved during hybrid gasification (76.2%) was near the CGE value determined during autothermal gasification (77.0%) due to the relatively low amount of solar energy in comparison with the species’ calorific contents.

3.2.3. Impact of the Syngas Production Objective on Annual Performance

The H2 + CO production rate target can be modified for better utilization of the heat available in the solar gasification reactor. This could reduce the need for defocusing throughout the year. In order to avoid sunlight defocusing, a new simulation was performed with a higher H2 + CO production objective, equaling 1300 NL/s instead of 1000 NL/s. The corresponding yearly results are provided in Table 5. The H2O injection was increased from 0.5 to 0.65 t/h, proportionally to the H2 + CO production target. This resulted in almost null solar heat defocusing throughout the year (0.2%) but caused the overall solar heat share to drop from 22.0% to 17.4%. Indeed, higher autothermal production was performed at night, which did not compensate for the additional solar heat admitted.
Increasing the syngas production objective could prevent sunlight defocusing (at 1300 NL/s and beyond), but systematically decreased the overall solar heat share, thus reducing the benefit of solar heating. A trade-off seems to appear around the syngas production target of 1300 NL/s since the solar heat share is optimized, while the yearly defocusing rate is maintained near zero. One might choose to maintain the production objective below 1300 NL/s to achieve a higher solar heat share despite some defocusing losses. In particular, all calculations featured in the following were performed at the reference 1000 NL/s objective, which allowed us to highlight the necessity of sunlight defocusing. Contrarily, increasing the production objective above 1300 NL/s is encouraged by economic factors, as autothermal gasifiers are generally rentable. However, the increase in the H2 + CO production target also increases the fraction of autothermal heating needed to ensure continuous operation. This would in turn increase yearly CO2 production due to the higher autothermal heating share (the solar heat share is reduced from 22.0% to 17.4% when the H2 + CO production is increased from 1000 to 1300 NL/s and drops to only 14.0% solar heating at 1600 NL/s) and thus increase the syngas post-treatment costs per NL of H2 + CO produced.

3.2.4. Impact of Delay of Plant Actuators

Delays on the reactant distribution devices and heliostat field were implemented to assess their impact on daily results. A basic saturation effect was considered, limiting the variation in wood and O2 injection rates to 1 t/h per minute and setting the duration of complete heliostat field focusing or defocusing to one minute. This is aimed at preventing abrupt feeding rate variations and heliostat movements, which would not be feasible in practice due to technological constraints.
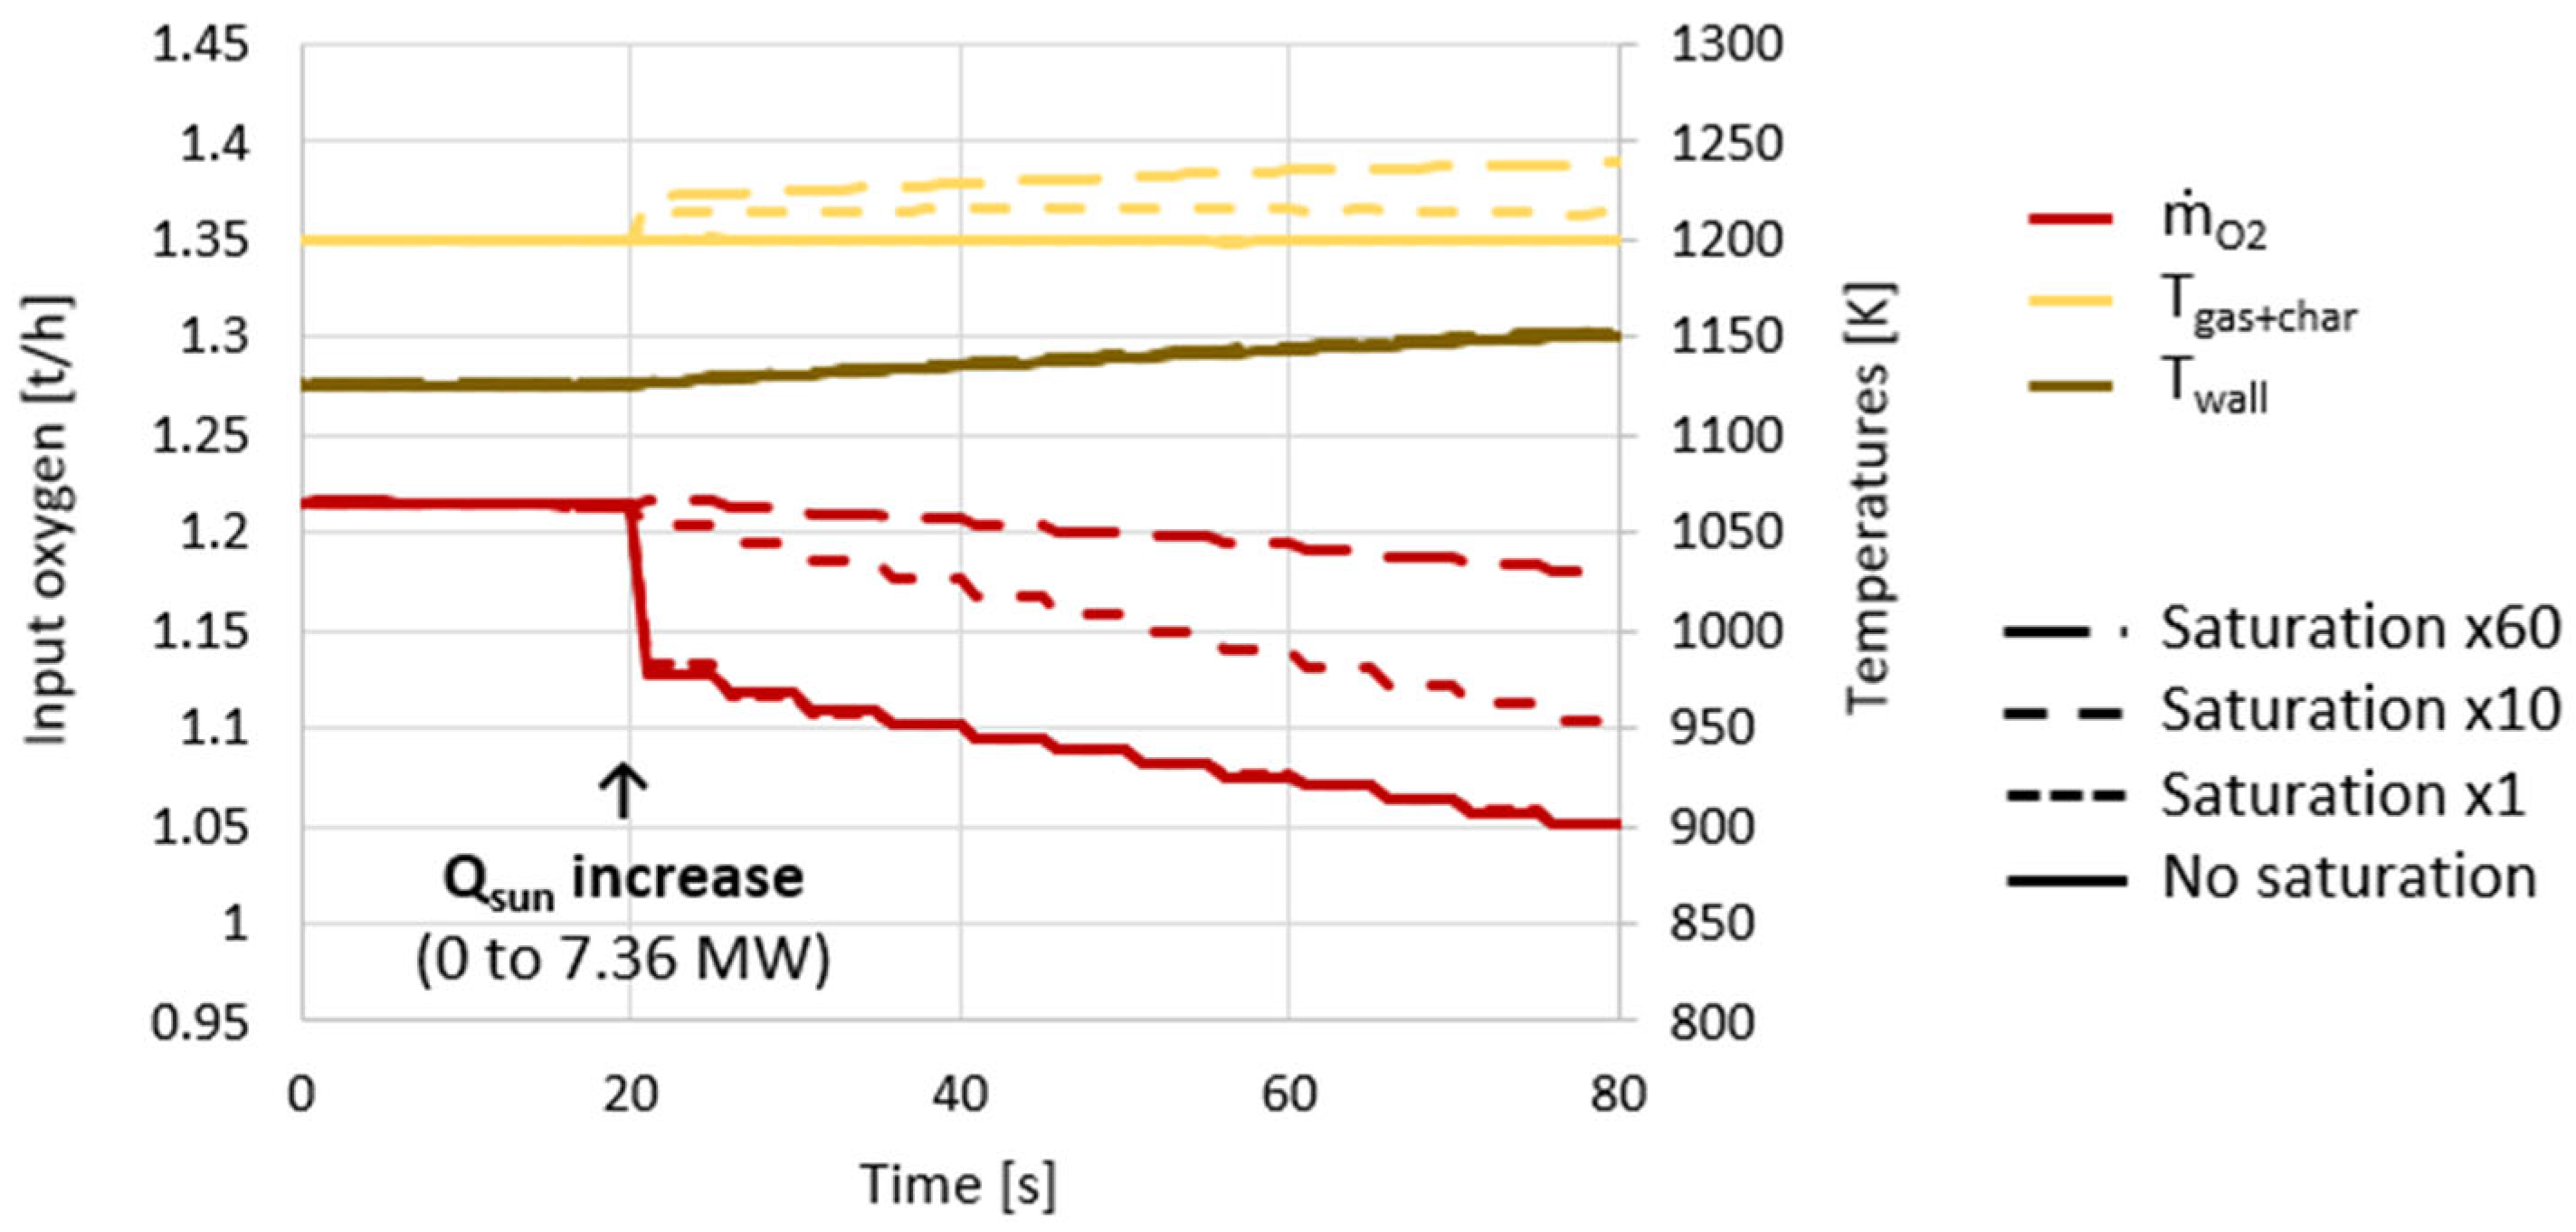
In 8-day reports, such as the one in Table 3, the implementation of this saturation effect did not impact the hybridized gasification results significantly. Even the daily RMSE values for Tgas+char and H2 + CO production were barely affected. This was due to the reactor’s thermal inertia, which efficiently leveled the dynamic control responses during DNI perturbations. Stronger saturation effects had to be applied before clear effects were noticed, as plotted in Figure 5. In this example, a Qsun input step was simulated, starting from steady autothermal operation. The responses of the controlled gasifier were computed in terms of temperatures and O2 injection. No defocusing was simulated at all. When no saturation was implemented, a severe decrease in the O2 injection rate was necessary to maintain Tgas+char at 1200 K as a result of the sharp solar heating increase. The saturation effect described above almost did not impact these responses, as the first 0.083 O2 injection decrease could be performed in 5 s. However, stronger saturation effects (amplified 10- and 60-fold) restricted the O2 injection evolution rates, thus causing an unavoidable error in Tgas+char temperature control.
In summary, 10 MWth upscaled hybrid gasifier dimensioning was proposed to study the application of dynamic control. A MPC algorithm was implemented at small and industrial scale. Reactant pre-heating and wall-to-content heat transfer improvements were necessary to achieve feasible solar operation. For this plant design, syngas production and temperature constraints were successfully applied. The reactor temperature and syngas production rate were maintained stable round-the-clock. Yearly resource savings in comparison with autothermal operations were determined for a H2 + CO production target of 1000 NL/s using real solar irradiation data. The yearly solar heat share was 22%, which dropped when H2 + CO production objectives increased (17.4% at 1300 NL/s). The developed model was thus an efficient tool for demonstrating the feasibility of dynamic control and determining daily to yearly performance outputs with reasonable computational costs. In the following, the feasibility of other gasification strategies for around-the-clock operation will be discussed, featuring solar-only gasification, and hybridization between solar and auxiliary allothermal heat sources.

4. Alternative Control Strategies

This last section investigates alternative strategies for the day–night control of gasification plants at the industrial scale. On the one hand, solar-only gasification is assessed, and heat storage through thermal inertia during the night is discussed. In particular, the fraction of solar energy dedicated to heating the reactor in the morning is quantified, with various starting temperatures. On the other hand, auxiliary external heating of the reactor’s content or wall is assessed (e.g., electrical or combustion-driven). Along with solar power, this second external heat source keeps the reactor at its operating temperature, without modifying syngas composition, as with in situ combustion.

4.1. Solar-Only Gasification

4.1.1. Problem Definition for the Controlled Solar-Only Gasification Process

A new problem formulation was given for the dynamic control of a solar-only gasifier, with the same geometry as the hybrid gasifier. This simplified problem only featured one input, which controlled the injection of feedstock and H2O in constant proportions (ṁH2O:ṁfeed = 0.33, versus ~0.14 at stoichiometry). The cost function, given in Equation (5), was defined so that gasification occurred at Tgas+char = 1200 K. Below this temperature, all solar heat was dedicated to heating the reactor, and the injection rates of all reactants were set to zero. Above this temperature, all excess solar heat was used for gasification by injecting wood and H2O.
min m ˙ feed + H 2 O t T g a s + c h a r t T g a s + c h a r o b j 2

4.1.2. Solar Gasification over Consecutive Days

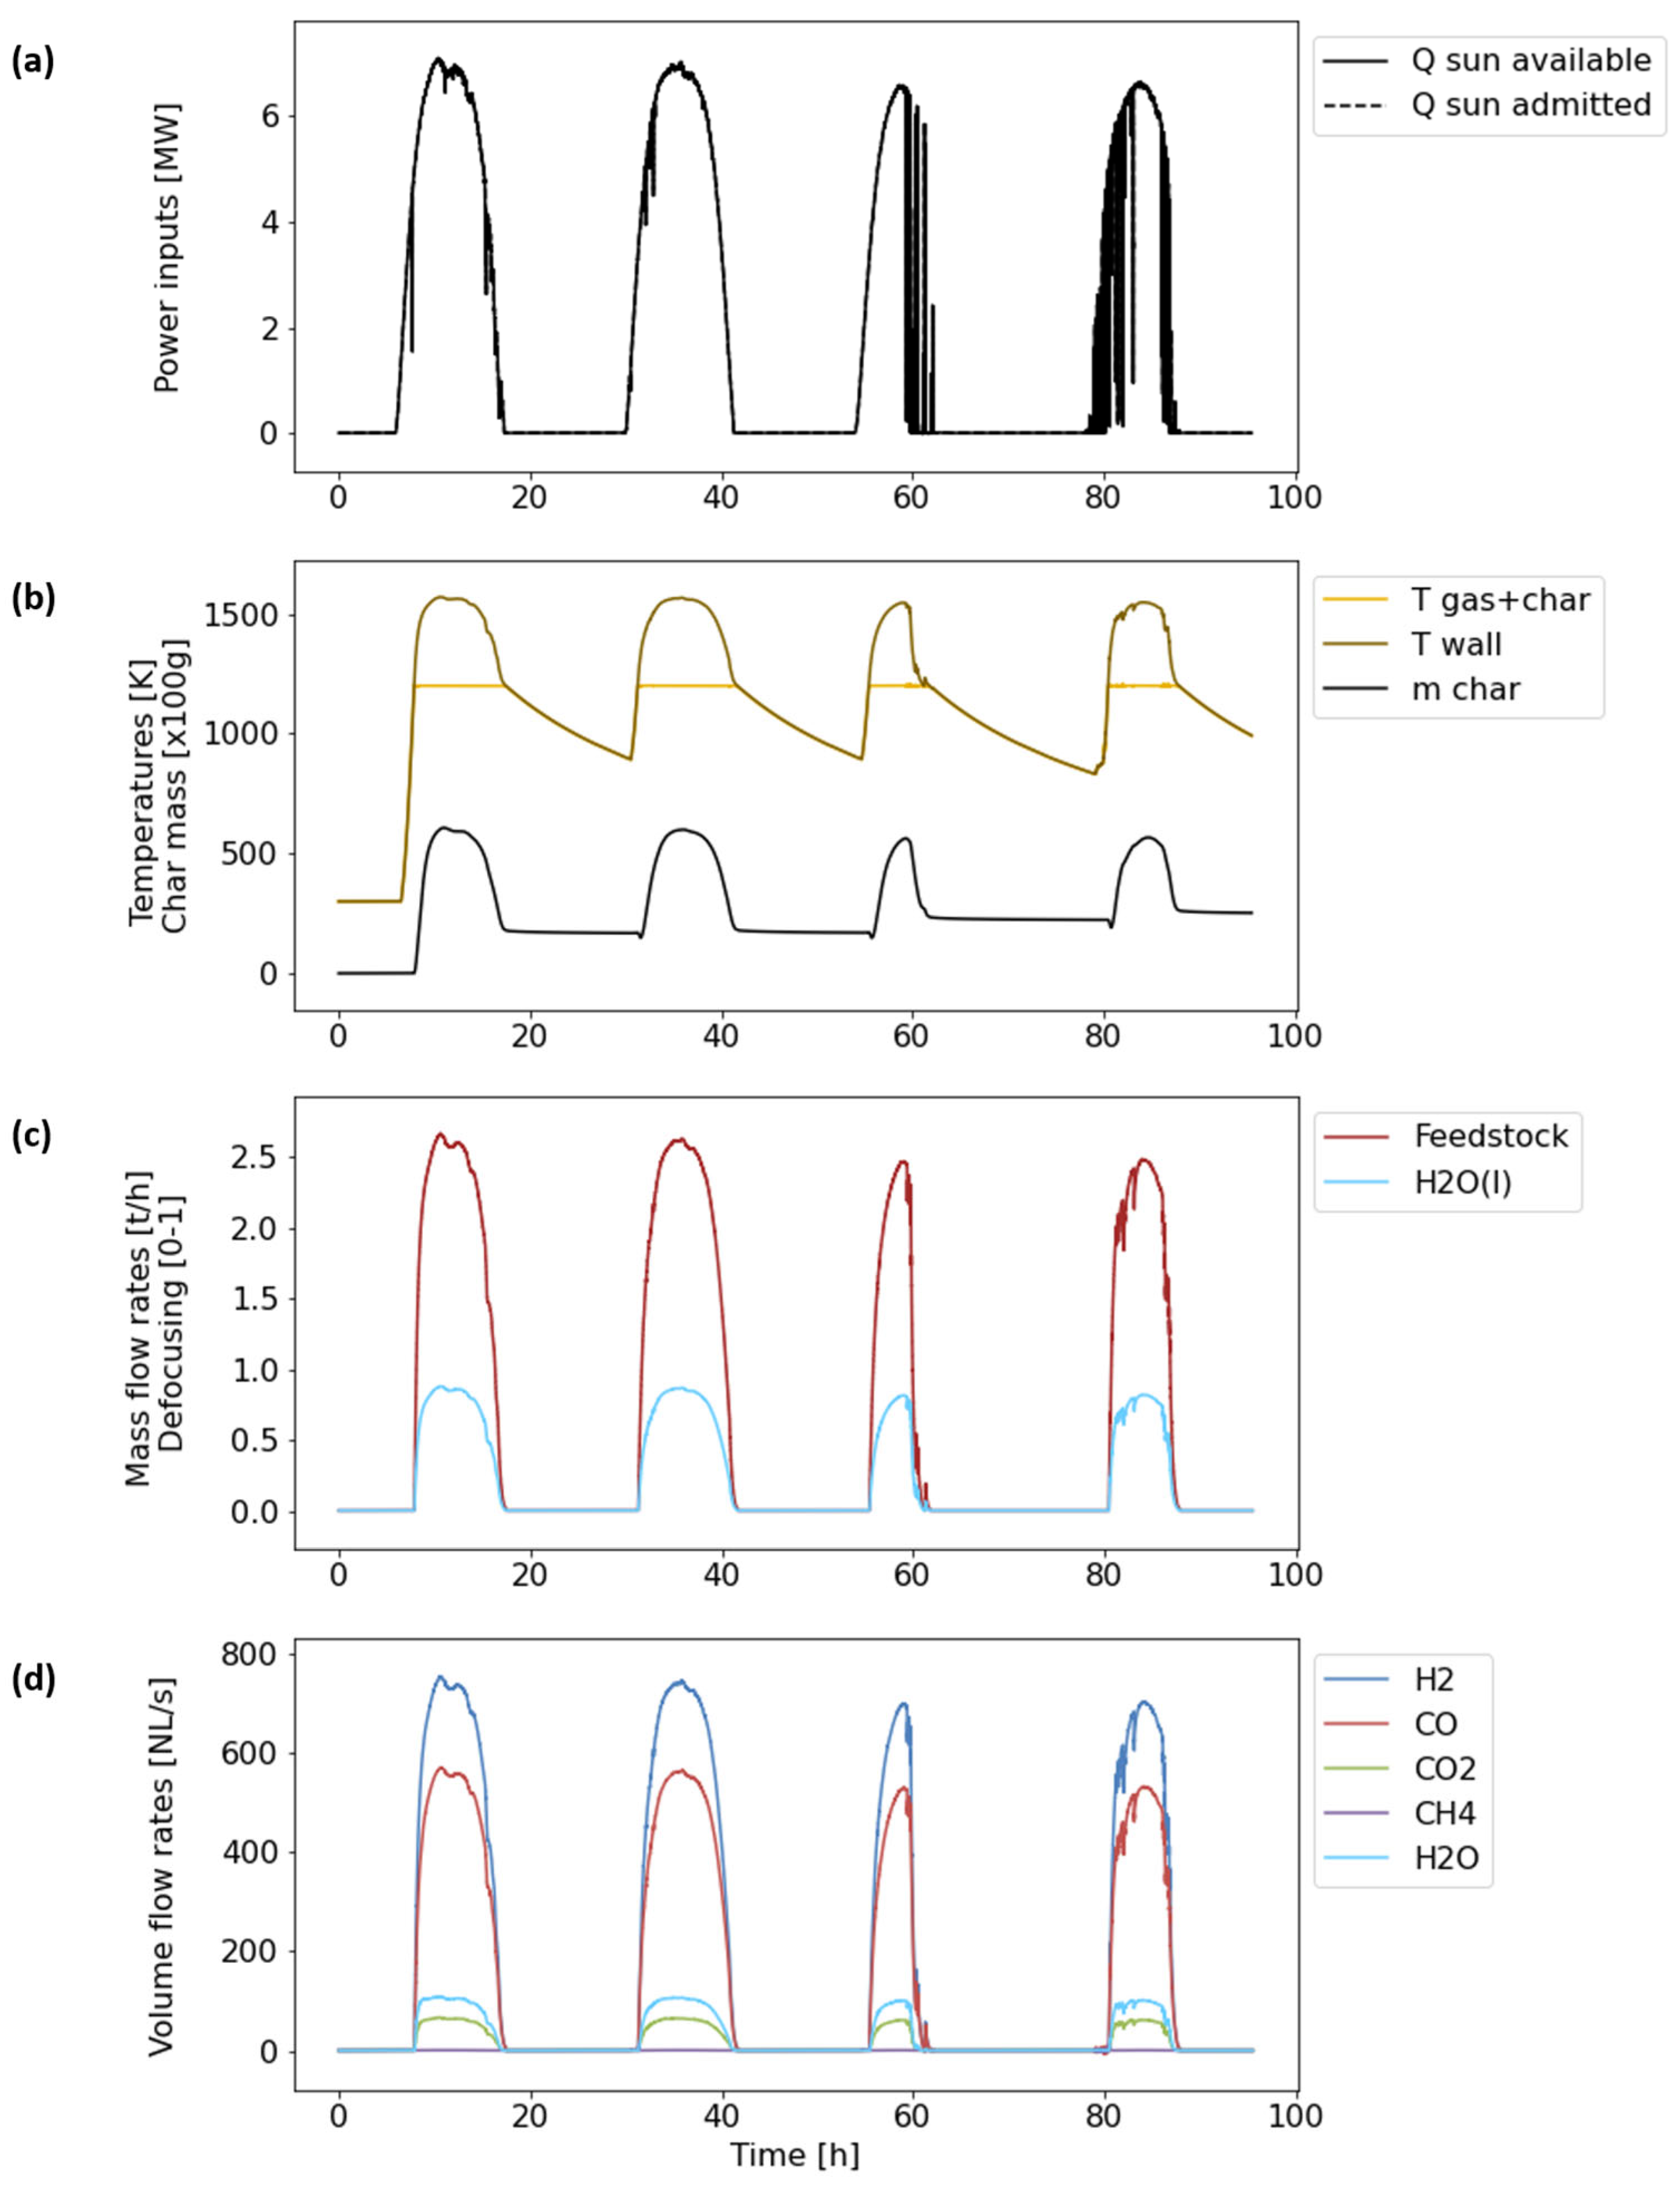
Contrary to other studies, solar-only gasification was first studied over four consecutive days to assess the evolution of temperatures over the day–night cycle. Days with rather favorable weather conditions were selected, from 27 September to 30 September 2018. The new control problem was applied, starting with a reactor at ambient temperature. The results are plotted in Figure 6. During the first day, a period of 1.9 h was necessary to heat the cavity from 300 to 1200 K in the morning. Then, the uninterrupted production of syngas was ensured for over 9.6 h. The wall’s temperature peaked at 1570 K. During the following night, Tgas+char decreased from 1200 to 892 K over 12.6 h, along with the wall’s temperature. This higher starting temperature allowed the reactor to heat in only 1.27 h during the second day, despite a DNI ramp similar to the first day. A similar scenario occurred during the two other days, despite more irregular DNI profiles.
The reactor was maintained at a moderately high temperature at night, thanks to sensible heat storage in the walls. It was, however, insufficient to ensure syngas production in the absence of sunlight. This implied the interruption of all input streams at night, thus immobilizing the remaining char particles (17 kg between days 1 and 2, versus 25 kg after day 4). The daily details of feedstock injection and syngas production rates are provided in Table 6, along with the total solar energy dedicated to syngas production and reactor heating. The energy dedicated to heating was more than twice as high during the first day due to the initial ambient temperature of the reactor. In addition, syngas production was impaired during day 3 and day 4 due to cloudy weather.

4.1.3. Impact of Initial Reactor Temperature

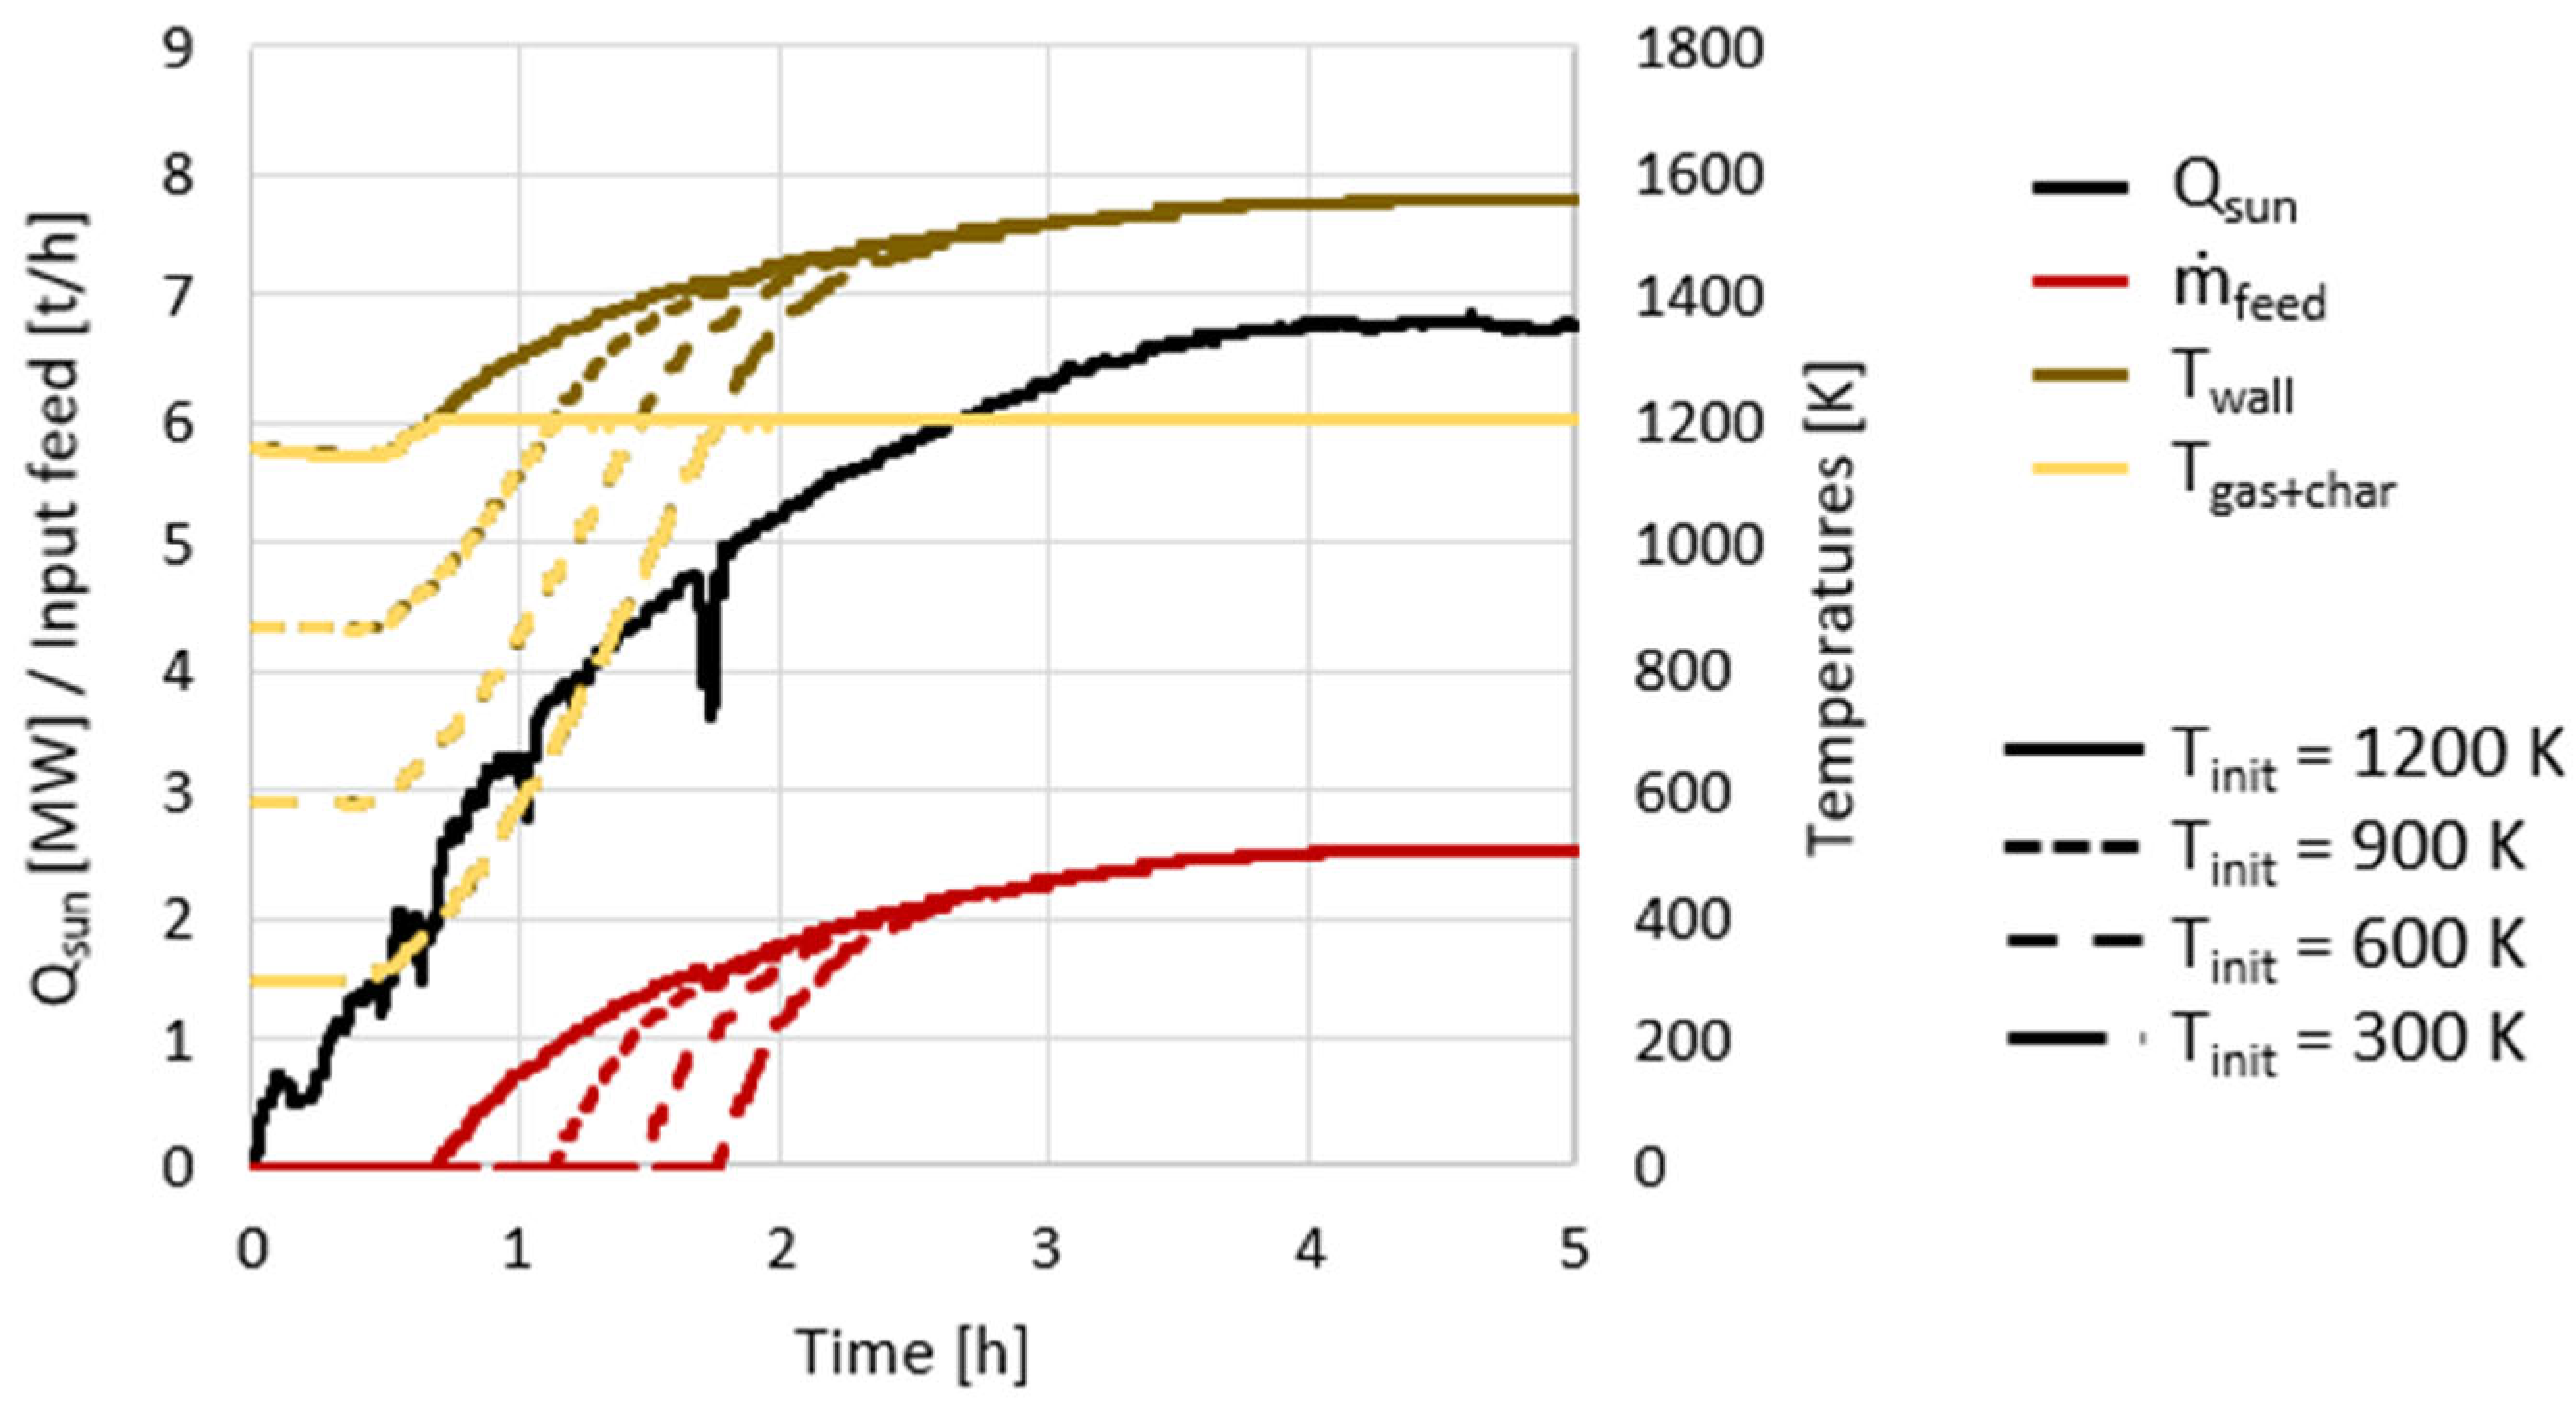
According to the previous section, reactor heating was longer when decreasing the initial reactor temperatures. The reactor startup simulation is illustrated in Figure 7, with initial temperatures of 300, 600, 900, and 1200 K (DNI data from 27 September). Both the temperatures and the feedstock injection rates are plotted. In practice, the temperatures first slightly decreased due to heat losses, while Qsun was insufficient. They only increased again after ~30 min of solar heating. The total durations required to reach 1200 K were 105.6, 87.8, 68.3, and 40.7 min, for Tinit increasing from 300 to 1200 K. Both the temperature and feedstock injection evolution curves reached the same state after ~3h of operation.
The relative variations in feedstock injection and syngas production between the 1200 K case and the other cases are provided in Table 7. These results were averaged from the 8-day sample, simulated independently. In the worst case, at a 300 K initial temperature, the H2 production was impaired by 10.0%. Feedstock and CO flows were impaired differently due to the H2:CO ratio varying through the day (modified chemical equilibria). For initial temperatures between 600 and 900 K, which were often reached for consecutive days of production, the H2 production was only impaired by 3.85% to 6.73%. This remained an acceptable fraction of the potential daily production, which could not be produced because the reactor had to be heated initially.

4.2. External Auxiliary Heating

In the context of hybridization, in situ autothermal heating is one solution among many. In particular, to reduce CO2 emissions, simply electrically heating the reactor could complement solar heating. Combustion of biomass could also be performed in a dedicated circuit to heat the reactor’s walls externally without affecting the composition of the syngas. For that purpose, a new external heat source was implemented and denoted as Qaux. This source can be applied to any of the wall’s inner or outer layers or directly to the reactor’s content (e.g., by pre-heating reactants or inert solid particles).
Hybridized control with solar and auxiliary heat sources was simulated. In comparison with in situ oxy-combustion, auxiliary heating might not affect syngas composition. Still, both the Tgas+char and H2 + CO constraints were implemented, even though H2 and CO production might not vary at all (under a constant temperature). Similarly, the wood injection rate was still considered a reactor input, even though it was unlikely to evolve.

4.2.1. Daily Gasification Profile with Auxiliary Heating

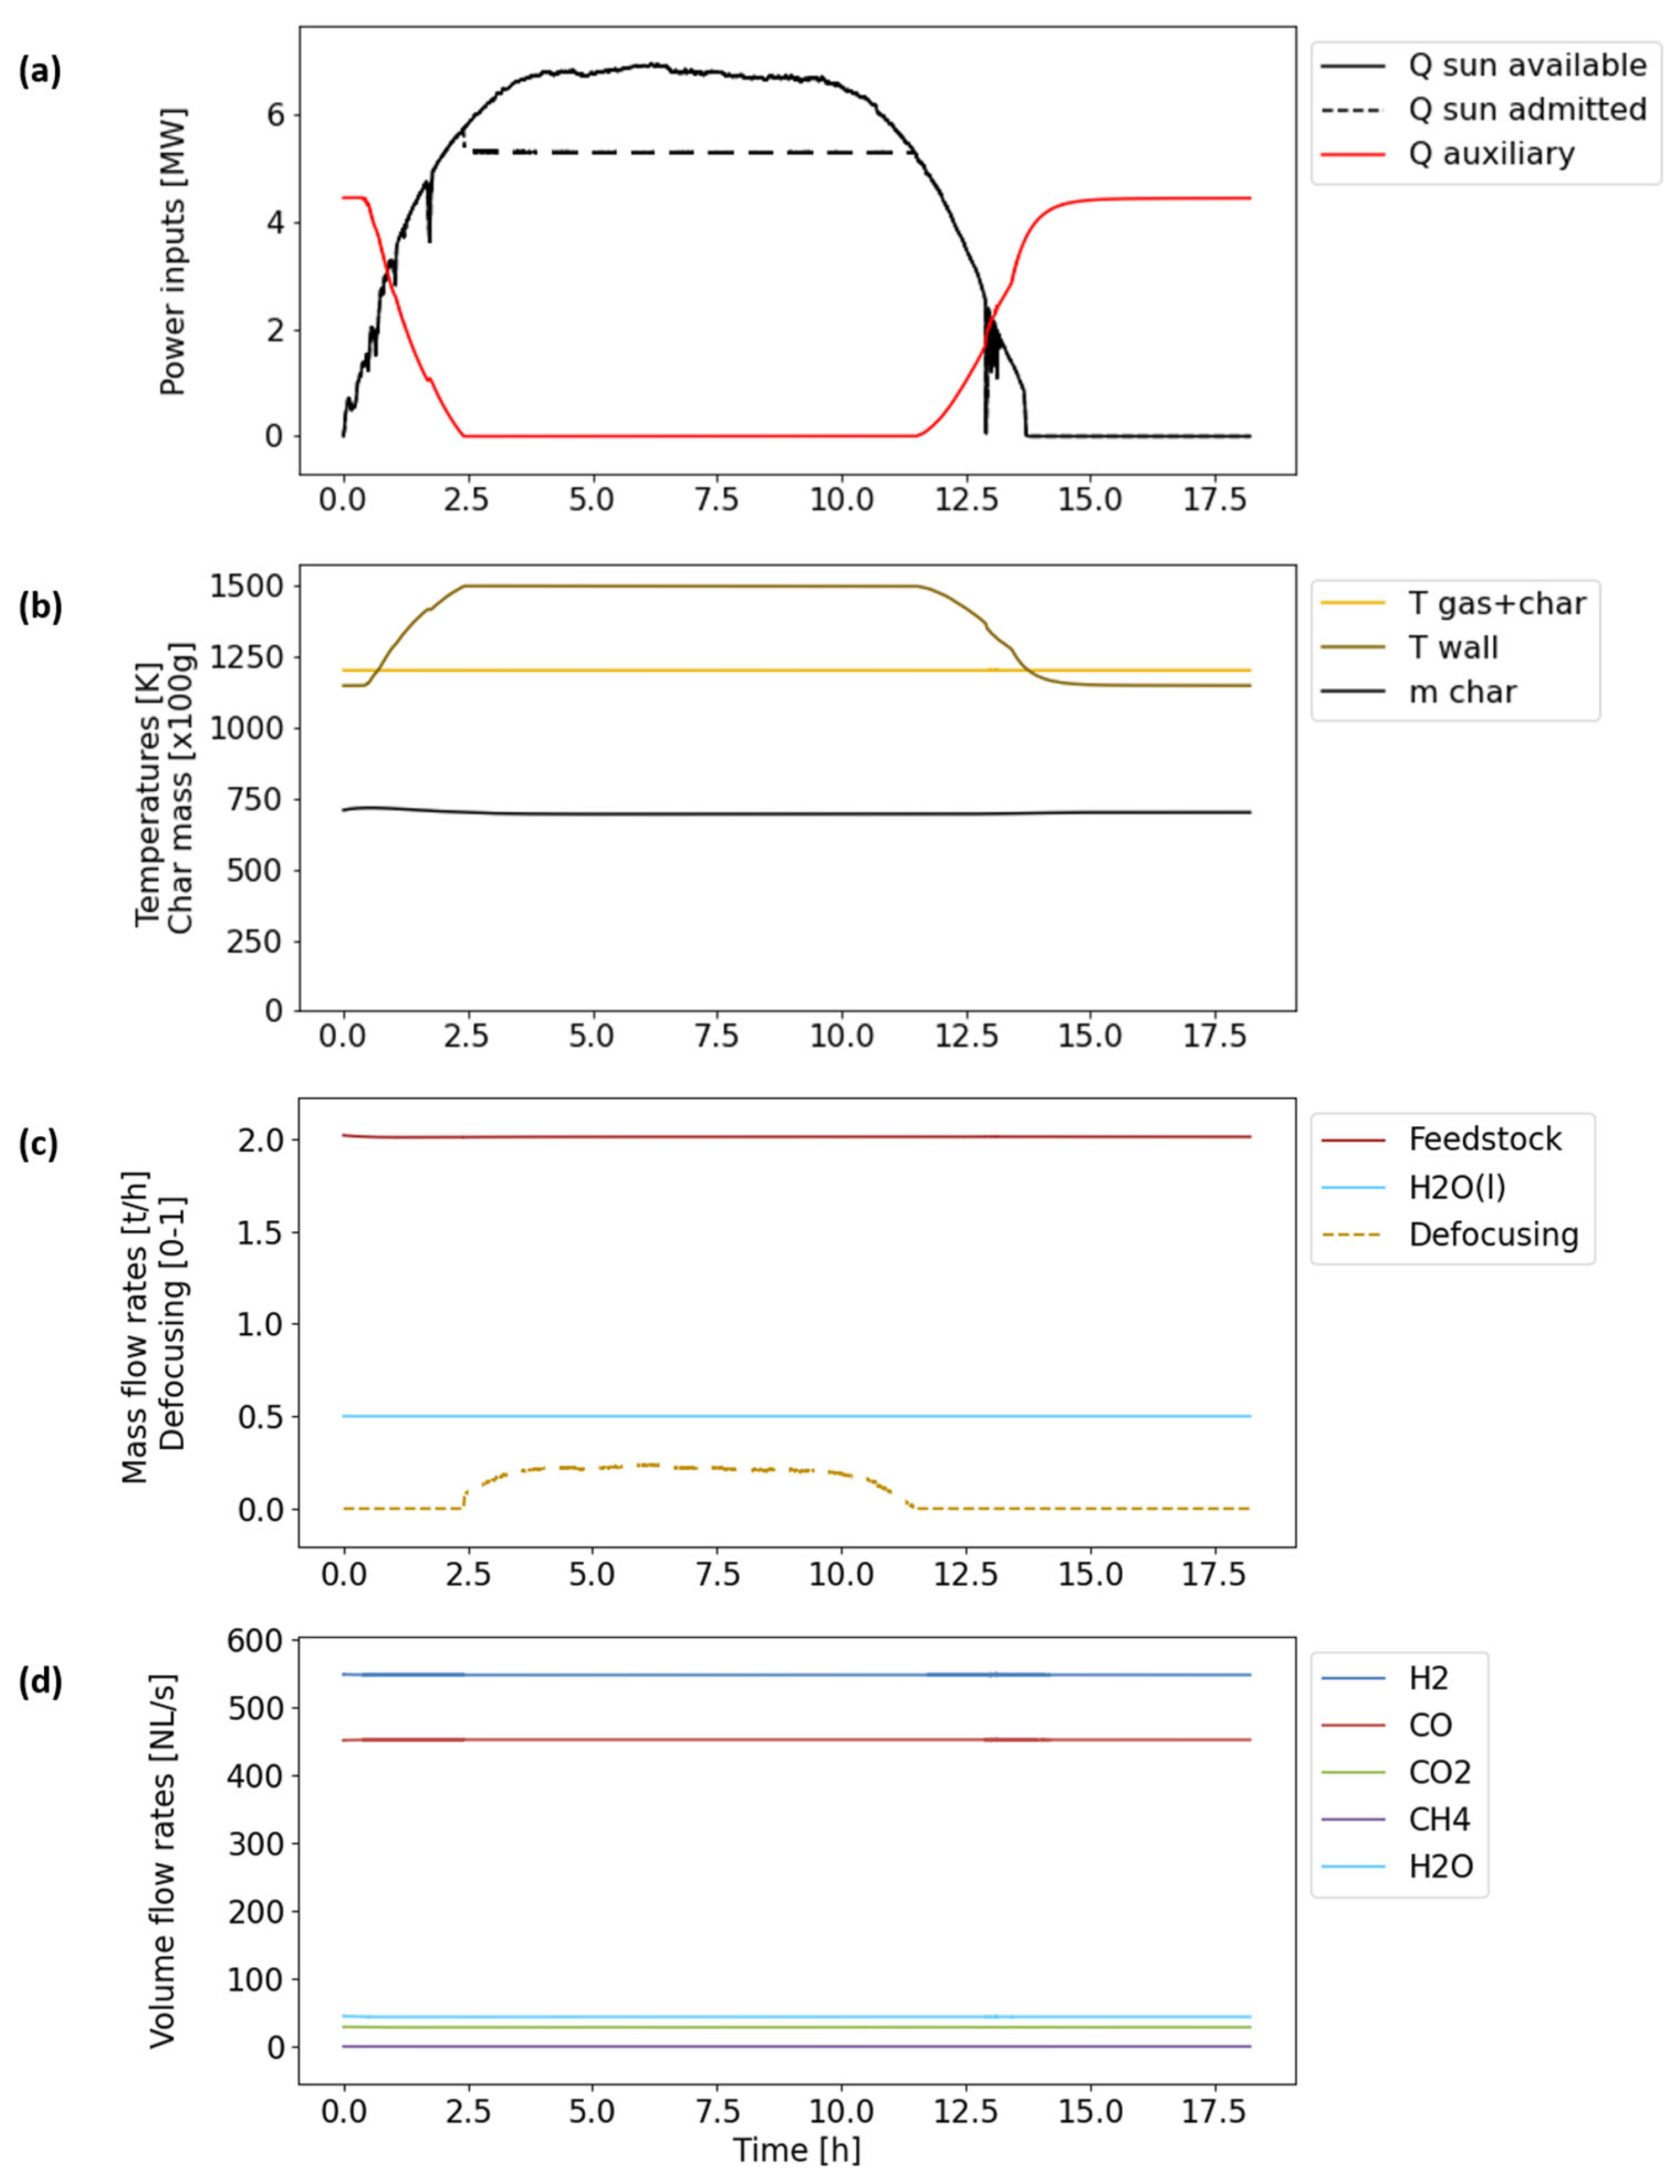
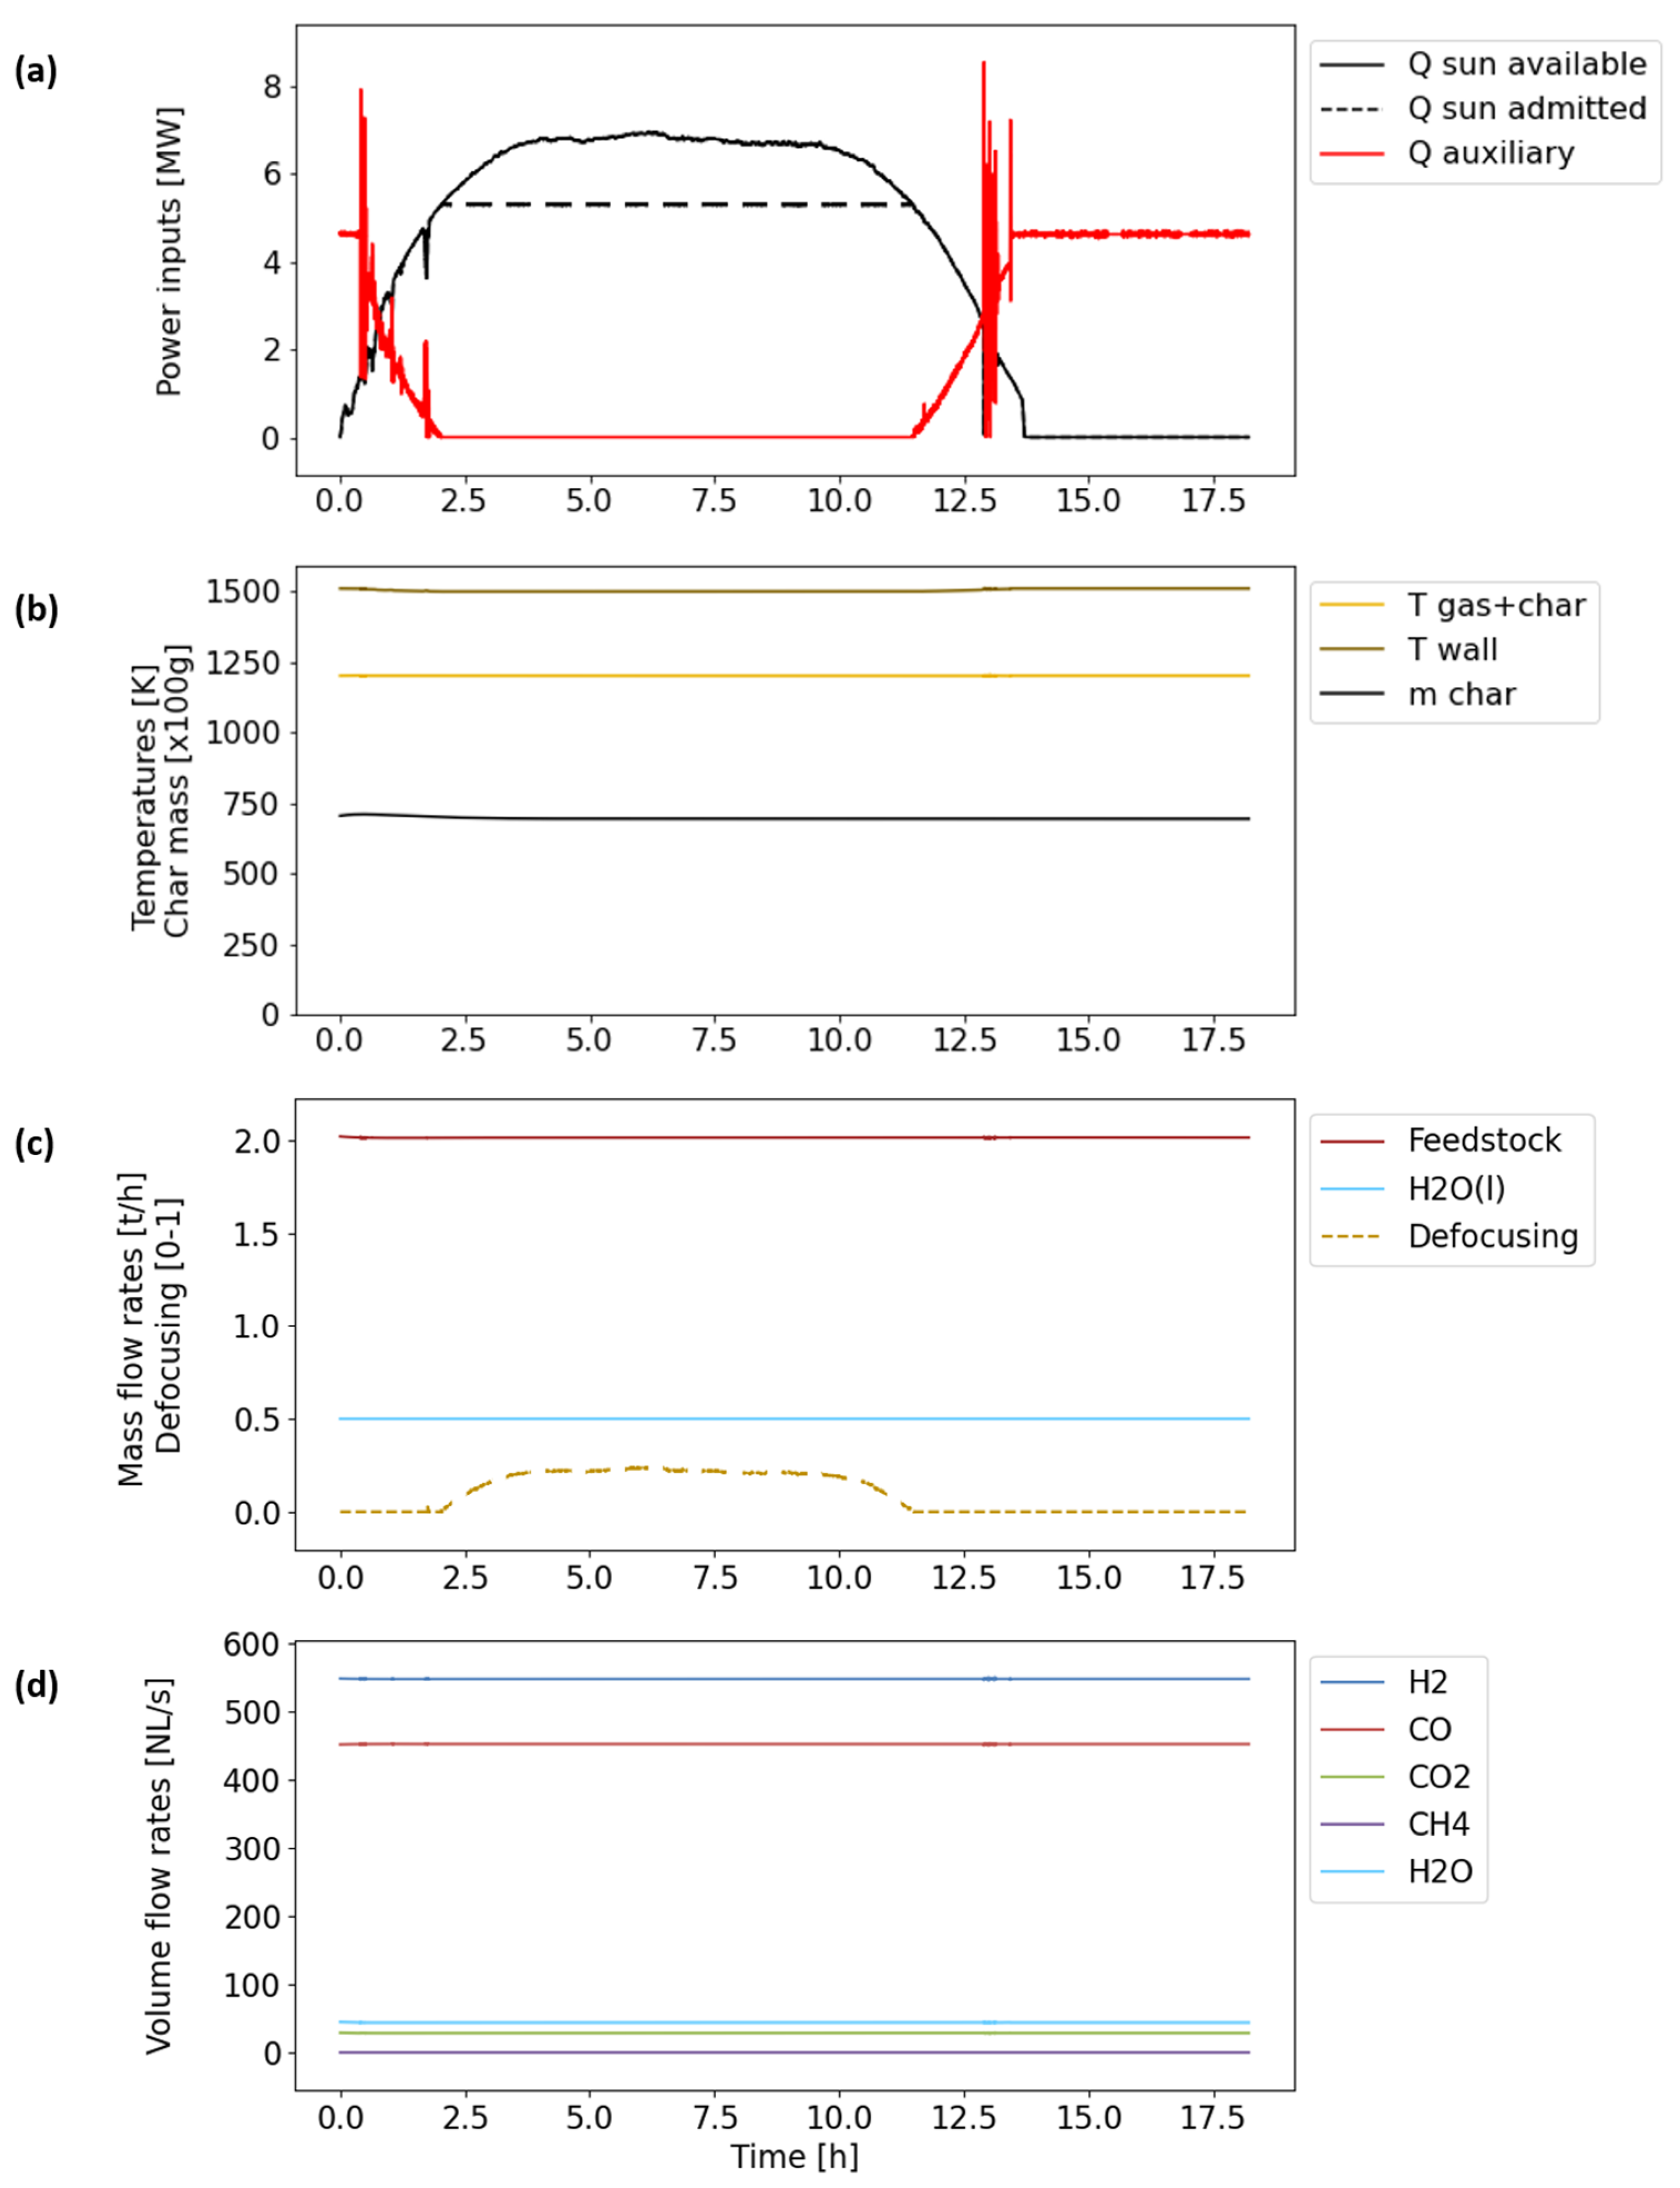
The control problem with auxiliary heat sources is assessed in Figure 8 and Figure 9. Result tables are available in the Supplementary Materials (Tables S3 and S4). The Qaux heat source was applied to the reactor’s content in the first case and to the inner wall layer in the second case.
  • Reactor’s content auxiliary heating:
In the first case, a smooth Qaux evolution profile allowed us to compensate for solar power input variations, thus maintaining the gasifier’s content temperature at 1200 K. The wood injection rate remained at 2.0 t/h, just as during solar operations, and the mass of char in the cavity remained steady. As for previous cases, solar heat defocusing was necessary around midday to avoid overheating. Qsun,2 was capped at 5.30 MWth, and Qaux plateaued at 4.45 MWth at night due to the better thermal efficiency. In comparison, in situ combustion released up to 4.72 MWth at night due to increased wood injection rates and related heating costs (control of H2 + CO).
As expected, all the input and output flow rates remained constant. In comparison with solar–autothermal hybridized gasification (see the results in Table 3), the total CO2 emissions over 8 days were 55 t instead of 205 t, and the total feedstock consumption was 386 t instead of 515 t. No O2 was required at all. This is, however, only true at reactor scale and does not take the Qaux origin into account. Most wood and O2 saved might be used for heat generation or might be substituted with electrical heat, with its own related costs.
  • Reactor’s wall auxiliary heating:
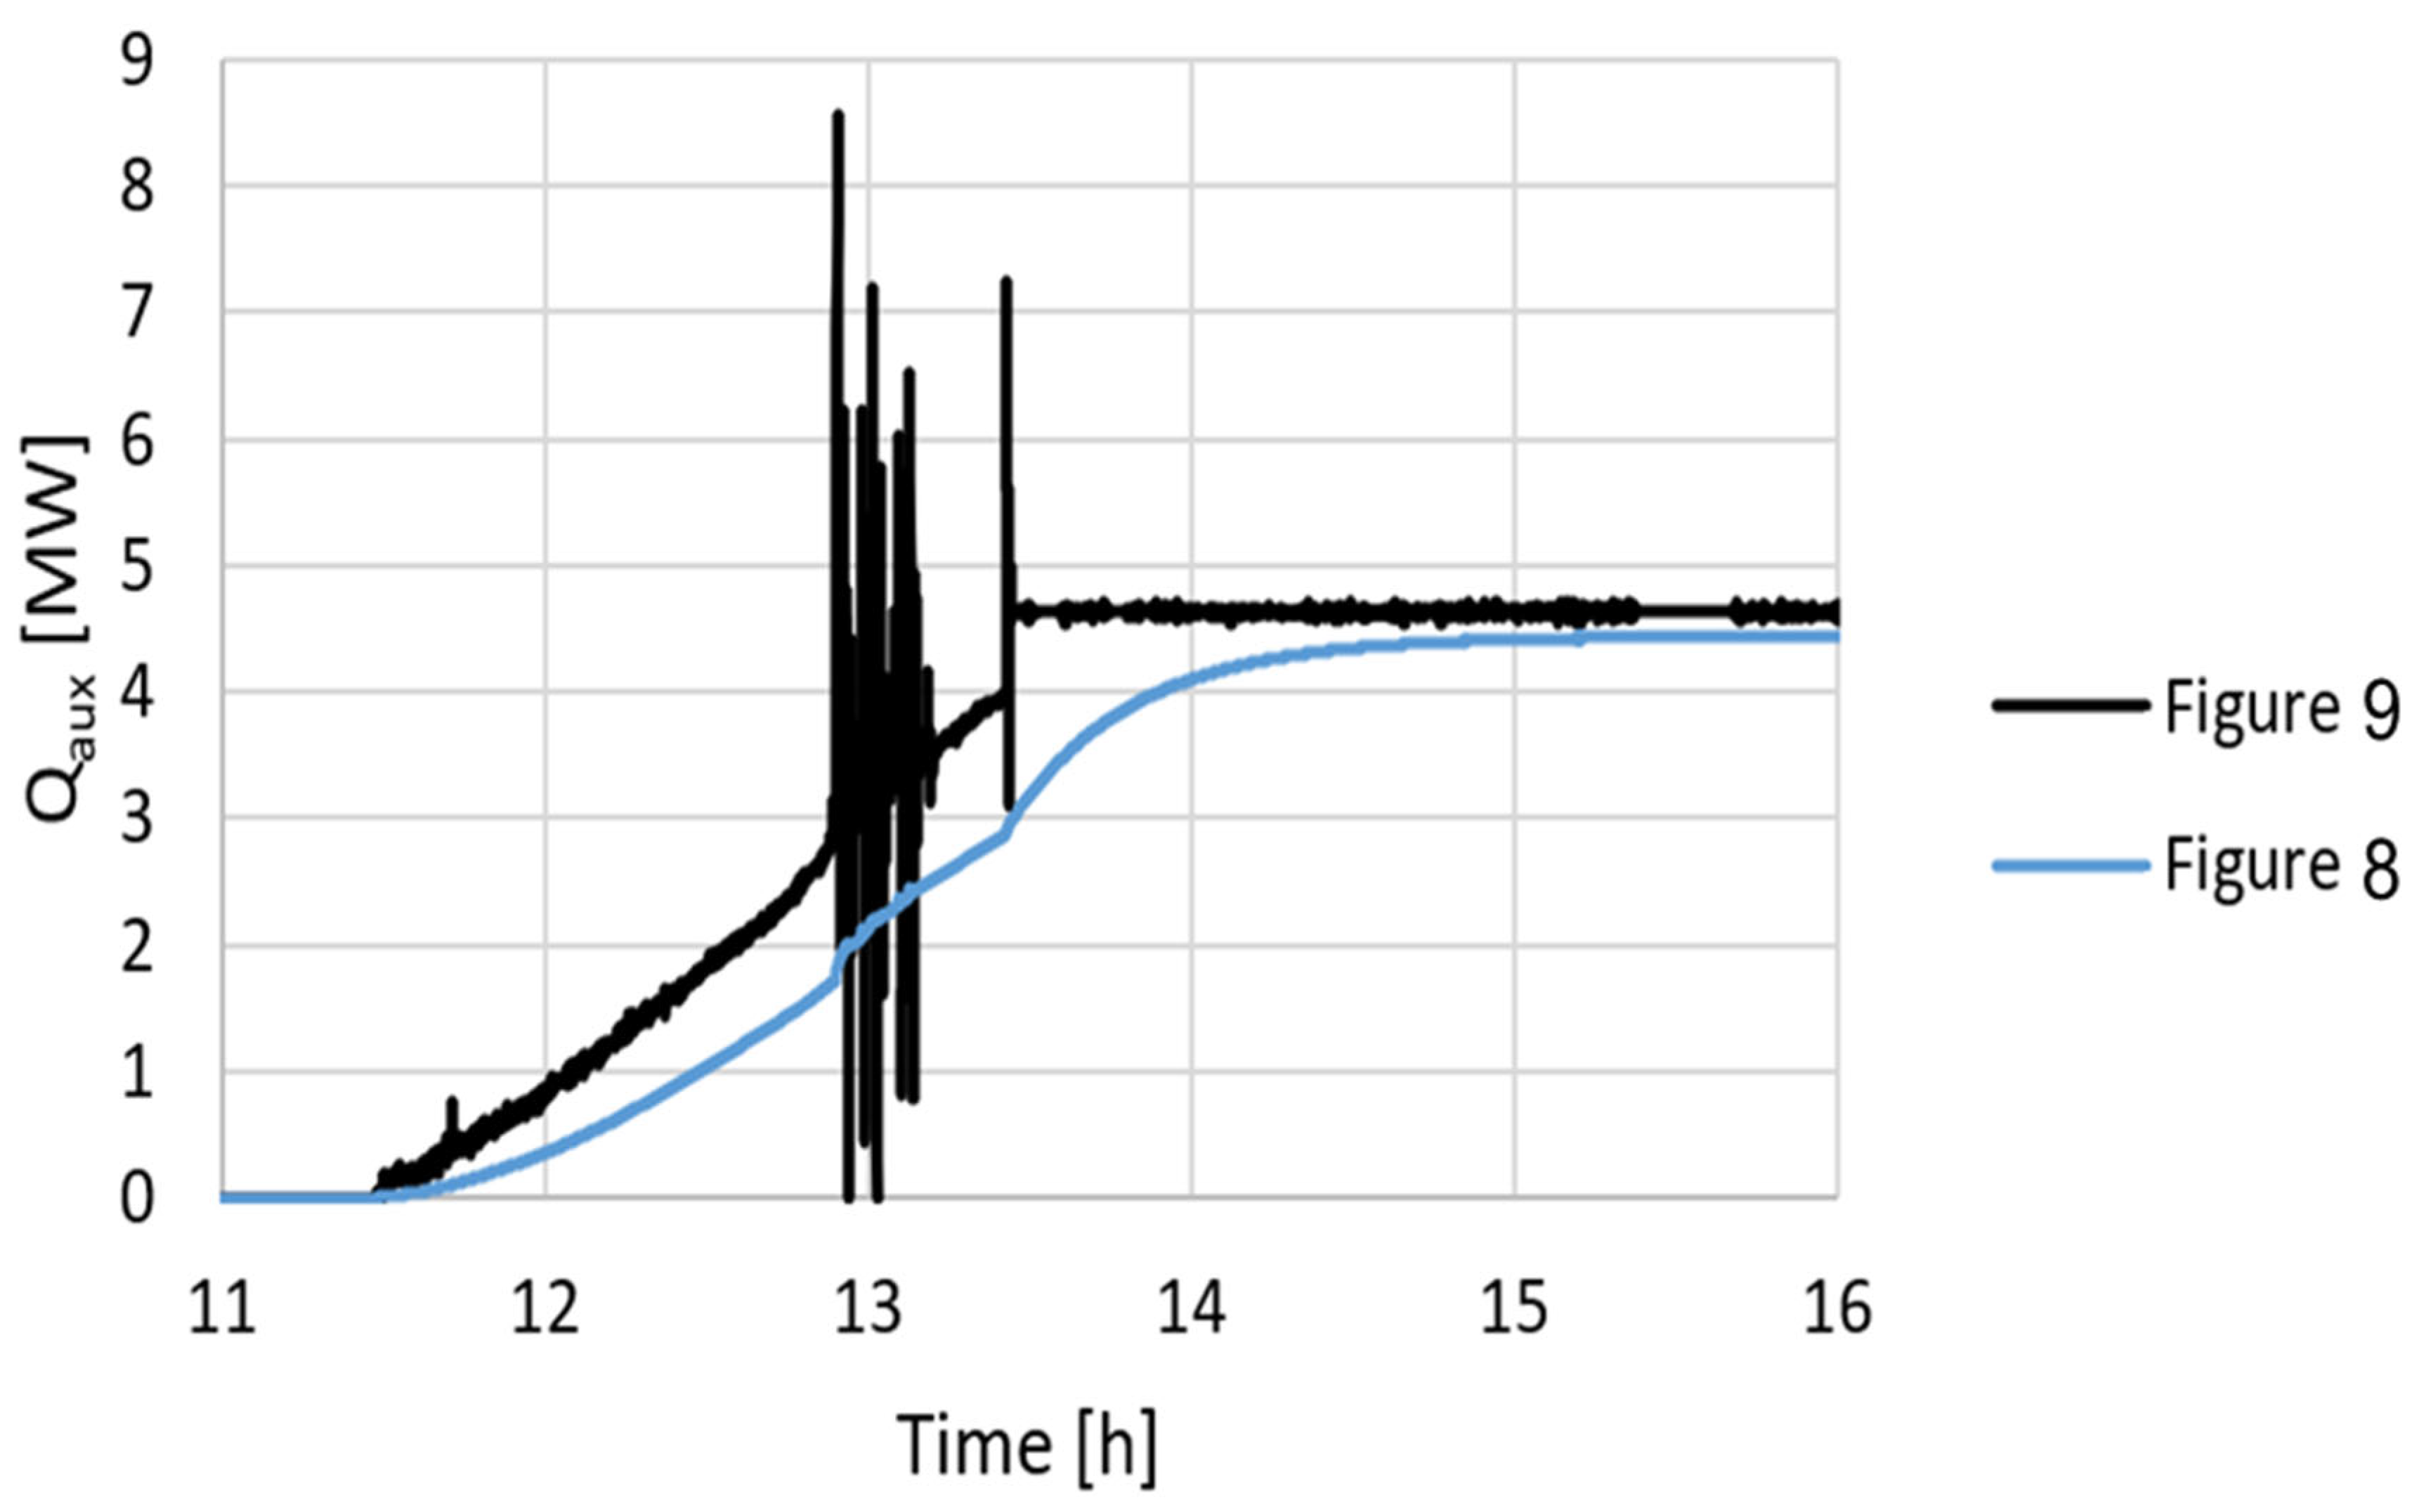
In the second case, the control of Qaux was less precise and required reducing the cost function precision goal from 1 × 10⁻¹ to 1 × 10⁻³. The related computational cost was higher. This was the result of altered reactor controllability, which led to instabilities at the beginning and the end of the day. At night, Qaux was around 4.63 MWth. This was slightly higher than in the first auxiliary heating case (4.45 MWth), as the wall remained around 1500 K and caused higher heat losses. Heat consumption was particularly higher in the evening to maintain Twall at a constant temperature despite a decreasing Qsun. The difference between the two Qaux evolution curves, between t = 11 h and t = 16 h, is plotted in Figure 10. In this lapse of time, auxiliary heating supplied by the walls required 56.2 GJ, versus 47.0 GJ in the first case.
Heating the reactor’s content directly (Figure 8) seemed more advantageous than heating its walls (Figure 9). However, further discussion might emerge when considering the technological aspects. In practice, when heating the gasifier’s content through hot material or electric resistance, one fraction of the heat available is unavoidably transferred to the walls by radiative transfer. The first auxiliary heating case (Figure 8) thus seems less realistic than the second case.

4.2.2. Applications

The main advantage of replacing in situ combustion with auxiliary heating, whatever the corresponding heat source, is maintaining a constant syngas composition with no combustion by-products. This could make operations easier and reduce post-treatment costs. Over the 8-day sample, in the case of reactor wall heating, Qaux equaled 2.34 TJ, which equaled the heat released by in situ combustion in Table 3. As a result, if Qaux was to be delivered by biomass combustion in a dedicated hot circuit for wall heating, similar biomass and oxygen inputs would be necessary for reactor hybridization. The exhaust gas would be separated from the syngas stream, thus facilitating syngas post-treatment and potential carbon capture. However, combustion in a dedicated circuit cannot be 100% efficient. Wood combustion might not be easily controlled either, and the circulation of hot gases for wall heating might cause some delays and intermediate heat losses. This would also require additional capital costs for the building of the dedicated burner and heat exchangers. This is the reason why conventional gasifiers employ in situ combustion instead of a dedicated circuit. Managing a single reactor cavity, with optimized thermal efficiency between the combustion and pyro-gasification sites, seems to be the best solution so far.
The heating of the reactor’s content, rather than the heating of the walls, could be performed by letting hot particles circulate between the gasifier and heating/storage units. Even during the day, when no auxiliary heat is required, including inert particle circulation could help homogenize the gasifier temperatures by enhancing wall-to-content heat transfer. Moreover, unconverted char particles could exit the reactor with the still-hot inert particles and be used as fuel to provide combustion heat in a second cavity, as proposed by Suárez-Almeida et al. [14]. The study of auxiliary heat sources instead of in situ gasification might, therefore, be helped by including heat storage circuits at the cost of a much more complex design of the process. Moreover, heat losses are increased with the addition of each heating, storage, and exchanger unit.
In summary, although focusing mainly on solar–autothermal hybrid gasification, this study showed that other control strategies exist. Solar-only gasification would make the process exclusively solar (not considering the syngas conditioning step), albeit not compatible with constant syngas production. Biomass conversion peaks around 2.5 t/h were noticed during the day, using all the heat available in the solar field. Gasification was stopped at night, but the reactor temperatures remained elevated during consecutive sunny days, thus reducing the share of sunlight dedicated to reactor heating in the morning. At starting temperatures between 600 and 900 K, the time spent heating the gasifier to 1200 K would cut H2 production by 3.85% to 6.73% (in comparison to a reactor initially at 1200 K).
The integration of an external heat source was discussed as well, showing similar heat consumption to in situ oxy-combustion. This method allowed us to maintain a constant syngas composition and thus seemed interesting. However, the computational cost of reactor control was greatly increased. Moreover, the efficiency and carbon impact of external heating would depend greatly on the technical solution retained (electric resistance, dedicated combustion circuit, possible heat storage, etc.). No precise application was proposed, as a complete reactor design comparison might be necessary to draw further conclusions. In particular, related heat exchange efficiency and losses must be carefully modeled, which may reveal some disadvantages in comparison with in situ combustion.

5. Conclusions

Dynamic control of a solar gasification reactor was proposed to maintain a stable reactor temperature and syngas production rate during continuous day and night operations. The dynamic model proposed, with char gasification kinetics and detailed unsteady heat transfer equations, was well suited to assessing the dynamic controllability of a hybridized gasifier. A model predictive control algorithm was implemented, based on reactor state forecasting over multiple time steps. However, it quickly appeared that a simple step-by-step control algorithm was sufficient, provided that small-enough sampling times were considered. A continuous optimization problem was formulated to maintain a constant H2 + CO production rate and the gasifier’s content temperature around the clock. This yielded satisfying control precisions with a 5 s sampling time, despite some severe solar power input evolution. Good robustness was also achieved, always with the same reactor state reached at night (autothermal operation), regardless of its history during the day. This allowed us to decorrelate daily production cases, thus enabling the parallelization of yearly performance calculations.
An upscaled 10 MWth gasifier design was proposed for further investigations. Among other things, reactor upscaling presented a difficulty regarding insufficient wall-to-content heat transfer, which might be handled by implementing technological upgrades (reactant pre-heating, wall fins, inert particles addition, etc.). The resulting yearly performance assessment was performed with solar irradiation data from Targasonne (France). In comparison with autothermal-only gasification, hybridization allowed us to save between 6.2% and 7.6% of the wood resources and between 17.7% and 19.5% of the O2 resources (air combustion was not considered, but might alleviate overall costs). The yearly solar heat share was limited to 17.4% in order to use all the solar power available (ṅH2+CO = 1300 NL/s). Higher solar heat shares could only be achieved at lower H2 + CO production objectives (22.0% at ṅH2+CO = 1000 NL/s), at the cost of substantial sunlight defocusing during the days (7.2% solar heat loss), to avoid reactor overheating.
Other control strategies were also assessed, such as solar-only gasification and hybridization with external auxiliary heating sources. The state-of-the-art already shows that a solar-only gasifier cannot produce a constant flow of syngas throughout the year. However, complex flow sheets have been hypothesized with external combustion chambers, hot inert or reactive particle storage, and separated solar receivers. Separating these chambers seems to be more convenient regarding the process design, but might fail due to thermal efficiency issues. In the present study, even though auxiliary heating seemed to require a similar heat flux to in situ combustion, the efficiency of the corresponding heat source and heat transfer circuits was not considered. Given the various possible sources of external heating (electrical, external combustion, and heat storage), this alternative also appears to be a suitable option for process hybridization with controlled syngas production.

Supplementary Materials

The following supporting information can be downloaded at https://www.mdpi.com/article/10.3390/pr13103109/s1: Figure S1: Time scales of reactor modelling and control algorithm; Figure S2: Operating principle of the solar gasifier reactor: (a) Scheme of considered mass flows and temperatures through the reactor, (b) Scheme of the reactor’s thermal model with the considered heat transfers; Figure S3: Response of the input variable ruling the O2 injection and sunlight defocusing; Figure S4: DNI records of 8 days of the year 2018, in Targasonne (France); Figure S5: Relationship between the 10 MWth solar field efficiency and the sun zenith angle; Figure S6: Daily hybridized gasification with in situ oxygen injection, simulated at industrial scale (for the DNI records of 25 June 2018); Figure S7: Daily hybridized gasification with in situ oxygen injection, simulated at industrial scale on 19 March 2018; Figure S8: Daily hybridized gasification with in situ oxygen injection, simulated at industrial scale on 23 December 2018; Table S1: Comparison between several works, about the 10 MWth spouted-bed gasifier dynamic control ability; Table S2: Default dynamic control and reactor configuration parameters; Table S3: Results of hybridized gasification during the 8-day sample, at industrial scale (auxiliary heating of the content); Table S4: Results of hybridized gasification during the 8-day sample, at industrial scale (auxiliary heating of the wall).

Author Contributions

Conceptualization, A.C., S.R., V.V. and S.A.; methodology, A.C., S.R., V.V. and S.A.; software, A.C., S.R., V.V. and S.A.; validation, A.C., S.R., V.V. and S.A.; formal analysis, A.C., S.R. and S.A.; investigation, A.C., S.R. and S.A.; resources, A.C., S.R., V.V. and S.A.; data curation, A.C., S.R. and S.A.; writing—original draft preparation, A.C.; writing—review and editing, S.R., V.V. and S.A.; visualization, A.C., S.R., V.V. and S.A.; supervision, S.R., V.V. and S.A.; project administration, S.R., V.V. and S.A.; funding acquisition, S.R., V.V. and S.A. All authors have read and agreed to the published version of the manuscript.

Funding

This research received grants from the CEA (French Alternative Energy and Atomic Energy Commission) and the Occitanie Region.

Data Availability Statement

The data are available within the article and its Supplementary Materials.

Conflicts of Interest

The authors declare no conflicts of interest. The funders had no role in the design of the study; in the collection, analyses, or interpretation of the data; in the writing of the manuscript; or in the decision to publish the results. The authors declare that they have no known competing financial interests or personal relationships that could have appeared to influence the work reported in this paper.

Nomenclature

AArea[m2]
CSolar Concentration Factor[-]
CCCalorific Content[J]
CGECold Gas Efficiency [-]
CVCalorific Value[J·Nm−3]
dDiameter[m]
DNIDirect Normal Irradiance[W·m−2]
hf0Standard Enthalpy of Formation[J·kg−1]
HHorizon of the MPC Control Code[-]
LHVLower Heating Value[J·kg−1]
m, ṁMass and Mass Flow Rate[kg], [kg·s−1]
n, ṅAmount of Substance and Molar Flow Rate[mol], [mol·s−1]
QsunSolar Power Input[Wth]
Qsun,1/2Solar Power Delivered by the Concentrator (1)/Absorbed by the Cavity (2)[Wth]
RMSERoot Mean Square Error[unit of data observed]
SFESolar-to-Fuel Efficiency (=ηSF)[-]
tmodelTime Step of the Dynamic Model[s]
tsampl/DNITime Steps Used for Dynamic Control[s]
TTemperature[K]
UOverall Heat Transfer Coefficient[W m−2 K−1]
uiReactor Input (Dynamic Control)[-]
viReactor Output (Dynamic Control)[-]
wiWeight for Dynamic Control Cost Function[-]
αZenith Angle[rad]
γAzimuth Angle[rad]
δshutterLight Fraction Passing Through the Obstructer[-]
εRadiative Emissivity[-]
ηEnergy Efficiency[-]
ηopt,receiverOptical Efficiency of the Solar Receiver[-]

References

  1. Loutzenhiser, P.G.; Muroyama, A.P. A Review of the State-of-the-Art in Solar-Driven Gasification Processes with Carbonaceous Materials. Sol. Energy 2017, 156, 93–100. [Google Scholar] [CrossRef]
  2. Piatkowski, N.; Wieckert, C.; Weimer, A.W.; Steinfeld, A. Solar-Driven Gasification of Carbonaceous Feedstock—A Review. Energy Environ. Sci. 2011, 4, 73–82. [Google Scholar] [CrossRef]
  3. Adinberg, R.; Epstein, M.; Karni, J. Solar Gasification of Biomass: A Molten Salt Pyrolysis Study. J. Sol. Energy Eng. 2004, 126, 850–857. [Google Scholar] [CrossRef]
  4. Matsunami, J.; Yoshida, S.; Oku, Y.; Yokota, O.; Tamaura, Y.; Kitamura, M. Coal Gasification by CO2 Gas Bubbling in Molten Salt for Solar/Fossil Energy Hybridization. Sol. Energy 2000, 68, 257–261. [Google Scholar] [CrossRef]
  5. Muroyama, A.P.; Guscetti, I.; Schieber, G.L.; Haussener, S.; Loutzenhiser, P.G. Design and Demonstration of a Prototype 1.5 kWth Hybrid Solar/Autothermal Steam Gasifier. Fuel 2018, 211, 331–340. [Google Scholar] [CrossRef]
  6. Hathaway, B.J.; Davidson, J.H. Demonstration of a Prototype Molten Salt Solar Gasification Reactor. Sol. Energy 2017, 142, 224–230. [Google Scholar] [CrossRef]
  7. Hathaway, B.J.; Davidson, J.H. Solar Steam Gasification of Cellulose in a Molten Alkali Salt: Salt Chemistry and Reactor Performance. Energy Fuels 2020, 34, 1811–1821. [Google Scholar] [CrossRef]
  8. Bruckner, A.P. Continuous Duty Solar Coal Gasification System Using Molten Slag and Direct-Contact Heat Exchange. Sol. Energy 1985, 34, 239–247. [Google Scholar] [CrossRef]
  9. Zhang, H.; Benoit, H.; Gauthier, D.; Degrève, J.; Baeyens, J.; López, I.P.; Hemati, M.; Flamant, G. Particle Circulation Loops in Solar Energy Capture and Storage: Gas–Solid Flow and Heat Transfer Considerations. Appl. Energy 2016, 161, 206–224. [Google Scholar] [CrossRef]
  10. Xu, G.; Murakami, T.; Suda, T.; Matsuzawa, Y.; Tani, H. The Superior Technical Choice for Dual Fluidized Bed Gasification. Ind. Eng. Chem. Res. 2006, 45, 2281–2286. [Google Scholar] [CrossRef]
  11. Milanese, M.; Colangelo, G.; Laforgia, D.; de Risi, A. Multi-Parameter Optimization of Double-Loop Fluidized Bed Solar Reactor for Thermochemical Fuel Production. Energy 2017, 134, 919–932. [Google Scholar] [CrossRef]
  12. Guo, P.; van Eyk, P.J.; Saw, W.L.; Ashman, P.J.; Nathan, G.J.; Stechel, E.B. Performance Assessment of Fischer–Tropsch Liquid Fuels Production by Solar Hybridized Dual Fluidized Bed Gasification of Lignite. Energy Fuels 2015, 29, 2738–2751. [Google Scholar] [CrossRef]
  13. Suárez-Almeida, M.; Gómez-Barea, A.; Ghoniem, A.F.; Pfeifer, C. Solar Gasification of Biomass in a Dual Fluidized Bed. Chem. Eng. J. 2021, 406, 126665. [Google Scholar] [CrossRef]
  14. Suárez-Almeida, M.; Gómez-Barea, A.; Salinero, J. Design and Performance Analysis of a Solar Dual Fluidized Bed Gasifier. Fuel 2023, 338, 127031. [Google Scholar] [CrossRef]
  15. Bai, Z.; Gu, Y.; Wang, S.; Jiang, T.; Kong, D.; Li, Q. Applying the Solar Solid Particles as Heat Carrier to Enhance the Solar-Driven Biomass Gasification with Dynamic Operation Power Generation Performance Analysis. Appl. Energy 2023, 351, 121798. [Google Scholar] [CrossRef]
  16. Bai, Z.; Hu, W.; Zhu, X.; Wang, S.; Gu, Y. Solar-Driven Biomass Steam Gasification by New Concept of Solar Particles Heat Carrier with CPFD Simulation. Energy Convers. Manag. 2023, 293, 117500. [Google Scholar] [CrossRef]
  17. Li, X.; Shen, Y.; Kan, X.; Hardiman, T.K.; Dai, Y.; Wang, C.-H. Thermodynamic Assessment of a Solar/Autothermal Hybrid Gasification CCHP System with an Indirectly Radiative Reactor. Energy 2018, 142, 201–214. [Google Scholar] [CrossRef]
  18. Hathaway, B.J.; Kittelson, D.B.; Davidson, J.H. Integration of Solar Gasification with Conventional Fuel Production: The Roles of Storage and Hybridization. J. Sol. Energy Eng. 2014, 136, 010906. [Google Scholar] [CrossRef]
  19. Baykara, S.Z.; Bilgen, E. Synthesis Gas and H2 Production from Solar Gasification of Albertan Coal. Energy Convers. Manag. 1985, 25, 391–398. [Google Scholar] [CrossRef]
  20. Kaniyal, A.A.; van Eyk, P.J.; Nathan, G.J. Dynamic Modeling of the Coproduction of Liquid Fuels and Electricity from a Hybrid Solar Gasifier with Various Fuel Blends. Energy Fuels 2013, 27, 3556–3569. [Google Scholar] [CrossRef]
  21. Boujjat, H.; Rodat, S.; Abanades, S. Techno-Economic Assessment of Solar-Driven Steam Gasification of Biomass for Large-Scale Hydrogen Production. Processes 2021, 9, 462. [Google Scholar] [CrossRef]
  22. Ngo, N.K.; Smith, T.; Nathan, G.; Ashman, P.; Hosseini, T.; Beath, A.; Stechel, E.B.; Saw, W.L. Techno-Economic Evaluation of Solar Hybridized Biomass Gasification Polygeneration Plants. Energy Fuels 2024, 38, 2058–2073. [Google Scholar] [CrossRef]
  23. Saw, W.; Kaniyal, A.; van Eyk, P.; Nathan, G.; Ashman, P. Solar Hybridized Coal-to-Liquids via Gasification in Australia: Techno-Economic Assessment. Energy Procedia 2015, 69, 1819–1827. [Google Scholar] [CrossRef]
  24. Guo, P.; Saw, W.; van Eyk, P.; Ashman, P.; Nathan, G.; Stechel, E. Fischer-Tropsch Liquid Fuel Production by Co-Gasification of Coal and Biomass in a Solar Hybrid Dual Fluidized Bed Gasifier. Energy Procedia 2015, 69, 1770–1779. [Google Scholar] [CrossRef]
  25. Siddiqui, O.; Dincer, I.; Yilbas, B.S. Development of a Novel Renewable Energy System Integrated with Biomass Gasification Combined Cycle for Cleaner Production Purposes. J. Clean. Prod. 2019, 241, 118345. [Google Scholar] [CrossRef]
  26. Wu, H.; Liu, Q.; Bai, Z.; Xie, G.; Zheng, J.; Su, B. Thermodynamics Analysis of a Novel Steam/Air Biomass Gasification Combined Cooling, Heating and Power System with Solar Energy. Appl. Therm. Eng. 2020, 164, 114494. [Google Scholar] [CrossRef]
  27. Muroyama, A.; Shinn, T.; Fales, R.; Loutzenhiser, P.G. Modeling of a Dynamically-Controlled Hybrid Solar/Autothermal Steam Gasification Reactor. Energy Fuels 2014, 28, 6520–6530. [Google Scholar] [CrossRef]
  28. Saade, E.; Clough, D.E.; Weimer, A.W. Model Predictive Control of a Solar-Thermal Reactor. Sol. Energy 2014, 102, 31–44. [Google Scholar] [CrossRef]
  29. Boujjat, H.; Yuki Junior, G.M.; Rodat, S.; Abanades, S. Dynamic Simulation and Control of Solar Biomass Gasification for Hydrogen-Rich Syngas Production during Allothermal and Hybrid Solar/Autothermal Operation. Int. J. Hydrogen Energy 2020, 45, 25827–25837. [Google Scholar] [CrossRef]
  30. Rowe, S.C.; Hischier, I.; Palumbo, A.W.; Chubukov, B.A.; Wallace, M.A.; Viger, R.; Lewandowski, A.; Clough, D.E.; Weimer, A.W. Nowcasting, Predictive Control, and Feedback Control for Temperature Regulation in a Novel Hybrid Solar-Electric Reactor for Continuous Solar-Thermal Chemical Processing. Sol. Energy 2018, 174, 474–488. [Google Scholar] [CrossRef]
  31. Piatkowski, N.; Steinfeld, A. Solar-Driven Coal Gasification in a Thermally Irradiated Packed-Bed Reactor. Energy Fuels 2008, 22, 2043–2052. [Google Scholar] [CrossRef]
  32. Zgraggen, A.; Haueter, P.; Maag, G.; Vidal, A.; Romero, M.; Steinfeld, A. Hydrogen Production by Steam-Gasification of Petroleum Coke Using Concentrated Solar Power—III. Reactor Experimentation with Slurry Feeding. Int. J. Hydrogen Energy 2007, 32, 992–996. [Google Scholar] [CrossRef]
  33. Petrasch, J.; Osch, P.; Steinfeld, A. Dynamics and Control of Solar Thermochemical Reactors. Chem. Eng. J. 2009, 145, 362–370. [Google Scholar] [CrossRef]
  34. Boujjat, H.; Rodat, S.; Abanades, S. Solar-Hybrid Thermochemical Gasification of Wood Particles and Solid Recovered Fuel in a Continuously-Fed Prototype Reactor. Energies 2020, 13, 5217. [Google Scholar] [CrossRef]
  35. Hathaway, B.J.; Davidson, J.H. Autothermal Hybridization and Controlled Production of Hydrogen-Rich Syngas in a Molten Salt Solar Gasifier. Int. J. Hydrogen Energy 2021, 46, 15257–15267. [Google Scholar] [CrossRef]
  36. Curcio, A.; Rodat, S.; Vuillerme, V.; Abanades, S. Dynamic Simulation of a Solar-Autothermal Hybridized Gasifier: Model Principle, Experimental Validation and Parametric Study. Chem. Eng. J. 2023, 460, 141682. [Google Scholar] [CrossRef]
  37. Curcio, A.; Rodat, S.; Vuillerme, V.; Abanades, S. Design and Validation of Reactant Feeding Control Strategies for the Solar-Autothermal Hybrid Gasification of Woody Biomass. Energy 2022, 254, 124481. [Google Scholar] [CrossRef]
  38. Karout, Y.; Curcio, A.; Eynard, J.; Thil, S.; Rodat, S.; Abanades, S.; Vuillerme, V.; Grieu, S. Model-Based Predictive Control of a Solar Hybrid Thermochemical Reactor for High-Temperature Steam Gasification of Biomass. Clean Technol. 2023, 5, 329–351. [Google Scholar] [CrossRef]
  39. Nelder, J.A.; Mead, R. A Simplex Method for Function Minimization. Comput. J. 1965, 7, 308–313. [Google Scholar] [CrossRef]
  40. Prins, M.J. Thermodynamic Analysis of Biomass Gasification and Torrefaction. Ph.D. Thesis, Technische Universiteit Eindhoven, Eindhoven, The Netherlands, 2005. [Google Scholar] [CrossRef]
  41. Curcio, A.; Rodat, S.; Vuillerme, V.; Abanades, S. Dynamic Control of a 10 MW Solar-Autothermal Hybrid Biomass Gasifier for Round-the-Clock Processing with Stable Syngas Production. Energy Convers. Manag. X 2025, 26, 100913. [Google Scholar] [CrossRef]
Figure 1. Daily hybridized gasification with in situ oxygen injection, simulated at 1.5 kW laboratory scale: (a) power inputs, (b) temperatures and char mass, (c) reactants flow rates and defocusing, and (d) products flow rates.
Processes 13 03109 g001
Figure 2. Error between the simulated values and control targets for both constraints of Equation (2): (a) H2 + CO production and (b) Tgas+char temperature.
Processes 13 03109 g002
Figure 3. Schematized hybrid gasifier response and calculation mode as a function of solar heat availability.
Processes 13 03109 g003
Figure 4. Temperature and char accumulation evolution for different wall–gas convective heat transfer coefficients (h).
Processes 13 03109 g004
Figure 5. Temperature and O2 injection evolution after a Qsun increase, with several O2 injection saturation effects.
Processes 13 03109 g005
Figure 6. Solar-only gasification over 4 sunny days, simulated at industrial scale: (a) power inputs, (b) temperatures and char mass, (c) reactants flow rates and defocusing, and (d) products flow rates.
Processes 13 03109 g006
Figure 7. Temperature and feedstock injection evolution in the morning, at decreasing starting temperatures.
Processes 13 03109 g007
Figure 8. Daily hybridized gasification with auxiliary heating of the content, simulated at industrial scale: (a) power inputs, (b) temperatures and char mass, (c) reactants flow rates and defocusing, and (d) products flow rates.
Processes 13 03109 g008
Figure 9. Daily hybridized gasification with auxiliary heating of the wall, simulated at industrial scale: (a) power inputs, (b) temperatures and char mass, (c) reactants flow rates and defocusing, and (d) products flow rates.
Processes 13 03109 g009
Figure 10. Evolution of auxiliary heat input during day–night transition, demonstrating the difference between Figure 8 and Figure 9.
Processes 13 03109 g010
Table 1. Simulation results of hybridized gasification throughout the 8-day sample, at the laboratory scale.
Steady State8-Day Simulation
AutothermalAllothermal AutothermalHybridized
Input Feed2.941.11g/min33.826.9kg(−20.6%)
Input O22.32-g/min26.817.9kg(−33.0%)
Input H2O0.200.20g/min2.302.30kg
Total5.461.31g/min62.947.1kg
Output H24.79 × 10−29.22 × 10⁻²g/min0.5520.714kg
Output CO1.801.18g/min20.718.4kg
Output H2O1.481.90 × 10−2g/min17.111.6kg(−32.2%)
Output CO22.141.92 × 10−2g/min24.616.4kg(−33.2%)
Output CH4-8.08 × 10⁻⁵g/min-2.07 × 10−4kg
Total5.461.31g/min62.947.1kg
Input CC53.820.2kJ/min619492MJ
Output CC23.92.29kJ/min275272MJ
CGE0.441.13[-]0.440.55[-]
Qcomb33.5 kJ/min386259MJ(−33.0%)
Qsun,2 45.9kJ/min 181MJShare: 41.1%
SFE 34.7%[-] 40.4%[-]Defoc.: 9.0%
Table 2. Comparison between lab-scale (experimental setup) and industrial-scale (simulation) gasifier dimensions.
Lab ScaleLarge ScaleBoujjat et al. [29]
Qsun,1 [kW]1.510,000 × ηfield(α)10,000 × ηfield(γ,α)
ηopt,receiver0.650.920.92
C~15,00030003000
Fbiomass [t/h]1.2 × 10−42.02.0
daperture [m]1.8 × 10−32.062.06
dcavity [m]7.8 × 10−34.126.40
Awall-gas [m2]1.7 × 10−245.6103
Vcavity [m3]2.4 × 10−440.0140
mwall [t]3.5 × 10−42.59 (e = 7.3 mm)6.22 (e = 7.3 mm)
Table 3. Simulation results for hybridized gasification during the 8-day sample, at industrial scale.
Steady State8-Day Simulation
AutothermalAllothermal AutothermalHybridized
Input Feed2.942.01t/h565515t(−8.9%)
Input O21.180t/h226162t(−28.2%)
Input H2O0.5000.500t/h96.096.0t
Total4.622.51t/h887773t
Output H20.1570.174t/h30.231.1t
Output CO2.232.01t/h429417t
Output H2O0.8230.127t/h158120t(−23.9%)
Output CO21.410.203t/h270205t(−24.2%)
Output CH44.86 × 10−51.92 × 10⁻³t/h9.33 × 10−37.96 × 10⁻²t
Total4.622.51t/h887773t
Input CC53.936.8GJ/h10.39.42TJ
Output CC41.541.2GJ/h7.967.95TJ
CGE0.7701.12[-]0.7700.844[-]
Qcomb17.0 GJ/h3.272.34TJ(−28.3%)
Qsun,2 19.1GJ/h 1.07TJShare: 31.3%
SFE 73.9%[-] 75.8%[-]Defoc.: 8.4%
Table 4. Simulation results for hybridized gasification during the year, at large scale (1000 NL/s H2 + CO production) [41].
Steady StateYearly Simulation
AutothermalAllothermal AutothermalHybridized
Input Feed2.942.01t/h25,80024,200t(−6.2%)
Input O21.180t/h10,3008290t(−19.5%)
Input H2O0.5000.500t/h43804380t
Total4.622.51t/h40,50036,900t
Output H20.1570.174t/h13801410t
Output CO2.232.01t/h19,60019,200t
Output H2O0.8230.127t/h72106020t(−16.5%)
Output CO21.410.203t/h12,30010,300t(−16.7%)
Output CH44.86 × 10−51.92 × 10⁻³t/h0.4262.43t
Total4.622.51t/h40,50036,900t
Input CC53.936.8GJ/h472443TJ
Output CC41.541.2GJ/h363363TJ
CGE0.7701.12[-]0.7700.820[-]
Qcomb17.0 GJ/h149120TJ(−19.6%)
Qsun,2 19.1GJ/h 33.8TJShare: 22.0%
SFE 73.9%[-] 76.2%[-]Defoc.: 7.2%
Table 5. Simulation results for hybridized gasification during the year, at industrial scale (1300 NL/s H2 + CO production).
Steady StateYearly Simulation
AutothermalAllothermal AutothermalHybridized
Input Feed4.002.62t/h35,00032,400t(−7.6%)
Input O21.570t/h13,70011,300t(−17.7%)
Input H2O0.6500.650t/h56905690t
Total6.223.27t/h54,50049,400t
Output H20.2160.226t/h18901870t
Output CO3.062.61t/h26,80025,600t
Output H2O1.070.164t/h93508050t(−13.9%)
Output CO21.880.268t/h16,40013,900t(−15.6%)
Output CH49.10 × 10−52.90 × 10⁻³t/h0.7972.40t
Total6.223.27t/h54,50049,400t
Input CC73.247.9GJ/h641593TJ
Output CC56.953.6GJ/h498483TJ
CGE0.7771.12[-]0.7770.814[-]
Qcomb25.3 GJ/h222173TJ(−21.9%)
Qsun,2 24.3GJ/h 36.4TJShare: 17.4%
SFE 74.2%[-] 76.7%[-]Defoc.: 0.2%
Table 6. Details of the four days of solar-only gasification illustrated in Figure 6.
Day 1Day 2Day 3Day 4
Input feed [t]19.2420.388.9713.78
Output H2 [t]1.721.830.801.23
Output CO [t]18.2819.438.4613.13
Output CO2 [t]3.313.491.562.36
Qsun production [TJ]187.4198.788.8133.7
Qsun heating [TJ]17.267.207.477.72
Table 7. Impact of reactor heating duty on gasification results, at decreasing initial temperatures.
1200 K900 K600 K300 K
Input feed [t]-−3.45%−6.90%−9.48%
Output H2 [t]-−3.85%−6.73%−10.0%
Output CO [t]-−2.73%−6.36%−9.64%
Disclaimer/Publisher’s Note: The statements, opinions and data contained in all publications are solely those of the individual author(s) and contributor(s) and not of MDPI and/or the editor(s). MDPI and/or the editor(s) disclaim responsibility for any injury to people or property resulting from any ideas, methods, instructions or products referred to in the content.