Article

Radiation and Combustion Effects of Hydrogen Enrichment on Biomethane Flames

by
Francisco Elmo Lima Uchoa Filho
1,
Helton Carlos Marques Sampaio
1,
Claudecir Fernandes de Freitas Moura Júnior
1,
Mona Lisa Moura de Oliveira
2,
Jesse Van Griensven Thé
3,4,
Paulo Alexandre Costa Rocha
1,* and
André Valente Bueno
1
1
Laboratory of Hydrogen and Thermal Machines, Federal University of Ceará, Block 718 Pici, Fortaleza 60020-181, CE, Brazil
2
State University of Ceará, Av. Dr. Silas Munguba, 1700, Fortaleza 60714-903, CE, Brazil
3
School of Engineering, University of Guelph, 50 Stone Rd E, Guelph, ON N1G 2W1, Canada
4
Lakes Environmental, 170 Columbia St. W, Waterloo, ON N2L 3L3, Canada
*
Author to whom correspondence should be addressed.
Processes 2025, 13(4), 1048; https://doi.org/10.3390/pr13041048
Submission received: 20 February 2025 / Revised: 13 March 2025 / Accepted: 28 March 2025 / Published: 1 April 2025
(This article belongs to the Special Issue Biomass to Renewable Energy Processes, 2nd Edition)

Abstract

:
Hydrogen has been presented as a promising energy vector in decarbonized economies. Its singular properties can affect important aspects of industrial flames, such as the temperature, emissions, and radiative/convective energy transfer balance, thus requiring in-depth studies to optimize combustion processes using this fuel isolate or in combination with other renewable alternatives. This work aims to conduct a detailed numerical analysis of temperatures and gas emissions in the combustion of biomethane enriched with different proportions of hydrogen, with the intent to contribute to the understanding of the impacts of this natural gas surrogate on practical combustion applications. RANS k- ω and k- ϵ turbulence models were combined with the GRI Mech 3.0, San Diego, and USC mechanisms using the ANSYS-Fluent 2024-R2 softwareto evaluate its performance regarding flame prediction. The Moss–Brookes model was adopted to predict soot formation for the methane flames by solving transport equations for normalized radical nuclei concentration and the soot mass fraction. The Discrete Ordinates (DOs) method with gray band model was applied to solve the Radiation Transfer Equation (RTE). The results of the experiments and numerical simulations highlight the importance of carefully selecting turbulence and chemical kinetics models for an accurate representation of real-scale industrial burners. Relative mean errors of 1.5% and 6.0% were registered for temperature and pollutants predictions, respectively, with the USD kinetics scheme and k- o m e g a turbulence model presenting the most accurate results. The operational impacts of hydrogen enrichment of biomethane flames were accessed for a practical combustion system. With 15% of hydrogen blending, the obtained results indicate a 73% penalty in CO emissions, an increase of 6% in NO emissions, and a 34 K flame temperature increase. Also, a reduction in flame radiation due to hydrogen enrichment was observed for hydrogen concentrations above 20%, a behavior that can affect practical combustion systems such as those in glass and other ceramics industries.

1. Introduction

Hydrogen H2 has gained prominence recently as a vector fuel for decarbonization strategies. In the face of regulation policies, rising investments, and market demand, low-emission hydrogen production has grown from 1 metric ton per year (Mtpa) to 49 Mtpa, corresponding to 50.5% of the global hydrogen demand in 2023 [1]. On the other hand, due to their high dependence on fossil fuels, the industrial and transportation sectors are responsible for 25% and 20% of the greenhouse gas emissions [2], being potential consumers of the hydrogen generated.
As the threat of global warming has worsened in recent decades, significant investigation has been conducted on hydrogen production [3,4,5], storage [6,7], transportation [8], and end use [9,10]. Several researchers have studied the impacts of hydrogen-blended fuels on engines [11,12] and industrial burners [13] to reduce greenhouse gas emissions from the existing fossil fuel-consuming infrastructure. Hosseini et al. [14] conducted a comprehensive review of hydrogen in dual-fuel diesel engines, highlighting the impossibility of simultaneously improving performance and exhaust emissions indicators. However, these authors also indicate promising results regarding using hydrogen as a fuel additive with parameter adjustments, engine modifications, and catalyst improvements. Gupta et al. [15] focused on ammonia (NH3) as an alternative hydrogen-related energy vector, conducting experiments burning CH4-NH3 blends in a single-cylinder engine. Their results show a rise in in-cylinder pressure for up to 40% of NH3 fraction. Although higher fractions of NH3 may harm the engine physically, lower ones lead to promising use of this vector.
On the other hand, industrial and domestic burners may play an essential role in the H2 gradual adoption [16]. Abdin [17] highlighted the prominence of methane (CH4) on the transition of energy sources and the prospects of CH4-H2 co-firing advantages and main challenges. Bueno et al. [18] set guidelines for the safe blending of H 2 in existing natural gas distribution lines, focusing on the characteristics of the net supplying Fortaleza city. The authors found a safe range between 2% and 3% for immediate use, and a limit of 10% was prospected when adequate H2 embrittlement studies were carried out [19]. Hasche et al. [20] conducted experimental research on burning CH4-H2 blends with pure O2. Flame temperatures of up to 2050 ° C were reached, and controlled injection of N2 evidenced the increase in NOx emissions with the H2 ratio growth. Gee et al. [21] studied natural gas and H2 mixtures in different proportions in a non-premixed turbulent flame. Their results showed a 33% reduction in emitted radiation and a 380% increase in NOx emissions.
Computational fluid dynamics (CFD) techniques have become important when a deeper understanding of combustion processes became imperative for the recent search for efficiency and emission control. Liu et al. [13] developed a numerical simulation of an industrial burner reaching optimal parameters for lower NOx emissions, which were closely related to the H radical. Rahimi et al. [22] developed a CFD code using the OpenFOAM platform, aiming to understand the influences of H2 on a CH4 flame by using different injection slots in a stratified industrial burner. Hydrogen addition resulted in lower CO emissions levels but, on the other hand, increased NOx emissions. For stratified burn cases, a maximum flame temperature of 2000 K was reached with methane combustion, which was raised to 2300 K for the 40% H2 blend case. Kruljevic et al. [23] modeled a swirled partially premixed hydrogen-air flame with two different hydrogen injection flows, focusing on the OH radicals formation. They found a close relation between the heat release rate and the OH radicals in lean regions of the flame and evidence of higher amounts of OH in the burnt gases in conditions close to stoichiometry.
Moreover, when dealing with complex chemical reactions, which impact flow dynamics through intense energy exchanges, such as in combustion, CFD software ANSYS FLUENT 2024-R2 relies on chemical-kinetic mechanisms specially developed for the fuels involved in the specific problem. When burning biomass, gasified gas Zhou et al. [24] found that the GRI-mech 3.0 [25] mechanism showed the highest accuracy for predicting adiabatic laminar burning velocity for nearly stoichiometric ratios. The UCSD mechanism [26], on the other hand, performed better for predicting the overall activation energy. In contrast, USC-Mech I I [27] displayed the best overall performance. Assessing chemical-kinetic mechanisms for different CH4-H2 blends and equivalence ratios, Ji et al. [28] found that USC-Mech I I performed better for H2 ratios lower than 30%, while UCSD had the best overall performance. Al-ajmi et al. [29] ran Ansys Fluent models with Reynolds-average Navier–Stokes (RANS) framework, k- ϵ turbulence model, mixture fraction/PDF approach, and GRI 3.0 mechanism. A temperature peak of 2080 K was found only for pure H2, while the remaining CH4-H2 blends reached maximum values around 1900 K. On the other hand, NOx emissions reached lower values for 50 % and 75 % of H2 in the mixture.
The glass production industry plays a relevant role in the recent climate crisis derived from the global energy demand. Zier et al. [30] placed this sector third in energy consumed per product mass, mainly due to the high temperature required for the raw glass melting, between 1470 K and 1870 K. High-temperature demand would favor replacing CH4 with hydrogen burners, leading to further decarbonization potential. Daurer et al. [31] conducted extensive CFD simulations using two validated industrial glass melting furnace models, assessing CH4-O2 and H2-O2 flame shapes and temperatures. The authors found that the flame momentum increases with the hydrogen fuel concentration, increasing the turbulence levels, accelerating the reaction kinetics, and raising the flame temperature. Such a faster and more intense burn led to a flame length 25% shorter and an average temperature increase of 82 K. Kuzuu et al. [32] related an increase in OH radical on quartz glass tube to hydrogen-oxygen flame blowing. The same team, in Kokubo et al. [33], tested the impact of OH flame concentration on the quality of microscopic spectroscopy lenses. The flame hydrolysis deposition technology for silica glass synthesis was modeled by Yao et al. [34], highlighting that temperature, droplet diameter, and OH radicals influence the homogeneity of the synthesis. The authors obtained the best silica conversion with stoichiometric ratio burning a H2-O2 blend, but hydrogen excess can provide lower OH radical concentration in the glass structure.
Adopting H2 as primary or co-fired fuel for general-purpose burners or sensitive oxy-fuel processes still requires further research. Also, due to its particularities, the glass industry demands special attention to H2 burn inherited factors such as flame temperature and H2O concentrations. Continuous glass melting furnaces with burners placed by the bottom of the melting bed strongly rely on thermal radiation for hot spot glass heating [30]. Thus, changes in the radiative behavior of the flame due to hydrogen injection might be of great relevance for industrial process retrofitting. More complex glass manufacturing, such as for synthetic silica glass, also relies on pure O2-H2 combustion seeking very low OH radicals presence to improve glass homogeneity and lifetime [32,33]. Lastly, the H2 implementation is justified mainly by its potential for low carbon impact, which should not allow the intensification of NOx emission, which always requires close emission monitoring.
Therefore, the main objective of this article is to assess the thermal behavior and relevant chemical composition of the CH4-H2 blend combustion using a validated numerical model. A CFD model of an industrial burner was developed using ANSYS-Fluent 2024-R2 software and validated using data collected from biomethane combustion. Three chemical-kinetic mechanisms were considered, and the validated model simulated the combustion of different CH4-H2 blends. Lastly, the most relevant flame parameters for the glass industry—flame temperature, radiation changes, H2O and OH concentration changes for each scenario, and total emissions—were assessed.

2. Materials and Methods

The validation data used in the model were taken by the Associated Laboratories of Innovation and Sustainability (LAIS) at the State University of Ceará (UECE). LAIS has a fully monitored burn chamber that runs gas combustion tests using a Weishaupt WG 5 F/1ALNR 1/2” burner. Two Omega 250 SLPM mass flow controllers (FMA-2611A-I) were used for fuel metering and control. The combustion gases composition was determined using a Seitron Chemist 900 portable analyzer, which integrates both NDIR and electrochemical technologies, allowing simultaneous measurement of CO2 (IR), CO (IR), NO/NOx, NO2, SO2, and CxHy (IR).
Five K-type thermocouples with plugs were used in the combustion chamber and along the chimney. The thermocouple positions were 0.21 m (Flame), 0.78 m (Furnace), 1.01 m (CH1), 1.48 m (CH2), and 1.92 m (CH3) downstream of the fuel injector, according to the scheme presented in Figure 1. A heater placed before the burner regulates fuel and inlet air temperatures. Gas samples are taken by the end of the chimney duct for instantaneous emission analysis. Mass flow, exhaust gas composition, and temperature data were acquired at 1 Hz sampling frequency, with a total experiment time comprising 4000 s.
The local supplier, CEGAS, provided the biomethane samples for the study. The gas composition was determined by chromatographic analysis, following the requirements of ASTM D 1945:1996 [35], ISO 6974:2000 [36], and ISO 6975:1997 [37] standards. It was carried out using a portable micro-CG model CP 490 from Agilent Scientific Instruments, Santa Clara, CA, USA, with two channels: a CP Sil 5 CB column and a PoraPLOT U column. An injection time of 40 ms and a run temperature of 85 ° C were adopted. Concentrations of the following species were identified and quantified: methane (CH4), ethane (C2H6), propane (C3H8), n-butane (i-C4H10), n-pentane (C5H12), and carbon dioxide (CO2). The biomethane’s main composition is in Table 1.
Due to their low relevance in physical properties and thermodynamic combustion behavior, n-butane, i-butane, and n-pentane were included as propane without compromising the results.

2.1. Numerical Model

The CFD model and simulation were conducted using the ANSYS Fluent software. Temperature, radiation heat transfer, and species concentration values were obtained from the simulations via the ANSYS FLUENT Results Reports module. For the combustion, two runs were concatenated: firstly, the steady diffusion flamelet model was applied to predict the flame and its disturbance by turbulence; secondly, after its convergence, the unsteady diffusion flamelet model was used, due to its capacity of more accurately prediction of the formation of slow-evolving species, such as gaseous pollutants or products in liquid reactors when compared to the steady diffusion flamelet model. It simplifies complex chemical calculations by reducing them to a single dimension, making it much faster than other models, such as the laminar finite-rate, Eddy Dissipation Concept (EDC), or Probability Density Function (PDF) transport models, which perform calculations in two or three dimensions.

2.1.1. Chemical Kinetics Mechanisms

Satisfactory results for CH4 and H2 combustion have been reported using GRI-Mech 3.0, UCSD, and USC-Mech I I chemical-kinetic mechanisms. Extensive validating tests were conducted in this paper, and those mechanisms were coupled with two different turbulence models. The CHEMKIN II [38] database was adopted to calculate the species’ thermo-physical properties with the three considered mechanisms.
The GRI-Mech 3.0 mechanism was utilized without modifications, as it already contained all the relevant chemical species for the simulation, including those associated with pollutant formation. However, the USC-Mech I I and UCSD mechanisms did not account for the formation of NOx, a crucial aspect for analyzing combustion products. The Zeldovich mechanism, which describes the thermal formation of NOx, was incorporated into the model to address this limitation. The implementation was carried out directly in the chemical kinetics file, ensuring the accurate representation of these processes in the simulation.

2.1.2. Governing Equations

Transport equations for continuity, momentum, species, and energy were solved with the ANSYS Fluent platform. Chemical reactions were addressed with detailed kinetics schemes based on the CHEMKIN II platform, which was coupled to a non-adiabatic, non-premixed combustion flame model. The considered transport equations are as follows:
Continuity equation:
ρ t + ( ρ v ) = S m
where ρ is the density, v is the velocity vector, and S m is the mass source term.
Conservation of momentum:
( ρ v ) t + · ( ρ v v ) = p + · ( τ = ) + ρ g + F
where τ = is the stress tensor, g is the gravity, and F is the term for external body forces.
Energy equation:
t ( ρ H ) · ( ρ v H ) = k t c p H + S h
where k t is the turbulent thermal conductivity, c p is the specific heat, S h is a source term that accounting radiation effects, and H is the total enthalpy defined in Equation (4), where Y j is the mass fraction of each j species and H j is the standard enthalpy.
H = j Y j H j
Species transport was accounted for with a convection–diffusion equation for each species, shown in Equation (5). In this equation, J i is the diffusion flux of species I, R i is the net rate of production of species by chemical reaction, and S i is the rate of creation by addition from the dispersed phase plus any user-defined sources.
t ( ρ Y i ) + ( ρ v Y i ) = · J i + R i + S i

2.1.3. Turbulence Models

The turbulent swirl-induced jets with concentric nozzle fuel injection studied here presented Re = 7500, characterized as fully turbulent flows. For the standard k- ϵ model, proposed by Launder and Spalding [39], the Reynolds averaged approach results in the following two additional transport Equations (6) and (7) for the turbulent kinetic energy k and dissipation rate ϵ :
t ( ρ k ) + x i ( ρ k u i ) = x j μ + μ t σ k k x j + G k + G b ρ ϵ Y M + S k
t ( ρ ϵ ) + x i ( ρ ϵ u i ) = x j μ + μ t σ e ϵ x j + C 1 ϵ ϵ k ( G k + C 3 ϵ G b ) C 2 ϵ ρ ϵ 2 k + S ϵ
Turbulence kinetic energy generation is calculated in two terms: G k due to the mean velocity gradients and G b due to buoyancy. μ t is the turbulent viscosity, Y M represents the contribution of the fluctuating dilatation in compressible turbulence to the overall dissipation rate. σ k and σ ϵ are the turbulent Prandtl numbers for k and ϵ . S k and S ϵ are user-defined source terms. C 1 ϵ , C 2 ϵ , C 3 ϵ are model constants.
For the k- ω SST model, developed by Menter [40], the turbulence-related closure demands an equation for the turbulent kinetic energy k and other for the specific dissipation rate ω :
t ( ρ k ) + x i ( ρ k u i ) = x j Γ k k x j + G k Y k + S k
t ( ρ ω ) + x j ( ρ ω u j ) = x j Γ ω ω x j + G ω Y ω + D ω + S ω
In this model, G k is the production of turbulence kinetic energy. G ω is the generation of ω . Γ k and Γ w represent the effective diffusivity of k and ω , respectively. Y k and Y ω are terms for the dissipation of k and ω due to turbulence. D ω is the cross-diffusion term. S k and S ω are user-defined source terms.
The standard set of constants from Launder and Spalding [39] were applied for standard k- ϵ : C 1 ϵ = 1.44 , C 2 ϵ = 1.92 , σ k = 1.0 , and σ ϵ = 1.3 . C 3 ϵ is described for:
C 3 ϵ = t a n h | v u |
where v is the component of the flow velocity parallel to the gravitational vector and u is the component of the flow velocity perpendicular to the gravitational vector.
For k- ω SST, Menter [40] and Wilcox et al. [41] proposed the following constants: σ k , 1 = 1.176 , σ ω , 1 = 2.0 σ k , 2 = 1.06 , σ ω , 2 = 1.168 , a 1 = 0.31 , β i , 1 = 0.075 and β i , 2 = 0.0828 .
Therefore, six simulation setups resulted from the three chemical-kinetics mechanisms combined with two turbulence models based on RANS equations. This approach allowed for a detailed analysis of the interaction between combustion chemistry and turbulence, facilitating the selection of the most suitable configuration to represent the phenomena under study accurately.

2.1.4. Soot Formation Mechanism

The Moss–Brookes semi-empirical model describes soot formation and oxidation in combustion processes by solving transport equations for the normalized radical nuclei concentration and soot mass fraction. The model uses transport Equations (11) and (12) to describe soot concentration evolution, where ρ is the reacting mixture density, v is its velocity, μ t is its dynamic viscosity, σ soot is the Prandtl number, Y s o o t is the soot mass fraction, M is the soot mass concentration (kg/m3), and b n u c * is the normalized radical nuclei concentration (particles × 10 15 / kg). b n u c * may also be described as in Equations (13), with N being the soot particle number density (particles/m3) and N n o r m equal to 10 15 particles .
t ( ρ Y soot ) + · ( ρ v Y soot ) = · μ t σ soot Y soot + d M d t
t ( ρ b nuc * ) + · ( ρ v b nuc * ) = · μ t σ nuc b nuc * + 1 N norm d N d t
b n u c * = N ρ N norm
The instantaneous soot particle production rate, subject to nucleation from the gas phase and coagulation, is described in Equation (14), where N A is the Avogrado number ( 6.022 · 10 26 kmol−1) and X prec is the mole fraction of soot precursor, assumed to be acetylene once dealing with methane combustion. The values assumed for the mean soot particle diameter d p is ANSYS fluent standard value ( 2.2 · 10 8 m). The soot mass density ρ soot is assumed as being 1.800 kg/m3, l is determined by the methods described in Brookes and Moss [42], and C α and C β are constants related to the model, listed in Table 2.
d N d t = C α N A X prec P R T l exp T α T Nucleation C β 24 R T ρ soot N A 1 / 2 d p 1 / 2 N 2 Coagulation
The source term for soot mass follows the model described by Equation (15). The soot particle is considered to be formed by 12 carbon atoms. Thus, its mass, M P , is assumed to be 144 kg · kmol−1. The mole fraction of the participating surface growth species X sgs is also related to the acetylene found in abundance in the soot regions of methane non-premixed flames. The model exponents m and n are also determined by the methods described in Brookes and Moss [42], while the other constants related to the model, C γ , C ω , C oxid , T α , T γ , and η coll are naturally listed in Table 2.
d M d t = M P C α X prec P R T l exp T α T Nucleation + C γ X sgs P R T m exp T γ T ( π N ) 1 / 3 6 M ρ soot 2 / 3 n Surface Growth C oxid C w η coll X OH P R T T ( π N ) 1 / 3 6 M ρ soot 2 / 3 Oxidation
The constants proposed by Brookes and Moss [42,43] for methane flames were adopted, listed in Table 2.

2.1.5. Radiation Model

The Discrete Ordinates (DOs) method with gray band model was applied to solve the Radiation Transfer Equation (RTE), which is presented in Equation (16). This model provides good accuracy across a wide range of optical thicknesses. The uncoupled DO model implementation was adapted; it is sequential and uses a conservative variant of the DO model called the finite-volume scheme [44,45], and its extension to unstructured meshes [46]. Despite its well-known computational cost [43], the choice of this model was justified by the importance of precise radiation heat transfer prediction when analyzing the influence of the hydrogen-enriched pale flame upon this heat transfer mode.
· ( I ( r , s ) s ) + ( α + σ s ) I ( r , s ) = α n 2 σ T 4 π + σ s 4 π 0 4 π I ( r , s ) Φ ( s · s ) d Ω
In the equation above, I represents the radiation intensity at position r and direction s , α and σ s are, respectively, the absorption and scattering coefficients of the gas, n is the medium refraction index, and σ is the Stefan–Boltzmann constant.

2.1.6. Computational Grid and Boundary Conditions

The system geometry was subdivided into three distinct regions: the injector, the flame region, and the combustion chamber. Each of these regions was modeled to accurately reflect the relevant physical phenomena, considering the specific characteristics of each area, such as gas flow, fuel interaction, and the variable thermal conditions throughout the combustion process.
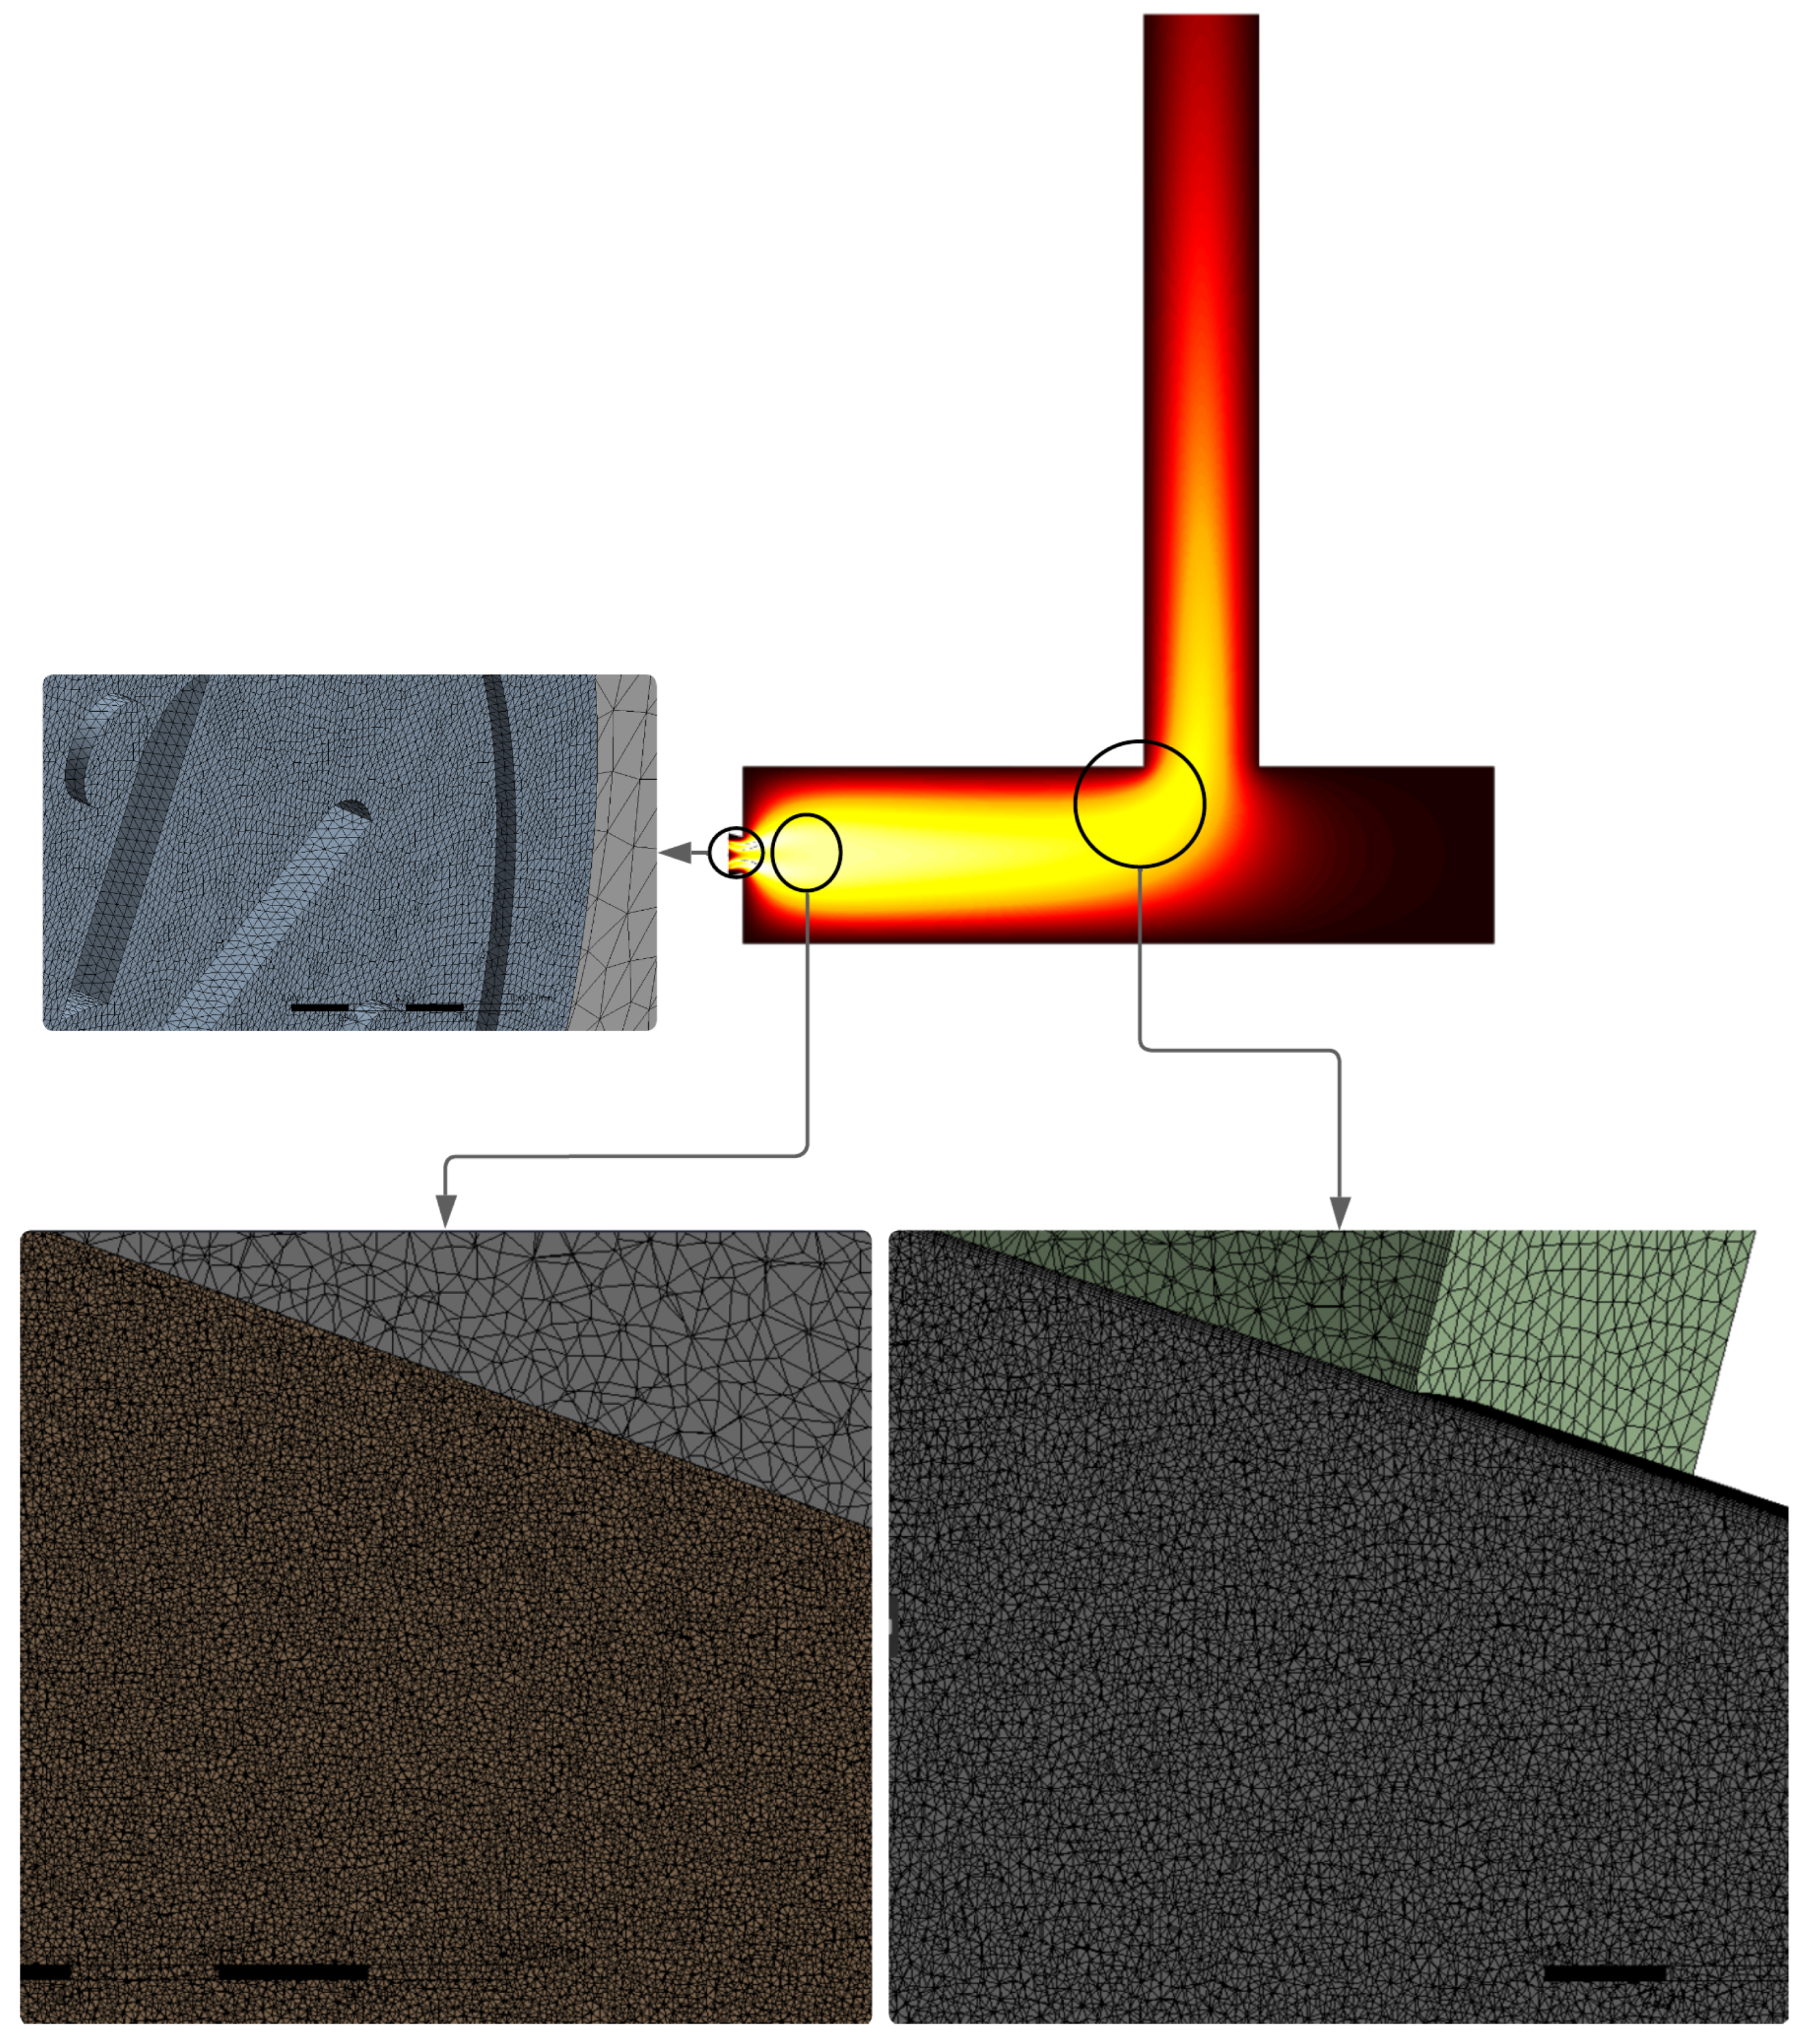
Grid independence analysis (see Figure 2) demonstrated that 16 M elements were necessary to accurately predict the studied flow field, corresponding to a 3.61 % relative temperature error at sensor C H 3 . Tetrahedral discretization was adopted to better adapt to the high-complexity geometries characteristic of the addressed combustor. The mesh refinement strategy was carefully planned, with a higher node density in critical areas of interest, such as the flame region, where intense temperature and concentration gradients occur. Conversely, the mesh was configured with a coarser discretization in areas of more uniform flow, promoting computational efficiency without compromising result accuracy. This approach follows the methodology proposed in the reference work by Lemmi et al. [47], who also applied this mesh optimization criterion to balance accuracy and computational feasibility.
Thus, the regions corresponding to the flame, the combustion chamber, and the chimney had a local edge sizing of 0.7 mm, 2.5 mm, and 6 mm, respectively. Figure 3 shows the mesh distribution, highlighting the variations in node densities across each region.
The fuel flow rate was adjusted to maintain the volumetric flow for the different mixture compositions. The burner’s secondary air regulation plate was fixed so that the secondary air flow accounted for 85% of the total airflow. The swirl was fully modeled to better represent its turbulent influence on the flame. The outlet butterfly valve was removed and functionally replaced by a 1-bar pressure outlet boundary condition at the end of the chimney. Lately, the walls have been treated as adiabatic.

2.1.7. Numerical Model Validation

The numerical model validation was carried out through a multifactorial approach, ensuring a comprehensive assessment of the simulation’s accuracy concerning experimental data. The agreement between the simulated results and experimental data strengthened the model’s reliability, ensuring that the essential physical and chemical phenomena governing the combustion process were adequately represented.
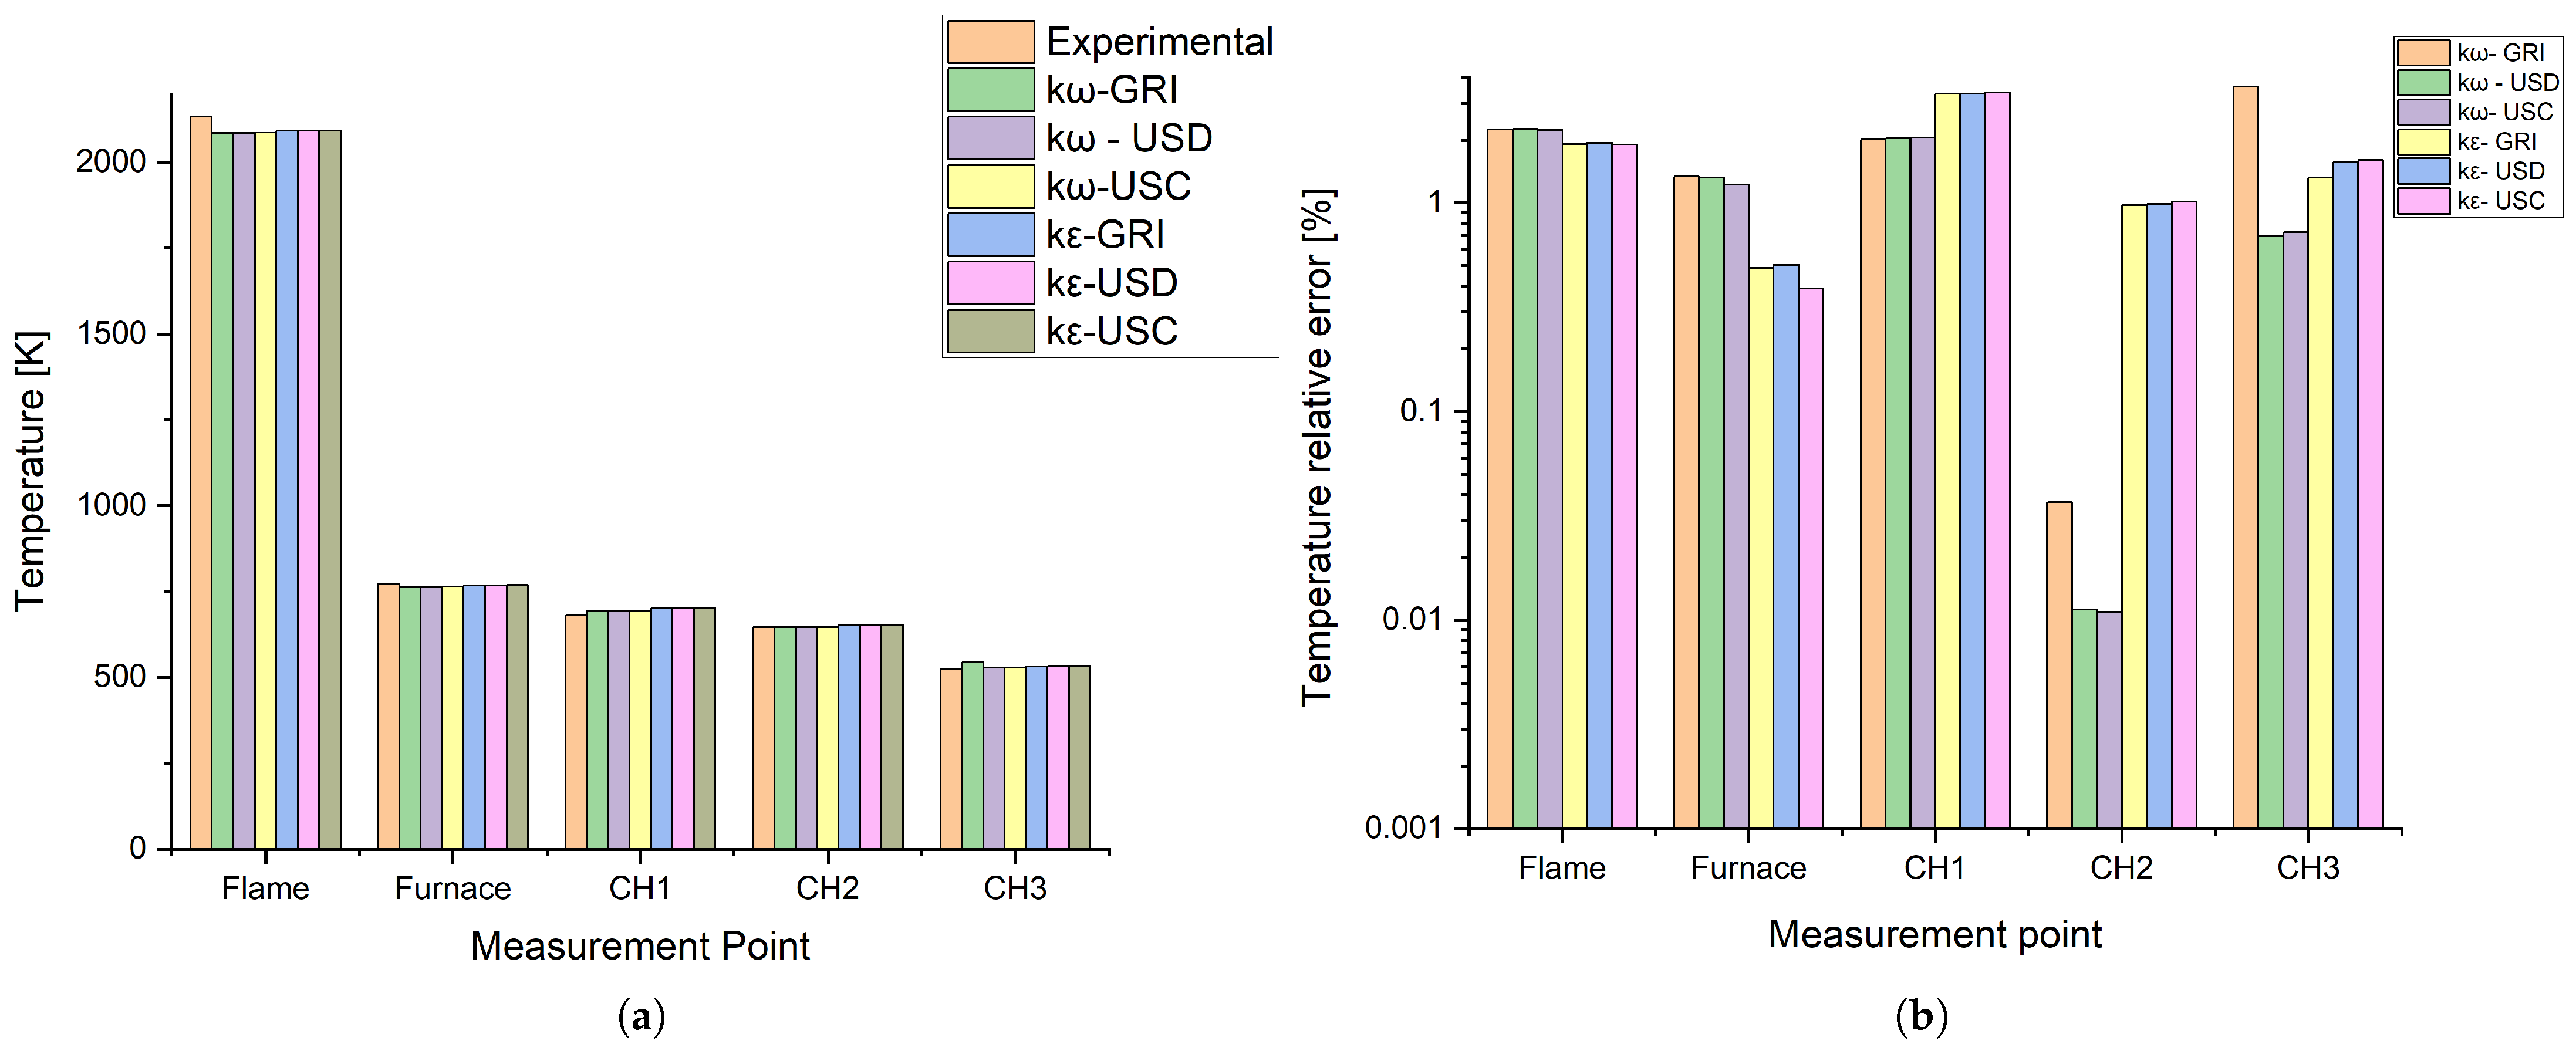
The temperatures predicted by the model were compared with measurements taken in different regions of the combustion chamber and burner chimney. This analysis verified the model’s ability to accurately reproduce thermal gradients and temperature profiles throughout the furnace. Figure 4 contrasts the experimental temperature with the values obtained by each kinetic model and mechanism combination. Each measurement point corresponds to the ones described in Figure 1.
Figure 4a shows that all combinations agreed with the experimental temperature values. Figure 4b shows each combination’s errors more clearly.
The validation also included comparing CO and NOx emissions between the numerical results and the experimentally obtained data. Since these pollutants are directly influenced by combustion processes and the interaction between chemistry and turbulence, their analysis provided insight into the model’s capacity to accurately capture these species’ formation and destruction mechanisms. Figure 5 displays experimental C O and N O x data compared to those predicted by the models.
Combined temperature and emissions relative mean errors (RME) were calculated using Equation (17) according to [48], where N is the number of temperature or emission species, y 0 is the experimental measurement, and y c is the values obtained from each model simulation. This quantitative metric was applied to trace comparisons between six combinations of turbulence models and chemical mechanisms.
R M E = 1 N i = 1 N y 0 y c y 0 2
As shown in Table 3, although all the tested models yielded satisfactory results, the k- ω SST turbulence model reaches the best overall temperature results when combined with USD or USC chemical-kinetic mechanism. As for the pollutants, USD outperformed the remaining mechanisms, while GRI presented the worst emission predictions. Therefore, the k ω -USD combination provided the best predictive capacity for both temperatures and pollutant emissions, being chosen to analyze further the flames provided by the biomethane–hydrogen blends.

2.2. Biomethane–Hydrogen Blends

The experiment used a single fuel gas composition, which served as a reference for validating the numerical model. Following this, the validated model running UCSD with k- ω SST was subjected to three additional compositions containing different proportions of hydrogen, enabling a predictive analysis of the mixture’s behavior during combustion. These additional simulations were designed to evaluate the impact of hydrogen addition on flame temperature and the formation of chemical species, particularly regarding pollutant emissions and combustion stability.
According to Bueno et al. [18], the local gas network is designed to comport C H 4 - H 2 blend at a maximum percentage of hydrogen of 10%. This study assessed cases up to 15% of hydrogen, aiming for advances in the local infrastructure for the near future. Table 4 presents the fuel compositions used in the simulations.
Case 1 corresponds to the gas composition used in the validation experiment and will serve as a reference, while the remaining instances represent modified fuel blends containing different hydrogen proportions. The table refers to volumetric proportions, and adding hydrogen reduced the volume of the other components proportionally.

3. Results and Discussion

3.1. Flame Structure and Temperature Profile

The CFD analysis indicated hydrogen enrichment impacts emissions, radiation mode heat transfer, and temperature profiles. Hydrogen’s changes to flame structure and thermal distribution patterns were promptly reflected in the emissions produced by the combustion process.
According to the results presented in Table 5, it was observed that the temperatures within the flame region exceeded 2000 K in all the analyzed scenarios. Flame temperatures were increasingly raised with hydrogen blending, with an overall 34 K increase for the 15% hydrogen blend. Despite the oxy-fuel combustion configuration and constant energy output setup, Daurer et al. [31] found similar results. These authors registered an 80 K temperature increase when switching from natural gas to pure hydrogen. Although modest, this rise could positively impact the glass manufacturing process, as it may contribute to more favorable thermal conditions for material fusion and homogenization [30,31]. Figure 6 presents the temperature distribution along these points, allowing for an analysis of the thermal variations in each simulated scenario.
As observed in Figure 6, for distances below 1500 mm, the simulations with hydrogen blending indicate a slight temperature increase compared to the biomethane data. However, as the combustion products stream proceeds towards the system outlet, the temperatures of the combustion gases begin to diverge more noticeably, decreasing with the hydrogen content. This behavior suggests that, in regions farther from the fuel injection, the differences in fuel composition have a more pronounced impact on the thermal distribution within the system.

3.2. Pollutant Emissions

Table 6 presents the variation of CO and NO emissions in the burner as a function of the hydrogen content in the mixture. Nitrogen oxide emissions were increased with the hydrogen blending into biomethane, in agreement with the works of Al-ajmi et al. [29] and Zier et al. [30]. This behavior is attributed to the influence of H 2 on the combustion temperatures within the burner, as hydrogen, due to its high reactivity, accelerates heat release and induces a thermal increase in the process.
Besides this NO emissions penalty, increasing the hydrogen participation within the fuel mixture also caused an increase in CO concentration at the flame zone. This finding is consistent with the results presented by Gheshlaghi and Tahsini [49], who linked the lean and high-temperature conditions of the flame to a more intense dissociation of CO from CO2. Furthermore, according to Lefebvre and Ballal [50], the increase in CO due to CO2 dissociation becomes significantly pronounced at temperatures above 1800 K. Additionally, other potential causes for the rise in CO could be related to islands of insufficient fuel–air mixture, leading to fluctuations in the fuel-to-air ratio. This variability can result in fuel-lean and fuel-rich regions, potentially generating elevated CO concentrations.
The water concentration in the emissions significantly affects the quality of the glass [30]. Furthermore, the decomposition of water at high temperatures releases hydrogen, promoting the formation of O H radicals, which may also react with Si, compromising synthetic silica glass homogeneity and lifespan [32,33,34]. Therefore, concentrations of H 2 O and O H were taken from CFD results at two points in the burner: the flame zone, where thermal and reactive conditions are more intense, and the stack outlet, where the combustion products begin dissipating.
In this regard, Table 7 presents the variation of H2O concentration indicated by the CFD simulations as a function of the hydrogen percentage. The concentration of H 2 O in the emissions increases with the addition of H 2 in both analyzed regions. The analysis of these two regions provides insight into how adding hydrogen influences the H2O concentration at different stages of the combustion process.
According to Zier et al. [30], elevated concentrations of H 2 O in both regions can adversely affect the quality of glass, as the presence of water in the emissions may alter the physicochemical properties of the vitrification process. The increase in H 2 O concentration caused by introducing hydrogen into the fuel represents a negative factor for glass production, as it can impair the quality of the final product by interfering with the precise control of manufacturing conditions.
Table 8 presents the variation of O H concentration as a function of hydrogen percentage. It must be highlighted that the O H radical quantities measured by the CFD disregard the ones present in water molecules. Thus, besides the H 2 O , the presence of free O H radical rises with the increase of hydrogen burn, mainly by the flame region, representing a potential problem for glass quality. Yao et al. [34] found that in H 2 - O 2 combustion, H 2 excess may reduce O H formation; however, for air–fuel combustion (containing N 2 ), Kruljevic et al. [23] found that lean mixtures lead low overall OH generation.

3.3. Radiation Heat Transfer Impacts

Biomethane enrichment with hydrogen resulted in two distinct radiation-related effects. The first effect is directly associated with the combustion temperature. The presence of hydrogen in the fuel raises the combustion temperature due to its high calorific value, which in turn increases thermal radiation emission, according to the Stefan–Boltzmann law, which states that the thermal radiation of a black body increases with the fourth power of the temperature.
The second effect concerns luminosity, which is influenced by the reduction in soot formation. The introduction of hydrogen promotes more efficient and complete combustion, leading to a lower production of soot particles. Soot, formed by incomplete combustion, absorbs and re-emits radiation, contributing to the visible radiation of the flame. Therefore, the reduction in soot decreases observed luminosity as a lower amount of visible radiation is emitted.
These combined effects impact the thermal and luminous characteristics of the combustion process and the radiation emissions generated during the combustion of biomethane with hydrogen. Furthermore, reducing soot may improve the environmental quality of emissions, as soot is associated with harmful atmospheric pollutants, such as fine particulate matter and volatile organic compounds, which are detrimental to health and the environment.
Table 9 shows the effect of hydrogen concentration on flame radiation. As observed, from 20 % hydrogen onward, the impact of luminosity loss due to the reduction of soot formation prevails over the temperature increase in the total net radiation. The results are consistent with those presented in the reference literature. Gao et al. [51] concluded that hydrogen dilution becomes significant, but only from a volumetric fraction of 60% in a premixed propane flame. Du et al. [52] described the same effect on C 3 H 8 and C 2 H 4 blends with hydrogen.

4. Conclusions

The numerical analysis of hydrogen-enriched biomethane combustion revealed several significant findings relevant to industrial applications, particularly in glass manufacturing. The validated CFD model, utilizing the UCSD chemical-kinetic mechanism with k- ω SST turbulence modeling, successfully predicted the effects of varying hydrogen concentrations on flame characteristics and emissions. Relative mean errors of 1.5% and 6.0% were registered for temperature and pollutant predictions, respectively.
Adding hydrogen to biomethane resulted in modest but consistent temperature increases, with an overall rise of 34 K observed for the 15% hydrogen blend. While this temperature increase could benefit glass melting processes, it must be weighed against other possible side effects. The study revealed that hydrogen enrichment led to increased emissions of both NO and CO, with NO levels rising from 60.70 ppm to 64.46 ppm and CO increasing from 15.80 ppm to 27.27 ppm at 15% hydrogen content.
Water vapor and OH radical formation were analyzed in terms of their impact on glass manufacturing applications. Water vapor concentration increased in the flame region (from 16.54% to 17.52%) and at the stack outlet (from 11.61% to 12.29%) with a 15% hydrogen addition. Similarly, OH radical concentrations showed substantial increases in both regions, rising from 3324.39 ppm to 3717.11 ppm in the flame zone and 404.48 ppm to 490.29 ppm at the stack outlet. These increases could affect glass quality and homogeneity, particularly in synthetic silica glass production.
The radiation heat mode analysis revealed an interaction between temperature effects and soot formation. While higher combustion temperatures initially increased thermal radiation, the reduction in soot formation due to hydrogen addition became the dominant factor at concentrations above 20%, leading to an overall decrease in radiation mode heat transfer. This finding is particularly relevant to glass manufacturing processes that rely heavily on radiative heat transfer.
These results suggest that while hydrogen enrichment of biomethane offers potential benefits for industrial decarbonization, careful consideration must be given to process-specific requirements, particularly in applications like glass manufacturing, where flame characteristics, emissions, and radiation properties play crucial roles in product quality. Future work should focus on optimizing hydrogen blend ratios for specific industrial applications while maintaining product quality and managing emissions.

Author Contributions

Conceptualization, A.V.B. and F.E.L.U.F.; methodology, F.E.L.U.F., H.C.M.S. and C.F.d.F.M.J.; software, H.C.M.S. and C.F.d.F.M.J.; validation, M.L.M.d.O., H.C.M.S. and C.F.d.F.M.J.; formal analysis, F.E.L.U.F., A.V.B., H.C.M.S. and C.F.d.F.M.J.; investigation, F.E.L.U.F., A.V.B., P.A.C.R. and J.V.G.T.; resources, A.V.B. and M.L.M.d.O.; data curation, M.L.M.d.O.; writing—original draft preparation, F.E.L.U.F., A.V.B., H.C.M.S. and C.F.d.F.M.J.; writing—review and editing, A.V.B., P.A.C.R., M.L.M.d.O. and J.V.G.T.; visualization, H.C.M.S.; supervision, A.V.B. and P.A.C.R.; project administration, A.V.B. and P.A.C.R.; funding acquisition, M.L.M.d.O. and A.V.B. All authors have read and agreed to the published version of the manuscript.

Funding

This research was funded by Rede de Pesquisa e Inovação em Energias Renováveis do Ceará through the FUNCAP agency.

Data Availability Statement

The raw data supporting the conclusions of this article will be made available by the authors upon request.

Acknowledgments

This work was made possible by the infrastructure provided by the Associated Laboratories of Innovation and Sustainability (LAIS), at the State University of Ceará (UECE), and the Hydrogen and Thermal Machines Laboratory (LHMT), at the Federal University of Ceará (UFC).

Conflicts of Interest

Author Jesse Van Griensven Thé was employed by the company Lakes Environmental. The remaining authors declare that the research was conducted in the absence of any commercial or financial relationships that could be construed as a potential conflict of interest.

References

  1. IEA-2024. Global Hydrogen Review 2024—Analysis, IEA, Paris, License: CC BY 4.0. Available online: https://www.iea.org/reports/global-hydrogen-review-2024 (accessed on 19 February 2025).
  2. Naseem, K.; Qin, F.; Khalid, F.; Suo, G.; Zahra, T.; Chen, Z.; Javed, Z. Essential parts of hydrogen economy: Hydrogen production, storage, transportation and application. Renew. Sustain. Energy Rev. 2025, 210, 115196. [Google Scholar] [CrossRef]
  3. Leal, J.I.; Pitombeira-Neto, A.R.; Bueno, A.V.; Rocha, P.A.C.; de Andrade, C.F. Probabilistic wind speed forecasting via Bayesian DLMs and its application in green hydrogen production. Appl. Energy 2025, 382, 125286. [Google Scholar] [CrossRef]
  4. Chen, X.; Lobo, F.L.; Bian, Y.; Lu, L.; Chen, X.; Tucker, M.P.; Wang, Y.; Ren, Z.J. Electrical decoupling of microbial electrochemical reactions enables spontaneous H2 evolution. Energy Environ. Sci. 2020, 13, 495–502. [Google Scholar] [CrossRef]
  5. de Rezende, T.T.G.; Venturini, O.J.; Palacio, J.C.E.; de Oliveira, D.C.; de Souza Santos, D.J.; Lora, E.E.S.; Filho, F.B.D. Technical and economic potential for hydrogen production from biomass residue gasification in the state of Minas Gerais in Brazil. Int. J. Hydrogen Energy 2025, 101, 358–378. [Google Scholar] [CrossRef]
  6. Gulraiz, A.; Bastaki, A.J.A.; Magamal, K.; Subhi, M.; Hammad, A.; Allanjawi, A.; Zaidi, S.H.; Khalid, H.M.; Ismail, A.; Hussain, G.A.; et al. Energy Advancements and Integration Strategies in Hydrogen and Battery Storage for Renewable Energy Systems. iScience 2025, 28, 111945. [Google Scholar] [CrossRef]
  7. Aichouni, I.E.; Mridekh, A.; Nabil, N.; Rachidi, S.; Hamraoui, H.E.; Mansouri, B.E.; Essalih, A. A review of salt mechanical behavior, stability and site selection of underground hydrogen storage in salt cavern-Moroccan case. J. Energy Storage 2025, 114, 115813. [Google Scholar] [CrossRef]
  8. Lu, X.; Krutoff, A.C.; Wappler, M.; Fischer, A. Key influencing factors on hydrogen storage and transportation costs: A systematic literature review. Int. J. Hydrogen Energy 2025, 105, 308–325. [Google Scholar] [CrossRef]
  9. Junior, L.H.S.; da Silva, A.K. Global assessment of hydrogen production from the electrical grid aiming the Brazilian transportation sector. Energy Sustain. Dev. 2025, 85, 101626. [Google Scholar] [CrossRef]
  10. Oliveira, M.L.M.; Alves, C.M.; Andrade, C.F.; de Azevedo, D.C.; Lobo, F.L.; Fuerte, A.; Ferreira-Aparicio, P.; Caravaca, C.; Valenzuela, R.X. Recent Progress and Perspectives on Functional Materials and Technologies for Renewable Hydrogen Production. ACS Omega 2025, 10, 3282–3303. [Google Scholar] [CrossRef]
  11. Pan, H.; Pournazeri, S.; Princevac, M.; Miller, J.W.; Mahalingam, S.; Khan, M.Y.; Jayaram, V.; Welch, W.A. Effect of hydrogen addition on criteria and greenhouse gas emissions for a marine diesel engine. Int. J. Hydrogen Energy 2014, 39, 11336–11345. [Google Scholar] [CrossRef]
  12. Geng, P.; Cao, E.; Tan, Q.; Wei, L. Effects of alternative fuels on the combustion characteristics and emission products from diesel engines: A review. Renew. Sustain. Energy Rev. 2017, 71, 523–534. [Google Scholar] [CrossRef]
  13. Liu, B.; Bao, B.; Wang, Y.; Xu, H. Numerical simulation of flow, combustion and NO emission of a fuel-staged industrial gas burner. J. Energy Inst. 2017, 90, 441–451. [Google Scholar] [CrossRef]
  14. Hosseini, S.H.; Tsolakis, A.; Alagumalai, A.; Mahian, O.; Lam, S.S.; Pan, J.; Peng, W.; Tabatabaei, M.; Aghbashlo, M. Use of hydrogen in dual-fuel diesel engines. Prog. Energy Combust. Sci. 2023, 98, 101100. [Google Scholar] [CrossRef]
  15. Gupta, P.; Kurien, C.; Mittal, M. Computational investigation and analysis of cycle-to-cycle combustion variations in a spark-ignition engine utilizing methane-ammonia blends. Fuel 2025, 386, 134313. [Google Scholar] [CrossRef]
  16. Wright, M.L.; Lewis, A.C. Emissions of NOx from blending of hydrogen and natural gas in space heating boilers. Elementa 2022, 10, 00114. [Google Scholar] [CrossRef]
  17. Abdin, Z. Bridging the energy future: The role and potential of hydrogen co-firing with natural gas. J. Clean. Prod. 2024, 436, 140724. [Google Scholar] [CrossRef]
  18. Bueno, A.V.; Vilarrasa-García, E.; Torres, A.E.B.; de Oliveira, M.L.M.; de Andrade, C.F. Analysis of The Feasibility of Hydrogen Injection in Pipeline Gas Distribution Networks. Rev. Gest. Soc. Ambient. 2024, 18, 1–15. [Google Scholar] [CrossRef]
  19. Lucas, A.; Pluvinage, G.; Julien, C. Reliability index of a pipe transporting hydrogen submitted to seismic displacement. Int. J. Press. Vessel. Pip. 2024, 208, 105140. [Google Scholar] [CrossRef]
  20. Hasche, A.; Krause, H.; Eckart, S. Hydrogen admixture effects on natural gas-oxygen burner for glass-melting: Flame imaging, temperature profiles, exhaust gas analysis, and false air impact. Fuel 2025, 387. [Google Scholar] [CrossRef]
  21. Gee, A.J.; Smith, N.; Chinnici, A.; Medwell, P.R. Characterisation of turbulent non-premixed hydrogen-blended flames in a scaled industrial low-swirl burner. Int. J. Hydrogen Energy 2024, 49, 747–757. [Google Scholar] [CrossRef]
  22. Rahimi, S.; Mazaheri, K.; Alipoor, A.; Mohammadpour, A. The effect of hydrogen addition on methane-air flame in a stratified swirl burner. Energy 2023, 265, 126354. [Google Scholar] [CrossRef]
  23. Kruljevic, B.; Darabiha, N.; Durox, D.; Vaysse, N.; Renaud, A.; Vicquelin, R.; Fiorina, B. Experimentation and simulation of a swirled burner featuring cross-flow hydrogen injection with a focus on the OH* chemiluminescence. Combust. Flame 2025, 273, 113945. [Google Scholar] [CrossRef]
  24. Zhou, S.; Zhu, X.; Li, B.; Gao, Q.; Yan, B.; Chen, G. Experimental and numerical study on adiabatic laminar burning velocity and overall activation energy of biomass gasified gas. Fuel 2022, 320, 123976. [Google Scholar] [CrossRef]
  25. Smith, G.P.; Golden, D.M.; Frenklach, M.; Moriarty, N.W.; Eiteneer, B.; Goldenberg, M.; Bowman, C.T.; Hanson, R.K.; Song, S.; Gardiner, W.C., Jr.; et al. GRI-Mech 3.0. Available online: http://combustion.berkeley.edu/gri-mech/version30/text30.html (accessed on 19 February 2025).
  26. San Diego Mechanism Web Page. Chemical-Kinetic Mechanisms for Combustion Applications, Mechanical and Aerospace Engineering (Combustion Research), University of California at San Diego. Available online: http://combustion.ucsd.edu (accessed on 19 February 2025).
  27. Wang, H.; You, X.; Joshi, A.V.; Davis, S.G.; Laskin, A.; Egolfopoulos, F.; Law, C.K. USC Mech Version II- High-Temperature Combustion Reaction Model of H2/CO/C1-C4 Compounds, Combustion Kinetics Laboratory, University of Southern California. Available online: http://ignis.usc.edu/USC_Mech_II.htm (accessed on 19 February 2025).
  28. Ji, C.; Wang, D.; Yang, J.; Wang, S. A comprehensive study of light hydrocarbon mechanisms performance in predicting methane/hydrogen/air laminar burning velocities. Int. J. Hydrogen Energy 2017, 42, 17260–17274. [Google Scholar] [CrossRef]
  29. Al-ajmi, R.; Qazak, A.H.; Sadeq, A.M.; Al-Shaghdari, M.; Ahmed, S.F.; Sleiti, A.K. Numerical investigation of the potential of using hydrogen as an alternative fuel in an industrial burner. Fuel 2025, 385, 134194. [Google Scholar] [CrossRef]
  30. Zier, M.; Stenzel, P.; Kotzur, L.; Stolten, D. A review of decarbonization options for the glass industry. Energy Convers. Manag. X 2021, 10, 100083. [Google Scholar] [CrossRef]
  31. Daurer, G.; Schwarz, S.; Demuth, M.; Gaber, C.; Hochenauer, C. On the use of hydrogen in oxy-fuel glass melting furnaces: An extensive numerical study of the fuel switching effects based on coupled CFD simulations. Fuel 2024, 380, 133576. [Google Scholar] [CrossRef]
  32. Kuzuu, N.; Kokubo, Y.; Nishimura, T.; Serizawa, I.; Zeng, L.H.; Fujii, K.; Yamaguchi, M.; Saito, K.; Ikushima, A.J. Structural change of OH-free fused quartz tube by blowing with hydrogen-oxygen flame. J. Non-Cryst. Solids 2004, 333, 115–123. [Google Scholar] [CrossRef]
  33. Kokubo, Y.; Kuzuu, N.; Serizawa, I.; Zeng, L.H.; Fujii, K. Structural changes of various types of silica glass tube upon blowing with hydrogen-oxygen flame. J. Non-Cryst. Solids 2004, 349, 38–45. [Google Scholar] [CrossRef]
  34. Yao, W.; Zheng, L.; Zhang, H. Modeling analysis on the silica glass synthesis in a hydrogen diffusion flame. Int. J. Heat Mass Transf. 2015, 81, 797–803. [Google Scholar] [CrossRef]
  35. ASTM D 1945:1996; Standard Test Method for Analysis of Natural Gas by Gas Chromatography. Technical Standard; American Society for Testing and Materials: West Conshohocken, PA, USA, 1996.
  36. ISO 6974-1:2012; Natural Gas—Determination of Composition and Associated Uncertainty by Gas Chromatography. Technical Standard; International Organization for Standardization: Geneva, Switzerland, 2012.
  37. ISO 6975:1997; Natural Gas—Extended Analysis—Gas-Chromatographic Method; Technical Standard. International Organization for Standardization: Geneva, Switzerland, 1997.
  38. Kee, R.J.; Rupley, F.M.; Miller, J.A. Chemkin-II: A Fortran Chemical Kinetics Package for the Analysis of Gas-Phase Chemical Kinetics; Technical Report; Sandia National Lab. (SNL-CA): Livermore, CA USA, 1989. [Google Scholar]
  39. Launder, B.E.; Spalding, D.B. (Eds.) Lectures in Mathematical Models of Turbulence; Academic Press: London, UK, 1972. [Google Scholar]
  40. Menter, F.R. Two-equation eddy-viscosity turbulence models for engineering applications. AIAA J. 1994, 32, 1598–1605. [Google Scholar] [CrossRef]
  41. Wilcox, D.C. Turbulence Modeling for CFD; DCW Industries: La Canada, CA, USA, 1998; Volume 2. [Google Scholar]
  42. Brookes, S.; Moss, J. Predictions of soot and thermal radiation properties in confined turbulent jet diffusion flames. Combust. Flame 1999, 116, 486–503. [Google Scholar] [CrossRef]
  43. ANSYS Inc. ANSYS® FLUENT, Release 15.0. Help System, Theory Guide; ANSYS Inc.: Canonsburg, PA, USA, 2013. [Google Scholar]
  44. Chui, E.; Raithby, G. Computation of radiant heat transfer on a nonorthogonal mesh using the finite-volume method. Numer. Heat Transf. 1993, 23, 269–288. [Google Scholar]
  45. Raithby, G.; Chui, E. A finite-volume method for predicting a radiant heat transfer in enclosures with participating media. J. Heat Transf. 1990, 112, 415–423. [Google Scholar]
  46. Murthy, J.; Mathur, S. Finite volume method for radiative heat transfer using unstructured meshes. J. Thermophys. Heat Transf. 1998, 12, 313–321. [Google Scholar]
  47. Lemmi, G.; Castellani, S.; Nassini, P.; Picchi, A.; Galeotti, S.; Becchi, R.; Andreini, A.; Babazzi, G.; Meloni, R. FGM vs. ATF: A comparative LES analysis in predicting the flame characteristics of an industrial lean premixed burner for gas turbine applications. Fuel Commun. 2024, 19, 100117. [Google Scholar]
  48. Jain, S.; Singh, V. Statistical Techniques for Data Analysis. In Developments in Water Science; Elsevier: Amsterdam, The Netherlands, 2003; Volume 51, pp. 207–276. [Google Scholar] [CrossRef]
  49. Gheshlaghi, M.K.G.; Tahsini, A.M. Numerical investigation of hydrogen addition effects to a methane-fueled high-pressure combustion chamber. Int. J. Hydrogen Energy 2023, 48, 33732–33745. [Google Scholar] [CrossRef]
  50. Lefebvre, A.H.; Ballal, D.R. Gas Turbine Combustion: Alternative Fuels and Emissions; CRC Press: Boca Raton, FL, USA, 2010. [Google Scholar]
  51. Gao, Y.; Lu, Z.; Hua, Y.; Liu, Y.; Tao, C.; Gao, W. Experimental study on the flame radiation fraction of hydrogen and propane gas mixture. Fuel 2022, 329, 125443. [Google Scholar]
  52. Du, D.; Axelbaum, R.; Law, C.K. Soot formation in strained diffusion flames with gaseous additives. Combust. Flame 1995, 102, 11–20. [Google Scholar]
Figure 1. Combustion chamber instrumentation setup.
Processes 13 01048 g001
Figure 2. Grid convergence plot for CH3 temperature.
Processes 13 01048 g002
Figure 3. Combustion phenomena adapted computational grid and zone refinement.
Processes 13 01048 g003
Figure 4. Temperature profiles from different models and experimental data obtained with biomethane. (a) Absolute values. (b) Relative error.
Processes 13 01048 g004
Figure 5. Pollutant emissions predicted with different models and experimental data. (a) Absolute values. (b) Relative error.
Processes 13 01048 g005
Figure 6. Temperature distribution within the chamber and chimney with burner distance.
Processes 13 01048 g006
Table 1. Biomethane composition.
SubstanceChemical FormulaMole Fraction
MethaneCH492.98%
EthaneC2H66.29%
PropaneC3H80.36%
n-ButaneC4H100.03%
i-ButaneC4H100.03%
n-PentaneC5H120.001%
Carbon DioxideCO20.30%
NitrogenN20.00%
Table 2. Soot formation mechanism constants [42,43].
DescriptionEq. TermValue
Model constant for soot inception rate C α 54 s−1
Model constant for coagulation rate C β 1.0
Surface growth rate scaling factor C γ 11,700  kg · m · kmol 1 · s−1
Oxidation model constant C ω 105.8125 kg · m · kmol 1 · K 1 / 2 · s−1
Oxidation rate scaling parameter C oxid 1
Activation temperature of soot inception T α 21,000 K
Activation temperature of surface growth rate T γ 12,100 K
Collisional efficiency parameter η coll 0.04
Table 3. Calculated RME for each model combination.
CombinationsRME
TemperaturePollutants
kw-GRI2.2%125.4%
kw - USD1.5%6.0%
kw-USC1.5%19.4%
ke-GRI1.9%125.4%
ke-USD1.9%6.0%
ke-USC1.9%17.8%
Table 4. Fuel compositions.
SpeciesCase 1Case 2Case 3Case 4
H20.00%5.00%10.00%15.00%
CH492.98%88.33%83.68%79.03%
CO20.30%0.29%0.27%0.26%
C2H66.29%5.98%5.66%5.35%
C3H80.43%0.41%0.39%0.36%
Table 5. Fuel compositions.
ReferenceDistance [mm]Temperature [K]
0% H25% H210% H215% H2
Flame2102085209621082119
Furnace785763766770775
Ch11016694697700704
Ch21482646650653653
Ch31923528523470406
Table 6. Pollutant emissions from hydrogen/biomethane mixtures.
Hydrogen EnrichmentCONO
0.0%15.80 ppm60.70 ppm
5.0%20.24 ppm61.73 ppm
10.0%23.60 ppm63.03 ppm
15.0%27.27 ppm64.46 ppm
Table 7. Water concentration for different regions (mole basis).
Hydrogen EnrichmentFlame H 2 O Ch5 H 2 O
0.0%16.54%11.61%
5.0%16.84%11.81%
10.0%17.17%12.04%
15.0%17.52%12.29%
Table 8. Molar OH concentration for different regions.
Hydrogen EnrichmentFlame OHCh5 OH
0.0%3324.39 ppm404.48 ppm
5.0%3455.29 ppm431.33 ppm
10.0%3591.12 ppm459.00 ppm
15.0%3717.11 ppm490.29 ppm
Table 9. Chamber wall incident radiation for different hydrogen concentrations.
Hydrogen EnrichmentIncident Radiation [W/m2]
0.0%961.3774
5.0%972.3523
10.0%978.276
15.0%965.5321
20.0%958.2644
Disclaimer/Publisher’s Note: The statements, opinions and data contained in all publications are solely those of the individual author(s) and contributor(s) and not of MDPI and/or the editor(s). MDPI and/or the editor(s) disclaim responsibility for any injury to people or property resulting from any ideas, methods, instructions or products referred to in the content.

