Article

Accumulation and Exploration Potential of Coalbed Methane Collected from Longtan Formation of Santang Syncline in Zhijin, Guizhou Province

1
Team 113 of Guizhou Coalfield Geological Bureau, Guiyang 550000, China
2
College of Earth Sciences & Engineering, Shandong University of Science and Technology, Qingdao 266590, China
3
College of Resources and Environment, Henan University of Technology, Jiaozuo 454000, China
*
Authors to whom correspondence should be addressed.
Processes 2025, 13(10), 3106; https://doi.org/10.3390/pr13103106
Submission received: 25 August 2025 / Revised: 24 September 2025 / Accepted: 25 September 2025 / Published: 28 September 2025
(This article belongs to the Section Energy Systems)

Abstract

Understanding coalbed methane (CBM) enrichment patterns is essential for optimizing production capacity. This study evaluates the CBM reservoir-forming characteristics and exploration potential of the Longtan Formation in the Santang Syncline, Zhijin area, to systematically reveal CBM enrichment and high-production patterns. The investigation integrates regional geology, logging, well testing, laboratory analyses, and drainage production data. Results indicate that coal seam vitrinite reflectance (Ro,max) ranges from 3.20% to 3.60%, with metamorphic grade increasing with burial depth. Coal lithotypes consist predominantly of semi-bright coal, with subordinate semi-bright to semi-dull coal and minor semi-dull coal. Coal seam roofs comprise gray-black mudstone and calcareous mudstone, locally developing limestone, while floors consist of bauxitic mudstone. Pore structure analysis reveals greater complexity in coal seams 6 and 14, whereas seams 7 and 16 display simpler structures. Coal seams 5-3 and 6 demonstrate the weakest adsorption capacity and lowest theoretical gas saturation, while other seams exceed 55% gas saturation. Langmuir volume (VL) increases with burial depth, reaching maximum values in coal seam 30. Langmuir pressure (PL) follows a low–high–low trend, with lower values at both ends and higher values in the middle section. Measured gas content is highest in the middle section, moderate in the lower section, and lowest in the upper section. Reservoir condition assessment indicates favorable conditions in coal seams 14, 16, and 21, relatively favorable conditions in seam 7, and unfavorable conditions in seams 6, 30, 32, and 35. Among the three coal groups penetrated, the middle coal group exhibits the most favorable reservoir conditions, followed by the upper and lower groups.

1. Introduction

With the continuous breakthroughs in the theory and technology of CBM exploration and development, CBM resources have become one of the important resources to promote China’s unconventional energy process [1,2,3,4,5]. Commercial CBM production has now been established in the Ordos Basin, Qinshui Basin, and western Guizhou–eastern Yunnan region [6,7,8,9,10,11]. Unlike other regions such as the Ordos Basin, the coal seams in the western Guizhou–eastern Yunnan have a unique development model characterized by “multipler and thinner coal seams, higher abundance of CBM resources” [12,13,14,15]. Therefore, a unique development model of “layered mining as the main approach” has been formed. Relevant data shows that Guizhou Province has become the largest coal production base and CBM resource enrichment area in southern China. It is predicted that the total CBM resources in the province are 2.23 × 10¹² m3~5.02 × 10¹² m3, accounting for about 10% of the national total. These resources primarily occur within Liupanshui, Zhina, and northern Guizhou coalfields [16,17,18,19,20,21].
With the development of China’s economy and society, energy demand has surged significantly. Therefore, development of unconventional natural gas such as CBM is becoming urgent. During 13th to 14th Five-Year Plan periods, continuous breakthroughs in single-well CBM production across Guizhou have demonstrated substantial development potential [22,23,24,25]. Especially the Santang syncline and Agung syncline in the Zhina coalfield. The highest daily production gas well of a vertical well is the C1-2 well in the Wenjiaba block, with a daily production of 6124 cubic meters; the highest daily production of horizontal wells is the Zhiping 3 well, with a daily production of 10,805 cubic meters; combined, Guizhou’s significant CBM potential is confirmed.
A large amount of geological exploration and research have shown that the geological structure and sedimentary environment in Guizhou region are unique and complex. The Longtan Formation of the Permian marine continental transitional facies contains abundant and significant coal bearing gas resources. Predicting and analyzing its resource potential not only helps future resource exploration and development, but also may create new avenues for enriching and improving the theory of oil and gas geology. Guizhou Province has carried out several rounds of coalbed methane resource investigation and evaluation in the past. It was found that the non-coal gas bearing beds of the Longtan Formation coal measures generally contain gas, and the non-coal gas bearing beds of the coal measures have contributed to gas production in the process of coalbed methane composite bed development. Some coalbed methane wells have undergone reconstruction of non-coal gas bearing beds and the pilot production of coalbed methane composite beds, the status of shale gas or sandstone gas resources of the Longtan Formation coal measures has been initially understood, and the transformation from independent development of coalbed methane to joint exploration and production of coal measure gas has been promoted. However, there is still a lack of objective understanding of the potential and strategic value of Guizhou coal measure gas resources, and a lack of in-depth thinking about the prospects of industrial development and strategic promotion path [26,27,28,29].
The primary aim of this study is to establish a comprehensive understanding of CBM enrichment mechanisms and identify high-productivity zones within the Santang Syncline. Specific objectives include: (1) characterizing the vertical distribution of coal quality parameters and gas content across multiple seams, (2) evaluating the relationship between geological factors and CBM accumulation, (3) identifying optimal target intervals for CBM development, and (4) providing a predictive framework for CBM exploration in similar geological settings. This research fills a critical knowledge gap by providing the first comprehensive characterization of multi-seam CBM reservoirs in the Santang Syncline, where previous investigations have been limited to single-seam analyses. The novelty lies in establishing depth-dependent relationships between coal properties, gas content distribution, and reservoir performance across multiple coal seams within a single geological structure. The systematic evaluation of vertical heterogeneity in CBM enrichment patterns provides crucial insights for optimizing multi-layer development strategies. These findings have significant implications for CBM exploration and production planning, particularly in deep coal-bearing synclines with complex reservoir characteristics. The established correlations between burial depth, pore structure complexity, and gas saturation can guide targeted drilling programs and completion designs, ultimately improving CBM recovery efficiency and economic viability in the Zhijin area and analogous coal-bearing basins.

2. Study Area and Data Used

2.1. Geological Background

The study area is in southern Nayong and western Zhijin of Guizhou Province, structurally positioned within the Zhijin Dome-Basin structural deformation zone of Northern Guizhou Uplift. It is bounded by the Liupanshui NW-trending fold-fault belt to the west, with the Agong NE-trending syncline adjacent to its east (Figure 1a). During Longtan Formation deposition, Santang Syncline and surrounding areas were characterized by marine-continental transitional facies. The early Longtan stage was dominated by lagoon deposits, while tide-influenced delta plain systems were developed during the middle Longtan stage. Lower delta plain deposits were formed in the late Longtan stage. Rocks formed during this period are composed of mudstone, silty mudstone, argillaceous siltstone, and siltstone. This paralic coal-bearing sequence with intercalated carbonate rocks and coal seams represents primary coal-bearing strata in the region, exhibiting disconformity with the underlying Emeishan Basalt Formation [30,31]. Among these, Longtan Formation is identified as principal coal-bearing unit, with thickness ranging from 180.97 to 207.45 m. 21–46 coal seams are contained, having cumulative thickness of 17.66–39.17 m, including ten workable seams. Coal seams 6, 7, 16, and 35 are mineable in the study area; coal seams 5-2, 14, 21, 30, and 32 are mostly mineable; and coal seams 5-3 is locally mineable. Cumulative thickness of workable seams is measured at 13.88–26.39 m (Figure 1b,c) [32,33,34].

2.2. Sample Collection and Experimental Testing

Coal samples were systematically collected from multiple seams within the Longtan Formation in the Santang Syncline. Fresh core samples were obtained during drilling operations and immediately sealed to preserve in situ conditions. Samples underwent standard preparation procedures including cutting, grinding, and sieving to obtain appropriate specimen sizes for different analytical tests. The comprehensive testing program included proximate and ultimate analyses, vitrinite reflectance measurements (Ro,max) using polarized light microscopy, gas content determination through canister desorption, and isothermal adsorption testing to determine Langmuir parameters (VL and PL).
Permeability measurements were conducted using the LW-1 core permeability automatic measuring instrument, which integrates both steady-state and transient testing modules with independent air pressure and confining pressure application systems. As illustrated in Figure 2, the testing apparatus consists of a high-pressure sample chamber with fluorocarbon rubber sleeve, connected to a gas source through ball valve A, buffer cylinder D, and pressure gauges (C, F, M). Cylindrical coal samples (25 mm diameter × 50 mm length) were subjected to varying confining pressures (2–8 MPa) to simulate in situ stress conditions, with nitrogen gas injected at controlled flow rates. Permeability was calculated using Darcy’s law once steady-state flow conditions were achieved, with measurements repeated at multiple stress levels to establish stress-dependency relationships.
Pore structure characterization was performed using low-temperature nitrogen adsorption (LT-N2GA) with an ASAP 2020 analyzer (Micromeritics, Norcross, GA, USA), capable of measuring pore diameters from 1.7 to 400 nm. Coal samples were crushed and sieved to 0.5 mm particle size, with 10 g samples degassed at 80 °C for 6 h before testing. Nitrogen adsorption isotherms were obtained at 77 K across relative pressures from 0.01 to 0.995. The Brunauer–Emmett–Teller (BET) model was applied to calculate specific surface area, while the Barrett–Joyner–Halenda (BJH) model determined pore volume and size distribution. All experimental data underwent quality control procedures including duplicate testing and calibration with standard reference materials to ensure reliability.

3. Results and Discussion

3.1. Coal Seam Burial Depth and Coal Rock Quality

The Longtan Formation in the study area has a thickness of 303–395 m, with an average of 359 m, demonstrating relative consistency as the primary coal-bearing stratum. This formation contains approximately 21–46 layers of coal, typically 30 seams, among which 10 minable seams are identified, coal seams 6, 7, 14-1, 14-2, 16, 21, 30, 32, and 35. According to the characteristics of lithology, rock, and sedimentary combination, the Longtan Formation is subdivided into three sections: the first section is composed of siltstone, mudstone and coal seams, with 1–2 limestone layers intercalated in its lower part. The majority of the coal seams in layers 30, 32, and 35 are mineable, displaying relatively consistent thickness. Member thickness ranges from 75.82 to 117.45 m, with an average of 93.20 m. The second section is composed of mudstone, silty mudstone, mudstone sandstone, sandstone, and coal seams. The coal seams in the entire area, including seams 7, 14, 16, and 21, are relatively consistent in thickness, ranging from 119.03 to 172.92 m in thickness, with an average of 140.51 m. The third section is composed of fine sandstone, siltstone, mudstone and coal seams. Three minable seams (5-2, 5-3, 6) are hosted by this member, exhibiting relatively consistent thickness. Thickness is recorded at 57.59–108.35 m, with an average of 76.65 m [29,30,32,33,34].
Roofs of coal seam are composed of gray-black mudstone and calcareous mudstone, with some areas developing limestone, and the floors are composed of bauxitic mudstone. Dense lithology of the roofs and floors are conducive to the preservation of CBM. The study area is situated within the Bijie-Zhijin Dome-Basin deformation zone, with Triassic strata exposed in the Santang Syncline axis, and coal seams buried at depths of 300–700 m. This burial depth range is considered advantageous for CBM exploitation. The actual drilling situation of the No. 6 coal seam in Well X of Santang is used in compiling burial depth contour map for coal seam 6 in the block (Figure 3) [30,31,32,33,34].
Coal seams encountered during drilling in the research area are mainly bright coal, followed by dull coal, with a small amount of vitrinite and coal streaks. According to the national standard GB/T 18023-2000, coal lithotypes are primarily classified as semi-bright coal, followed by semi-bright to semi-dull coal, with minor semi-dull coal [35]. (Table 1). True density of main minable coal seams is characterized by higher values at stratigraphic extremities and lower values in central intervals. Seam 5 (including sub-layers 5-2 and 5-3) is measured at 1.65–1.67 g/cm3 (average is 1.66 g/cm3), while seams 6-21 in middle interval are recorded at 1.58–1.66 g/cm3 (average is 1.63 g/cm3). This differentiation is constrained by sedimentary facies succession: Middle low-density zone is hosted within P3l2 interdistributary bay facies, where strong reducing conditions resulted in elevated vitrinite content, enabling organic matter to dilute mineral density. Conversely, upper/lower high-density zones are attributed to enhanced terrigenous clastic input in P3l3 prodelta facies, where increased ash content causes density elevation (Figure 4).
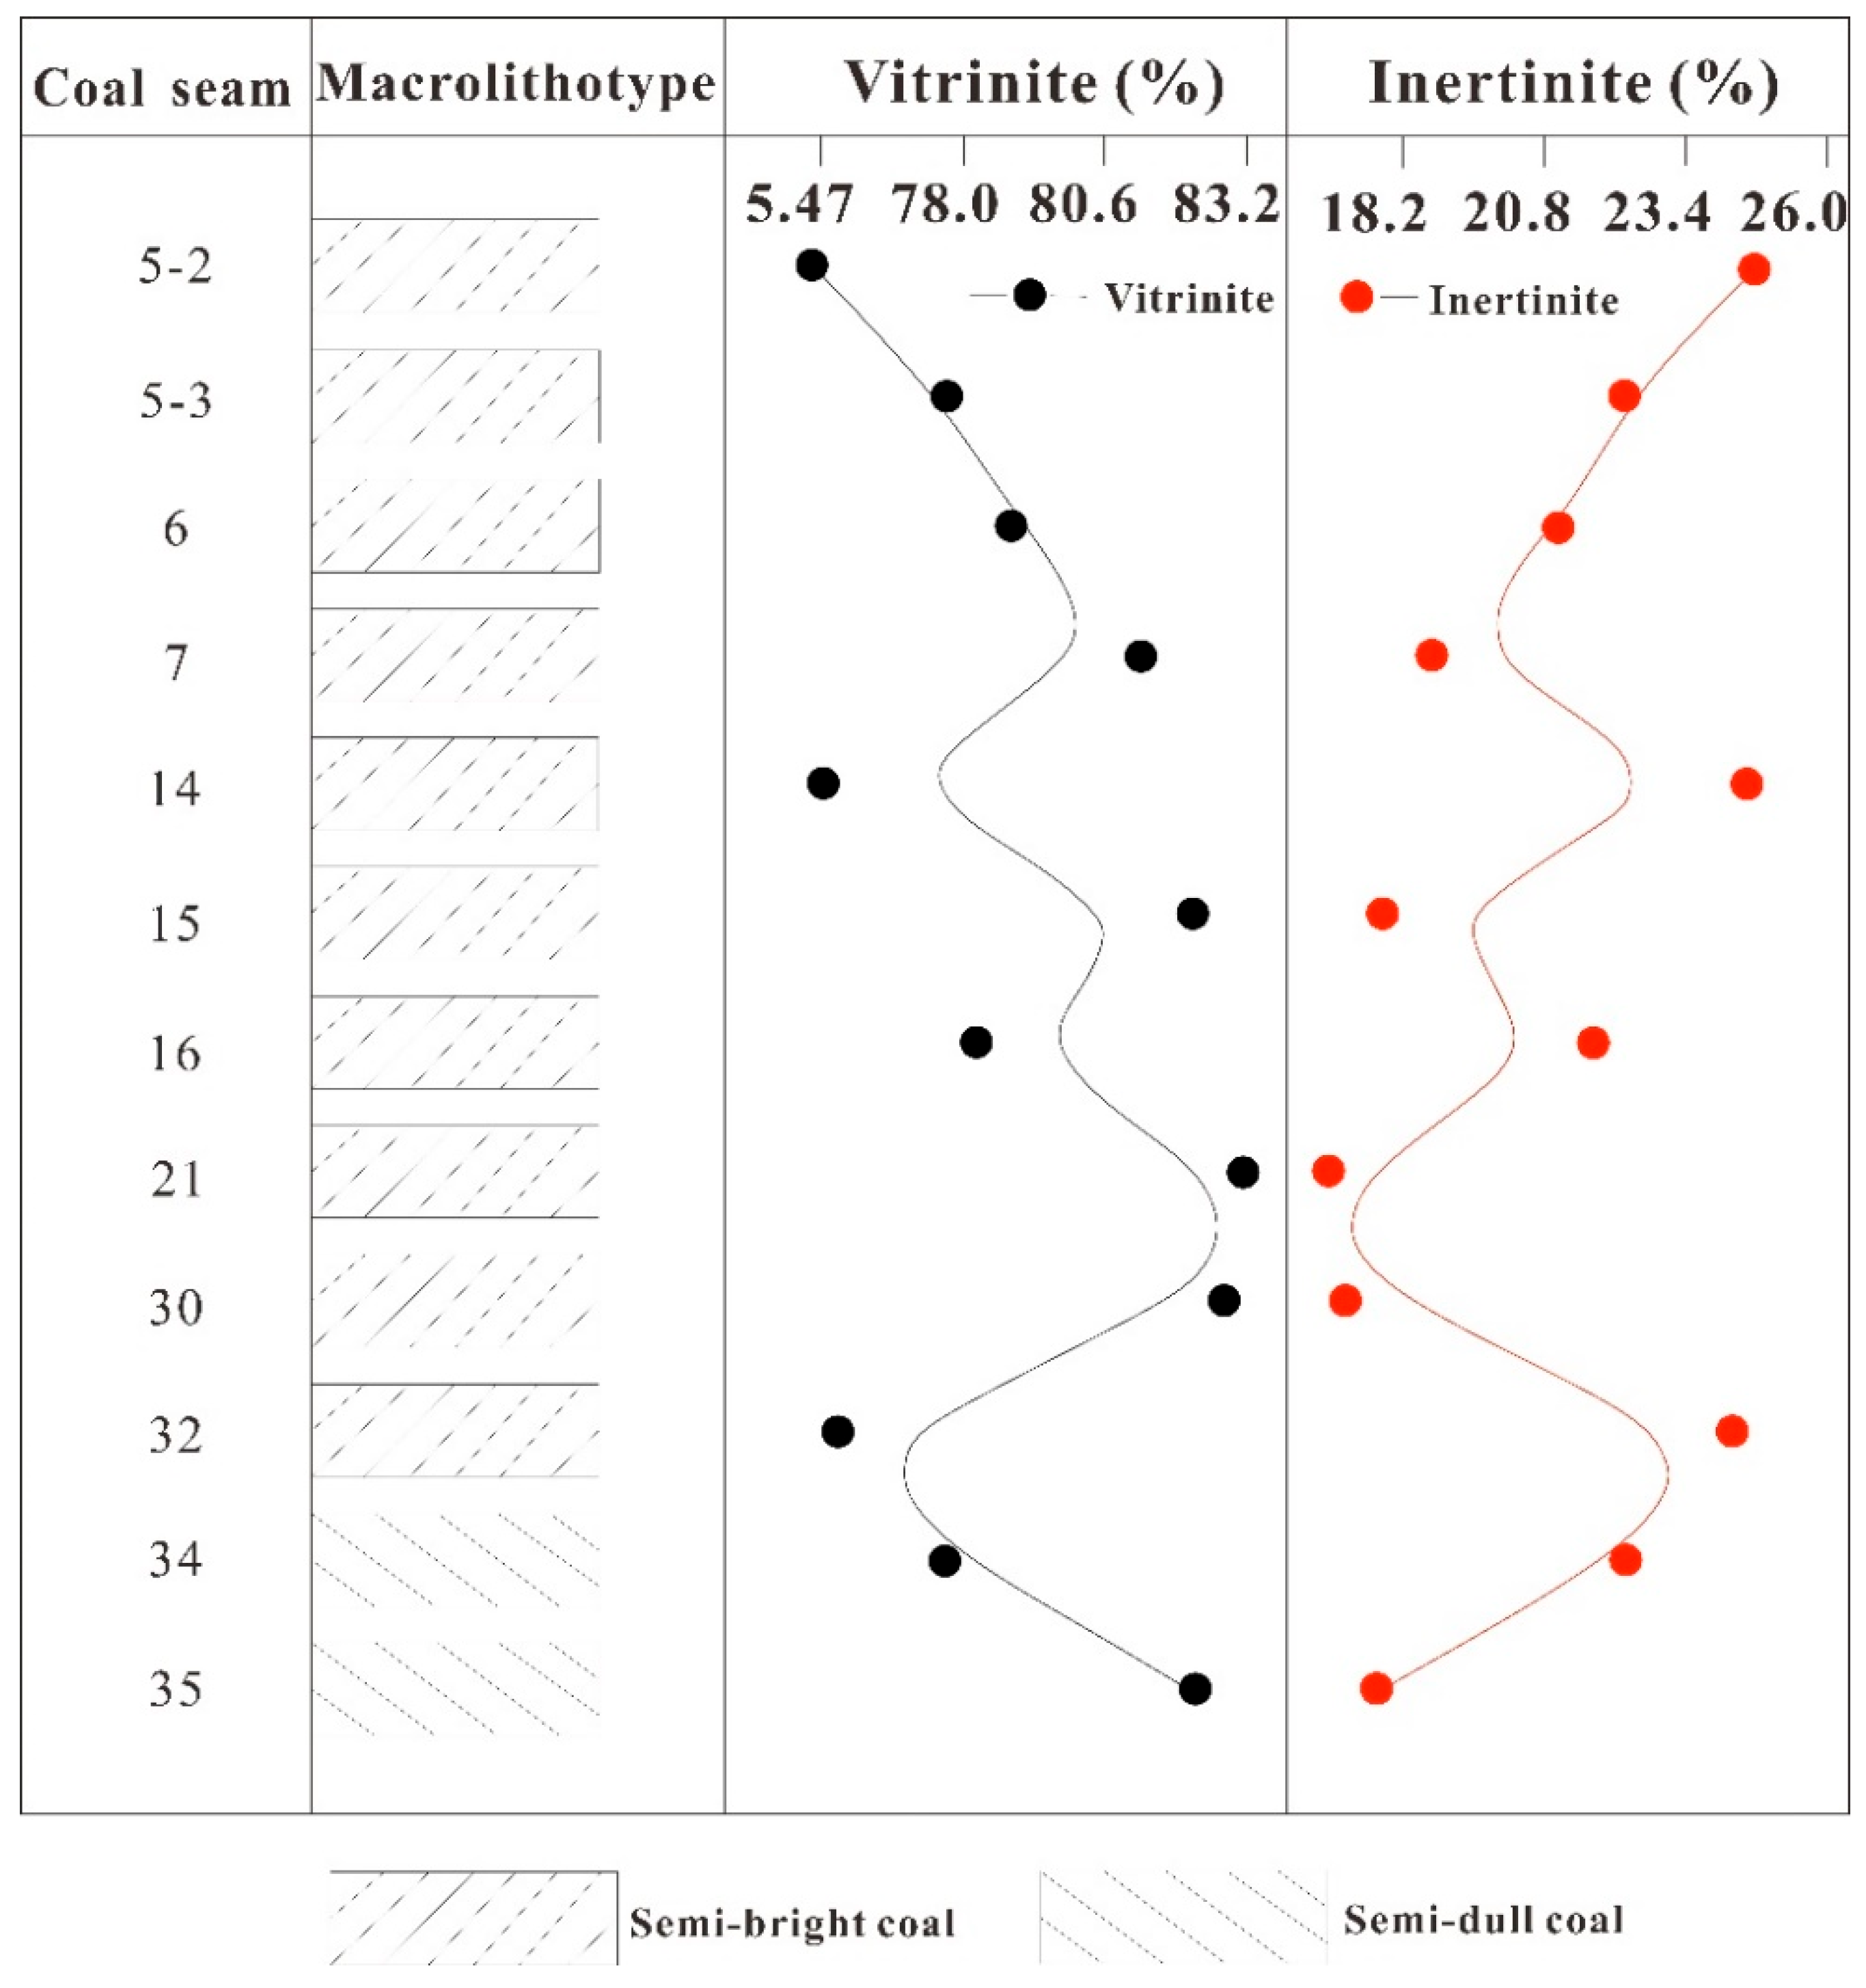
Petrographic analysis of minable coal seams within the study area reveals that organic components comprise vitrinite and inertinite groups. On a mineral-included basis, total organic content ranges from 76.89% to 93.39%, with an average of 85.59%, while the mineral-free basis consistently yields 100% organic content. When calculated on a demineralized basis, the combined vitrinite and inertinite content universally exceeds 95% for all workable coal seams, resulting in the classification of all major workable seams as vitrinertite based on their microscopic lithotypes.
Inorganic constituents within study area are dominated by clay minerals, with subordinate quartz minerals, minor pyrite, and least carbonate minerals. Total inorganic content ranges from 6.64% to 23.11%, average is 14.42% (Figure 5).
Maximum vitrinite reflectance (Ro,max) of coal seams ranges from 3.20% to 3.60%, classifying all coals as high-rank type I. Metamorphic grade is universally high across seams, with metamorphic stage consistently identified as VII1. Metamorphic degree generally increases with burial depth. Dry-basis ash content of raw coal measures 9.82–50.37% (average is 23.29%). Dry-ash-free basis volatile matter yield ranges from 2.03% to 17.88% (average is 8.38%). Dry-mineral-matter-free basis fixed carbon content is recorded at 67.95–74.60% (average for the entire region is 70.74%) (Figure 5).
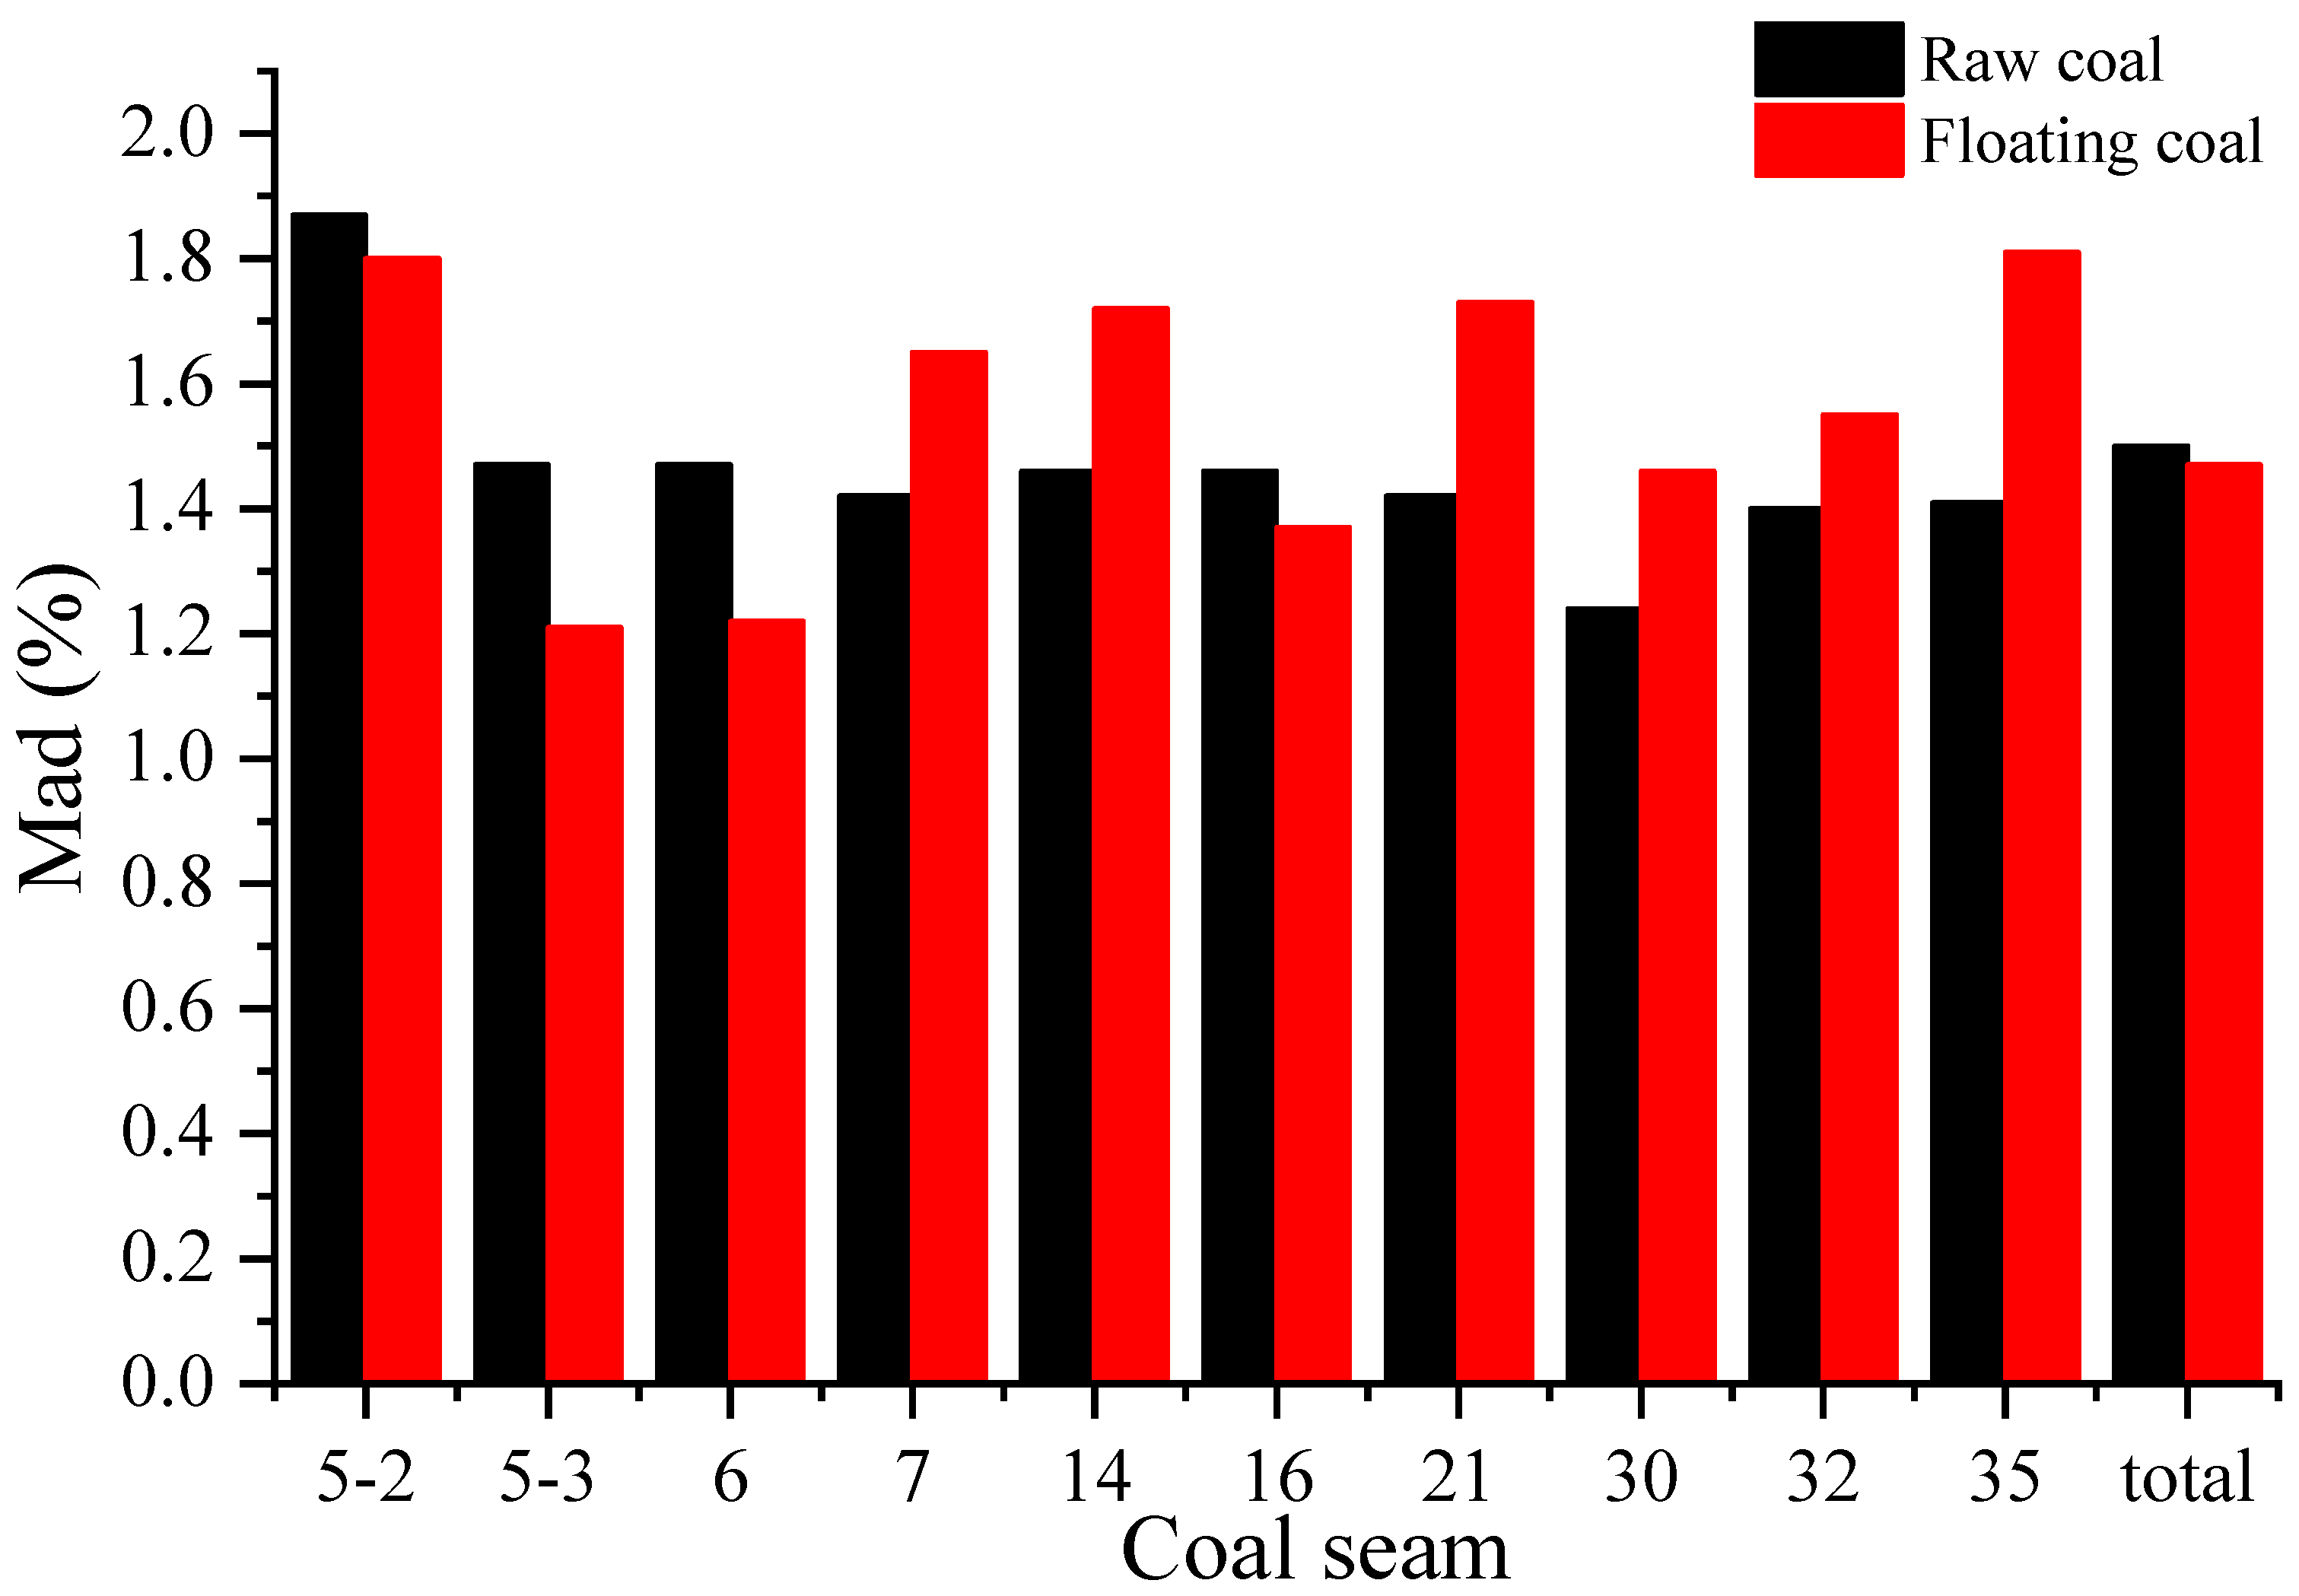
Air-dried moisture content (Mad) of raw coal across the entire area ranges from 1.13 to 1.87% (average is 1.50%). An extreme disparity is observed between the peak value of 1.87% (average is 24.7%) in coal seam 5-2 and the minimum value of 1.13% in coal seam 6. Overall, Mad of raw coal is characterized by an initial rapid decrease followed by stabilization with increasing burial depth; the minimum average value of 1.24% is recorded for coal seam 30. For floated coal after washing, Mad ranges from 1.13% to 2.17% (average is 1.47%). Notably, Seam 7 (1.65%), Seam 14 (1.72%), Seam 21 (1.73%), and Seam 35 (1.81%) exhibit a moisture inversion phenomenon as burial depth increases (Figure 6).

3.2. Petrophysical Characteristics of Coal Reservoirs

3.2.1. Pore–Fracture Structure

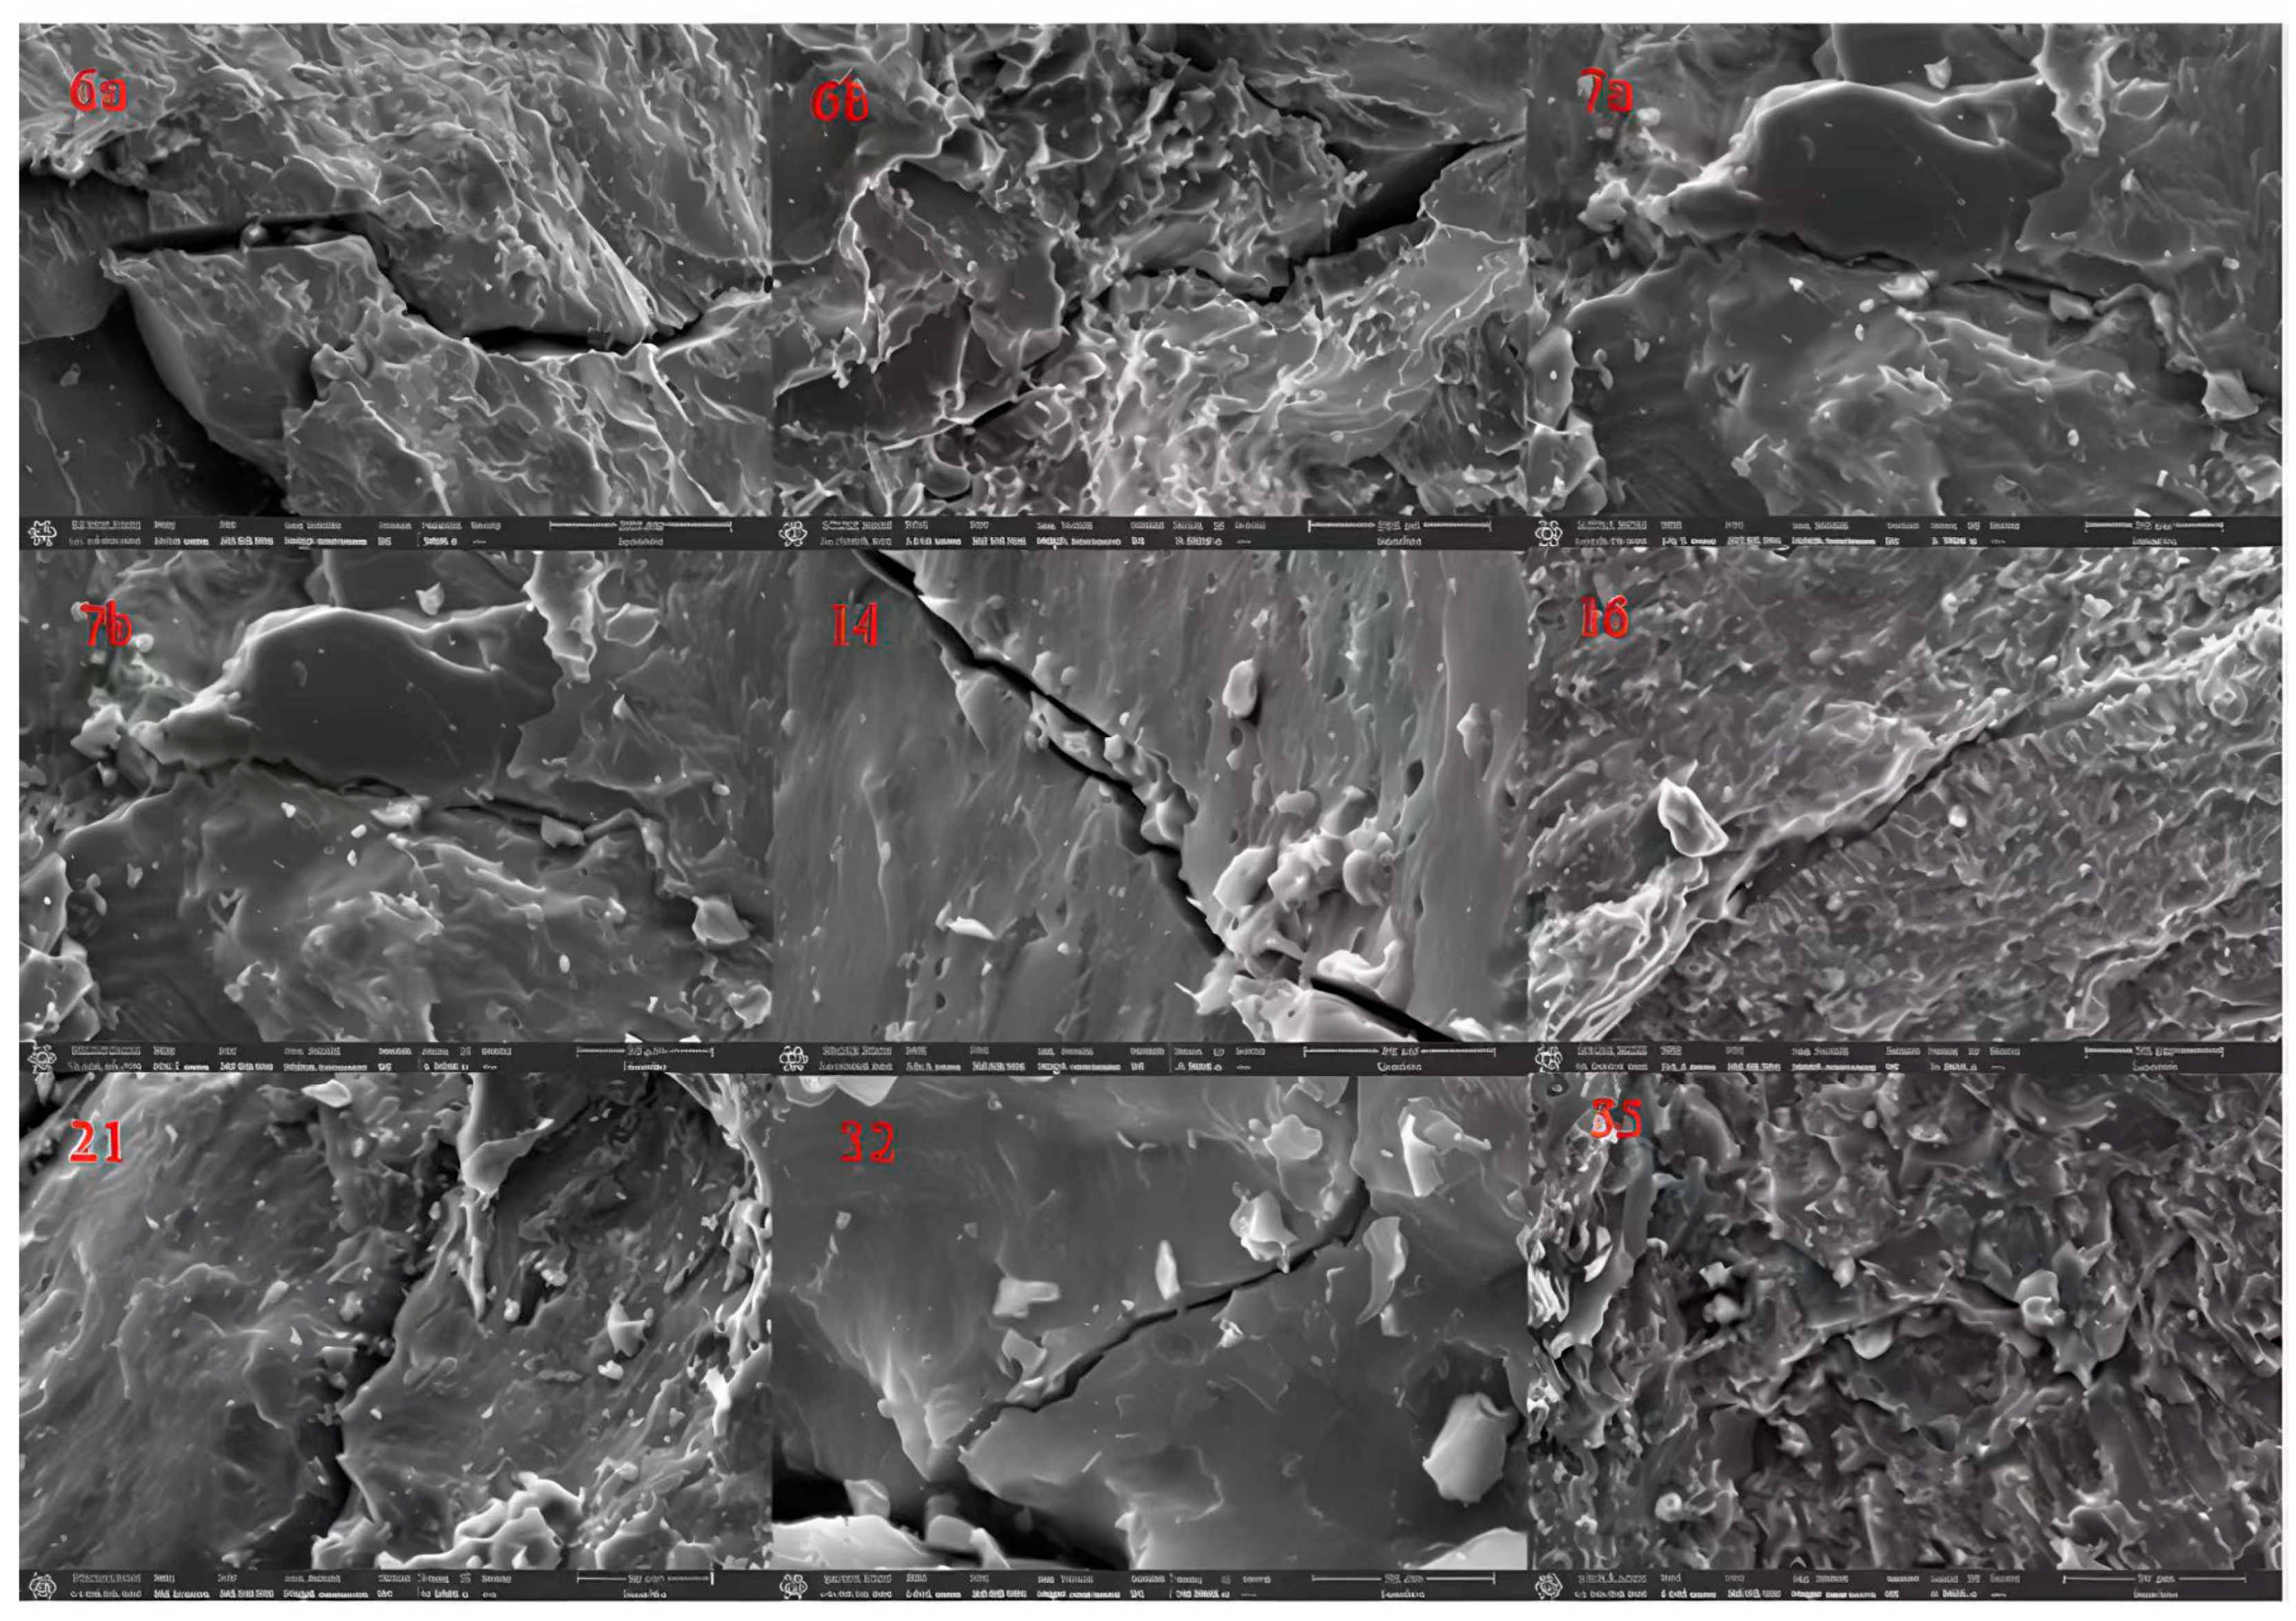
Scanning electron microscopy (SEM) analysis reveals distinct characteristics among the coal seams. Seam 6 exhibits a relatively rough surface with well-developed micropores, macropores, and joints; micropores are interconnected by minute fractures. Seam 7 displays well-developed macropores and larger penetrating fractures, with no infill observed within the fractures. Seam 14 shows pores developed at different hierarchical levels; joint connectivity is relatively good, microfractures are well-developed with good connectivity, although some fractures contain detrital infill. Seam 16 demonstrates relatively well-developed macropores and joints, with wider fractures present; fractures and macropores are partially infilled, yet providing favorable gas migration pathways and good pore–fracture connectivity. Seam 21 presents a relatively rough surface and a denser structure, with no discernible fractures observed in the tested sample. Seam 32 contains certain penetrating fractures, but fracture surfaces exhibit some detrital infill. Seam 35 shows relatively well-developed macropores and joints, with wider fractures present; fractures and macropores are partially infilled, providing favorable gas migration pathways and good pore–fracture connectivity (Figure 7).
Pore-permeability characteristics of coal reservoirs within the study area exhibit pronounced heterogeneity and interlayer variability, as demonstrated in Table 2 and Figure 8. Measured permeability ranges between 0.0017 mD and 0.0295 mD, while porosity values span 3.9372% to 7.3798%. Among these, maximum permeability (0.0295 mD) is recorded in coal seam 30, whereas minimum permeability (0.0017 mD) is observed in coal seam 32. An overall trend is noted where moderately deep coal seams (30, 35) demonstrate superior permeability compared to shallow coal seams (5-3, 6, 7). Porosity exhibits an initial decrease followed by an increase with burial depth, peaking at 7.3798% in coal seam 35 and reaching a minimum of 3.9372% in coal seam 14. This porosity distribution is consistent with pore–fracture development characteristics observed via SEM—specifically, well-connected networks formed by broad fractures and partially filled gas pores in coal seam 35, versus coal seam 14 where abundant microfractures are largely rendered ineffective by detrital infill, reducing accessible pore space. Notably, permeability of coal seam 7 (0.01187 mD) is significantly higher than adjacent coal seam 6 (0.0068 mD). This disparity, combined with SEM observations of continuous, unfilled fractures in coal seam 7, indicates open-type fracture systems are critical for permeability enhancement. Conversely, despite relatively high porosity (6.8171%) in coal seam 32, severe detrital infilling along fracture surfaces results in exceptionally low permeability, revealing dominant control of pore connectivity over fluid flow capacity.
Significant differences are observed in the nitrogen adsorption and desorption curves among the different samples. A distinct hysteresis loop is exhibited by the adsorption-desorption curve of coal seam 6, indicating the prevalence of ink-bottle-shaped pores and a more complex pore structure within this sample type. In contrast, the adsorption and desorption curves of coal seam 7 are nearly parallel, suggesting that slit-shaped pores dominate and the pore structure is simpler. Similar to coal seam 6, the adsorption and desorption curves of coal seam 14 also nearly coincide and exhibit a noticeable hysteresis loop; however, the hysteresis phenomenon is markedly less pronounced than that observed in Seam 6. This signifies that the pore structure within this sample type is relatively complex, albeit less complex than that of coal seam 6. Analogous to coal seam 7, the adsorption and desorption curves of coal seam 16 are nearly parallel, indicating a relatively simpler pore structure. However, overall, the pore structures of coal seams 6 and 14 are more complex, while those of coal seams 7 and 16 tend to be simpler (Figure 9).
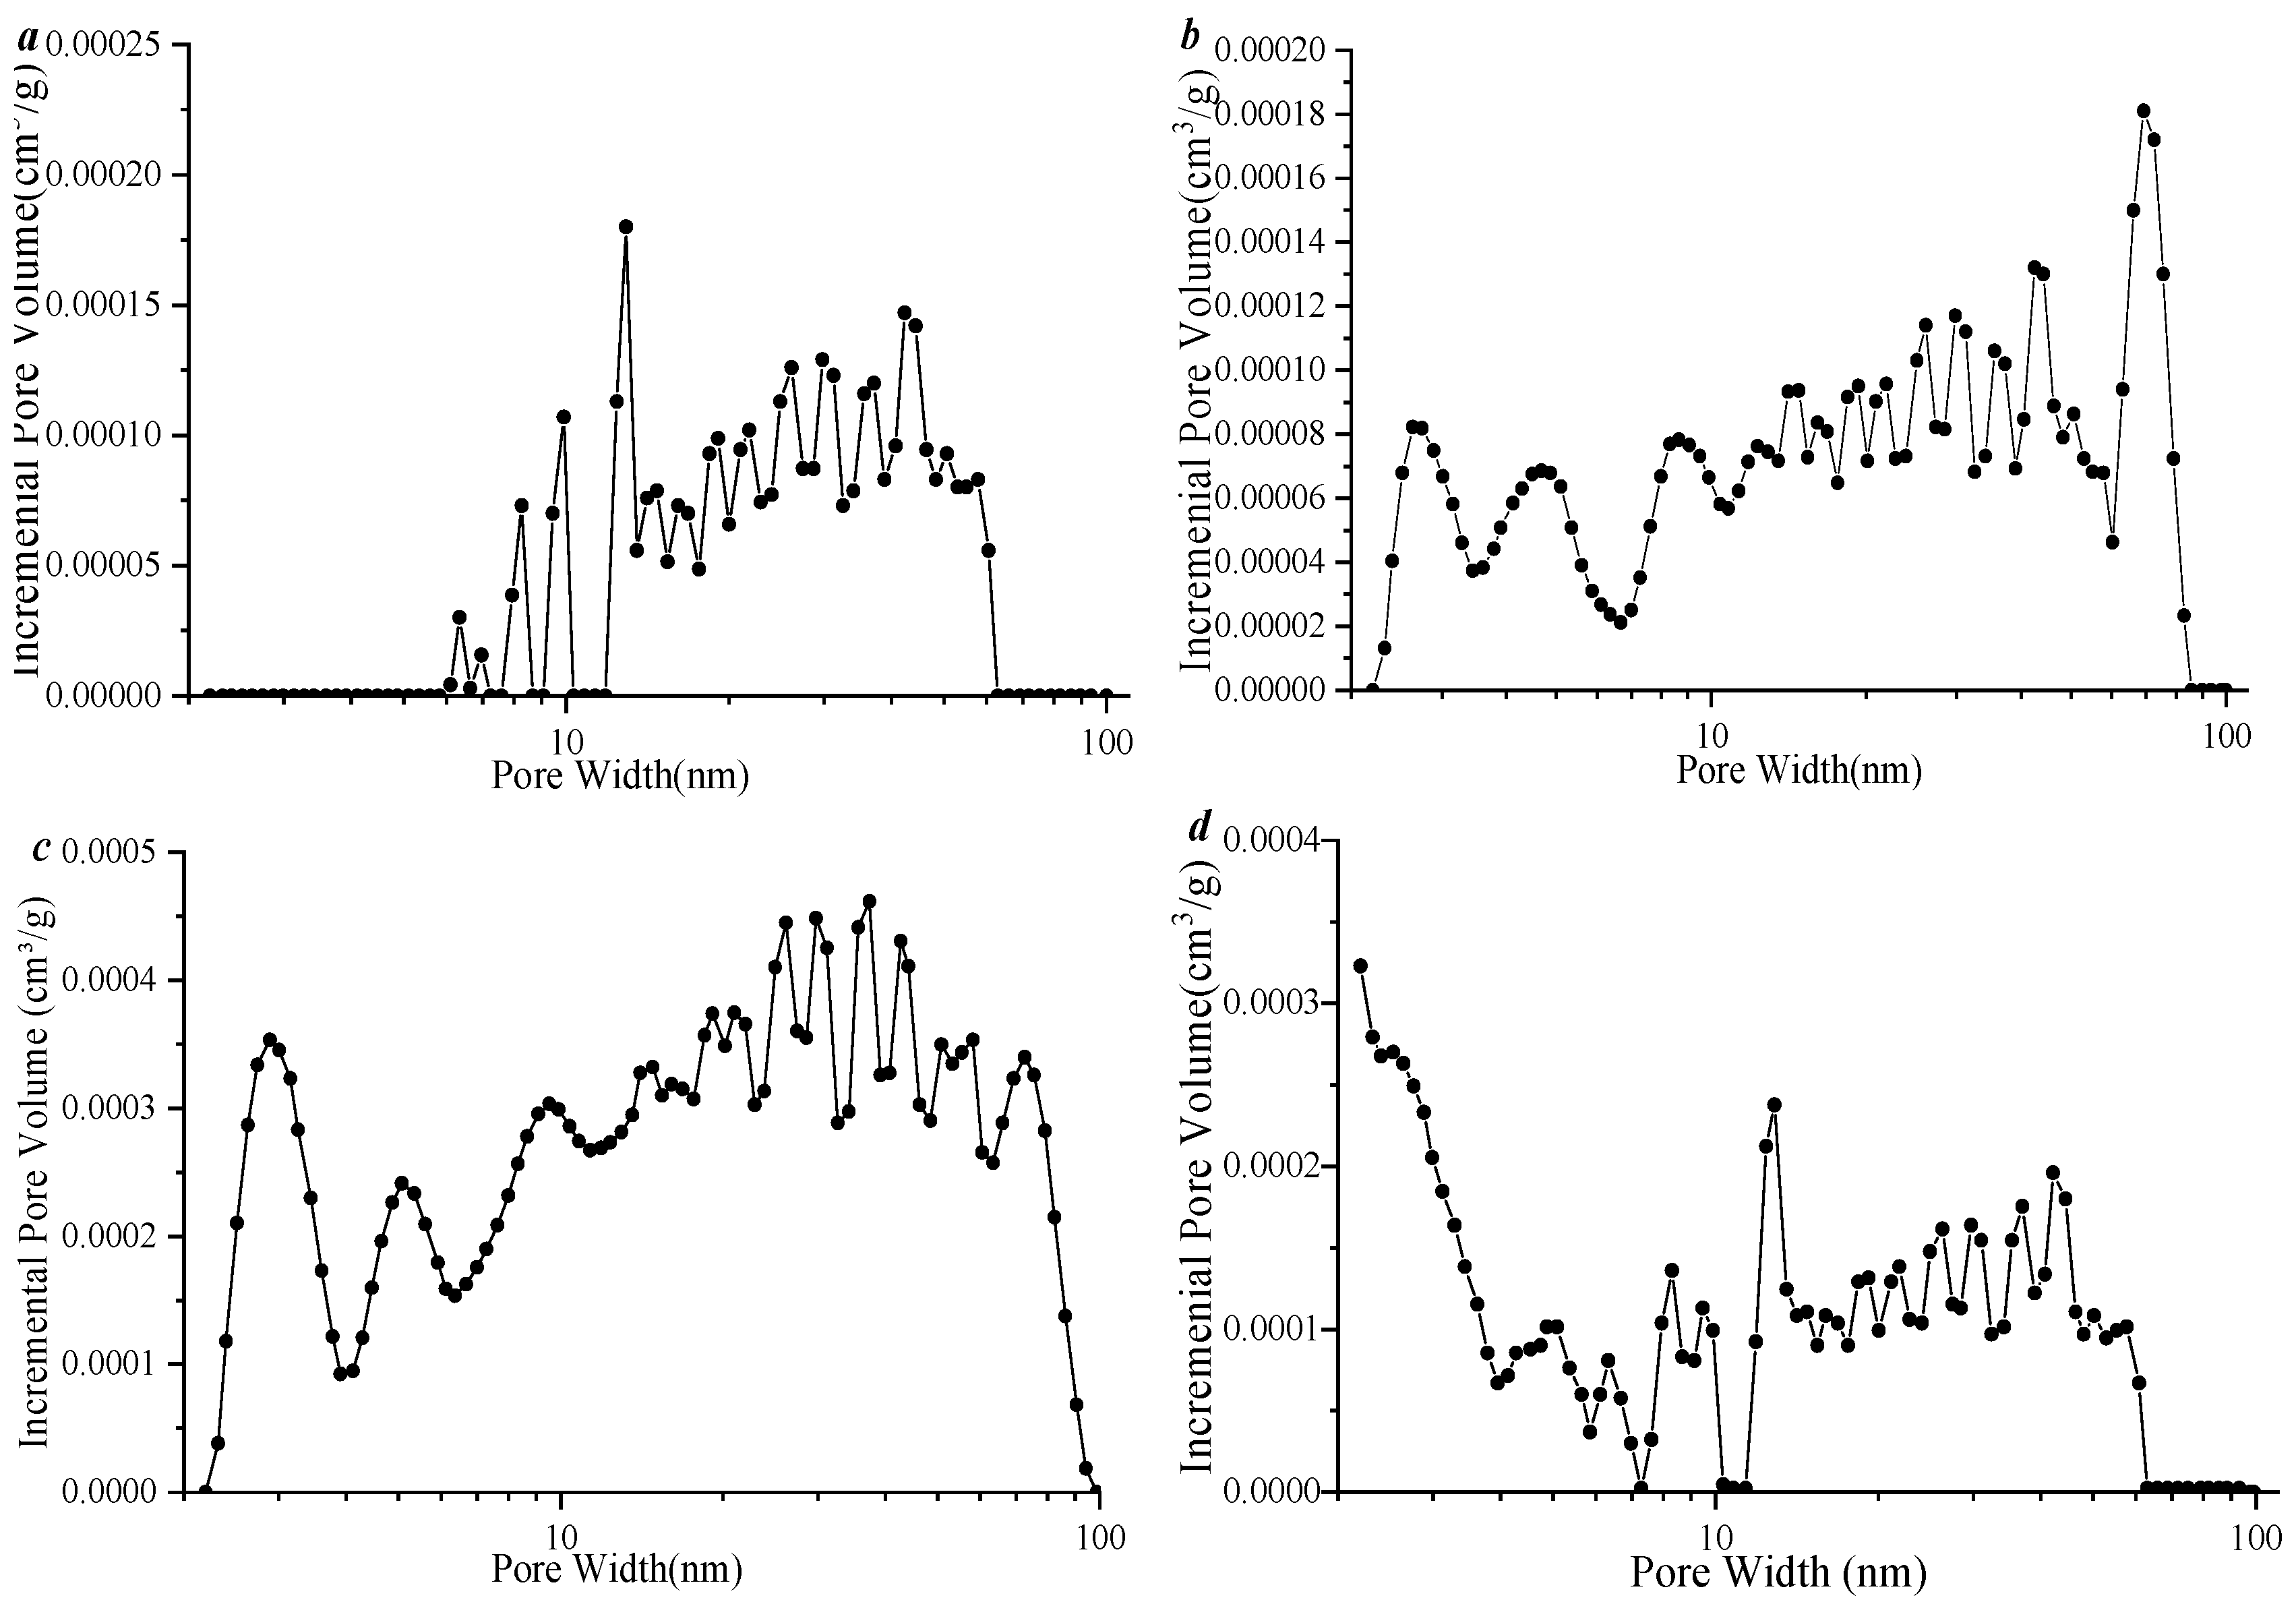
Coal seam 6 (Figure 10a) exhibits a bimodal pore size distribution, with primary peaks located within 2–10 nm (micro-pores) and 20–60 nm (meso-pores). A sharp decline in incremental pore volume is observed around 10 nm, reflecting coexisting ink-bottle-shaped pores and narrow throats, consistent with hysteresis loops identified through liquid nitrogen adsorption tests. Coal seam 7 (Figure 10b) demonstrates a unimodal skewed distribution, with pore sizes concentrated between 10–100 nm. Incremental pore volume decreases gradually with increasing pore size, indicating a homogeneous pore network dominated by slit-shaped pores. Its permeability advantage (0.01187 mD) is attributed to efficient connectivity between open fractures and mesopores. Coal seam 14 (Figure 10d) displays a sharp peak near 2 nm, accompanied by a steep decrease in incremental pore volume around 10 nm, similarly corroborated by hysteresis loops in liquid nitrogen adsorption tests. Coal seam 16 (Figure 10c) shows a distinct peak at approximately 3 nm, with incremental pore volume becoming negligible beyond 100 nm. Primary pore volume resides within 10~100 nm, exhibiting a well-connected pore network enhancing fluid transport.
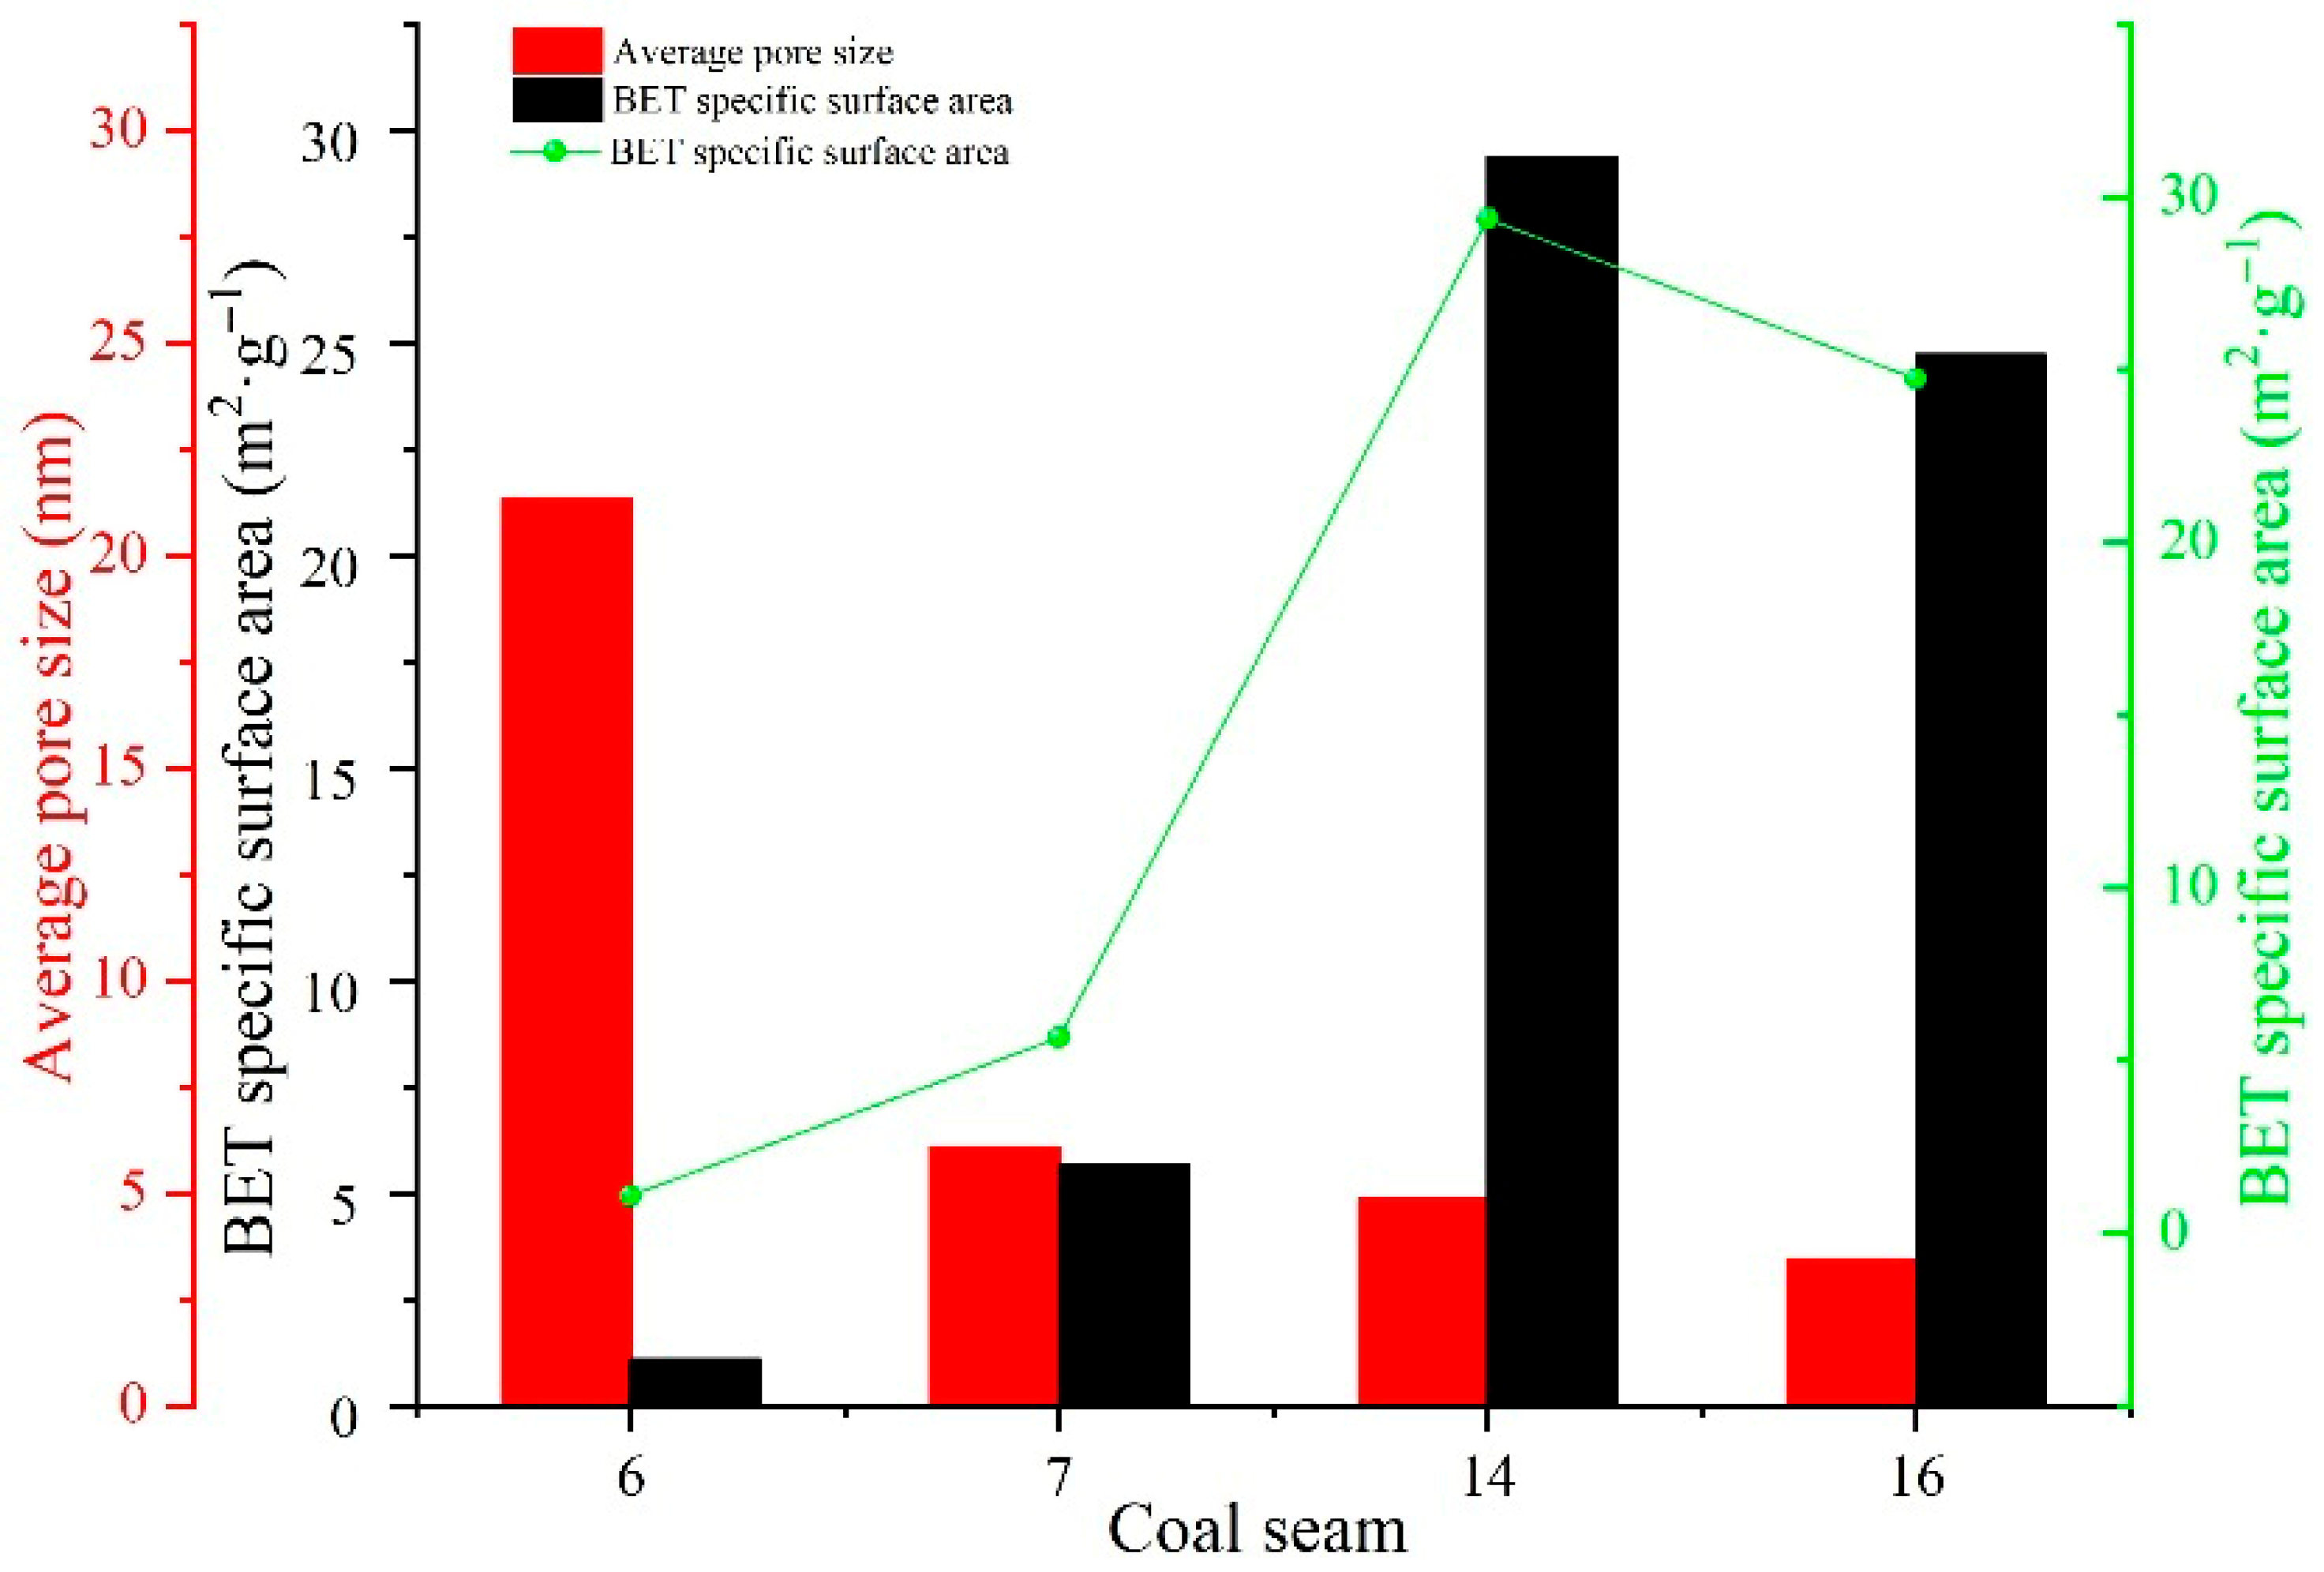
Coal seam 6 exhibits the largest average pore diameter (21.3116 nm), yet both BET specific surface area (1.0775 m2·g−1) and BJH pore volume (0.0056 cm3·g−1) are recorded as the lowest values. This indicates mesopore-dominated ink-bottle-shaped pores with connectivity restricted by narrow throats. For coal seam 7, average pore diameter is significantly reduced to 6.0634 nm, while BET specific surface area (5.6578 m2·g−1) and pore volume (0.0081 cm3·g−1) are elevated, reflecting a homogeneous pore network dominated by slit-shaped pores. Coal seam 14 demonstrates a further decreased average pore diameter (4.8568 nm), but achieves peak values in BET specific surface area (29.3693 m2·g−1) and pore volume (0.0315 cm3·g−1), forming an adsorption-favorable configuration with high surface area. Although coal seam 16 possesses the smallest average pore diameter (3.4135 nm), its BET specific surface area (24.7256 m2·g−1) and pore volume (0.0196 cm3·g−1) remain notably higher than those of shallow seams despite being slightly lower than seam 14. Pore size distribution reveals well-connected pore volume dominating the 10–100 nm range, enhancing fluid transport capacity (Table 3 and Figure 11).
Virgin permeability parameters for coal seams 6, 7, 14, 21, and 32 in Santangcan Well 2 were acquired through injection/falloff well testing (Table 4). Coal seam 6 exhibits virgin permeability of 0.0294 mD, classified as a low-permeability reservoir. Coal seam 7 demonstrates virgin permeability of 0.215 mD, categorized as a medium-permeability reservoir. Coal seam 14 registers virgin permeability of 0.0271 mD, identified as a low-permeability reservoir. Coal seam 21 shows virgin permeability of 0.15 mD, characterized as a medium-permeability reservoir. Coal seam 35 reveals virgin permeability of 0.19 mD, designated as a medium-permeability reservoir.
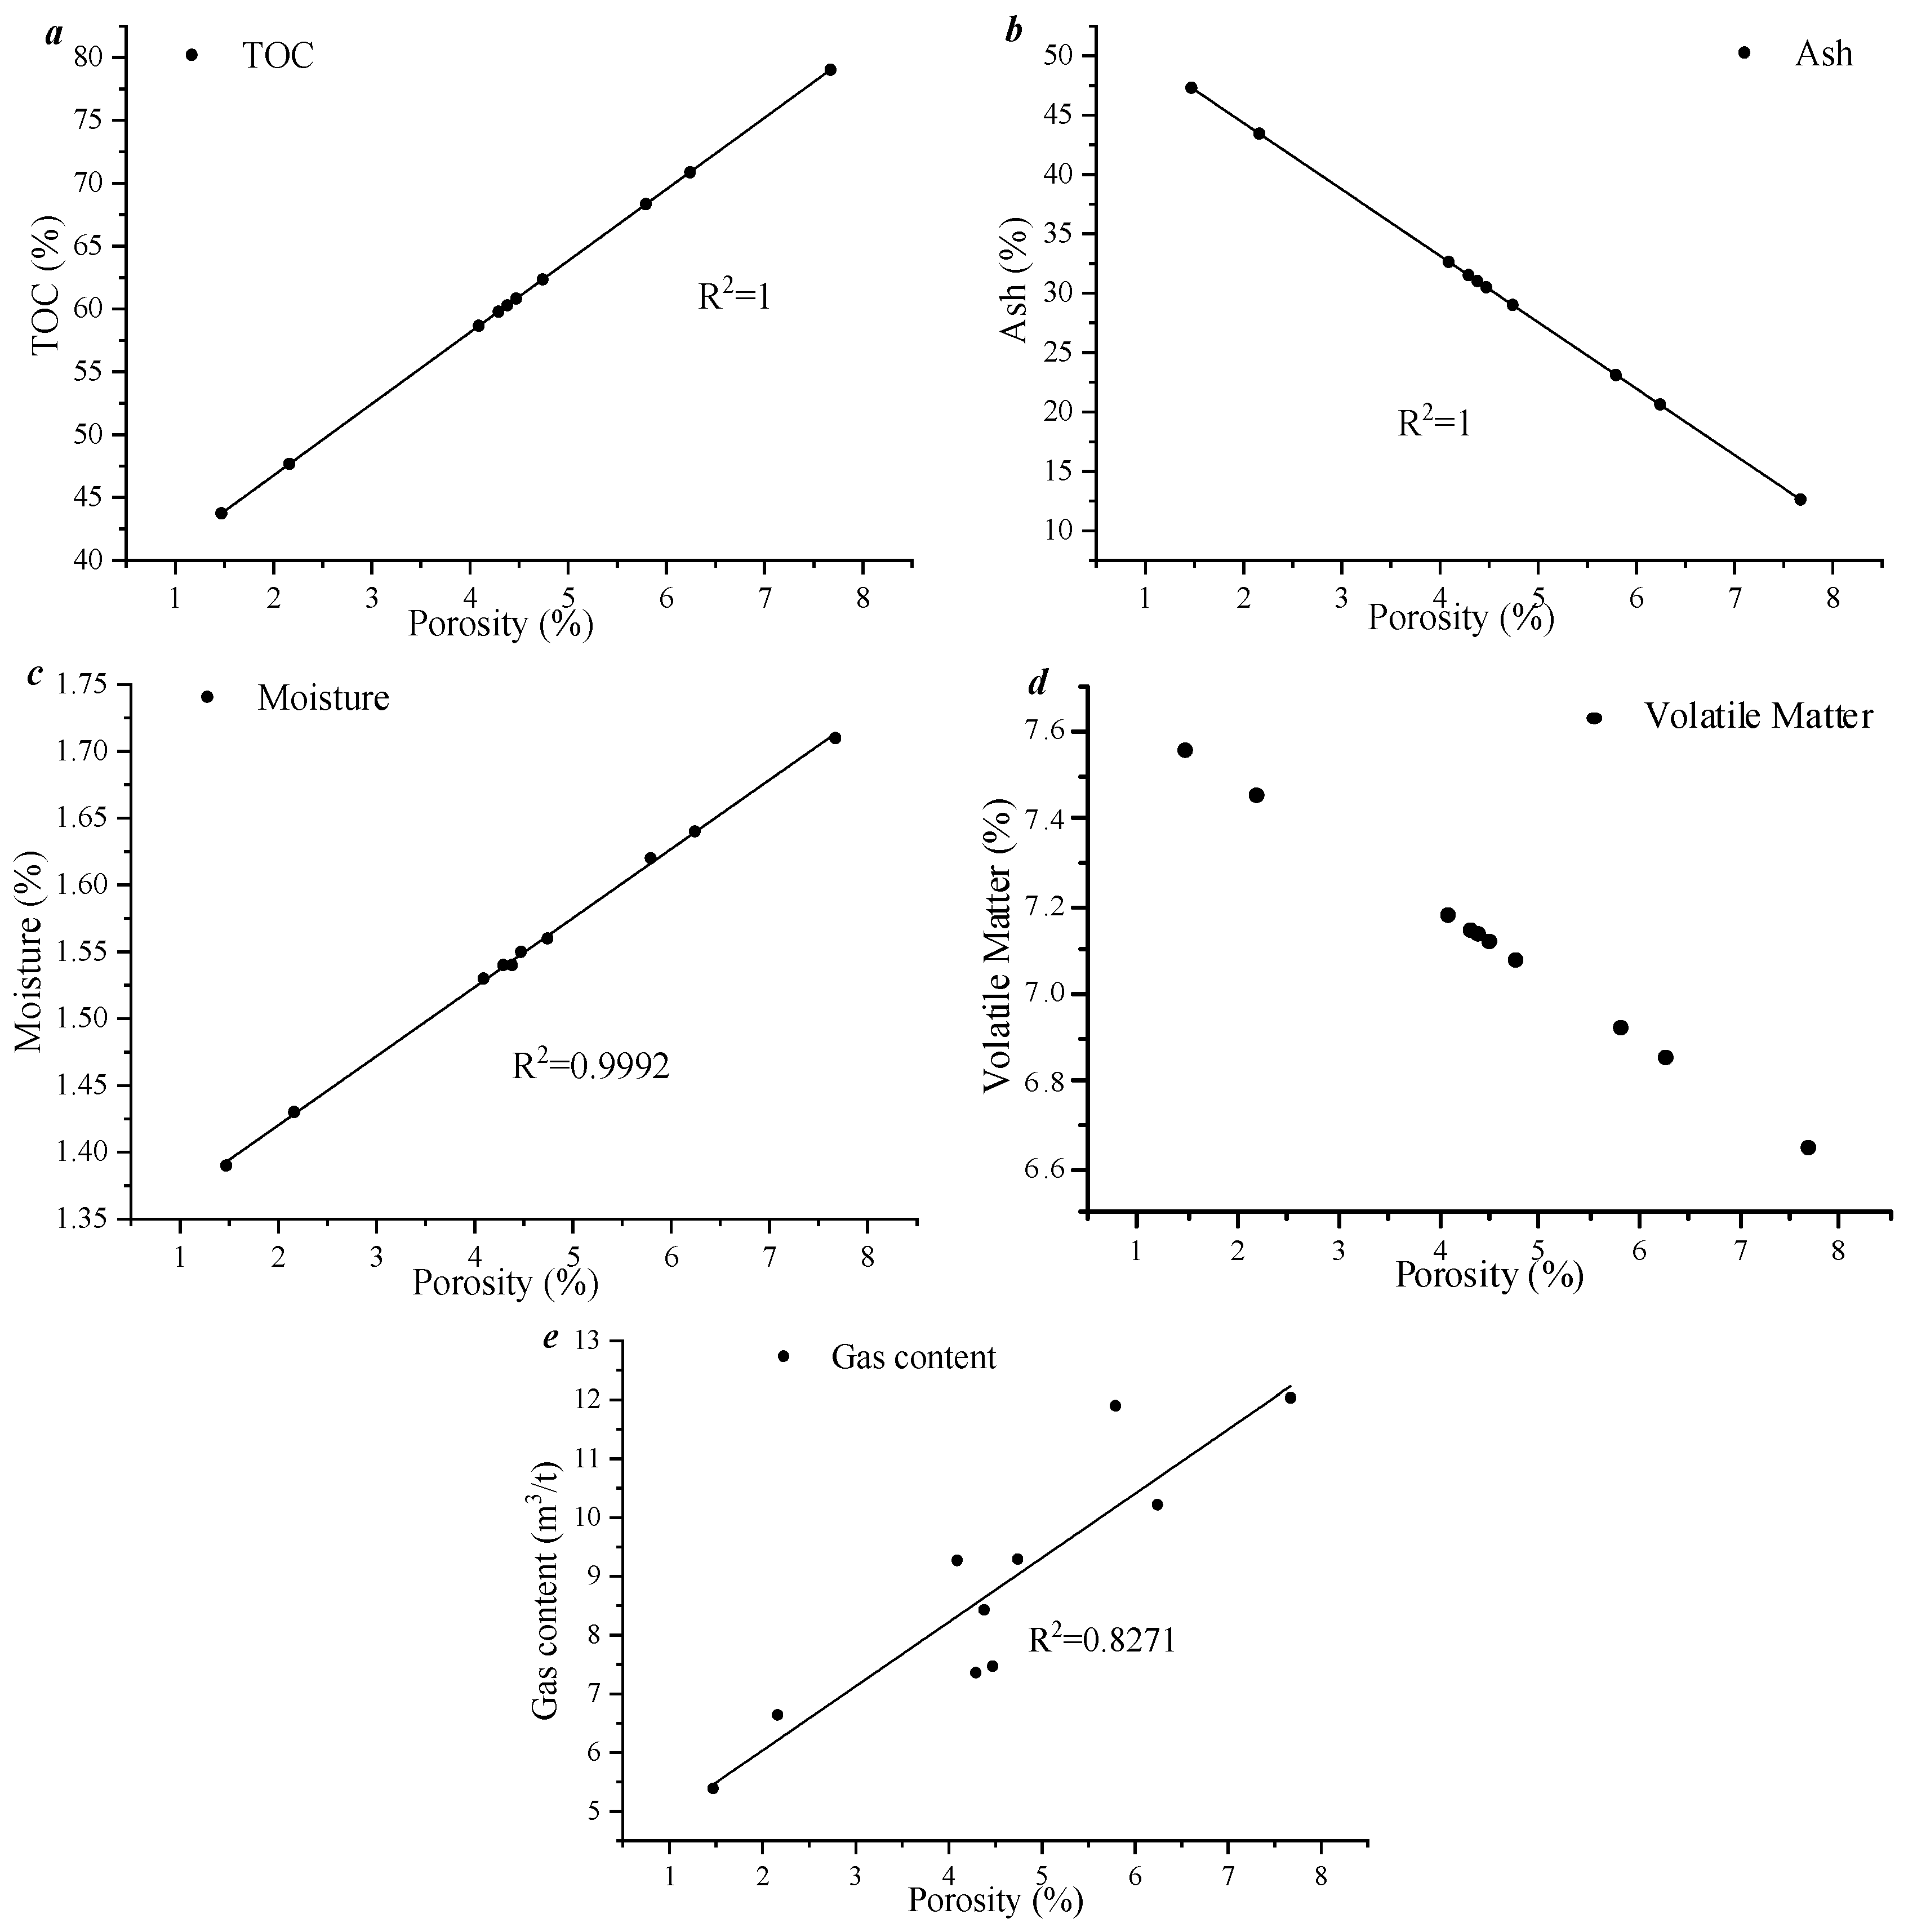
On this basis, correlations between proximate analysis components, gas content, and other parameters with porosity and permeability were discussed. A significant positive correlation was observed between porosity and total organic carbon (TOC) content (Figure 12a), reflecting contribution of micropores and mesopores formed by organic matter during coalification to pore space; while a negative correlation with ash content (Figure 12b) indicated that effective pore space was compressed by filling effect of inorganic minerals. In addition, positive correlation between porosity and moisture (Mad) content (Figure 12c) may be attributed to adsorption of moisture in micropores of coal matrix, and negative correlation with volatile matter (Vol) content (Figure 12d) suggested that pore structure was damaged by degradation of organic matter in high-volatile coal during thermal evolution. Notably, positive correlation between porosity and CBM content further confirmed that gas adsorption capacity was promoted by micropore development (Figure 12e).
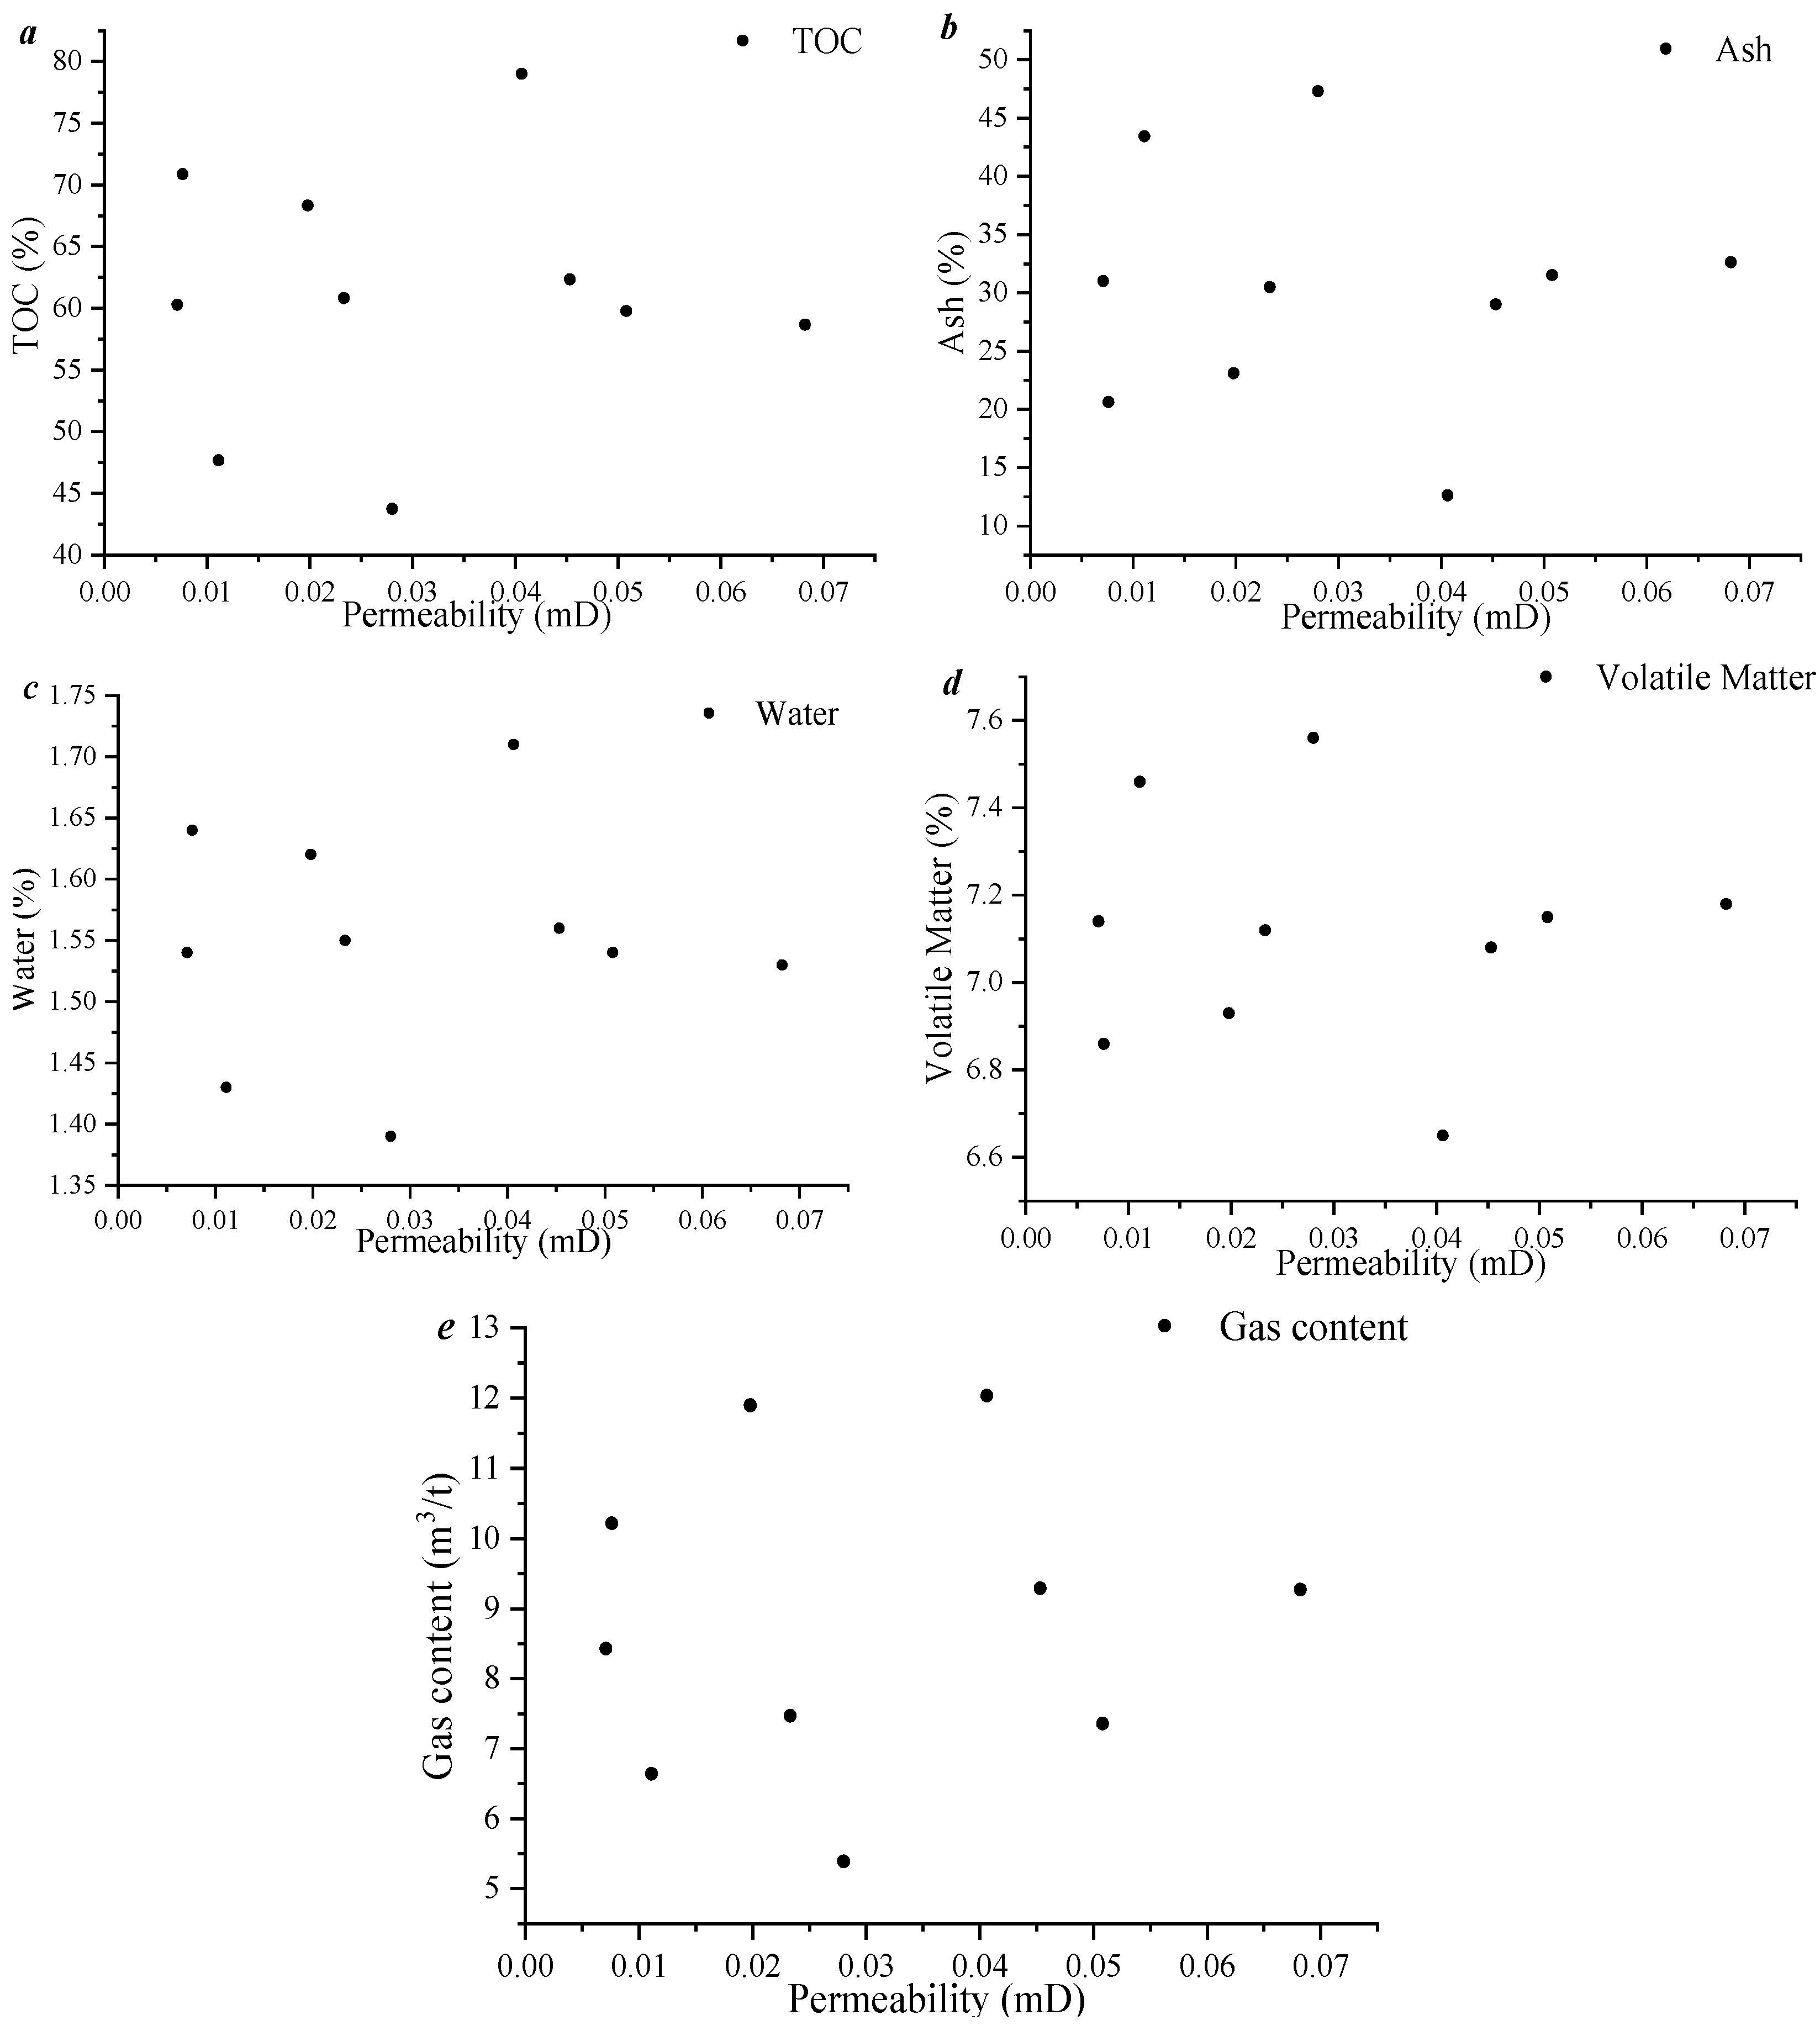
Unlike porosity, correlations between permeability and all proximate analysis components were weak. Specifically, weak positive correlation between permeability and total organic carbon (TOC) content may be attributed to local fractures formed by organic matter during thermal evolution, but the overall impact was limited; weak negative correlation with ash content reflected local blocking effect of mineral filling on fractures, but no significant restriction was formed. Weak negative correlation between moisture (Mad) and permeability may suggest that gas migration was slightly hindered by retention of moisture in fractures, while weak positive correlation with volatile matter (Vol) content may be related to the coal rank; this indicates that fracture development is facilitated by higher brittleness of low-rank coal. Notably, weak positive correlation between coalbed methane content and permeability further confirmed the importance of fracture system for free gas seepage, but the correlation was weak, indicating that permeability is mainly controlled by connectivity of macro-fractures rather than adsorbed gas content (Figure 13).
Comprehensive analysis shows that, as a key parameter characterizing gas seepage capacity, permeability is mainly controlled by opening degree and connectivity of fracture system rather than proximate analysis components of coal, indicating that in coal reservoir evaluation, fine characterization of fracture system is more effective in predicting permeability changes than proximate analysis. Research results have guiding significance for optimization of fracturing target intervals—priority should be given to coal seams with well-developed fractures and low filling degree rather than simply relying on proximate analysis parameters.

3.2.2. Coal Seam Adsorption Characteristics

Gas content serves as a critical indicator for CBM resource evaluation and a key parameter directly influencing CBM reserve assessment results. Detailed gas content desorption tests were conducted on major coal seams and associated coal-bearing sandstone-mudstone sequences in the Santangcan Well 2. Gas content of the primary coal seams ranges from 8.98 m3/t to 18.05 m3/t. Seam 16 exhibits the highest gas content, reaching 18.05 m3/t, while seam 5-2 shows the lowest value of 8.98 m3/t.
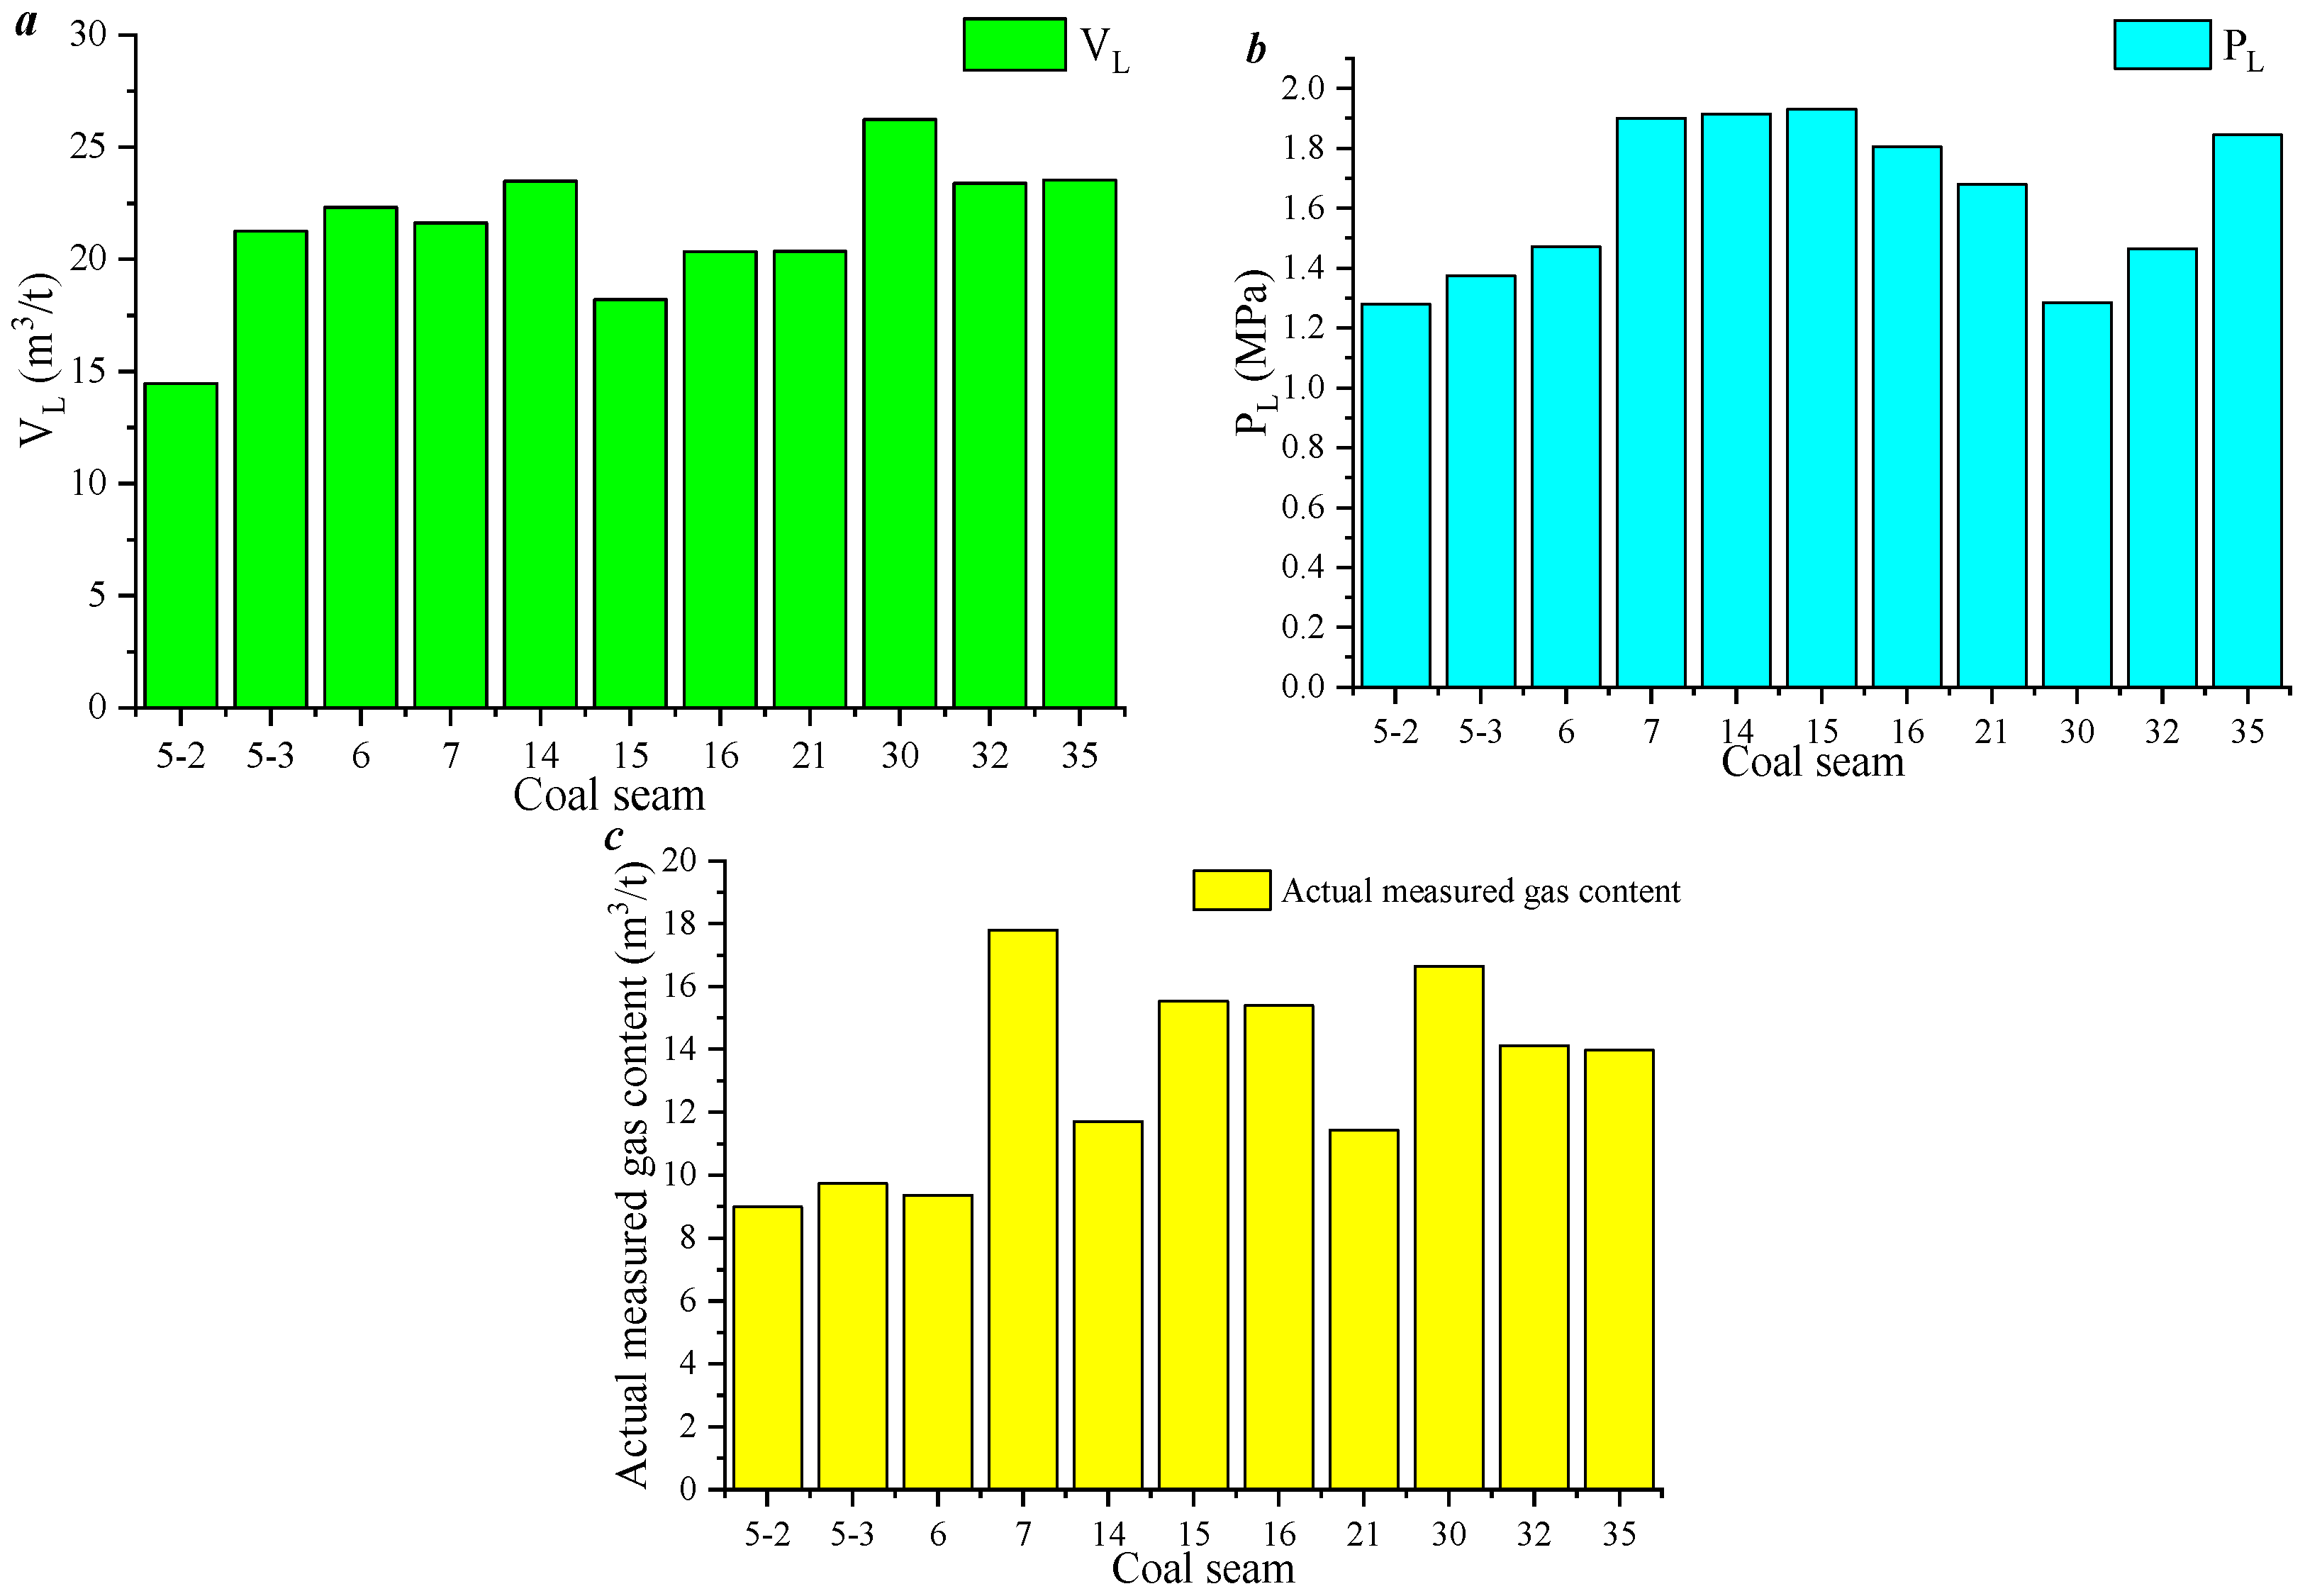
Concurrently, equilibrium moisture isothermal adsorption tests were performed on coal samples from the Santangcan Well 2 at 35 °C. Theoretical gas saturation for each coal seam was also studied. Different coal seams display distinct isothermal adsorption characteristics. Coal seams 5-3 and 6 exhibit the weakest adsorption capacity and the lowest theoretical gas saturation. Gas saturation of other seams exceeds 55%. Overall, these conditions are considered highly favorable for surface CBM extraction. VL increases with burial depth (maximum in Coal Seam 30), while PL exhibits a low–high–low trend (lower at both ends, higher in the middle). Measured gas content is highest in the middle, followed by the lower part, and lowest in the upper part (Figure 14).

3.3. Potential Evaluation of Coalbed Methane Resources in Well Areas

Given the characteristics of multiple, thin coal seams within this well area and considering effective CBM development, a vertical coal seam grouping division is initially conducted. Subsequently, utilizing the coal group as the evaluation unit, CBM resource potential is assessed through comprehensive analysis of three key aspects: resource conditions, reservoir conditions, and preservation conditions. Following this, geological factors affecting CBM recoverability are evaluated predicated upon coal reservoir conditions and preservation conditions, while engineering factors affecting CBM recoverability are evaluated using the understanding of coal reservoir stimulation potential as the foundation. Finally, evaluation is performed on both CBM resource potential and CBM recoverability within the well area.
Within the Zhangjiawan Block, the total thickness of the coal-bearing strata ranges from 266.54 m to 340.90 m (average of 309.66 m). Typically, over 30 coal seams are present, with a cumulative coal seam thickness ranging from 20.68 m to 30.47 m (average of 23.10 m), and a coal content coefficient of 7.46%. Among them, there are a total of 10 coal seams that can be mined and locally mined, namely coal seams 5-2, 5-3, 6, 7, 14, 16, 21, 30, 32, and 35. The cumulative thickness of these workable seams ranges from 13.88 m to 26.39 m, (average of 15.63 m), resulting in a workable coefficient of 5.06%.
In Santangcan Well 2, the Longtan Formation is encountered at burial depths ranging from 181.81 m to 513.69 m, with a thickness of 331.88 m. A total of 49 coal seams were penetrated from top to bottom, exhibiting a cumulative thickness of 30.54 m and a coal content coefficient of 9.22%. Among these, there are 12 coal seams that can be mined, with a thickness of 18.81 m and a coal content coefficient of 5.66%. By comparing the actual coal seam data and lithology combination with neighboring well data, the main target coal seams are 10 layers, numbered coal seams 5-2, 5-3, 6, 7, 14, 16, 21, 30, 32, and 35.
Through integration of coal seam distribution patterns, combination characteristics, individual seam thicknesses, inter-seam spacing, and stratigraphic correlation, coal seams 5-2, 6, and 7 of the Longtan Formation are assigned to the upper coal measure; coal seams 14, 16, and 21 to the middle coal measure; and coal seams 30, 32, and 35 to the lower coal measure. This well encountered three minable coal seams (5-2, 6, 7) within the upper coal measure with a cumulative true thickness of 6.50 m. The middle coal measure yielded three minable seams (14, 16, 21) aggregating 4.39 m, while the lower coal measure contained three minable seams (30, 32, 35) totaling 4.61 m in thickness.
Integrated study of Table 5 indicates that coal seams 7 and 16 exhibit intermediate thickness and are dominated by blocky coal. Favorable gas contents and relatively high gas saturations are observed in these seams.
Resource potential is defined by five key parameters: coal seam thickness, gas content, areal extent, gas resource abundance, and gas-in-place volume. In Santangcan Well 2, resource evaluation is primarily conducted using coal seam thickness, gas content, and gas resource abundance
Drilling data from Santangcan Well 2 indicate that coal seams 5-2, 6, 7, 16, and 32 are classified as medium-thick seams, whereas coal seams 14, 21, 30, and 35 are identified as thin seams. Coal seams 9 are measured during this campaign. Measured gas contents for all seams are favorable, exceeding 8 m3/t (Table 6). Maximum gas resource abundance is recorded in coal seam 6, reaching 0.56 × 10⁸ m3/km2, while minimum abundance is observed in seam 5-2, at 0.15 × 10⁸ m3/km2.
Comprehensive study indicates superior resource potential in coal seams 6 and 16, moderate potential in coal seams 14 and 32, and suboptimal potential in coal seams 5-2, 7, 21, 30, and 35. At the group scale, the upper and middle coal seam groups exhibit higher resource potential, while the lower coal seam group demonstrates comparatively poorer potential.
Reservoir conditions are defined by multiple parameters including coal structure, vitrinite content, Langmuir pressure, ash content, gas saturation, critical reservoir ratio, reservoir permeability, porosity, pressure coefficient, coal rank, and in situ stress. In the case of Santangcan Well 2, reservoir evaluation is primarily evaluated from the aspects of coal structure, Rankine pressure, ash content, gas saturation, reservoir permeability, porosity, pressure coefficient, and coal rank.
From the comprehensive study of logging, analysis testing, and well testing data (Table 7), it can be seen that coal seams 14, 16, and 21 have good conditions, coal seam 7 has better conditions, and coal seams 6, 30, 32, and 35 have poorer conditions. The middle coal measure of the well has the best reservoir conditions, followed by the upper coal measure and the lower coal measure.
Rock mechanical properties govern the geometry and dimensions of hydraulic fractures, with elastic modulus dictating fracture width. Tensile strength represents the ultimate stress at which rock fails under tension, typically ranging from 3% to 30% of compressive strength. The elastic modulus, defined as the ratio of stress to strain within the elastic deformation regime, fundamentally reflects material stiffness. Fracture width exhibits an inverse relationship with both formation minimum horizontal principal stress and Young’s modulus, while Poisson’s ratio exerts negligible influence on hydraulic fracture width.
Compared to surrounding formations, the principal coal seams in Santangcan Well 2 exhibit characteristically lower elastic moduli, indicating reduced mechanical strength, enhanced ductility, and favorable stimulation potential. These seams demonstrate an average Poisson’s ratio of 0.36 (range from 0.31 to 0.40), with homogeneous distribution across intervals. Poisson’s ratio values are comparable to those of roof and floor strata, reflecting isotropic deformation capability in both lateral and vertical orientations. Critically, reservoir pressure within the coal seam section is lower than the stress magnitude of the overlying barrier, establishing an effective stress barrier. The possibility of breaking through the roof and floor during construction is relatively small, and the width of the coal seam fracturing joint is large, which is conducive to coal seam fracturing transformation (Table 8).
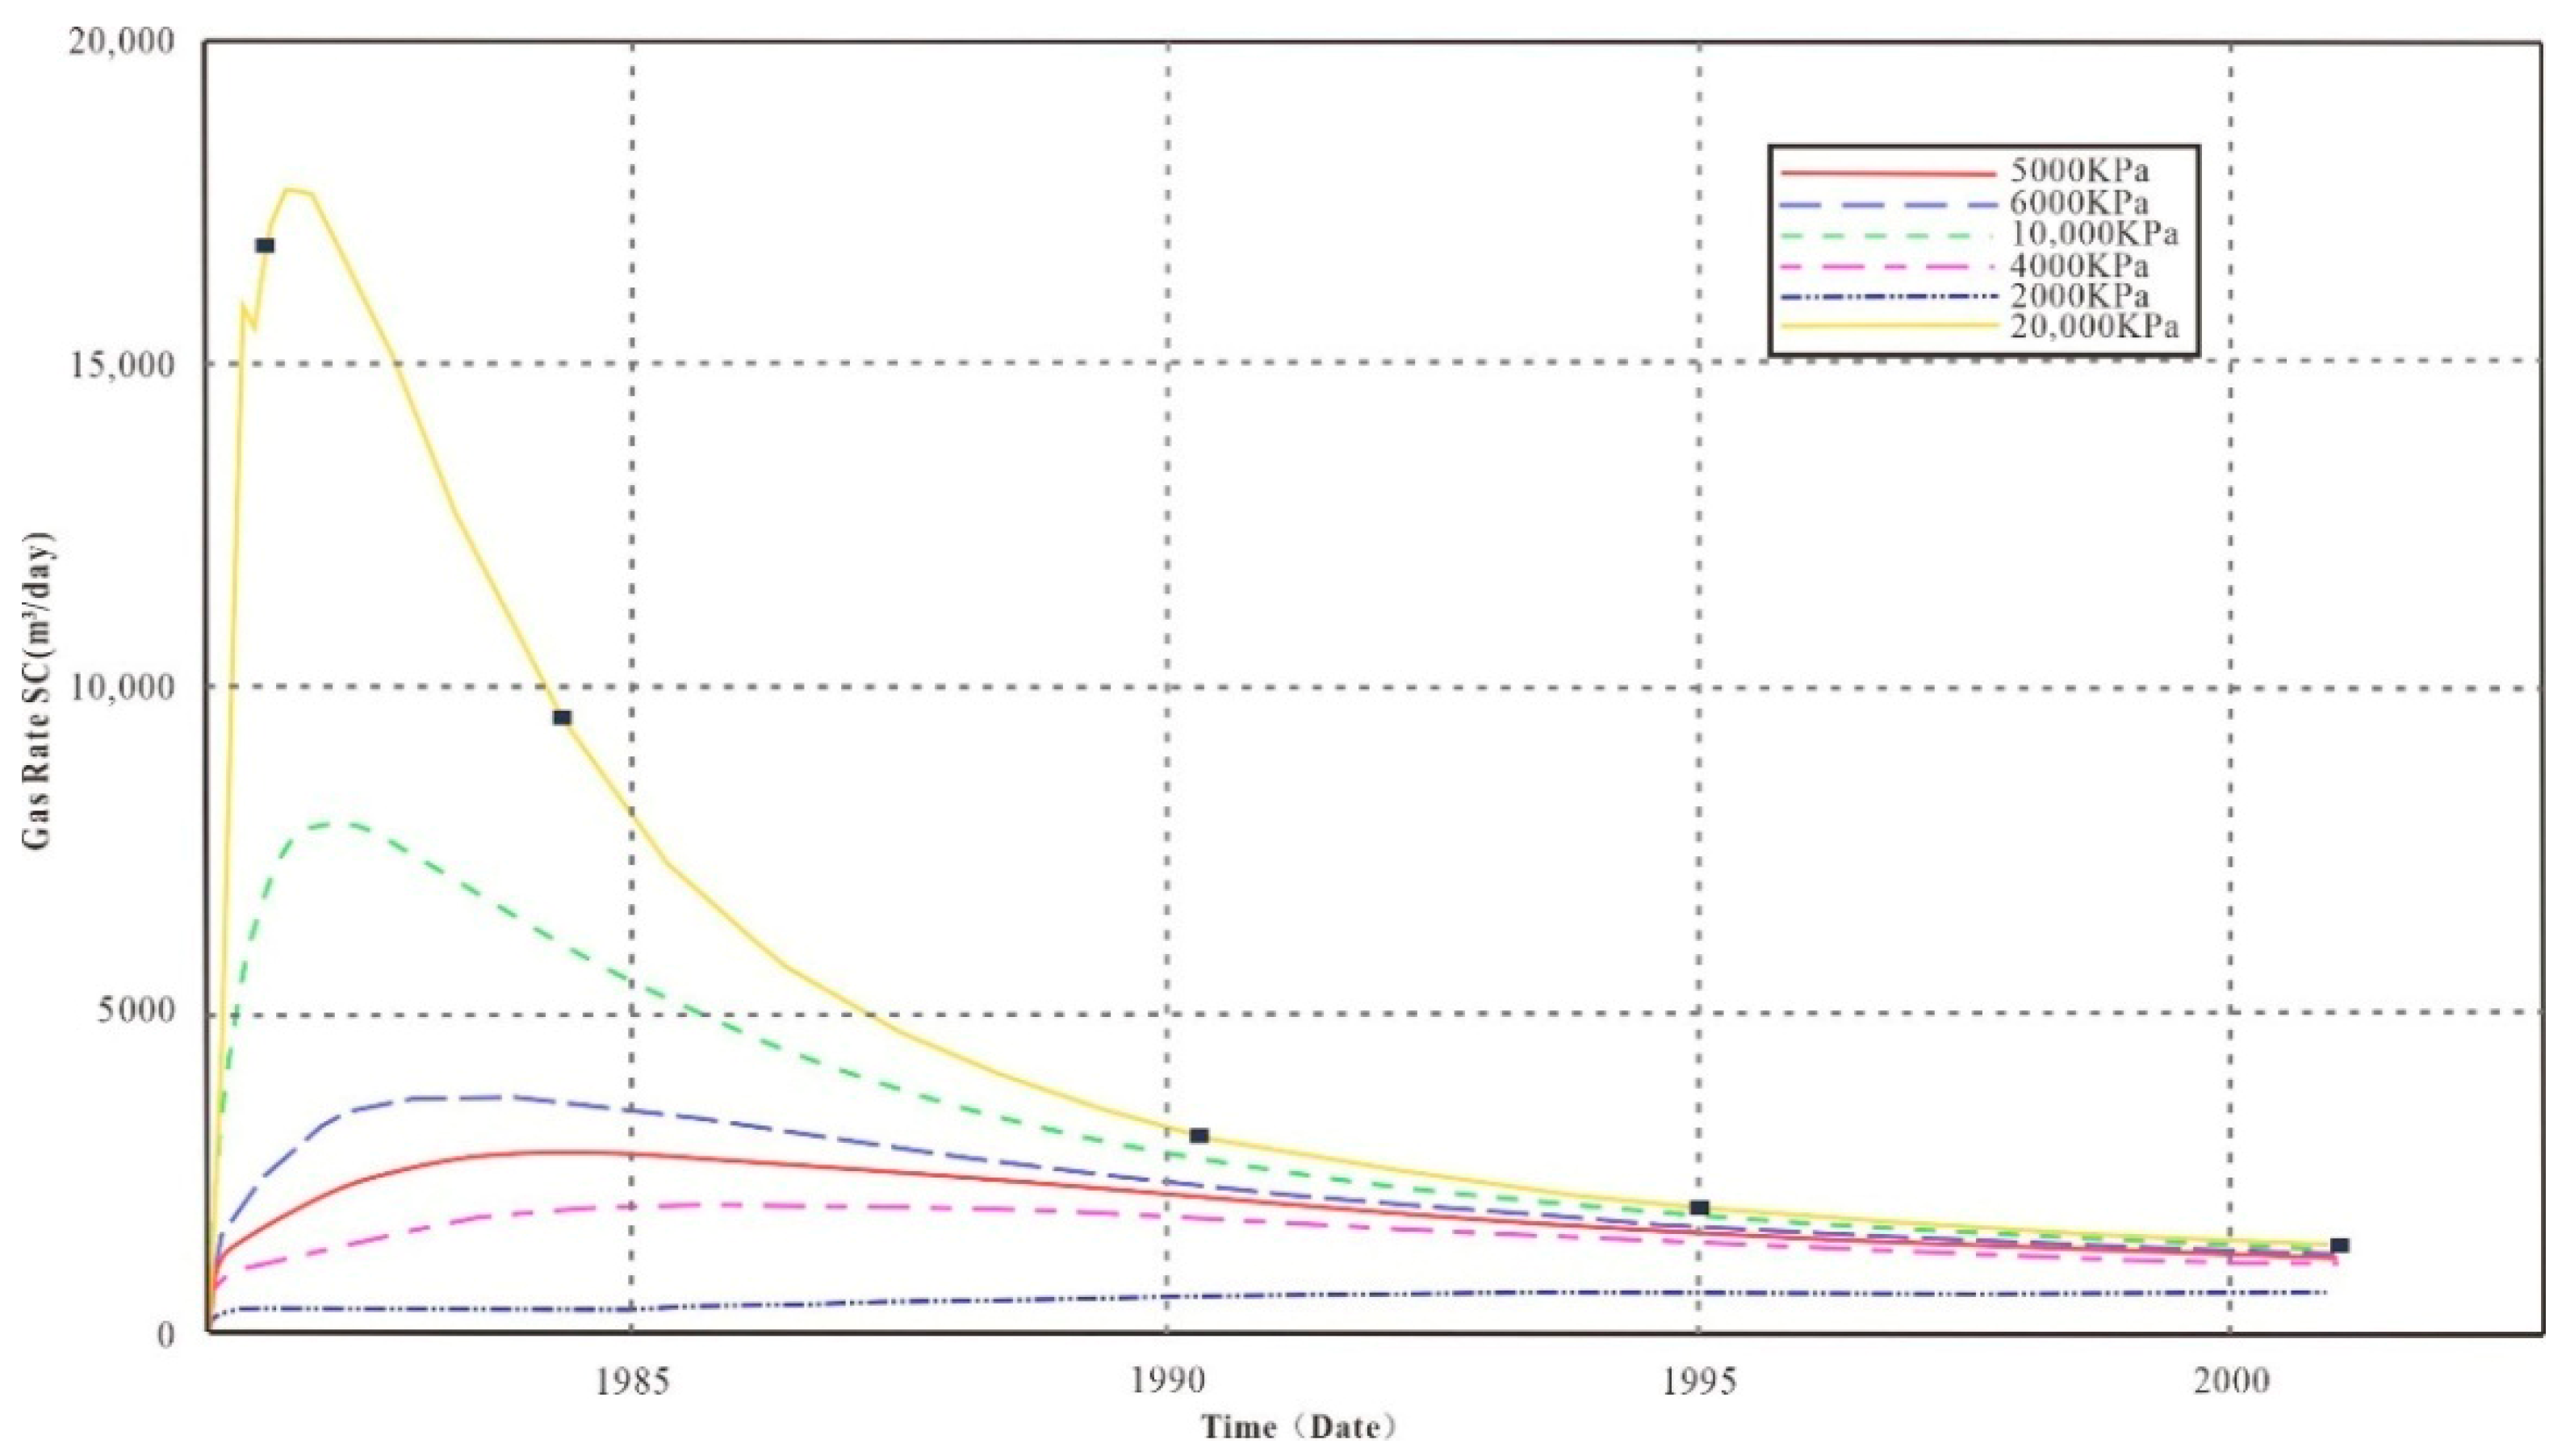
For gas-saturated coal seams, gas desorption initiates immediately upon reduction of original reservoir pressure, enabling immediate gas production. Conversely, undersaturated coal seams achieve gas production only when reservoir pressure declines below critical desorption pressure. Consequently, under identical production conditions, undersaturated seams require extended dewatering and depressurization periods to initiate gas flow, resulting in delayed gas production peaks. Furthermore, lower gas content and resource abundance in these seams lead to reduced per-well gas yields. Sensitivity analysis on gas saturation impacts (Figure 15) demonstrates that, with constant production parameters, a 10.3% undersaturation level delays the gas production peak by 254 days and significantly reduces peak production rates compared to saturated seams. This evidence confirms that higher gas saturation correlates directly with enhanced CBM recoverability.
Study of gas saturation data acquired through well testing in Santangcan Well 2 reveals that coal seam 7 and coal seam 32 exhibit the highest gas saturation, followed by coal seam 14 and coal seam 21, while coal seam 6 demonstrates comparatively lower values.
Reservoir pressure governs CBM recoverability through dual mechanisms: primarily by controlling coal seam permeability as the fundamental production constraint, and secondarily by providing the driving force for fluid production from fracture networks. Sensitivity analysis demonstrates that increasing reservoir pressure from 932 psi to 1960 psi yields substantial improvements in recovery metrics, with 25-year gas recovery efficiency rising from 40.5% to 46.9%, water recovery efficiency increasing from 25.4% to 43.1%, and cumulative production of both phases showing proportional enhancement. This positive correlation establishes that over-pressured and normally-pressured coal seams possess superior production potential compared to under-pressured counterparts, attributed to optimized desorption kinetics and enhanced flow capacity (Figure 9b). Well testing data from Santangcan Well 2 reveals normal pressure conditions across most major coal seams, with the notable exception of seam 6, which exhibits an elevated pressure gradient due to its pulverized coal fabric.
Among the three primary reservoir parameters—permeability, gas saturation, and reservoir pressure—coal seam permeability emerges as the fundamental controlling factor with the most significant impact on CBM recoverability. The influence of gas saturation and reservoir pressure on production performance cannot be effectively realized without adequate permeability, establishing it as the prerequisite condition for successful CBM development. While all three parameters exert distinct influences varying in both mechanism and magnitude, permeability fundamentally determines whether the reservoir can deliver commercial production rates. Based on comprehensive analysis of permeability, gas saturation, and reservoir pressure data obtained through well testing in Santangcan Well 2, Seams 7 and 32 have been identified as possessing the most favorable recoverability characteristics, combining optimal permeability conditions with suitable gas saturation and pressure regimes to maximize production potential.

4. Conclusions

Building upon previous research on CBM reservoir-forming characteristics in the Zhina Coalfield, this study provides a comprehensive synthesis of the CBM sedimentary environment, structural conditions, hydrogeology, stress state, caprock properties, reservoir characteristics, and exploration/development potential within the Santang Syncline. Understanding obtained is as follows.
(1)
Ro,max of the coal seams ranges from 3.20 to 3.60%. Metamorphic grade generally increases with burial depth. Coal lithotypes are predominantly semi-bright coal, with subordinate semi-bright to semi-dull coal, and minor semi-dull coal. Roofs of coal seam are composed of gray-black mudstone and calcareous mudstone, with some areas developing limestone, and the floors are composed of bauxitic mudstone.
(2)
Pore structure of coal seams 6 and 14 are more complex, while those of coal seams 7 and 16 tend to be simpler. Coal seams 5-3 and 6 exhibit the weakest adsorption capacity and the lowest theoretical gas saturation. Gas saturation of other seams exceeds 55%. VL increases with burial depth (maximum in coal seam 30), while PL exhibits a low–high–low trend (lower at both ends, higher in the middle). Measured gas content is highest in the middle, followed by the lower part, and lowest in the upper part. Favorable reservoir conditions in coal seams 14, 16, and 21; relatively favorable reservoir conditions in coal seam 7; and unfavorable reservoir conditions in coal seams 6, 30, 32, and 35. Among coal groups penetrated by this well, the middle coal group exhibits the most favorable reservoir conditions, followed by the upper and lower coal groups.
(3)
Coal seams 7 and 16 exhibit moderate thickness and are dominated by blocky coal, demonstrating favorable gas content and high gas saturation. Gas content measurements from nine coal seams in this study indicate consistently favorable results, all exceeding 8 m3/t. Geological CBM resource abundance is highest in coal seam 6 (0.56 × 10⁸ m3/km2) and lowest in coal seam 5-2 (0.15 × 10⁸ m3/km2).

Author Contributions

Conceptualization, S.W. and S.L.; methodology, X.D.; software, L.L.; validation, J.H.; formal analysis, Z.L.; investigation, Y.H.; resources, J.Z. and J.L.; data curation, J.Z.; writing—original draft preparation, S.W. and J.L.; writing—review and editing, S.W.; visualization, S.W.; supervision, S.W.; project administration, S.W.; funding acquisition, S.W. All authors have read and agreed to the published version of the manuscript.

Funding

This research received no external funding.

Data Availability Statement

The original contributions presented in this study are included in the article. Further inquiries can be directed to the corresponding authors.

Conflicts of Interest

The authors declare no conflicts of interest.

References

  1. Xu, F.Y.; Hou, W.; Xiong, X.Y.; Xu, B.R.; Wu, P.; Wang, H.Y.; Feng, K.; Yun, J.; Li, S.G.; Zhang, L.; et al. The status and development strategy of coalbed methane industry in China. Pet. Explor. Dev. 2023, 50, 765–783. [Google Scholar] [CrossRef]
  2. Tao, S.; Chen, S.D.; Pan, Z.J. Current status, challenges, and policy suggestions for coalbed methane industry development in China: A review. Energy Sci. Eng. 2019, 7, 1059–1074. [Google Scholar] [CrossRef]
  3. Song, Y.; Zhao, M.J.; Hong, F.; Liu, S.B.; Qin, S.F.; Wang, H.Y. Pool-forming stages and enrichment models of medium- to high-rank coalbed methane. Acta Geol. Sin.-Engl. Ed. 2010, 84, 1539–1546. [Google Scholar] [CrossRef]
  4. Mastalerz, M.; Hampton, L.; Drobniak, A.; Loope, H. Significance of analytical particle size in low-pressure N2 and CO2 adsorption of coal and shale. Int. J. Coal Geol. 2017, 178, 122–131. [Google Scholar] [CrossRef]
  5. Chen, Z.L.; Tang, D.Z.; Xu, H.; Tao, S.; Zhang, B.; Cai, J.L.; Meng, C.Z. The pore system properties of coalbed methane reservoirs and recovery in western Guizhou and eastern Yunnan. J. China Coal Soc. 2010, 35 (Suppl. S1), 158–163. [Google Scholar] [CrossRef]
  6. Tian, Z.B.; Ma, Y.L.; Li, X.; Ji, Y.J.; Li, D.S. A method for detecting coalbed methane gas storage structure in coal goaf—A case in Qinshui coal field in Shanxi province. Chin. J. Geophys. -Chin. Ed. 2022, 65, 4495–4503. [Google Scholar] [CrossRef]
  7. Guo, C.; Xia, Y.C.; Ma, D.M.; Sun, X.Y.; Dai, G.L.; Shen, J.; Chen, Y.; Lu, L.L. Geological conditions of coalbed methane accumulation in the Hancheng area, southeastern Ordos Basin, China: Implications for coalbed methane high-yield potential. Energy Explor. Exploit. 2019, 37, 922–944. [Google Scholar] [CrossRef]
  8. Mosher, K.; He, J.; Liu, Y.; Rupp, E.; Wilcox, J. Molecular simulation of methane adsorption in micro- and mesoporous carbons with applications to coal and gas shale systems. Int. J. Coal Geol. 2013, 109, 36–44. [Google Scholar] [CrossRef]
  9. Küster, F.; Nikrityuk, P.; Junghanns, M.; Nolte, S.; Tünnermann, A.; Ackermann, R.; Richter, A.; Guhl, S.; Meyer, B. In-situ investigation of single particle gasification in a defined gas flow applying TGA with optical measurements. Fuel 2017, 194, 544–556. [Google Scholar] [CrossRef]
  10. Li, C.G.; Jiang, B.; Ju, W.; Cheng, G.X.; Song, Y. Characteristics of tectonic deformation in the Daning-Jixian region, eastern Ordos Basin: Implications for the exploration and development of coalbed methane. Energy Explor. Exploit. 2019, 37, 907–921. [Google Scholar] [CrossRef]
  11. Wu, C.F.; Liu, X.L.; Zhang, S.S. Construction of index system of “Hierarchical progressive” geological selection of coalbed methane in multiple seam area of eastern Yunnan and western Guizhou. J. China Coal Soc. 2018, 43, 1647–1653. [Google Scholar]
  12. Mahamud, M.; Menéndez, J.; Sarquís, P. CO2 activation of chars: Effect of burn-off on texture and fractal properties. Fuel Process. Technol. 2014, 119, 41–51. [Google Scholar] [CrossRef]
  13. Cao, X.H.; Xiao, Z.H.; Cao, Y.J.; Sun, B.; Jiang, W.; Cao, Y.Z.; Chen, J.M. Coal reservoir geological features comparative analysis between eastern Yunnan, western Guizhou area and Qinshui Basin. China Coal Geol. 2020, 32, 55–60. [Google Scholar]
  14. Guo, C.; Qin, Y.; Yi, T.S.; Ma, D.M.; Wang, S.Q.; Shi, Q.M.; Bao, Y.; Chen, Y.; Qiao, J.W.; Lu, L.L. Review of the progress of geological research on coalbed methane co-production. Coalf. Geol. Explor. 2022, 50, 42–57. [Google Scholar]
  15. Li, S.; Tang, D.Z.; Pan, Z.J.; Xu, H.; Guo, L.L. Evaluation of coalbed methane potential of different reservoirs in western Guizhou and eastern Yunnan, China. J. Fuel 2015, 139, 257–267. [Google Scholar] [CrossRef]
  16. Zhang, J.; Xu, A.; Zhao, C.; Wang, W.; Jiang, Y.; Vandeginste, V.; Xue, Z.; Guo, Y.; Miao, H. A new parameter for characterizing pore-fracture structure heterogeneity: Fractal dimension based on the mercury extrusion curve. Front. Earth Sci. 2024, 18, 782–796. [Google Scholar] [CrossRef]
  17. He, L.W.; Yan, Z.H.; Chen, J.; Hu, H.Y.; Li, M.L. Research on fine drainage control technology of coalbed methane wells in Liu panshui area. Petrochem. Technol. 2025, 32, 295–297. [Google Scholar] [CrossRef]
  18. Zhang, J.; Wei, C.; Zhao, C.; Zhang, T.; Lu, G.; Zou, M. Effects of nano-pore and macromolecule structure of coal samples on energy parameters variation during methane adsorption under different temperature and pressure. Fuel 2021, 289, 119804. [Google Scholar] [CrossRef]
  19. Liu, Y.H.; Liu, S.Q.; Wang, W.K.; Tian, Y.C.; Du, R.B.; Chen, S.H.; Sang, S.X. Application of PCA-FCE model in CBM development evaluation: A case study for Liupanshui coalmine area in Guizhou Province. China Coal Geol. 2025, 37, 69–74. [Google Scholar]
  20. Li, J.X.; Qu, X.Y.; Pei, Y.J.; He, C.H. Development effect and productivity evaluation of multi-thin coal seam horizontal well in Zhijin block, Guizhou Province. Coal Sci. Technol. 2025, 1–13. Available online: https://link.Cnki.net/urlid/11.2402.td.20250117.1511.002 (accessed on 24 September 2025).
  21. Zhang, J.; Wei, C.; Ju, W.; Yan, G.; Lu, G.; Hou, X.; Kai, Z. Stress sensitivity characterization and heterogeneous variation of the pore-fracture system in middle-high rank coals reservoir based on NMR experiments. Fuel 2019, 238, 331–344. [Google Scholar] [CrossRef]
  22. Zhang, J.; Wei, C.; Ju, W.; Qin, Z.; Ji, Y.; Quan, F.; Hu, Y. Microscopic distribution and dynamic variation of water under stress in middle and high rank coal samples. J. Nat. Gas Sci. Eng. 2020, 79, 103369. [Google Scholar] [CrossRef]
  23. Sun, Z.; Wei, Y.L.; Zhao, L.Y.; Long, C.Y.; Liu, J.T.; Zhou, X.Z. Development opportunities and risk countermeasures of coalbed methane industry in Guizhou Province. China Coalbed Methane 2022, 19, 40–43. [Google Scholar]
  24. Zeng, J.Y.; Gao, W.; Yan, Z.H.; Nie, J. CBM industrial development status in Bijie area and strategical thinking on the 14th Five-Year Plan. Nat. Gas Technol. Econ. 2022, 16, 23–29. [Google Scholar]
  25. Chen, X.X.; Deng, Y. Geological characteristics and exploration and development countermeasures of coalbed methane in Guizhou. Chem. Des. Commun. 2021, 47, 12–13. [Google Scholar]
  26. Chen, C.R.; Zhou, X.Z.; Zhao, F.P.; Meng, H.T.; Zhu, S.L.; Zhao, Y.Z.; Wei, Y.L. Geological and engineering collaborative control technology for high production of CBM wells in thin-medium-thick coal seam clusters: A case study of Wenjiaba block in the Zhina Coalfield, Guizhou. Nat. Gas Ind. 2023, 43, 55–64. [Google Scholar]
  27. Tao, J.J.; Wang, L.X.; Huang, J.Y. Geology and development potential of CBM in three major coalfields, Guizhou Province. Nat. Gas Technol. Econ. 2019, 13, 29–34. [Google Scholar]
  28. Li, Y.; Hao, H.Y.; Chang, L.M.; Huang, M.Y.; Cai, L.; Ban, J.P. Analysis of challenges in CBM well cementing of Zhina Coalfield in Guizhou Province. China Coalbed Methane 2018, 15, 3–7. [Google Scholar]
  29. Jiang, W. Study on the CBM Single Well’s Fracturing/Drainage Model of Multi-Coalbeds Area in Zhina Coal Field. Ph.D. Thesis, China University of Mining and Technology, Xuzhou, China, 2015. [Google Scholar]
  30. Chen, R.; Zhang, Z.Y. Sedimentary environment and palaeogeographical pattern of the Early Carboniferous Late Yangguan—Early Datang stage in eastern Yunnan—Western Guizhou area—Enlightenment for shale gas exploration. Geol. Bull. China 2023, 42, 307–316. [Google Scholar]
  31. Miao, H.Y.; Veerle, V.; Zhang, J.J.; Chen, S.B.; Chang, X.C.; Du, Y.; Wang, Y.; Wei, C.T.; Luo, J.H.; Quan, F.K.; et al. Control mechanism of pressure drop rate on coalbed methane productivity by using production data and physical simulation technology. Fuel, accepted.
  32. Tang, S.L.; Tang, D.Z.; Xu, H.; Tao, S.; Li, S.; Geng, Y.G. Geng Geological mechanisms of the accumulation of coalbed methane induced by hydrothermal fluids in the western Guizhou and eastern Yunnan regions. J. Natural Gas Sci. Eng. 2016, 33, 644–656. [Google Scholar] [CrossRef]
  33. Guo, L.L.; Tang, D.Z.; Xu, H.; Li, S.; Gao, L.J. Analysis on physical property features of different coal rank coal reservoirs in western Guizhou and eastern Yunnan area. Coal Sci. Technol. 2014, 42, 99–103. [Google Scholar]
  34. Yao, P.; Zhang, J.; Lv, D.; Vandeginste, V.; Chang, X.; Zhang, X.; Wang, D.; Han, S.; Liu, Y. Effect of water occurrence in coal reservoirs on the production capacity of coalbed methane by using NMR simulation technology and production capacity simulation. Geoenergy Sci. Eng. 2024, 243, 213353. [Google Scholar] [CrossRef]
  35. GB/T 18023-2000; Classification of Macrolithotype for Bituminouscoal. State Administration for Market Regulation: Beijing, China, 2000.
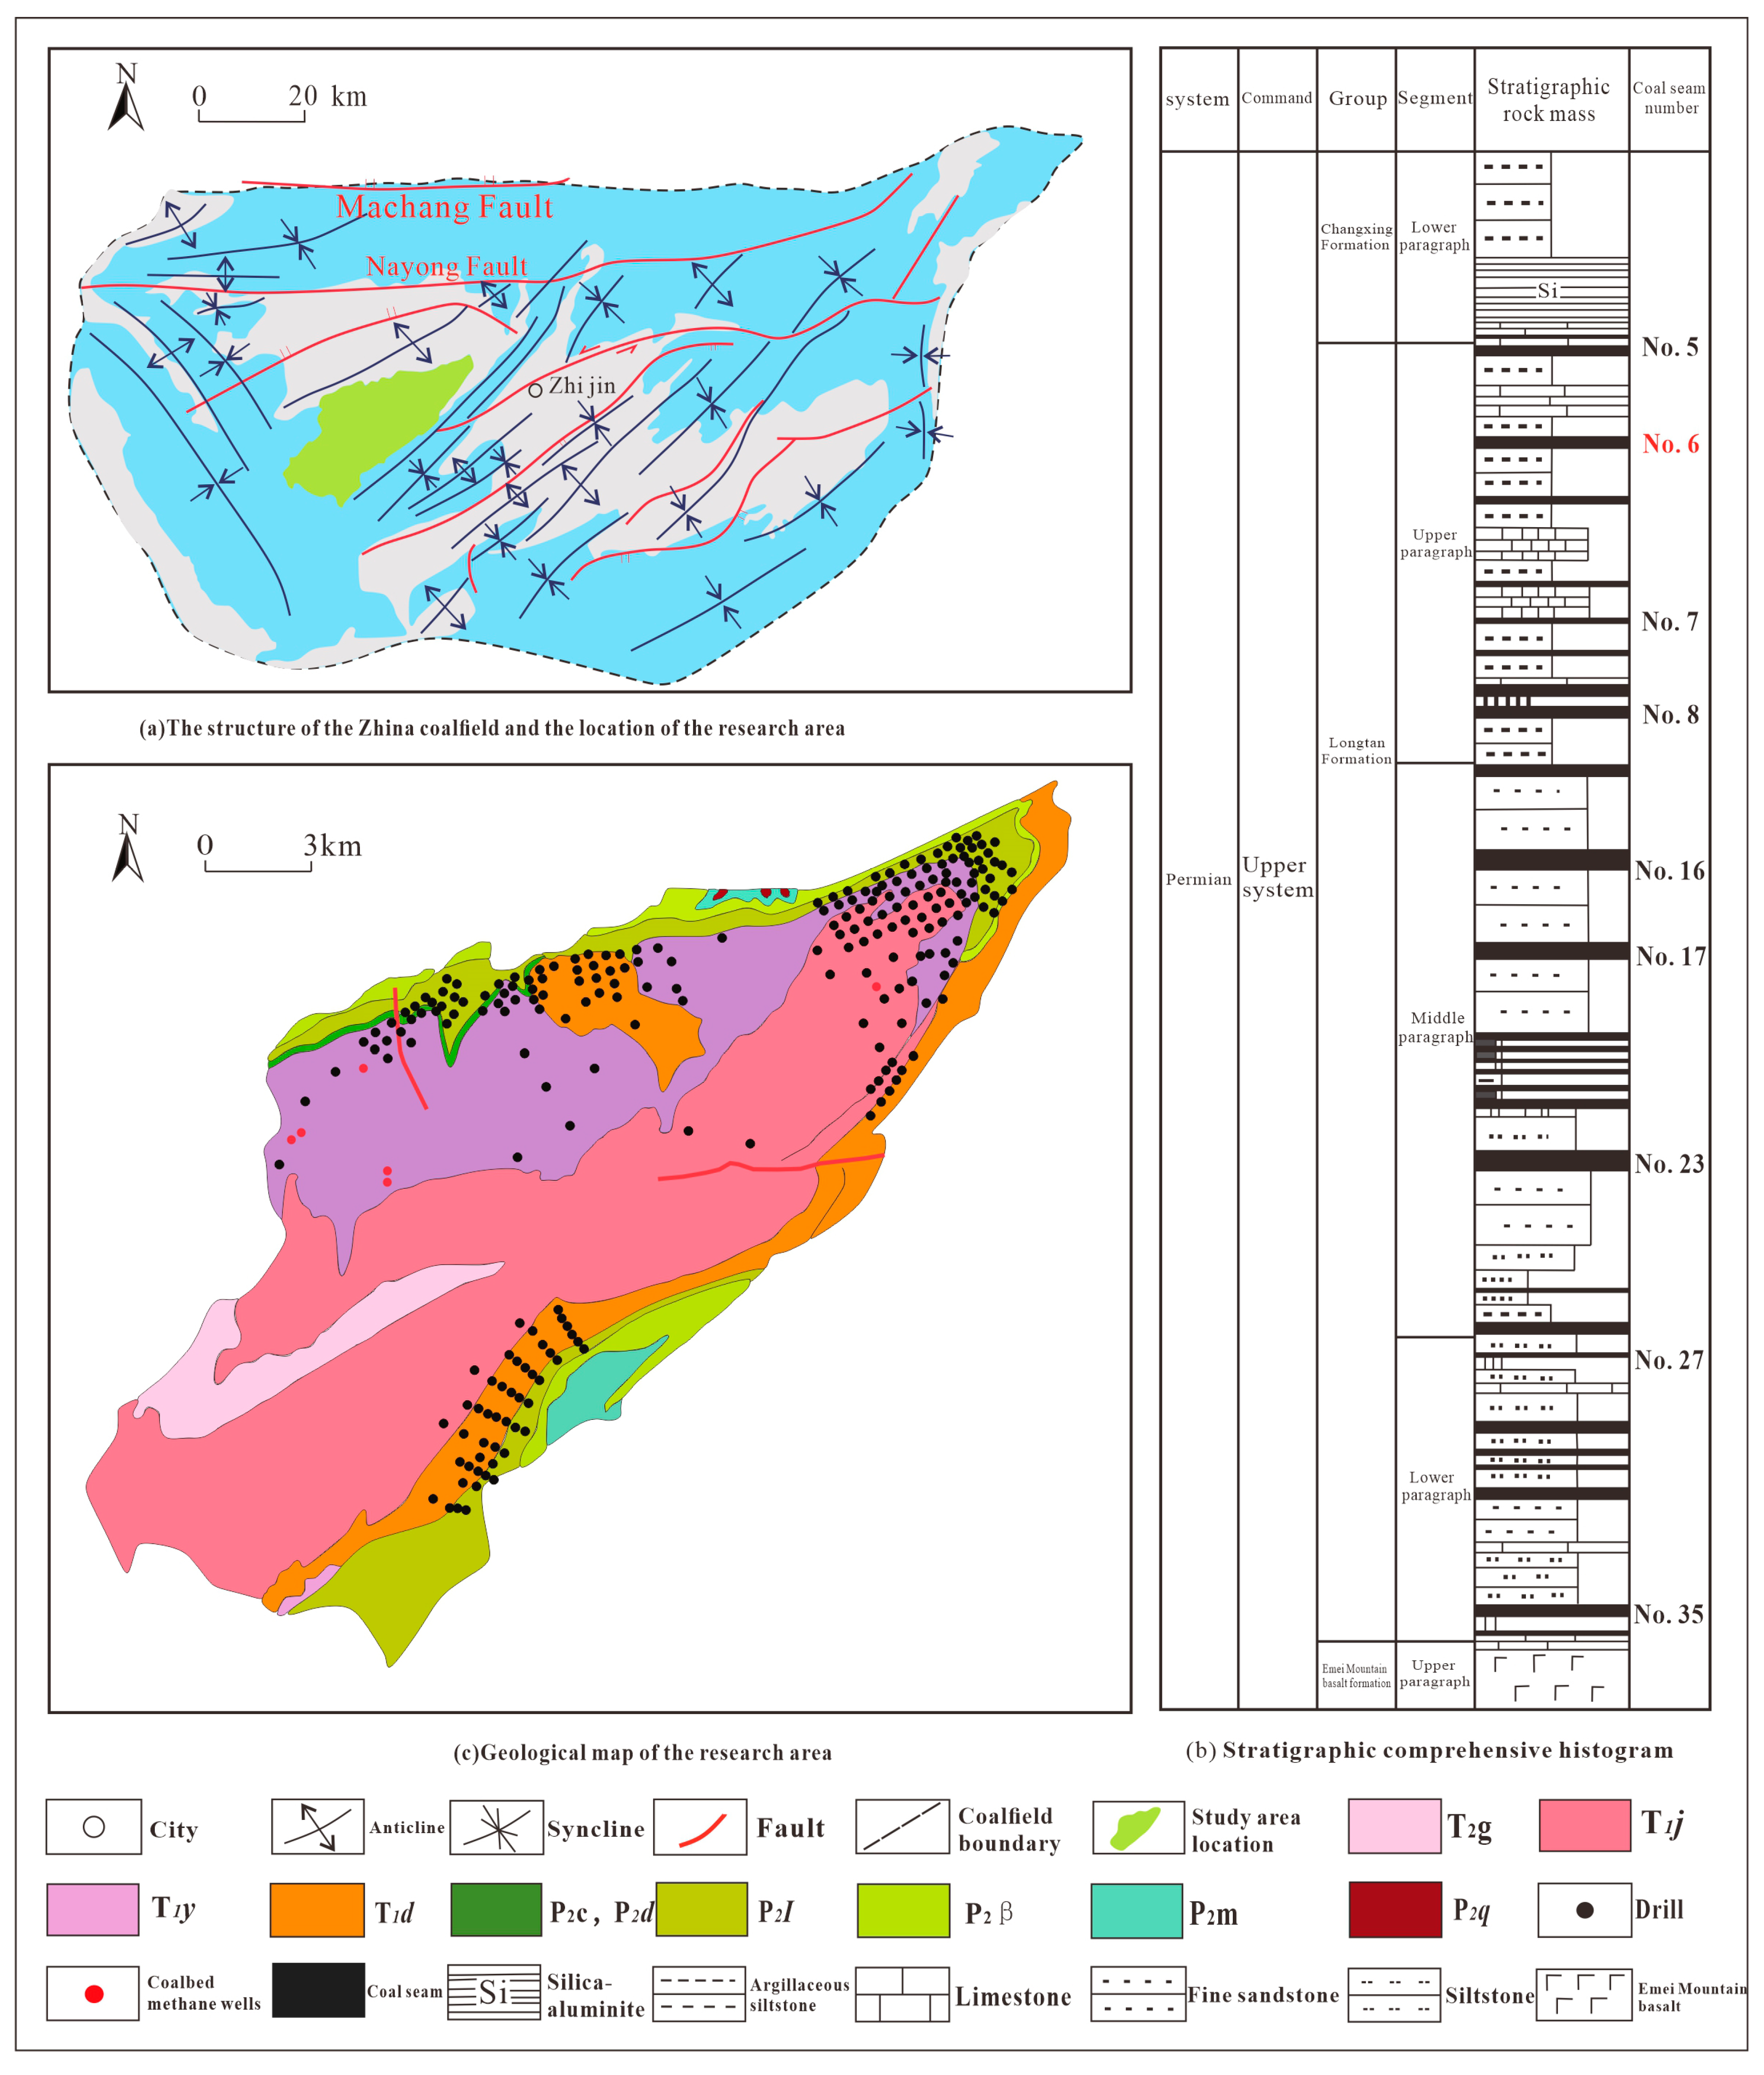
Figure 1. Comprehensive column and geological column chart of Santang Syncline position and strata in Zhina coalfield.
Processes 13 03106 g001
Figure 2. Diagram of permeability experimental testing device. Low temperature liquid nitrogen adsorption experiment (LT N2 GA). ASAP 2020 specific surface area and pore diameter distribution analyzer (pore diameter testing range 1.7–400 nm) produced by American company Mike was used to test pore parameters of coal samples using liquid nitrogen method. Process: Grind coal sample, select a coal sample with a particle size of 0.5 mm, weigh 10 g with a balance, dry for 6 h at 80 °C, and test adsorption amount of the coal sample under low temperature conditions of 77 K by injecting nitrogen under pressure. Relationship between adsorption amount of the coal sample and increase of relative pressure is obtained, which is adsorption isotherm of coal sample. BET theoretical model is used to calculate the specific surface area of pores, and BJH theoretical model is used to calculate pore volume. (A is a ball valve utilized to control the gas flow direction, serving as a device for opening or cutting off the gas source pathway; B is a ball valve employed to regulate the direction of gas flow, functioning to initiate or interrupt the gas supply passage; C is a pressure gauge designed to monitor the gas pressure upstream; D is a pressure gauge used for measuring the gas pressure downstream).
Processes 13 03106 g002
Figure 3. Contour map of burial depth of coal seam No. 6 in study area. (The black numbers represent the height of the geological contour lines, and the red numbers represent the fault numbers).
Processes 13 03106 g003
Figure 4. Comparison of true density and apparent density of different coal seams.
Processes 13 03106 g004
Figure 5. Differences in microscopic components of different coal seams.
Processes 13 03106 g005
Figure 6. Distribution of industrial components in different coal seams.
Processes 13 03106 g006
Figure 7. Scanning electron microscopy photos of different coal seams. (6a): a relatively rough surface with well-developed micropores, macropores, and joints, where micropores are interconnected by minute fractures; (6b): well-developed macropores and larger penetrating fractures with no infill observed within the fractures; (7a): well-developed macropores and larger penetrating fractures with no infill in the fractures; (7b): pores at different hierarchical levels, relatively good joint connectivity, well-developed and well-connected microfractures, although some fractures contain detrital infill; (14): Relatively well-developed macropores and joints with wider fractures; (16): A relatively rough surface and a denser structure with no discernible fractures in the tested sample; (21): Certain penetrating fractures with some detrital infill on the fracture surfaces; (32): Relatively well-developed macropores and joints with wider fractures; (35): Relatively well-developed macropores and joints with wider fractures.).
Processes 13 03106 g007
Figure 8. Changes in porosity and permeability of coal seams at different burial depths.
Processes 13 03106 g008
Figure 9. Adsorption and desorption curves based on liquid nitrogen adsorption test. (a), adsorption analysis curve of coal 6; (b), adsorption analysis curve of coal 7; (c), adsorption analysis curve of coal 14; (d), adsorption analysis curve of coal 16.
Processes 13 03106 g009
Figure 10. Distribution curves of pore volume from 2 to 100 nm in different coal seams. (a), pore size distribution curve of coal 6; (b), pore size distribution curve of coal 7; (c), pore size distribution curve of coal 14; (d), pore size distribution curve of coal 16.
Processes 13 03106 g010
Figure 11. Pore parameter of coal sample measured by nitrogen adsorption method.
Processes 13 03106 g011
Figure 12. Correlation between porosity and various industrial component parameters. (a), correlation between porosity and TOC; (b), correlation between porosity and Ash; (c), correlation between porosity and Moisture; (d), correlation between porosity and Volatile Matter; (e), correlation between porosity and Gas content.
Processes 13 03106 g012
Figure 13. Correlation between permeability and various industrial component parameters. (a), correlation between permeability and TOC; (b), correlation between permeability and Ash; (c), correlation between permeability and Moisture; (d), correlation between permeability and Volatile Matter; (e), correlation between permeability and Gas content.).
Processes 13 03106 g013
Figure 14. Bar charts of VL, PL, and gas content. (a), Column chart of VL in different coal seams; (b), PL bar chart; (c), bar chart of measured gas content.
Processes 13 03106 g014
Figure 15. Trend of coalbed methane production with pressure variation.
Processes 13 03106 g015
Table 1. Macroscopic characteristics of main coal seams in Santang Shen X Well.
CoalOptical CharacteristicsMechanical CharacteristicsMacrolithotypeCoal Structure
5-2black, glassy lustereven fractureSemi-brightMassive with powdery intercalations
5-3black, Like metallic luster Stepped fractureSemi-brightMassive coal
6black, glassyUneven and stepped fracture surfacesSemi-brightPowdery to massive
7black, Like metallic lusterStepped fractureSemi-brightMassive coal
14black, glassyStepped fractureSemi-dull to semi-brightMassive coal
16black, Like metallic lusterUneven and stepped fracture surfacesSemi-dullMassive coal
21black, glassyStepped fractureSemi-brightMassive coal
30Black, Like metallic lusterStepped fractureSemi-dullMassive coal
32black, Like metallic lusterStepped fractureSemi-dullMassive coal
35black, glassyStepped fractureSemi-dullMassive coal
Table 2. Test results of porosity and permeability of different coal seams.
Coal SeamPermeability/mDPorosity/%
5-30.00766.2066
60.00685.2495
70.011875.2410
140.00423.9372
160.0044.3368
300.02957.2417
320.00176.8171
350.0157.3798
Table 3. Pore parameters of coal samples determined by nitrogen adsorption.
CoalAverage Pore Diameter/nmBET Specific Surface Area/m2·g−1BJH Pore Volume/cm3·g−1
621.31161.07750.0056
76.06345.65780.0081
144.856829.36930.0315
163.413524.72560.0196
Table 4. Permeability results of target coal seams in Santangcan-2 well obtained by injection/falloff well testing.
Coal SeamThickness
(m)
Depth
(m)
Reservoir Pressure (MPa)Porosity
(%)
Permeability (mD)
6 0.60148.13 3.13067.670.029
71.45245.68 2.37776.240.027
140.88290.79 3.39292.390.215
210.58366.64 4.21451.470.150
320.48427.24 4.36334.090.190
Table 5. Comparison of upper, middle, and lower coal formations in Longtan Formation of Santangcan Well 2.
Coal GroupCoal SeamApparent
Thickness (m)
Vitrinite (%)Coal StructureTotal Gas Content (m3/t)Gas Saturation (%)Pressure Coefficient
Upper Coal Measure5-21.5775.25Massive Structure with Silt Particles8.9869.50
62.3578.90Massive9.3642.001.2959
72.5881.25Massive17.8082.500.9006
Middle Coal Measure140.8875.45Massive11.7050.001.0451
162.3078.25Massive15.4076.001.0429
211.2183.15Massive11.4356.00
Lower Coal Measure300.6182.80Massive11.6463.50
322.7275.75Massive14.1260.500.9354
351.2882.25Massive13.9759.00
Table 6. Comparison of coal seam and coal measure resource abundance in Santangcan Well 2.
Coal GroupCoal SeamApparent
Thickness (m)
Total Gas Content (m3/t)Bulk Density (g/cm3)CBM Resource Concentration (×108 m3/km2)Coal Measure Methane Resource Abundance (×108 m3/km2)
Upper Coal Measure5-21.578.981.600.150.95
62.359.361.470.56
72.5817.801.580.24
Middle Coal Measure140.8811.701.540.320.84
162.3015.401.530.33
211.2111.431.540.19
Lower Coal Measure300.6111.641.590.170.65
322.7214.121.600.27
351.2813.971.660.21
Table 7. Evaluation parameters of main coal seam reservoir conditions in Santangcan Well 2.
Coal GroupCoal SeamPL
(MPa)
Ash Content (%)Ro,max
(%)
Porosity
(%)
Permeability (mD)Gas Saturation (%)Evaluation
Upper Coal Measure5-21.2831.533.0454.29 69.50Poor
61.4712.623.3354.470.029442.00Poor
71.9020.633.3057.670.027182.50Favorable
Middle Coal Measure141.91531.033.326.240.21550.00Moderately Favorable
161.80529.023.374.380.1576.00Favorable
211.6847.303.2554.74 56.00Moderately Favorable
Lower Coal Measure301.28523.113.6151.47 63.50Poor
321.46532.633.855.790.1960.50Moderately Favorable
351.84543.443.7254.09 59.00Poor
Table 8. Data table of stress difference coefficient for main coal seams in Santangcan Well 2.
Coal SeamReservoir Pressure MPaClosure Pressure MPaFracture Pressure MPaUnconfined Compressive Strength (MPa)Elastic Modulus (GPa)Poisson’s Ratio
63.13067.337.416.702.0210.35
72.37778.518.922.9851.500.40
143.39297.888.1226.303.800.36
214.214510.9211.38
324.36338.1110.9121.512.880.31
Disclaimer/Publisher’s Note: The statements, opinions and data contained in all publications are solely those of the individual author(s) and contributor(s) and not of MDPI and/or the editor(s). MDPI and/or the editor(s) disclaim responsibility for any injury to people or property resulting from any ideas, methods, instructions or products referred to in the content.