Abstract
In the context of global carbon neutrality, municipal wastewater treatment plants (WWTPs), as key sources of greenhouse gas emissions, urgently require quantification of carbon emissions and implementation of mitigation strategies. This study establishes a life-cycle carbon footprint model encompassing the stages of pretreatment, biological treatment (AAO process), and sludge treatment, with integrated consideration of municipal sewer networks. Key findings reveal the following: The biological treatment stage contributes 68.14% of total carbon emissions. N2O (nitrous oxide), due to its high global warming potential (GWP), is the primary source of direct emissions (0.333 kg CO2eq/m3). In the pretreatment stage, 80.4% of carbon emissions originate from the electricity consumption of sewage lifting pump stations (0.030 kg CO2eq/m3). During the sludge treatment stage, carbon emissions are concentrated in residual sludge lifting (0.0086 kg CO2eq/m3) and sludge dewatering/pressing (0.0088 kg CO2eq/m3). Accordingly, this study proposes the following mitigation strategies: novel nitrogen removal processes should be implemented to optimize aeration control and enhance methane (CH4) recovery during the biological period, and variable frequency drive (VFD) pumps and IoT (Internet of Things) technologies should be employed to reduce energy consumption during the pretreatment period, and during the sludge treatment period, low-carbon dewatering technologies should be adopted. This work provides a theoretical foundation for process-specific carbon management in WWTPs and facilitates the synergistic advancement of environmental stewardship and dual-carbon objectives through technology–system integration.
1. Introduction
Since China proposed the “dual carbon” goal [1], high-carbon emission industries such as energy and transportation have accelerated their low-carbon transition. As a critical component of urban infrastructure, wastewater treatment systems have become a significant anthropogenic source of greenhouse gas emissions. Data indicates that approximately 9% of global methane (CH4) and 3% of nitrous oxide (N2O) emissions originate from wastewater treatment activities [2]. In China, CO2 emissions from wastewater treatment surged from 13.34 million tons in 2005 to 53 million tons in 2019 [3,4]. Although the IPCC Guidelines exclude microbially metabolized CO2 from accounting, studies reveal that around 28% of organic carbon in wastewater derives from fossil carbon sources. The CO2 emissions from this source account for 13% of total CO2 emissions, and can reach as high as 23% under specific conditions. Despite the exclusion of these CO2 emissions from the IPCC’s National Greenhouse Gas Inventory Guidelines, considerable debates persist in academia regarding their inclusion in total emissions to enable more accurate carbon assessment [5,6,7]. Currently, many carbon accounting methods in the literature are based on IPCC 2006 or IPCC 2019 guidelines, but some scholars have identified significant accounting errors associated with these approaches [8,9]. Consequently, there is growing interest in developing carbon accounting methodologies for wastewater treatment plants (WWTPs) that align with the needs of national strategic development. For instance, Xi et al. [10] conducted a comparative analysis of 50 WWTPs in Shanghai using the Operational Data Integration Method (ODIM) alongside IPCC 2006/2019 guidelines. Liao et al. [11] and Chen et al. [12] utilized LCA to assess the carbon footprint of WWTPs employing different treatment processes. Qiu et al. [13] utilized the emission factor method to account for carbon emissions in urban WWTPs across China’s five major city clusters, analyzing the spatio-temporal distribution and influencing factors of greenhouse gas emissions. Bao et al. [14] employed direct measurement methods to quantify on-site CO2 emissions from WWTPs. Shrestha et al. [15] used Python programming to estimate the GHGs emissions from the domestic wastewater sector in Nepal under various technological development scenarios for 2020 to 2040 using the refined 2019 estimation methodology developed by IPCC. Maziotis and Molinos-Senante [16] employed the Efficiency Analysis Tree (EAT) method to account for carbon emissions in 109 WWTPs in Spain. Corominas et al. [17] applied both static and dynamic prediction models to simulate carbon emission processes in WWTPs, finding that dynamic models could capture fluctuations influenced by parameters such as temperature and C/N ratio, whereas static models failed to reflect such variations. Despite these advances, existing accounting methods primarily focus on total carbon emissions at the plant level and generally lack unit-level carbon emission data. This limitation hinders the ability to provide specific or targeted recommendations for carbon reduction strategies within individual treatment units of WWTPs.
Based on the current reality that AAO wastewater treatment processes account for over 60% of China’s market share [18], this study focuses on an AAO wastewater treatment plant in Hunan Province. It incorporates direct carbon emissions from municipal sewer networks into the accounting framework, establishing a comprehensive carbon footprint and emission quantification model spanning the entire “sewer network-wastewater treatment-sludge disposal” chain. The wastewater treatment process is categorized into three distinct stages: (1) pretreatment stage, centered on sewage lifting pump stations and vortex grit chambers, while extending to incorporate municipal sewer networks; (2) biological treatment stage, identified as the primary carbon emission source during treatment, encompassing facilities such as aeration tanks, secondary sedimentation tanks, and disinfection units; and (3) sludge treatment stage, comprising sludge thickening and dewatering, filtering pressing, and off-site transportation. This study establishes a theoretical framework for both unit-level carbon emissions accounting and targeted carbon management within wastewater treatment plants (WWTPs). It offers guidance for implementing specific and targeted carbon reduction measures in WWTPs operations, thereby promoting synergistic progress between environmental benefits and the achievement of “dual-carbon” goals.
2. Material and Methods
2.1. Basic Information on Municipal WWTPs Investigated
The wastewater treatment plant selected for this study, which employs an AAO process, is located in Hunan Province, China. This facility operates with a daily treatment capacity of 2.0 × 10⁵ m3/d. It serves a total catchment area of 72.7 km2 and a population of 486,200 residents. The operational parameters for the influent and biological treatment stages, along with influent/effluent water quality data, are detailed in Table 1. The effluent discharge complies with the Class 1A standards specified in China’s Discharge Standard of Pollutants for Municipal Wastewater Treatment Plants (GB 18918-2002) [19]. The sludge treatment process primarily involved gravity thickening followed by dewatering using a belt filter press (SIE BT-PRESS 4000, Speyer, Germany). The characteristic flows within the sludge treatment stage—specifically, the influent sludge volume and the volume of dewatered sludge discharged from the plant—are presented in Table 1.

Table 1.
Water quality of influent and effluent as well as operational parameters of the WWTP in Hunan Province (Jan–Dec 2023).
2.2. System Boundary of the Case Study
The carbon accounting boundary for the wastewater treatment plant extends beyond the facility to include municipal sewer networks (Figure 1). Conventionally, carbon emission accounting commences when wastewater enters the treatment plant. However, this approach overlooks greenhouse gases (CO2, CH4, and N2O) generated through microbial activity within municipal sewer systems [20]. Consequently, to enable more accurate assessment of carbon emissions from wastewater treatment plants, the accounting scope must incorporate this sewer network.
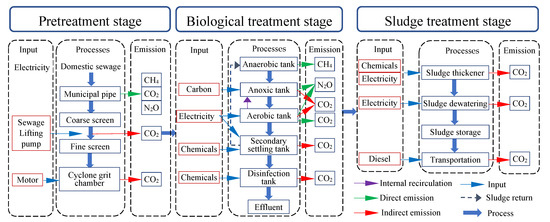
Figure 1.
The boundary of accounting: from municipal sewage network to the wastewater treatment plant (pretreatment stage, biological treatment stage, and sludge treatment stage).
2.3. Carbon Emission Calculation in the Pretreatment Stage
2.3.1. Direct Carbon Emissions and Emission Intensity
The preliminary treatment stage extends from the municipal sewer network to the cyclone grit chamber. The carbon emission sources within this stage, as illustrated in Figure 1, primarily comprise direct and indirect carbon emissions. Direct carbon emissions arise predominantly from CO2 generated by the aerobic microbial degradation of fossil-derived carbon in wastewater within sediments of the municipal sewer network [21], and CH4 and N2O produced by anaerobic metabolism of organic matter in biofilms attached to pipe walls and by microorganisms within the pipelines [22,23], These emissions exclude biogenic CO2 of biological origin, which constitutes a carbon-neutral flux since it originates from—and ultimately returns to—the atmospheric carbon pool without contributing to net atmospheric CO2 increase. Indirect carbon emissions are mainly attributable to CO2 emissions resulting from the electricity consumption required to operate the hydraulic lift pump station located after the coarse screens and the cyclone grit chamber within the wastewater treatment plant. The calculation methodologies for the emission quantities of these three greenhouse gases (CO2, CH4, N2O) originated from the municipal sewer network are detailed in Equations (1)–(3).
mCO2f1,i: the fossil-derived CO2 emissions (kg CO2) from the municipal sewer network on day i. FCF: the fossil carbon fraction for CO2 emissions, set at 12% [7]. EFCO2: the CO2 emission factor for the municipal sewer network (kg CO2/kg CODcr), with the value of 0.0124 kg/kg. β: the CODcr degradation coefficient, with the value of 0.6 [24]. C: the average concentration of organic matter in the wastewater within the municipal sewer network (expressed as CODcr), kg/m3. Q0,i: the wastewater flow volume conveyed through the sewer network on day i, m3. mCH4f1,i: the CH4 emissions (kg CH4) from the municipal sewer network on day i. EFCH4: the CH4 emission factor for the municipal sewer network (kg CH4/kg CODcr), with the value of 0.00105 kg/kg. mN2Of1,i: the N2O emissions (kg N2O) from the municipal sewer network on day i. EFN2O,PE: the per capita N2O emission factor, which adopts the IPCC default emission factor for N2O from wastewater discharged to aquatic environments, specifically 0.0035 kg/(person·year) [25]. PE: the served population, in number of persons.
The carbon emission intensity of a wastewater treatment plant (WWTP) refers to the amount of carbon emissions generated per unit volume of treated wastewater. It serves as a key metric for comparing carbon emissions across different WWTPs. The calculation formulas for the direct carbon emission intensity during the preliminary treatment stage are Equations (4)–(6).
ECO2f1: Fossil carbon emission intensity in municipal sewer networks, kg CO2/m3. ECH4f1: CH4 emission intensity in municipal sewer networks, kg CO2eq/m3. EN2Of1: N2O emission intensity in municipal sewer networks, kg CO2eq/m3. The values 28 and 298 represent the Global Warming Potentials (GWP) of CH4 and N2O, respectively [26].
2.3.2. Indirect Carbon Emissions and Emission Intensity
The indirect carbon emissions during the sewage pretreatment stage primarily originate from the electricity consumption during the operation process. This specifically includes the energy use of hydraulic lifting in wastewater pumping stations and mechanical agitation in vortex grit chambers. The calculation of carbon emissions at this stage is shown in Equation (7).
mej,i: the carbon emissions (kg CO2eq) resulting from electricity consumption under scenario j on day i, where j = 1 represents the operational scenario of the sewage pumping station at the wastewater treatment plant, and j = 2 represents the operational scenario of the aerated grit chamber. Wj,i: the electricity consumption (kW·h) under scenario j on day i. EFe: Emission factor for the regional grid electricity, kg CO2eq/(kW·h). The value for the Central China regional grid, 0.8587 kg CO2eq/(kW·h), is selected [27].
The calculation of carbon emission intensity of electricity consumption during the preliminary treatment phase is in Equation (8).
Eej: Carbon emission intensity from electricity consumption for scenario j (kg CO2eq/m3).
2.4. Carbon Emission Calculation in the Biological Treatment Stage
2.4.1. Direct Carbon Emissions and Emission Intensity
As the core of the AAO process, the biological treatment stage bears the key function of removing organic matter from municipal sewage. Consequently, the majority of direct carbon emissions (greenhouse gases such as CH4, N2O, and CO2) are generated in this stage. Furthermore, this biological treatment stage also involves other forms of carbon emissions, as shown in Figure 1.
Figure 1 shows the sources of carbon emissions in the biological treatment stage: In the anaerobic tank, methanogens decompose organic acids, producing CH4; In the anoxic tank, denitrifying bacteria reduce NO3−/NO2− to N2 through a series of intermediate product conversions, accompanied by the generation of N2O. Furthermore, when denitrification occurs in the anoxic tank, the insufficient carbon sources necessitate the addition of external carbon sources; this process also leads to indirect carbon emissions. In the oxide tank, organic matter decomposes due to aeration, producing fossil-derived carbon. Simultaneously, N2O is released during the oxidation of ammonia and hydroxylamine [28]. The calculation of direct carbon emissions for this stage is shown in Equations (9)–(12).
mCH4f2,i: CH4 emissions on day i, kg CH4. Q1,i: Influent flow rate to the biological treatment stage on day i, m3. COD1,i: Average influent CODcr concentration in the biochemical reaction tank on day i, mg/L. COD2,i: Average effluent CODcr concentration in the biochemical reaction tank on day i, mg/L. SGi: sludge production at the wastewater treatment plant on day i, kg. Pv: Percentage content of organic matter in sludge on day i, %. ρs: Conversion factor between organic matter and CODcr in sludge, with the value of 1.42 kg CODcr/kg DS. EFCH4: CH4 emission factor, kg CH4/kg CODcr. B0: Methane yield coefficient for anaerobic CODcr degradation, 0.25 kg CH4/kg CODcr. MCF: CH4 correction factor, 0.03. mN2Of2,i: N2O emissions on day i, kg N2O. TN1,i: Average influent TN concentration in the biochemical tank on day i, mg/L. TN2,i: Average effluent TN concentration in the biochemical tank on day i, mg/L. EFN2O: N2O emission factor (default value: 0.016 kg N2O-N/kg TN). CN2O/N2: Molar mass ratio of N2O to N2, 44/28. mC2Of2,i: Fossil-derived CO2 emissions from organic matter decomposition in aerobic tanks on day i, kg CO2.
The calculation of direct carbon emission intensity during the biological treatment phase is provided in Equations (13)–(15).
ECH4f2: Methane emission intensity from anaerobic digestion, kg CO2eq/m3. EN2Of2: Nitrous oxide emission intensity from the anoxic-aerobic phase, kg CO2eq/m3. EC2Of2,i: Fossil-derived carbon emission intensity from organic matter decomposition in aerobic tanks, kg CO2/m3.
2.4.2. Indirect Carbon Emissions and Emission Intensity
Aeration constitutes the predominant factor contributing to indirect carbon emissions during the biological treatment phase. In fully aerated aerobic tanks, microorganisms sequentially decompose nitrogenous organic matter into NH4+-N (ammonification), oxidize NH4+-N to NO2− (nitritation), and ultimately convert NO2− to NO3− (nitration). Insufficient dissolved oxygen in aerobic tanks severely impedes nitration while promoting the generation of byproduct N2O [29]. Concurrently, under aerobic conditions, phosphate-accumulating organisms (PAOs) regain metabolic activity, enabling them to assimilate phosphorus beyond growth requirements and ultimately remove it from wastewater as phosphate precipitates. Consequently, aeration in aerobic tanks demands substantial electrical energy, thereby inducing significant CO2 emissions. Additionally, indirect carbon emissions arise from the electricity consumption for mixed liquor recirculation, mixing in biochemical tanks, and sludge return from secondary clarifiers and chemical reagents dosed in secondary clarifiers and disinfection. The calculation of indirect carbon emissions for this phase is provided in Equations (16)–(18).
me3,i: Carbon emissions from electricity consumption for aeration, internal recirculation, sludge return, mixed liquor mixing, and chemical dosing (phosphorus removal agents/disinfectants) in the biological treatment phase on day i, kg CO2eq. W3i: Purchased electricity for the aforementioned processes in the biological treatment phase on day i, kW·h. mp1,i: Indirect carbon emission equivalent from disinfectant dosing (NaClO) in disinfection units on day i kg CO2eq. mN,i: Disinfectant consumption on day i, kg. EFNaClO: Carbon emission factor of sodium hypochlorite, 0.92 kg CO2eq/kg [30]. mp2,i: Indirect carbon emission from phosphorus removal agent dosing (PAC) in sedimentation tanks on day i, kg CO2eq. mPAC,i: Daily phosphorus removal agent consumption on day i, kg. EFPAC: Carbon emission factor of polyaluminum chloride (PAC), 1.6 kg CO2eq/kg [26].
The calculation of the corresponding indirect carbon emission intensity for the biological treatment phase is provided in Equations (19)–(21).
Ee3: Carbon emission intensity from electricity consumption for aeration, internal recirculation, sludge return, mixed liquor mixing, and reagent of phosphorus precipitant/disinfectants in the biological treatment phase, kg CO2eq/m3. Ep1: Indirect carbon emission intensity from disinfectant dosing in disinfection units, kg CO2eq/m3. Ep2: Indirect carbon emission intensity from phosphorus removal agent dosing in sedimentation tanks, kg CO2eq/m3.
2.5. Carbon Emission Calculation of Sludge Treatment Stage
Sludge treatment, as a critical process in municipal wastewater treatment systems, carries significant implications for life-cycle carbon emissions within wastewater treatment plant environments. This study systematically analyzes the carbon emission characteristics across various sludge treatment stages (as illustrated in Figure 1), elucidating their primary sources and formation mechanisms.
The residual sludge is generated in secondary clarifier.
Consequently, indirect carbon emissions during sludge treatment stage primarily originate from three sources: (1) Electricity consumption for sludge thickening, mixing, coagulant aid dosing, and filtering press operation; (2) Carbon emissions associated with chemical reagent (PAM) dosing; (3) Diesel combustion emissions during truck transportation of Dewatered sludge.
Waste Activated Sludge exhibits significant biphasic separation characteristics, with the liquid phase accounting for over 99% of the total volume. In engineering practice, a cascade dewatering process is typically employed for mass reduction: Primary mechanical thickening reduces moisture content to 97% (w/w). Polymeric flocculant (PAM) dosing precedes belt filter press treatment to enhance solid-liquid separation efficiency. Final belt filter press produces stabilized dewatered sludge with moisture content below 80% (w/w), which is subsequently transported to end disposal facilities via hermetically sealed skip loaders. The corresponding carbon emission calculations are provided in Equations (22)–(24).
me6,i: Indirect carbon emissions from electricity consumption during sludge treatment on day i, kg CO2eq. W6,i: Purchased electricity for sludge treatment processes on day i, kW·h. mCO2f3,i: Indirect CO2 emissions from coagulant aid dosing during sludge dewatering on day i, kg CO2eq. mPAM,i: Mass of coagulant aid (PAM) dosed for sludge dewatering on day i, kg. EFPAM: Carbon emission factor of PAM, 1.50 kg CO2eq/kg [31]. mCO2,exp,i: Indirect carbon emission equivalent from truck transport of dewatered sludge on day i, CO2eq/kg. Vi: Diesel consumption for sludge transport trucks on day i, L, with a fuel consumption rate of 0.25 L/km·ton. ρoil: Density of diesel fuel, 0.86 × 10³ kg/m3. EFoil: Carbon emission factor for diesel combustion, 3.15 kg CO2eq/kg [26].
The calculation of the corresponding indirect carbon emission intensity for the sludge treatment stage is provided in Equations (25)–(27).
Ee6: Indirect CO2 emission intensity from electricity consumption during sludge treatment, kg CO2eq/m3. ECO2f3: Indirect CO2 emission intensity from PAM in sludge dewatering, kg CO2eq/m3. ECO2exp,i: Indirect CO2 emission intensity from truck transport of dewatered sludge, kg CO2eq/m3.
3. Results and Discussion
To quantify the total carbon emissions and carbon emission intensity of a wastewater treatment plant (employing the AAO process) in Hunan Province, operational log data for 2023 were obtained. However, as these logs only provided the plant’s aggregate electricity consumption, they proved insufficient for granular carbon accounting across individual treatment units. To address this limitation, electricity allocation ratios for AAO process units were from the relevant literature [32], enabling approximation of electricity consumption per treatment stage. The electricity distribution profile across the plant’s treatment units is illustrated in Figure 2.
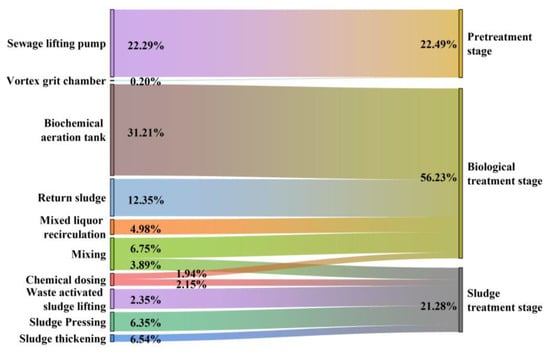
Figure 2.
Composition of electricity consumption in each link of the AAO process in the wastewater treatment plant.
Figure 2 reveals that the biological treatment stage accounts for 56.23% of total electricity consumption, representing the most energy-intensive stage throughout the wastewater treatment process. This predominance is primarily attributed to aerobic aeration and sludge return, which collectively constitute 42.56% of the plant’s total electricity demand. Concurrently, the preliminary treatment stage contributes 22.29% to overall consumption, largely driven by sewage pumping stations. Meanwhile, sludge treatment accounts for 21.28% of total electricity usage, with belt filter press operation exhibiting the highest energy intensity (6.54%) within this stage.
Given that certain carbon emission source denominations exhibit excessive length for graphical representation, abbreviations are adopted for all emission sources, as specified in Table 2.
Table 2.
Names of carbon emission sources and their abbreviation for the three treatment stages, including the emissions and emission of each source.
3.1. Analysis of Accounting Results in the Pretreatment Stage
During the pretreatment stage, direct carbon emissions—specifically CO2, N2O, and CH4 generated from municipal sewer networks—were incorporated into the accounting framework. This critical step is conventionally overlooked in traditional accounting methods, despite these emissions constituting a non-negligible share of the total carbon footprint. Quantitative results are presented in Figure 3 and Table 2.
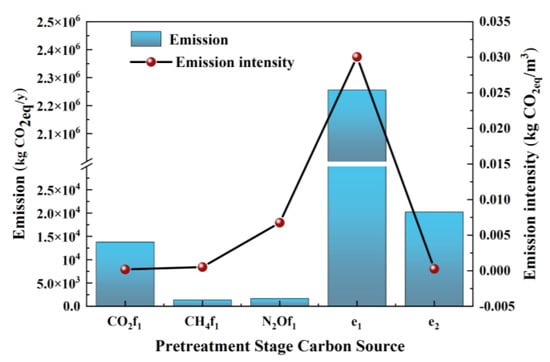
Figure 3.
The emission and intensity of each carbon emission in the pretreatment stage.
As evidenced in Figure 3, carbon emission sources exhibit substantial variations. Table 3 summarizes the direct and indirect carbon emissions during the pretreatment stage. Analysis reveals that direct emissions amount to 17 t CO2eq/y, while indirect emissions reach 2276 t CO2eq/y, 135-times higher than direct emissions. This demonstrates that controlling indirect carbon emissions is critical for effective mitigation in the pretreatment stage.
Table 3.
Carbon emission and emission intensity of the three treatment stages and the whole plant are divided into three major emission types and six emission sources.
Seen from the perspective of emission, fossil-derived carbon emissions (CO2f1) in municipal sewer networks exhibit the lowest specific emission and are statistically negligible. Furthermore, both methaneequivalent emission intensity (CH4f1) in sewer networks and equivalent emission intensity of cyclone grit chambers (e2) fall below 0.005 kg CO2eq/m3, indicating they are non-priority sources for mitigation. Conversely, both nitrous oxide-equivalent emission intensity (N2Of1) and carbon emission intensity of lifting pump stations exceed 0.005 kg CO2eq/m3, representing the critical targets for carbon reduction in pretreatment. Notably, pump station mitigation should enjoy priority, with the adoption of the following measures. Firstly, to enhance energy efficiency via high-efficiency equipment retrofitting, variable frequency drive (VFD) technology and hydraulic calculation optimization. Secondly, to adopt intelligent control systems such as IoT sensors for real-time monitoring of wet-well levels and pipe network flow, and AI-driven pump operation optimization algorithms.
3.2. Analysis of Accounting Results in the Biological Treatment Stage
The biological treatment stage is the core process in wastewater treatment, with its decisive role being unequivocal. This phase exhibits the highest levels of both direct and indirect carbon emissions. Notably, the studied wastewater treatment plant (WWTP) deliberately abstains from methane (CH4) recovery, instead, emits it directly to the atmosphere. Furthermore, no external carbon source was supplemented during the anoxic phase of biological treatment. The quantified carbon emissions for this stage are presented in Figure 4.
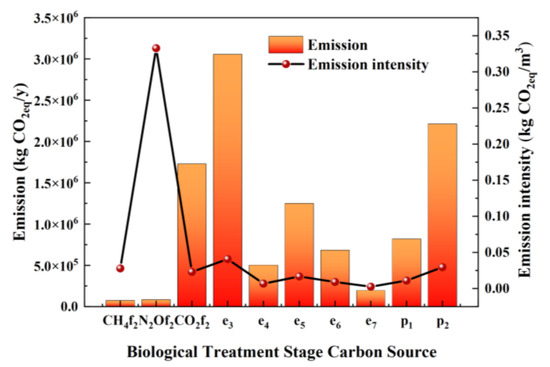
Figure 4.
The emission and intensity of each carbon emission in the biological treatment stage.
Carbon emission sources in the biological treatment stage exhibit significant disparities (Figure 4). Aeration (e3) dominates emissions at 3057 t CO2eq/y, exceeding the second-largest source—phosphorus removal agents (p2)—by 1.4-folds. Comparative analysis of Table 3 and Figure 2 confirms that aeration emissions surpass those from pretreatment and sludge treatment stages. Notably, aeration consumes 30.21% of the WWTP’s total electricity, yet yields the lowest specific emissions from CH4 release (74.7 t CH4/y), constituting merely 2.44% of aeration-related emissions. Analysis by emission type (Table 2) reveals that direct emissions (1877 t CO2/y) are eclipsed by indirect emissions (8721 t CO2eq/y). Critically, CH4 and N2O emissions from biological treatment possess exceptionally high global warming potentials (GWPs), with N2O’s GWP of 298, driving its equivalent emission intensity to 0.333 kg CO2eq/m3. This phenomenon may stem from incomplete denitrification due to the absence of external carbon supplementation in anoxic zones, leading to accumulation and release of nitrogenous intermediates [28]. Electricity consumption generates 5690 t CO2eq/y at an intensity of 0.076 kg CO2eq/m3, of which aeration accounts for 0.041 kg CO2eq/m3, establishing it as the primary target for electrical carbon mitigation. Conversely, emissions from mixed liquor recirculation, waste sludge return, agitation, and chemical dosing all demonstrate intensities <0.02 kg CO2eq/m3, rendering them non-priority mitigation sources. Chemical consumption contributes 3032 t CO2eq/y (intensity: 0.04 kg CO2eq/m3), while phosphorus removal agents specifically account for 2214 t CO2eq/y (intensity: 0.030 kg CO2/m3), representing the key focus for chemical-related emission reduction.
The biological treatment stage is pivotal for carbon emission reduction in wastewater treatment plants (WWTPs). Firstly, methane (CH4) stands as one of the few recoverable energy sources within WWTPs. Its recovery and utilization serve as a carbon sink, offering a dual benefit: mitigating direct greenhouse gas emissions and offsetting indirect carbon emissions from electricity consumption. Secondly, enhanced nitrogen removal constitutes a critical component of emission reduction. Techniques such as aerobic granular sludge [33], anaerobic ammonium oxidation (anammox) [34,35], algal–bacterial symbiosis systems [36,37], and coupled aerobic-anoxic nitrous decomposition [38,39,40] have demonstrated significant efficacy in nitrogen removal. Addressing the high energy consumption associated with the aeration stage involves a two-pronged approach. On one hand, measures like optimizing aeration control, enhancing aeration equipment efficiency, improving aeration systems, and strengthening routine management and maintenance can reduce electricity demand during aeration. On the other hand, installing solar photovoltaic panels on-site (e.g., over biochemical reactors or sedimentation tanks) can generate green energy to partially take the place of coal-based electricity, thereby achieving energy saving and emission reduction [41]. Regarding carbon reduction linked to phosphorus removal chemicals, intelligent chemical dosing systems should be introduced for precision control by adjusting dosage based on fluctuating flow and water quality parameters. Concurrently, selecting phosphorus removal agents with lower carbon emission coefficients through experimentation can achieve the desired emission reduction.
3.3. Analysis of Accounting Results in the Sludge Treatment Stage
During the operation of the AAO wastewater treatment process, a significant characteristic emerges: its biological treatment system generates a substantial volume of excess sludge. For the treatment of this sludge with high water content, the key step lies in achieving efficient dewatering and volume reduction. The primary methods currently employed to reduce sludge water content are sludge thickening (including mixing) and sludge pressure filtration. Both methods require electrical energy consumption. Furthermore, polyacrylamide (PAM) is typically dosed prior to belt filter press to enhance dewatering efficiency. The carbon emission accounting results for this stage are presented in Figure 5.
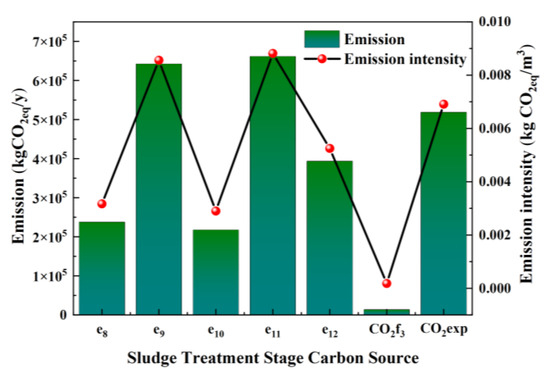
Figure 5.
The emission and intensity of each carbon emission in the sludge treatment stage.
As shown in Figure 5, significant variations persist in the carbon emissions from different sources during this stage. Emissions from excess sludge lifting (e11) were the highest at 662 t CO2eq/y, while emissions from coagulant aids added during sludge thickening (CO2f3) were the lowest at 14 t CO2eq/y, representing a substantial disparity. Since anaerobic digestion of sludge was not implemented in this stage, direct emissions were not considered. Emissions associated with sludge thickening (e8), sludge pressure filtration (e9), coagulant aid dosing (e10), and mixing during sludge thickening (e12) stemmed from electricity consumption, totaling 1491 t CO2eq/y. Additionally, emissions from sludge transportation (CO2exp) amounted to 519 t CO2eq/y.
Regarding carbon emission intensity, the lifting of excess sludge exhibited the highest intensity at 0.0088 kg CO2eq/m3. Sludge pressure filtration ranked second with an emission intensity of 0.0086 kgCO2eq/m3, followed by sludge transportation at 0.0069 kg CO2eq/m3. The emission intensities of all other carbon sources were below 0.005 kg CO2eq/m3. Considering both the total carbon emissions and emission intensities during the sludge treatment stage, carbon mitigation efforts should primarily focus on reducing electrical energy consumption. This can be achieved by implementing real-time monitoring of energy usage in sludge treatment equipment and utilizing data analysis to identify high-energy-consumption equipment and processes for optimization. Additionally, strategies such as energy substitution, sludge resource recovery and carbon sequestration technologies, and the synergistic application of policy and market mechanisms can be employed to further reduce carbon emissions.
3.4. Analysis of Whole Plant Accounting Results
The above is an analysis of carbon emissions across different treatment stages within the wastewater treatment plant, with specific carbon reduction recommendations proposed for each stage. To gain a comprehensive understanding of the plant’s carbon footprint, it is imperative to consider both the total carbon emissions and the emission intensity. The corresponding data are presented in Figure 6 and Table 3.
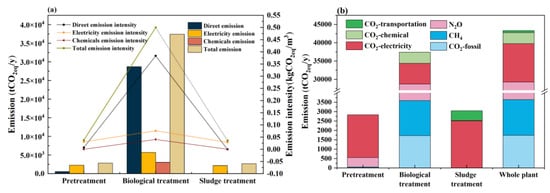
Figure 6.
The different carbon emissions and emission intensities at each stage. (a) Direct, electricity, chemical, and total emissions, and emission intensities, of different stages. (b) Different types of carbon emissions at different stages.
Data presented in Table 3 and Figure 6a indicate that the studied WWTP exhibits an annual carbon footprint of 42,947 t CO2eq/y with an emission intensity of 0.573 kg CO2/m3. This carbon intensity is notably lower than the reported value of 1.002 kg CO2/m3 in Li et al.’s study [5], which could be partially attributed to significantly higher influent concentrations of BOD, COD, TN, and TP at the WWTPs investigated in their research. Direct emissions account for 29,263 t CO2eq/y, while indirect emissions total 13,684 t CO2eq/y. Direct emissions constitute the dominant portion, representing 68.14% of the plant’s total carbon footprint. This distribution pattern aligns closely with Yu et al.’s findings (70% reported) [42], confirming that direct emissions dominate the carbon profile in wastewater treatment operations. Regarding indirect emissions, the preliminary treatment stage contributes 2276 t CO2eq/y, and the sludge treatment stage emits 2686 t CO2eq/y, both stages being comparable in magnitude. In contrast, the biological treatment stage generates 8722 t CO2eq/y (accounting for 63.74% of the total indirect carbon emissions at the wastewater treatment plant), which is 3.8 times and 3.2 times the emissions of the preliminary and sludge treatment stages, respectively. Thus, the biological treatment stage represents the primary source of indirect emissions. While direct emissions dominate the plant’s overall carbon footprint, the three treatment stages exhibit distinct emission profiles. The preliminary treatment stage emits 556 t CO2eq/y in direct emissions, whereas the biological treatment stage contributes 28,707 t CO2eq/y. Direct emissions were not considered for the sludge treatment stage. Notably, the biological treatment stage accounts for the majority of direct emissions within the plant.
The examination of the overall carbon emission intensity of the wastewater treatment plant reveals that the indirect emission intensity for the entire plant is 0.182 kg CO2eq/m3, while the direct emission intensity is 0.391 kg CO2eq/m3. This clearly indicates that reducing direct emissions is the primary focus for carbon mitigation across the plant. Within the biological treatment stage, the indirect emission intensity reaches 0.116 kg CO2eq/m3, which is 1.76 times the combined indirect emission intensity of the preliminary and sludge treatment stages. This significant disparity is primarily attributed to the high electricity consumption and substantial chemical dosage requirements within the biological treatment process. Consequently, future municipal wastewater treatment plants face heightened demands, necessitating the urgent development of more precise aeration and chemical dosing control systems. Regarding direct emissions, the biological treatment stage exhibits an intensity of 0.384 kg CO2eq/m3, which is 51.8 times greater than the direct emission intensity of the preliminary treatment system (0.007 kg CO2eq/m3). Notably, within the biological treatment stage, the emission intensity of nitrous oxide (N2O) alone is particularly high, at 0.333 kg CO2eq/m3. Undoubtedly, the biological treatment stage occupies a central position in the carbon reduction strategy for wastewater treatment plants, both in terms of absolute emission quantity and emission intensity. Therefore, adopting novel nitrogen removal processes—such as Partial Nitritation-Denitritation (PND) and Anaerobic Ammonium Oxidation (anammox)—in biological treatment systems enables substantial mitigation of operational carbon emissions in wastewater treatment plants.
As shown in Table 3 and Figure 6b, the distribution of different carbon emission sources varies across the three treatment stages of the wastewater treatment plant. The preliminary treatment stage comprises four emission sources, among which CO2 emissions from electricity consumption are the highest, accounting for 80.4%. The biological treatment stage encompasses five emission sources. With the exception of sludge transportation, emissions from all the other sources represent the highest levels among the three stages. Notably, equivalent emissions of N2O are particularly dominant, constituting 67.1% of the stage’s total emissions. The sludge treatment stage includes three emission sources, with CO2 emissions from electricity consumption again being the predominant contributor at 80.2%. Therefore, from the perspective of emission source types, CO2 emissions arising from electricity consumption and N2O emissions from biochemical reactors must be prioritized as key targets for future carbon reduction in wastewater treatment plants.
4. Conclusions
Employing a life-cycle carbon footprint accounting methodology, this study systematically investigates the carbon emission profiles and mitigation potential across treatment units in an urban wastewater treatment plant (WWTP) located in Hunan Province, China. The principal findings are as follows:
- (1)
- The plant’s total annual carbon emissions are 42,947 t CO2eq, with an emission intensity of 0.573 kg CO2eq/m3. Direct emissions account for 29,263 t CO2eq, while indirect emissions total 13,684 tCO2eq. Direct emissions constitute the dominant portion, representing 68.14% of the plant’s overall carbon footprint.
- (2)
- The biological treatment stage constitutes the core carbon emission hotspot, with direct emissions (CH4, N2O, CO2) and indirect emissions (electricity, chemicals, transportation) accounting for 68.14% and 63.74% of the plant’s total emissions, respectively. Notably, N2O emerges as the primary contributor to direct emissions due to its high global warming potential (GWP), exhibiting an emission intensity of 0.333 kg CO2eq/m3. In contrast, both preliminary and sludge treatment stages are dominated by indirect emissions from electricity consumption.
- (3)
- To achieve energy conservation and emission reduction, the biological treatment stage requires optimization of the aeration system through intelligent control technologies to reduce air supply, alongside methane (CH4) recovery for carbon offsetting and adoption of innovative nitrogen removal processes. For the preliminary treatment stage, variable frequency drives (VFDs) and IoT technologies should be implemented to enhance pumping station efficiency. In the sludge treatment stage, there should be many critical pathways for carbon mitigation, such as low-carbon dewatering technologies, energy substitution strategies, sludge resource recovery and carbon sequestration techniques, and synergistic policy-market mechanisms.
This study shows that the integration of sewer network emissions and process-level carbon intensity provides a more granular framework than existing IPCC-based approaches, enabling targeted mitigation.
Author Contributions
Conceptualization, S.Z. and Y.Y.; methodology, C.W.; software, Y.Y. and Z.Z.; validation, S.Z. and M.D.; formal analysis, Z.Z.; investigation, Y.Y.; data curation, L.Z.; writing—original draft preparation, S.Z., Y.Y. and Z.Z.; writing—review and editing, S.Z., C.W. and R.D.; visualization, A.H. and L.Z.; supervision, M.D. and A.H.; project administration, S.Z., C.W. and R.D. All authors have read and agreed to the published version of the manuscript.
Funding
This research was funded by the Ministry of Education in China Project of Humanities and Social Science (23YJAZH224), and Hunan Provincial Social Science Achievements Review Committee Project (XSP24YBZ152), and Natural Science Foundation of Hunan Province (2024JJ8319, 2025JJ50181, 2023JJ40288). And The APC was funded by 23YJAZH224, XSP24YBZ152, 2024JJ8319, 2025JJ50181, 2023JJ40288.
Data Availability Statement
The data generated in this study are available upon request from the corresponding author.
Conflicts of Interest
Author Saijun Zhou was employed by the company Hunan University of Science and Technology Engineering Testing Co., Ltd. The remaining authors declare that the research was conducted in the absence of any commercial or financial relationships that could be construed as a potential conflict of interest.
References
- Wei, Y.M.; Chen, K.Y.; Kang, J.N.; Chen, W.M.; Wang, X.Y.; Zhang, X.Y. Policy and management of carbon peaking and carbon neutrality: A literature review. Engineering 2022, 14, 52–63. [Google Scholar] [CrossRef]
- Nayeb, H.; Mirabi, M.; Motiee, H.; Alighardashi, A.; Khoshgard, A. Estimating greenhouse gas emissions from Iran’s domestic wastewater sector and modeling the emission scenarios by 2030. J. Clean. Prod. 2019, 236, 117673. [Google Scholar] [CrossRef]
- Yang, M.J.; Peng, M.; Wu, D.; Feng, H.Y.; Wang, Y.X.; Lv, Y.P.; Sun, F.Y.; Sharma, S.; Che, Y.; Yang, K. Greenhouse gas emission from wastewater treatment plants in China: Historical emissions and future mitigation potentials. Resour. Conserv. Recycl. 2023, 190, 106794. [Google Scholar] [CrossRef]
- Du, W.J.; Lu, J.Y.; Hu, Y.R.; Xiao, J.X.; Yang, C.; Wu, J.; Huang, B.C.; Cui, S.; Wang, Y.; Li, W.W. Spatiotemporal pattern of greenhouse gas emissions in China’s wastewater sector and pathways towards carbon neutrality. Nat. Water 2023, 1, 166–175. [Google Scholar] [CrossRef]
- Li, L.Q.; Wang, X.H.; Miao, J.Y.; Abulimiti, A.; Jing, X.S.; Ren, N.Q. Carbon neutrality of wastewater treatment-A systematic concept beyond the plant boundary. Environ. Sci. Ecotechnol. 2022, 11, 100180. [Google Scholar] [CrossRef]
- Zhao, Z.J.; Tuo, H.R.; Xie, X.T.; Chen, J.; Han, S.L.; Zhao, X.Q.; Liu, X.M. Research on characteristics of carbon emissions in medium- sized urban sewage treatment plants using improved A2O processes. J. South China Norm. Univ. (Nat. Sci. Ed.) 2024, 56, 63–71. [Google Scholar] [CrossRef]
- Hao, X.D.; Wang, X.Y.; Cao, D.Q.; Wu, Y.Y. Analysis of CO2 emission from fossil carbon in organics from wastewater. China Water Wastewater 2018, 34, 13–17. [Google Scholar] [CrossRef]
- Dong, X.; Zhang, X.Y.; Zeng, S.Y. Measuring and explaining eco-Efficiencies of wastewater treatment plants in China: An uncertainty analysis perspective. Water Res. 2017, 112, 195–207. [Google Scholar] [CrossRef]
- Karakas, A.; Tozum-akgul, S.; Komesli, O.T.; Kaplan-Bekaroglu, S.S. Carbon footprint analysis of advanced biological wastewater treatment plant. J. Water Process Eng. 2024, 61, 105254. [Google Scholar] [CrossRef]
- Xi, J.R.; Gong, H.; Zhang, Y.J.; Dai, X.H.; Chen, L. The evaluation of GHG emissions from Shanghai municipal wastewater treatment plants based on IPCC and operational data integrated methods (ODIM). Sci. Total Environ. 2021, 797, 148967. [Google Scholar] [CrossRef]
- Liao, X.W.; Tian, Y.J.; Gan, Y.W.; Ji, J.P. Quantifying urban wastewater treatment sector’s greenhouse gas emissions using a hybrid life cycle analysis method-an application on Shenzhen city in China. Sci. Total Environ. 2020, 745, 141176. [Google Scholar] [CrossRef]
- Chen, S.Q.; Zhang, L.M.; Liu, B.B.; Yi, H.; Su, H.S.; Kharrazi, A.; Jiang, F.; Lu, Z.M.; Crittenden, J.C.; Chen, B. Decoupling wastewater-related greenhouse gas emissions and water stress alleviation across 300 cities in China is challenging yet plausible by 2030. Nat. Water 2023, 1, 534–546. [Google Scholar] [CrossRef]
- Qiu, D.Z.; Chen, C.; Guo, L.; Liu, D.; Ma, J.H.; Lei, M.; Li, T.N.; Xu, K.K.; Yan, X. Characteristics of Greenhouse Gas Emission from Municipal Wastewater Treatment Plants in Major Urban Groups of China Based on Emission Factor Method. Environ. Eng. 2022, 40, 116–122. [Google Scholar] [CrossRef]
- Bao, Z.Y.; Sun, S.C.; Sun, D.Z. Characteristics of direct CO2 emissions in four full-scale wastewater treatment plants. Desalin. Water Treat. 2015, 54, 1070–1079. [Google Scholar] [CrossRef]
- Shrestha, A.; Bhattarai, T.N.; Ghimire, S.; Mainali, B.; Treichel, H.; Paudel, S.R. Estimation of greenhouse gases emission from domestic wastewater in Nepal: A scenario-based analysis applicable for developing countries. Chemosphere 2022, 300, 134501. [Google Scholar] [CrossRef]
- Maziotis, A.; Molinos-Senante, M. A comprenhesive eco-efficiency analysis of wastewater treatment plants: Estimation of optimal operational costs and greenhouse gas emissions. Water Res. 2023, 243, 120354. [Google Scholar] [CrossRef]
- Corominas, L.; Flores-alsina, X.; Snip, L.; Vanrolleghem, P.A. Comparison of different modeling approaches to better evaluate greenhouse gas emissions from whole wastewater treatment plants. Biotechnol. Bioeng. 2012, 109, 2854–2863. [Google Scholar] [CrossRef]
- Zhang, J.B.; Shao, Y.T.; Wang, H.C.; Liu, G.H.; Qi, L.; Xu, X.L.; Liu, S. Current operation state of wastewater treatment plants in urban China. Environ. Res. 2021, 195, 110843. [Google Scholar] [CrossRef]
- GB 18918-2002; China’s Discharge Standard of Pollutants for Municipal Wastewater Treatment Plants. Ministry of Ecology and Environment of the People’s Republic of China: Beijing, China, 2002.
- Li, P.F.; Sun, Y.L.; Zhang, Y.; Ge, T.G.; Gao, C.C.; Wu, B.L.; Wei, S.; Xia, Q.Q. Discussion on Carbon Emission Characteristics and Carbon Reduction Path of Urban Sewage System. Water Environ. Res. 2025, 51, 35–41. [Google Scholar]
- Zuo, Z.Q.; Ren, D.H.; Qiao, L.K.; Li, H.; Huang, X.; Liu, Y.C. Rapid dynamic quantification of sulfide generation flux in spatially heterogeneous sediments of gravity sewers. Water Res. 2021, 203, 117494. [Google Scholar] [CrossRef]
- Chen, H.; Ye, J.F.; Zhou, Y.F.; Wang, Z.N.; Jia, Q.L.; Nie, Y.H.; Li, L.; Liu, H.; Benoit, G. Variations in CH4 and CO2 Productions and emissions driven by pollution sources in municipal sewers: An assessment of the role of dissolved organic matter components and microbiota. Environ. Pollut. 2020, 263, 114489. [Google Scholar] [CrossRef]
- Yan, X.F.; Sun, J.; Kenjiahan, A.; Dai, X.H.; Ni, B.J.; Yuan, Z.G. Rapid and strong biocidal effect of ferrate on sulfidogenic and methanogenic sewer biofilms. Water Res. 2020, 169, 115208. [Google Scholar] [CrossRef] [PubMed]
- Huang, J.H. Study on Production Emissions Calculation of Exhaust Gas from Sewer System. Master’s Thesis, Kunming University of Science and Technology, Kunming, China, 2013. [Google Scholar]
- Liu, S.Y.; Zhu, X.Y.; Liang, S.; Tian, X.Y.; Ma, Y.G.; Gao, W.C. Carbon Emission Accounting and Emission Reduction Path Analysis of Urban Wastewater Treatment Plants: A Case of a Wastewater Treatment Plant in Shenyang City. Environ. Sci. 2025, 46, 4149–4158. [Google Scholar] [CrossRef]
- China Urban Water Association. Guidelines for Carbon Accounting and Emission Reduction in the Urban Water Sector; China Architecture & Building Press: Beijing, China, 2022. [Google Scholar]
- Ministry of Ecology and Environment the People’s Republic of China. Baseline Emission Factors for China’s Regional Power Grids in Emission Reduction Projects. [R/OL]. 2019. Available online: https://www.mee.gov.cn/ywgz/ydqhbh/wsqtkz/202012/W020201229610353340851.pdf (accessed on 20 February 2025).
- Schreiber, F.; Wunderlin, P.; Udert, K.M.; Wells, G.F. Nitric oxide and nitrous oxide turnover in natural and engineered microbial communities: Biological pathways, chemical reactions and novel technologies. Front. Microbiol. 2012, 3, 372–396. [Google Scholar] [CrossRef] [PubMed]
- Chen, H.L.; Qi, L.; Chen, J.B.; Xia, Z.H.; Li, Q.G.; Ao, Z.D.; Jiang, Z.; Zhang, T.T.; Wang, H.C.; Liu, G.H. Mechanisms and differences of N2O emission characterstics in typical wastewater treatment processes. China Environ. Sci. 2025, 45, 718–726. [Google Scholar] [CrossRef]
- T/CAEPI 49-2022; Technical Specification for Low-Carbon Operation Evaluation of Sewage Treatment Plant. China Association of Environmental Protection Industry: Beijing, China, 2022.
- Parravicini, V.; Svardal, K.; Krampe, J. Greenhouse gas emission from wastewater treatment plants. Energy Procedia 2016, 97, 246–253. [Google Scholar] [CrossRef]
- Jiang, F.H.; Li, J.Q.; Zhang, X.Z.; Chen, J. Fine management & control of pollution control and carbon reduction in the urban WWTPs. China Water Wastewater 2024, 40, 13–20. [Google Scholar] [CrossRef]
- Van Dijk, E.J.H.; Van Loosdrecht, M.C.M.; Pronk, M. Nitrous oxide emission from full-scale municipal aerobic granular sludge. Water Res. 2021, 198, 117159. [Google Scholar] [CrossRef]
- Al-Hazmi, H.E.; Maktabifard, M.; Grubba, D.; Majtacz, J.; Hassan, G.K.; Lu, X.; Piechota, G.; Mannina, G.; Bott, C.B.; Makinia, J. An advanced synergy of partial denitrification-anammox for optimizing nitrogen removal from wastewater: A review. Bioresour. Technol. 2023, 381, 129168. [Google Scholar] [CrossRef]
- Hausheer, D.; Niederdorfer, R.; Bürgmann, H.; Lehmann, M.F.; Magyar, P.; Mohn, J.; Morgenroth, E.; Joss, A. Successful year-round mainstream partial nitritation anammox: Assessment of effluent quality, performance and N2O emissions. Water Res. X 2022, 16, 100145. [Google Scholar] [CrossRef]
- Rossi, S.; Carecci, D.; Proietti, L.; Parati, K.; Ficara, E. Enhancing the environmental and economic sustainability of heterotrophic microalgae cultivation: Kinetic modelling and screening of alternative carbon sources. Chem. Eng. J. Adv. 2024, 19, 100632. [Google Scholar] [CrossRef]
- Zhang, Y.; Wang, J.H.; Zhang, J.T.; Chi, Z.Y.; Kong, F.T.; Zhang, Q. The long overlooked microalgal nitrous oxide emission: Characteristics, mechanisms, and influencing factors in microalgae-based wastewater scenarios. Sci. Total Environ. 2023, 856 Pt 2, 159153. [Google Scholar] [CrossRef]
- Zhang, X.Y.; Ji, B.; Tian, J.N.; Liu, Y. Development, performance and microbial community analysis of a continuous-flow microalgal-bacterial biofilm photoreactor for municipal wastewater treatment. J. Environ. Manag. 2023, 338, 117770. [Google Scholar] [CrossRef] [PubMed]
- Wang, Z.Y.; Woo, S.G.; Yao, Y.N.; Chen, H.H.; Wu, Y.J.; Criddle, C.S. Nitrogen removal as nitrous oxide for energy recovery: Increased process stability and high nitrous yields at short hydraulic residence times. Water Res. 2020, 173, 115575. [Google Scholar] [CrossRef] [PubMed]
- Yang, R.; Yuan, L.J. Generation, emission reduction/utilization, and challenges of greenhouse gas nitrous oxide in wastewater treatment plants—A review. J. Water Process Eng. 2023, 386, 129574. [Google Scholar] [CrossRef]
- Chen, X.; Zhou, W.J. Economic and ecological assessment of photovoltaic systems for wastewater treatment plants in China. Renew. Energy 2022, 191, 852–867. [Google Scholar] [CrossRef]
- Yu, J.; Zhao, R.Q.; Xiao, L.G.; Zhang, L.J.; Wang, S.; Chuai, X.W.; Hang, Y.C.; Jiao, S.X. Carbon emission of urban wastewater treatment system based on the “water-energy-carbon” nexus. Resour. Sci. 2020, 42, 1052–1062. [Google Scholar] [CrossRef]


Disclaimer/Publisher’s Note: The statements, opinions and data contained in all publications are solely those of the individual author(s) and contributor(s) and not of MDPI and/or the editor(s). MDPI and/or the editor(s) disclaim responsibility for any injury to people or property resulting from any ideas, methods, instructions or products referred to in the content. |
© 2025 by the authors. Licensee MDPI, Basel, Switzerland. This article is an open access article distributed under the terms and conditions of the Creative Commons Attribution (CC BY) license (https://creativecommons.org/licenses/by/4.0/).