Article

Modeling of Quantitative Characterization Parameters and Identification of Fluid Properties in Tight Sandstone Reservoirs of the Ordos Basin

1
School of Petroleum Engineering, Xi’an Shiyou University, Xi’an 710065, China
2
Key Laboratory of Special Stimulation Technology for Oil and Gas Fields in Shaanxi Province, Xi’an 710065, China
3
Research Institute of Shannxi Yanchang Petroleum (Group) Co., Ltd., Xi’an 710065, China
4
No.11 Oil Production Plant, Changqing Oilfield Company, PetroChina, Qingyang 745000, China
*
Author to whom correspondence should be addressed.
Processes 2024, 12(2), 278; https://doi.org/10.3390/pr12020278
Submission received: 15 December 2023 / Revised: 20 January 2024 / Accepted: 25 January 2024 / Published: 26 January 2024
(This article belongs to the Special Issue Advances in Enhancing Unconventional Oil/Gas Recovery)

Abstract

:
The Ordos Basin has abundant resources in its tight sandstone reservoirs, and the use of well logging technology stands out as a critical element in the exploration and development of these reservoirs. Unlike conventional reservoirs, the commonly used interpretation models are not ideal for evaluating tight sandstone reservoirs through logging. In order to accurately evaluate parameters and identify fluid properties in the tight sandstone reservoirs of the Ordos Basin, we propose the adaption of conventional logging curves. This involves establishing an interpretation model that integrates the response characteristics of logging curves to tight sandstone reservoirs in accordance with the principles of logging. In this approach, we create interpretation models specifically for shale content, porosity, permeability, and saturation within the tight sandstone reservoir. Using the characteristics of the logging curves and their responses, we apply a mathematical relationship to link these parameters and create a template for identifying fluid properties within tight sandstone reservoirs. The average absolute errors of the new multi-parameter weighting method shale content interpretation model and porosity classification saturation interpretation model for quantitative evaluation of reservoir shale content and oil saturation are small, and the accuracy meets the production requirements. In this paper, the four-step method is used to identify the fluid properties of tight sandstone reservoirs step by step, which is to use the interrelationship between curves, eliminate the useless information, enhance the useful information, and finally solve the problem of identifying the fluid properties of tight sandstone reservoirs, which is difficult to identify, and realize the linear discrimination of the interpretation standard, which improves the accuracy of interpretation. The proven multi-information, four-step, step-by-step fluid property identification template has an accuracy of more than 90%. The interpretation model has been applied to 20 wells on the block with a compliance rate of 95.23%, providing the basis for accurately establishing the tight sandstone interpretation standard. The newly introduced log evaluation approach for tight sandstone reservoirs effectively overcomes the technical hurdles that have previously hindered the evaluation of such reservoirs in the Ordos Basin. This method is suitable for wide application and can be used for quantitative evaluation of tight sandstone reservoirs in different regions.

1. Introduction

As global unconventional oil and gas exploration and development rapidly progresses, scientists are increasingly focusing on the development of tight sandstone reservoirs. Effective identification of fluids in these reservoirs is considered to be the first and crucial step for their efficient development [1,2]. Accurate identification of fluids in tight sandstone reservoirs is of great importance to the overall development of such reservoirs [3]. China’s land-phase tight sandstones are generally characterized by tight lithology and strong heterogeneity, making it difficult for conventional logging techniques to be useful for fluid identification [4,5]. Currently, logging curve identification for tight sandstones mainly includes lithology logging curves (natural potential SP, natural gamma GR), porosity logging curves (acoustic logging AC, density DEN, neutron CN), and resistivity logging curves (microlateral MLL, octolateral LL8, etc.) [6,7]. Based on the above logging curves for pore fluid identification, the selection of logging curves needs to be optimized and standardized [8,9].
The Ordos Basin is located at the intersection of the stable zone in eastern China and the active zone in western China. It is surrounded by multiple rifts as shown in Figure 1 [10]. Internally, the basin has a generally smooth structure characterized by a dip angle of less than 1°. The tectonic structure is simple, with gentle tectonics, stable subsidence, minimal fracturing and low activity [11,12]. The basin can be divided into six primary tectonic units: the northern Yimeng uplift, the western thrust belt, the western Tianhuan depression, the central Yishan slope, the southern Weibei uplift, and the eastern Jinxi fault fold belt [13].
Tight sandstone reservoirs in the Ordos Basin exist mainly in the lower assemblage, especially in the Chang 7–Chang 10 section [14]. These reservoirs exhibit poor physical properties, characterized by complex pore throat structure, pronounced heterogeneity, and complicated rock–electric relationships [15,16]. There are the following difficulties in logging interpretation: the interpretation model based on the relationship study of the “four properties” (lithological characteristics, physical characteristics, electrical characteristics and oil-bearing characteristics) of the conventional reservoir cannot effectively meet the evaluation of logging in tight sandstone reservoirs [17,18,19]. Due to the influence of the sandstone skeleton, the contribution of fluid properties to well logging information in tight sandstone reservoirs is much smaller than that of the rock skeleton, making it difficult to discriminate fluid properties [20]. Therefore, the results of well logging interpretation in tight sandstones are not satisfactory [21,22]. Aiming at the problems of conventional logging curves on tight sandstone interpretation and evaluation, this paper starts from tight sandstone reservoirs in Ordos Basin and establishes or selects the interpretation model of the lithology, porosity, permeability and saturation of tight sandstone reservoirs according to the four properties of reservoirs and the logging principle. We then enhance the relevant signals within the log curves using the reflection of reservoir characteristics in the log curves, supplemented by oil test and recovery data. This process eliminates extraneous information to provide a standardized interpretation for distinguishing between oil and water reservoirs.

2. Characterization of Tight Sandstone Reservoirs

2.1. Lithological Characteristics

According to the thin section electron micrographs and core photographs of the lower assemblage core of the Yanchang Formation in the Ordos Basin (Figure 2 and Figure 3), it can be seen that the pore type is dominated by intergranular pores, which are well developed. There are more fillers, mainly colluvium, and the colluvium is mainly illite and quartz, with better storage capacity. Combined with the petrographic description data of the logged wells, the main rock type of the lower assemblage of tight sandstone reservoirs is fine sandstone, with a small amount of medium sandstone and siltstone (Figure 4a). The mineralogical composition is dominated by feldspar sandstone (Figure 4b), with feldspar ranging from 55.13% to 83.54% of the fractions, with an average of 56.53%, quartz content ranging from 16.05% to 35.06%, with an average of 22.06%, and lithic content ranging from 3.66% to 10.71%, with an average of 5.61%. The variation in the lithology of the tight sandstone in the longitudinal direction is detailed in Figure 5. In the logging map, it can be seen that the lithology of the lower assemblage group is better, which is dominated by shaly sandstone and sandstone, and has better mining potential. Lower assemblage group tight sandstone casting thin section statistics are summarized in Table 1.

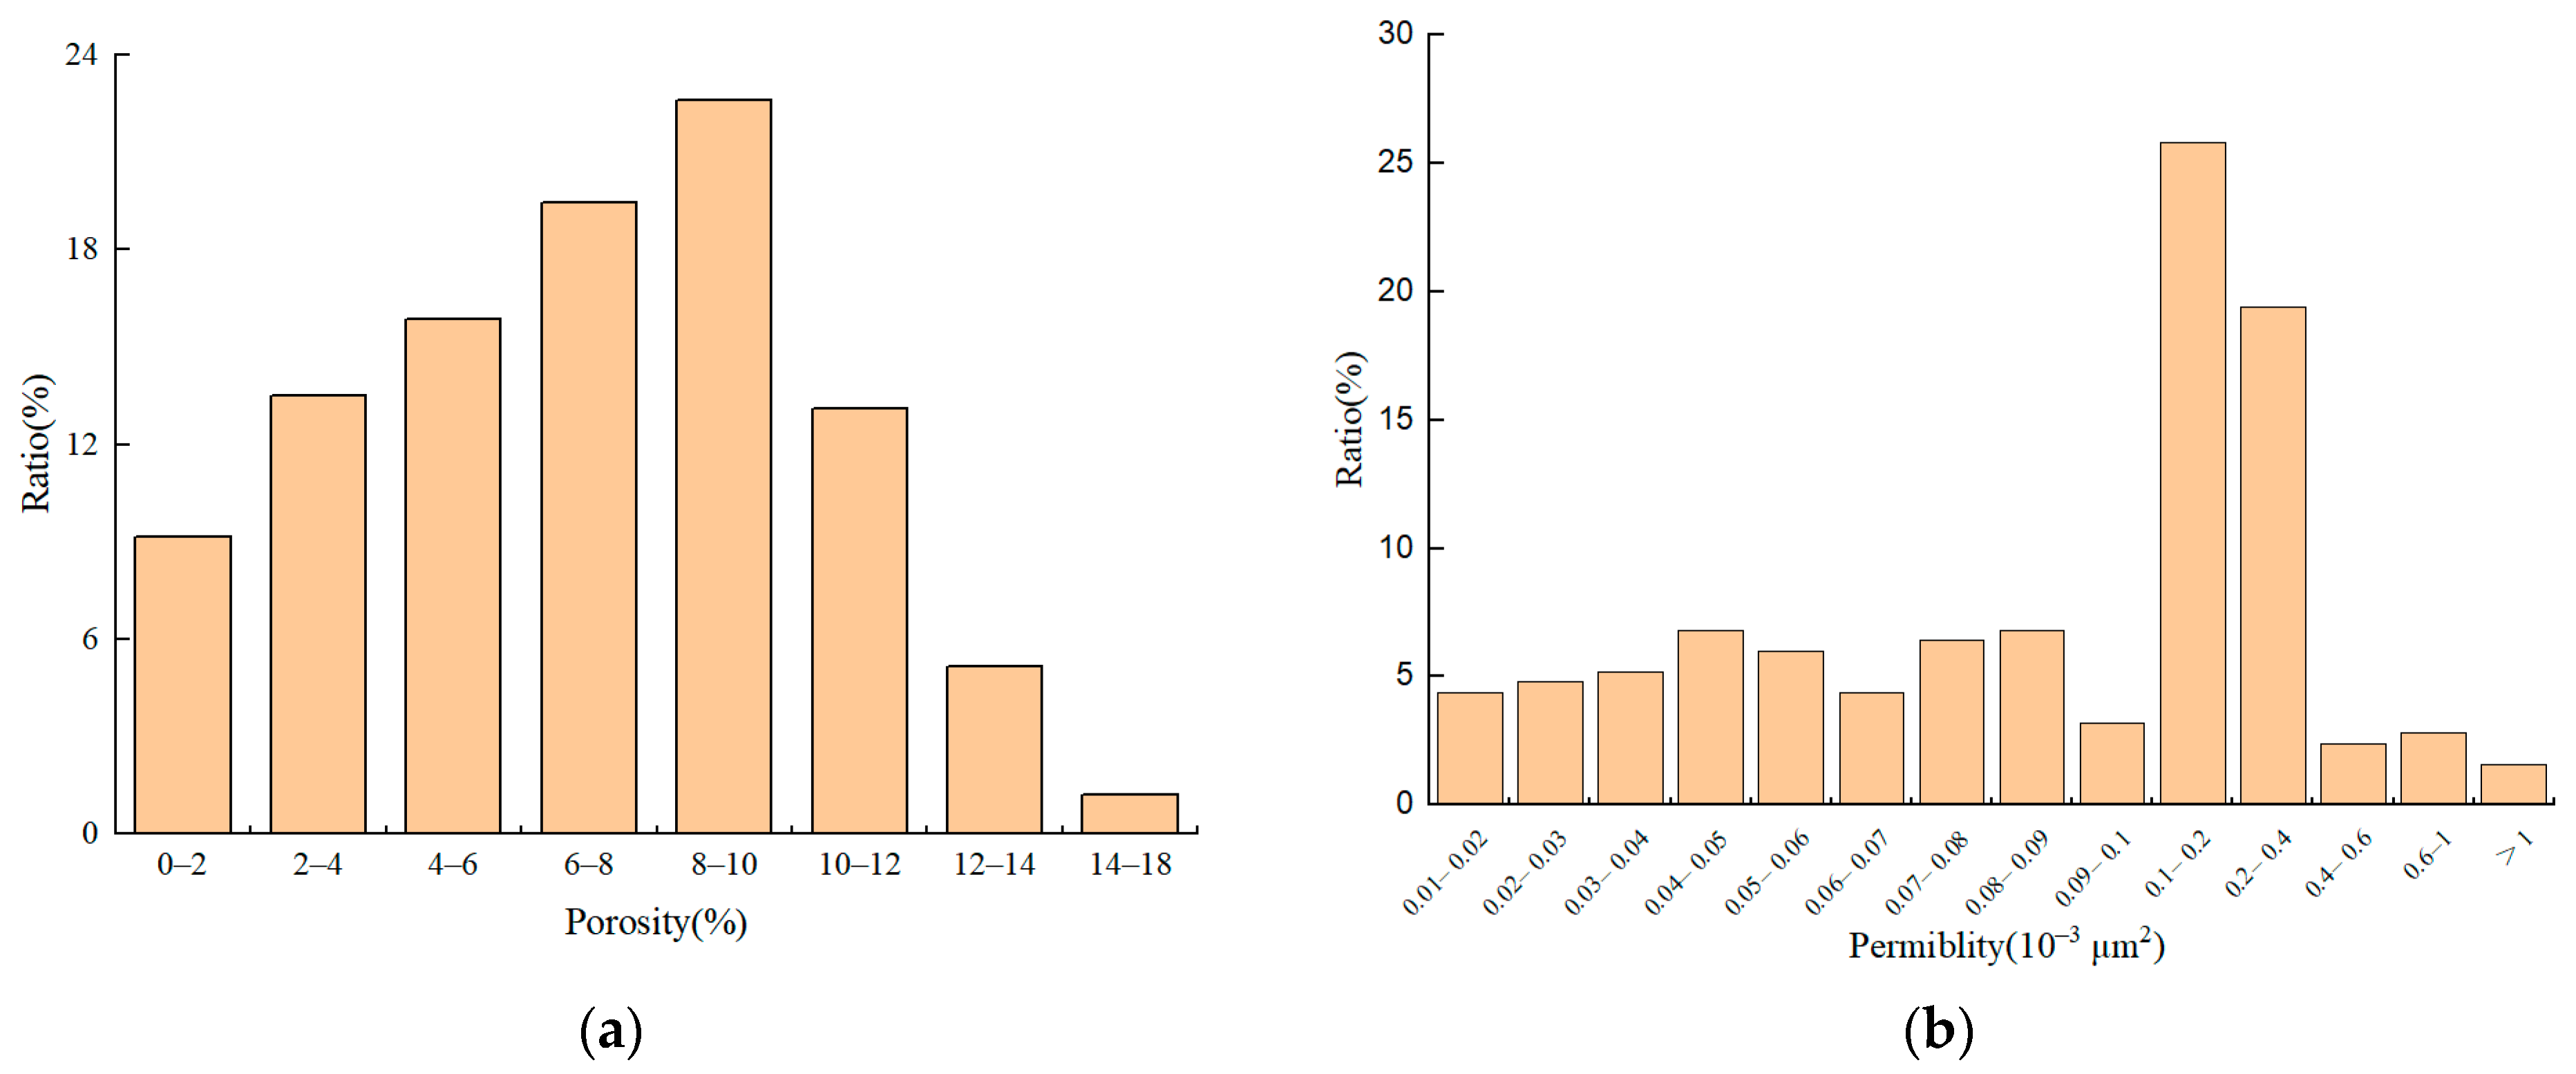
2.2. Physical Characteristics

In logging, the physical properties of the reservoir are typically characterized using the porosity and permeability parameters. The analysis of porosity and permeability variation patterns is primarily based on data from 252 sandstone samples. According to the core analysis data, the porosity distribution interval from Chang 7 to Chang 9 ranges from 1.1% to 18.81% (Figure 6a), with an average of 8.33%, and the main distribution range is between 2% and 12%, accounting for 84.52% of the porosity samples in this interval. The distribution range of permeability is 0.01–37.71 × 10⁻³ µm2 with a mean of 0.33 × 10⁻³ µm2 (Figure 6b). The main distribution range of permeability is between 0.07 × 10⁻³ µm2 and 0.4 × 10⁻³ µm2, which accounted for 61.5% of the total number of samples, while samples between 0.01 × 10⁻³ µm2 and 0.1 × 10⁻³ µm2 accounted for 48% of the samples, samples between 0.1 and 1 × 10⁻³ µm2 accounted for 50.4% of the samples, and samples larger than 1 × 10⁻³ µm2 accounted for only 1.6% of the total number of samples.

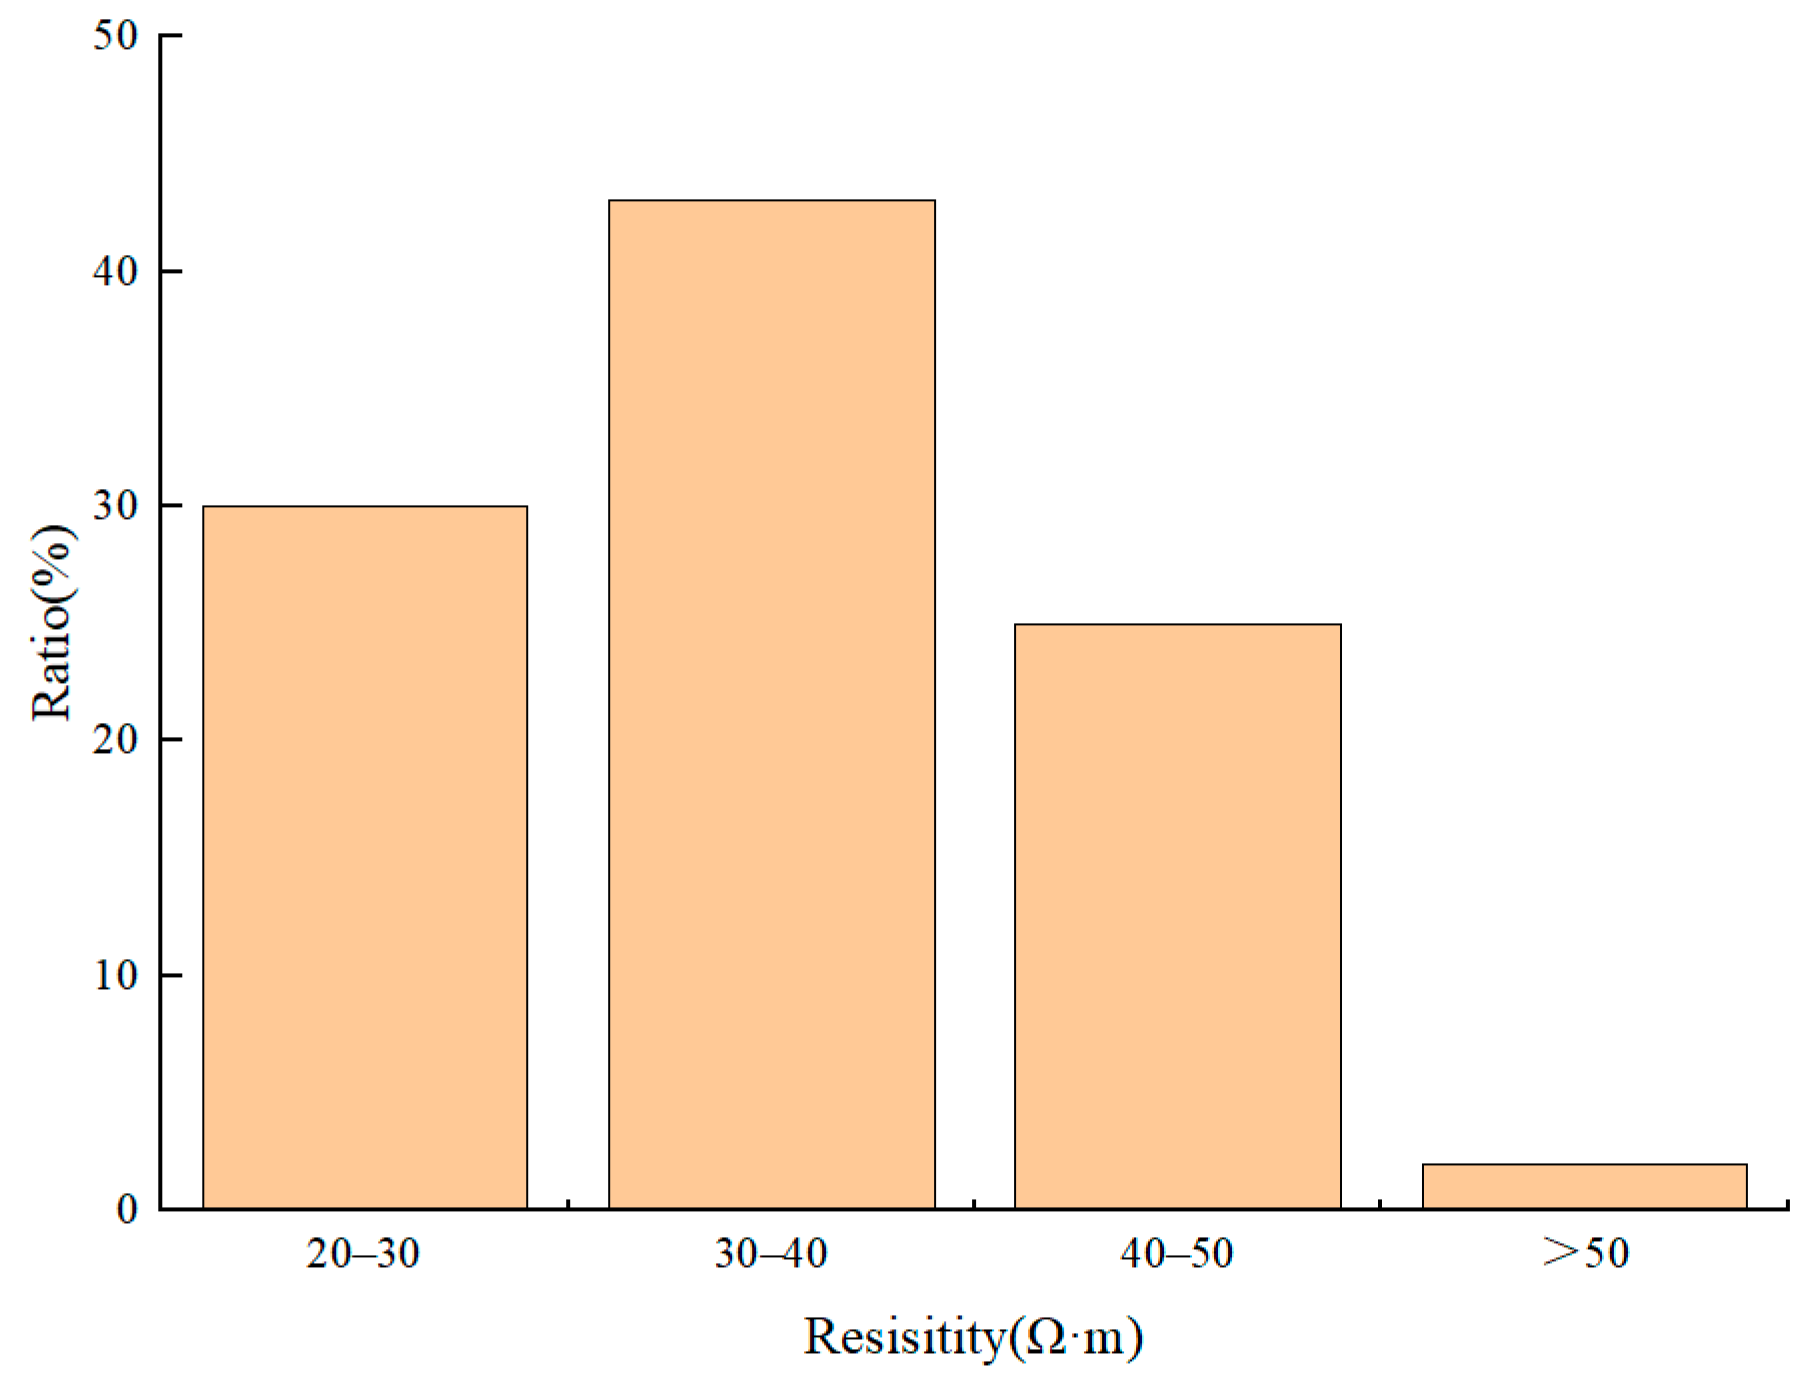
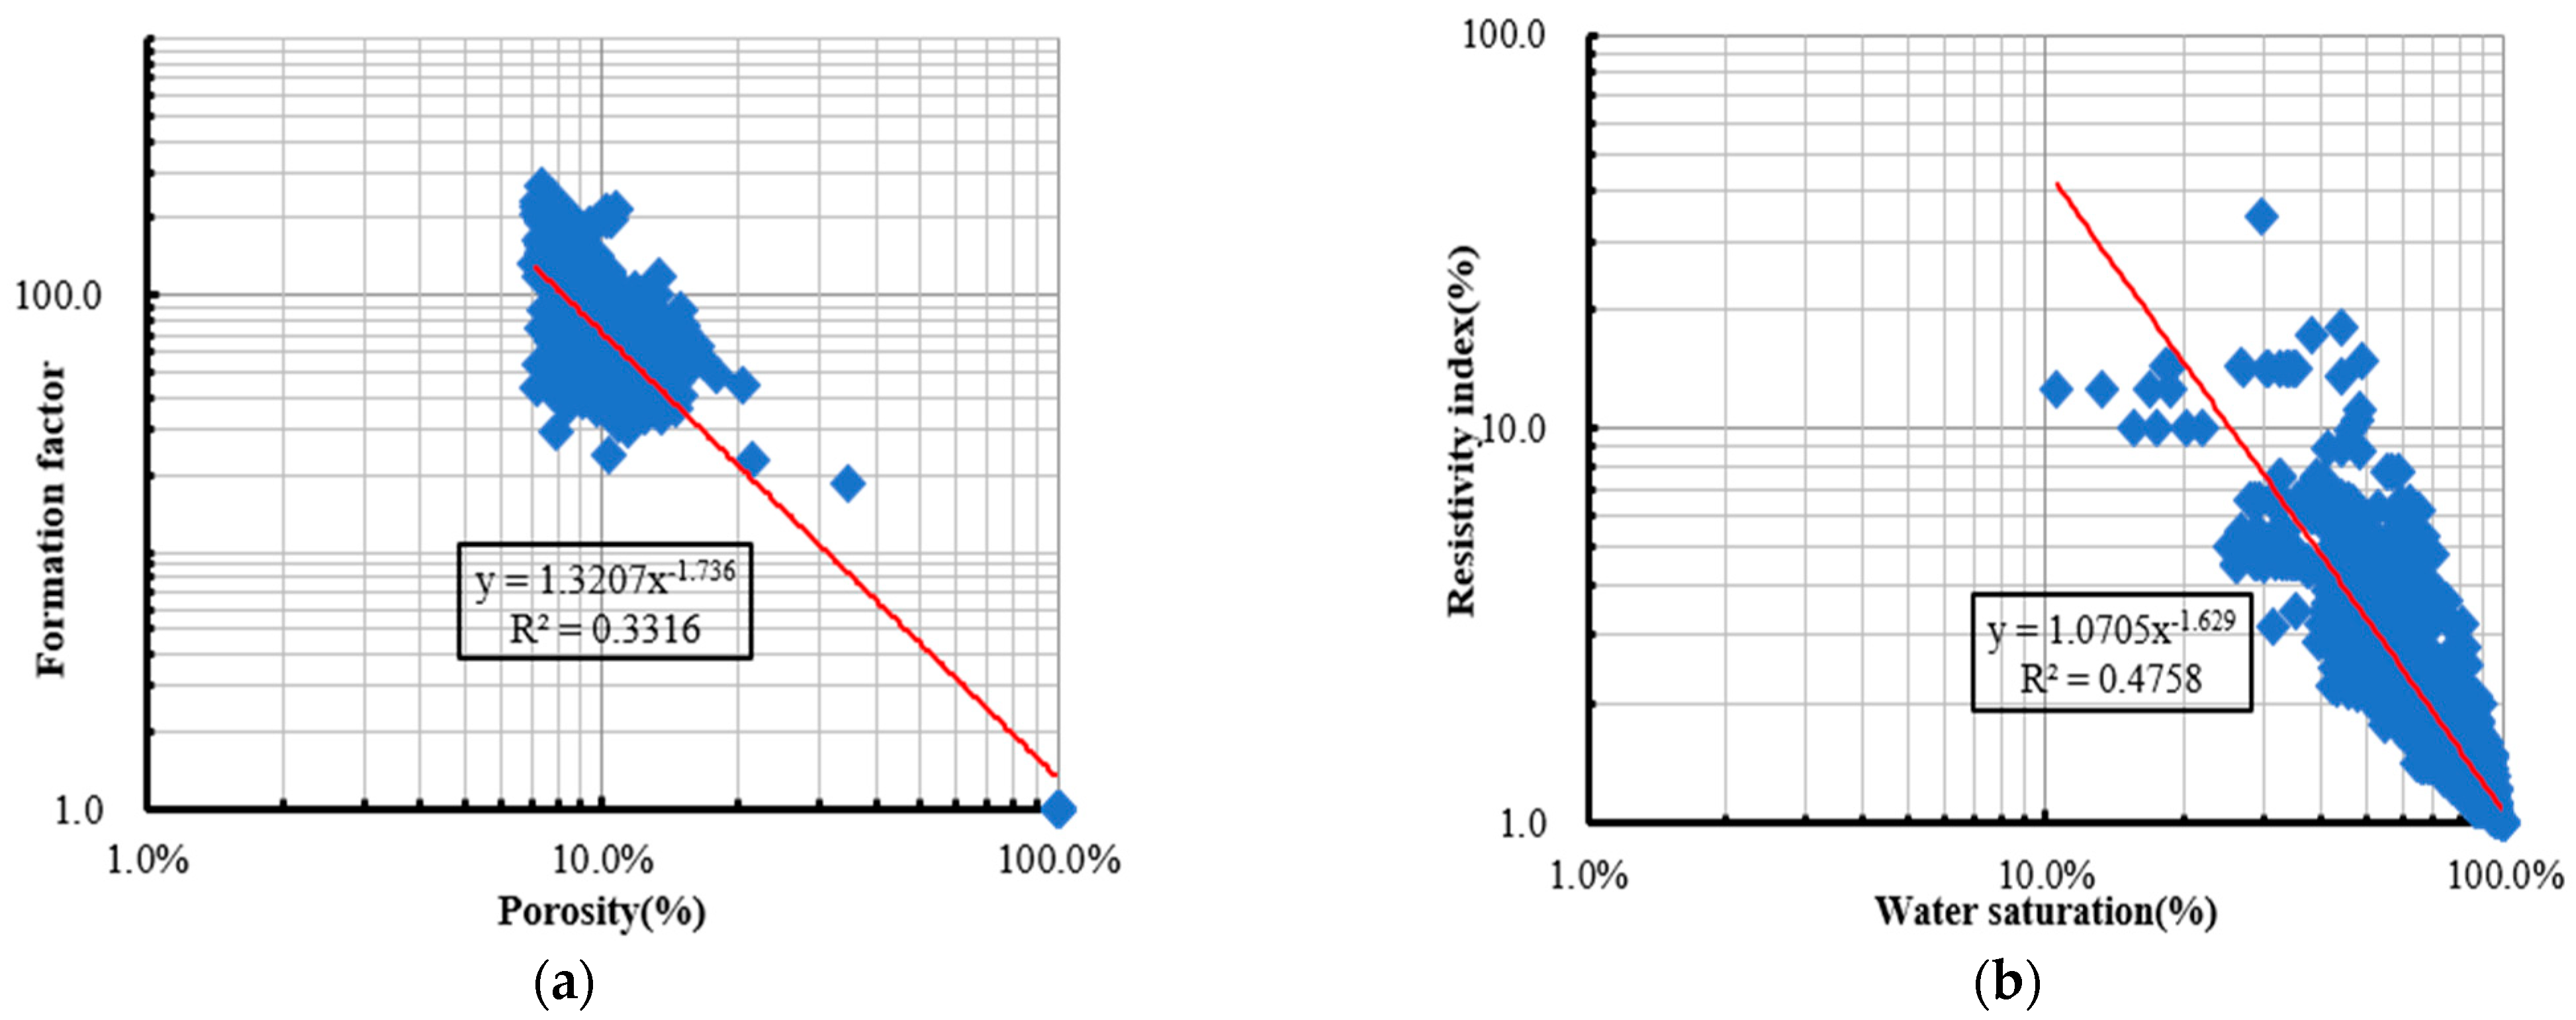
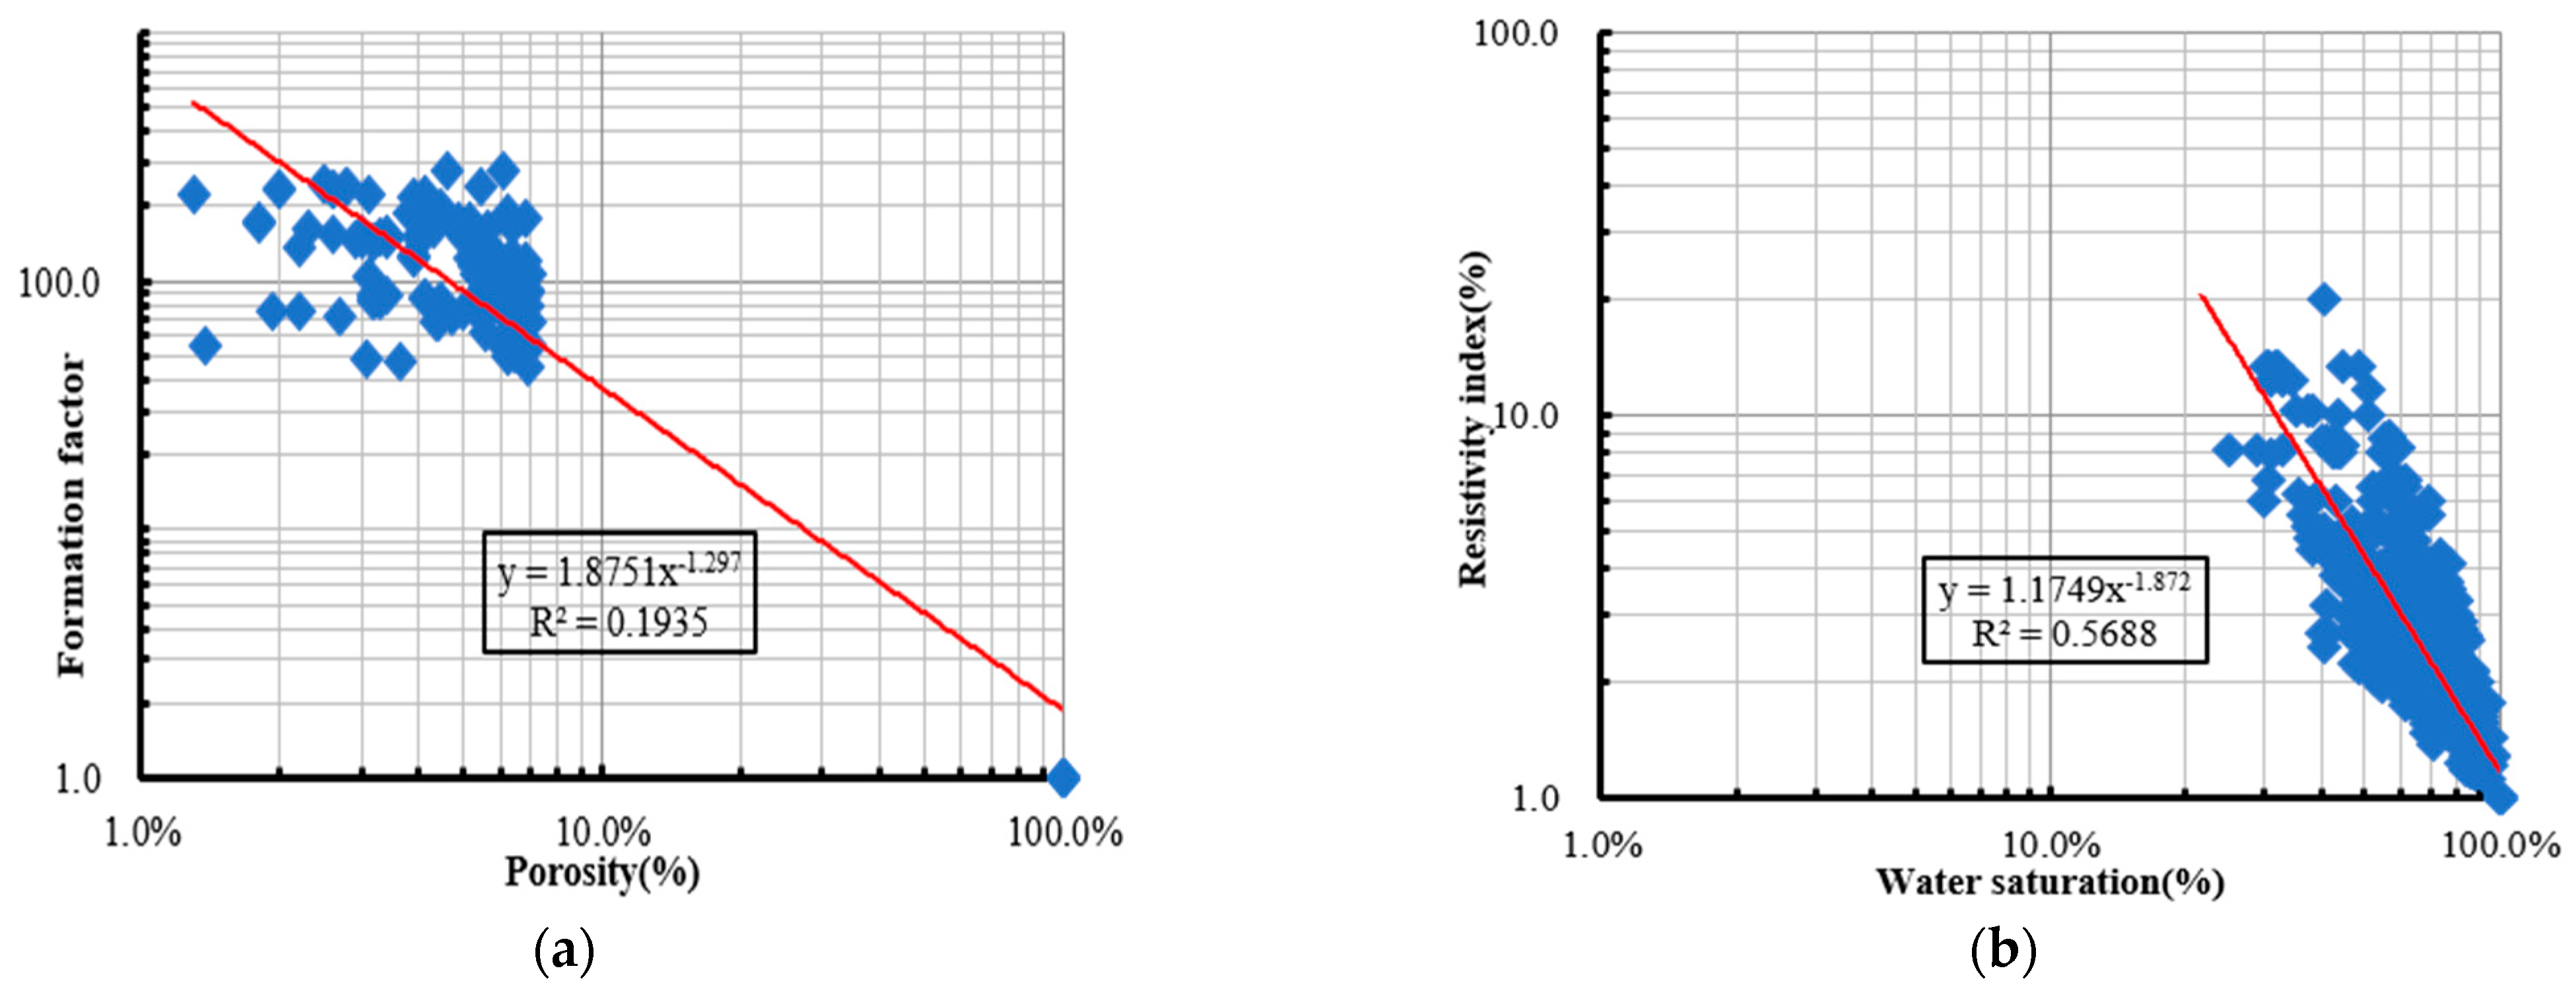
2.3. Electrical Characteristics

Oil-bearing reservoirs in tight sandstones are characterized by low natural gamma, negative anomalies in natural potential, and high resistivity, and the resistivity of oil-bearing systems is generally greater than 20 Ω·m [23,24]. The layers with high shale content are all characterized by high natural gamma, small natural potential amplitude differences, relatively low resistivity, and high acoustic time difference values. As a whole, the resistivity of the tight sandstone reservoirs, on the other hand, is relatively high, ranging from 20 Ω·m to 50 Ω·m (Figure 7).

2.4. Oil-Bearing Characteristics

The oil-bearing grades of tight sandstone reservoirs mainly have three grades: oil stains, oil traces and fluorescence, with oil stains accounting for 14.76%, oil traces accounting for 28.01% and fluorescence accounting for 26.36%. According to the statistics, the logging level of oil-producing reservoirs is generally above the oil trace, and the logging level above the oil trace accounts for 42.77% of the total number of wells (Figure 8a). The oil saturation is the calculated value from the logging, the distribution ranges from 2.52% to 40.81% and the average value is 20.81% (Figure 8b). From the distribution histogram, it can be seen that the distribution of oil saturation is mainly concentrated between 10% and 30%, accounting for 82.39% of the total number of samples, indicating that the tight sandstone reservoirs of the lower assemblage are not full of oil [25,26]. Higher resistivity values do not reflect the oil content but are more influenced by the rock skeleton. When calculating oil saturation in tight sandstone reservoirs, the original Archie model needs to be improved or a new oil saturation interpretation model needs to be established.

3. Research on Evaluation Methods of Logging Interpretation

For fluid identification of tight sandstone reservoirs, it is necessary to first select the logging parameters of special areas in the reservoir and take this parameter as a standard [27]. Subsequently, by highlighting specific parameters in distinct areas, the reservoir characteristics become discernible and the influence of extraneous elements such as the rock skeleton can be minimized [28,29]. This approach facilitates rapid and accurate identification of fluid properties in tight sandstone reservoirs. In addition, variations in pore structure, which affect the oil content and oil-bearing properties in tight sandstone reservoirs, also affect the fluid response characteristics to some extent [30]. According to the actual situation of tight sandstone reservoirs, the reservoir itself has a variety of characteristics, and using only a single parameter or a certain logging method will make it difficult to identify the fluid properties of tight sandstone reservoirs [31]. Based on this, when analyzing the fluid parameters in the reservoir, it is necessary to combine various factors in the reservoir with a comprehensive analysis; this optimization process allows refinement of the reservoir geological characteristics [32]. In the case of tight sandstones, there are numerous factors that affect the identification of the reservoir fluid, including shale content, porosity, permeability, and water saturation. The establishment of a logging interpretation model is especially important in the Lower Assemblage reservoir of the Ordos Basin, which is tight and whose fluid distribution is complicated [33,34].

3.1. Calculation of Shale Content

Usually, the interpretation of shale content in sandstone reservoirs is sought by GR and SP. However, the lithology of the tight sandstone reservoir is dominated by fine sandstone with small mean grain size and strong adsorption, which adsorbs certain radioactive materials, so the GR logging value is high [35]. In contrast, the shale content interpreted in terms of GR and SP is on the high side due to the poor physical properties of the tight sandstone reservoir and the reduced SP amplitude difference. To eliminate the influence of non-formation factors on the shale content evaluation, all logging curves are analyzed for shale content reflection in the reservoir and the logging principles are analyzed [36]. The acoustic propagation in the tight sandstone layer is affected by the lithology and the contact mode of the rock particles, the propagation mode is nonlinear, the acoustic time difference value decreases and the calculated shale content is small. Therefore, in order to reduce the error of the logging curve in calculating the shale content of tight sandstone reservoirs, a compensating acoustic curve is introduced to weight the shale index calculated by GR and AC (or SP and AC) to explain the shale content of tight sandstone reservoirs [37].
Δ GR = GR GR min GR max GR min
ΔGR: natural gamma calculated shale index; GR: natural gamma logging value, API; GRmin: gamma value for pure sandstone, API; GRmax: gamma value for pure mudstone, API.
Δ AC = AC AC min AC max AC min
ΔAC: compensated acoustic calculation of shale index; AC: compensated acoustic logging values, μs/m; ACmin: compensated acoustic value for pure sandstone, μs/m; ACmax: compensated acoustic value for pure mudstone, μs/m.
Δ SP = 1 Δ SP m Δ SP sa
Δ S P m = S P m - S P s h
Δ S P s a = S P s a - S P s h
ΔSP: natural potential calculated shale index; SPm: measured actual natural potential of sandstone, mV; SPsh: measured natural potential of mudstone, mV; SPsa: natural potential value of water-bearing pure sandstone, mV.
S H = ( 1 K ) × Δ G R + K × Δ A C
S H = ( 1 K ) × Δ S P + K × Δ A C
V s h = 2 G C U R × S H - 1 2 G C U R - 1
SH: shale index, radix; K: weighting factor; GCUR: the lithology coefficient, for older formations is 2 and for newer formations is 3.7.

3.2. Calculation of Porosity

For the interpretation of porosity, the Wiley model derived from the time-averaged formula is generally used, but tight sandstone reservoirs, with complex pore structures and nonlinear propagation of acoustic waves in the formation, have higher error in the porosity calculated by the Wiley model based on the time-averaged formula [38]. In 1986, three Raymer–Hunt–Gardner logging analysts of the French TOTAL Petroleum Company, after a thorough study of the work of their predecessors, took into account the influence of pore structure on acoustic wave propagation and proposed the formula of the acoustic formation factor, which is found to be modeled by Raymer–Hunt–Gardner through a comparative analysis [39,40]. The accuracy of porosity interpretation in tight sandstone reservoirs is significantly superior to that of the Wylie model. Therefore, the Raymer–Hunt–Gardner model is selected for porosity calculation in tight sandstone reservoirs:
Δ A C C C = Δ A C - V s h × ( Δ A C s h - Δ A C m a )
C = Δ A C m a ( 2 × Δ A C f )
Φ e = 1 C C 2 Δ A C m a Δ A C f + Δ A C m a Δ A C C C
ΔACcc: corrected acoustic time difference value, μs/m; C is a constant and is the reciprocal of the coefficient of skeletal lithology; ΔACsh: mudstone acoustic time difference, μs/m; ΔACma: rock skeleton acoustic time difference, μs/m; ΔACf: pore fluid acoustic time difference, μs/m; Φe: effective porosity of rock, f.

3.3. Calculation of Permeability

Permeability determines the capacity of the reservoir and is a very important parameter in logging evaluation, but it is also the most difficult geological parameter to calculate accurately [41]. At present, the logging calculation of permeability generally adopts the empirical formula proposed by Timur, and in different blocks, the corresponding coefficients and indices of the empirical formula are determined [42,43]. In tight sandstone reservoirs, the correlation between permeability and porosity may decrease, but, overall, it remains positively correlated with porosity and negatively correlated with bound water saturation. The empirical formula for permeability calculation is still followed here, using the porosity of the tight sandstone in the lower assemblage of the study area. Permeability and bound water saturation data and the coefficients and exponents of the empirical formula are determined by the fitting method, and bound water saturation can be derived from conventional logging curves.
K = 0.126 × Φ 0.08 S w i 1.11
K: permeability, 10−3 μm2; Φ: porosity, f; Swi: bound water saturation, f.

3.4. Calculation of Oil Saturation

Oil saturation is the core of logging interpretation, and the commonly used oil saturation formula is Archie’s formula and its improved type [44]. To improve the accuracy of saturation interpretation, it is necessary to have accurate cementation index m, saturation index n, and saturation constants a and b. According to the petrographic experimental data, the appropriate way to correct the petrographic parameters in Archie’s formula was elucidated, which can better control the accuracy of saturation calculation [45]. Through the analysis of the porosity–formation factor cross plot, it is found that all the data become two trends with a porosity of 7.1% as the demarcation; thus, here, according to the size of porosity, the rock electrical data are categorized, and the values of a, b, m and n are obtained, respectively, in order to improve the interpretation accuracy of oil saturation in tight sandstone reservoirs.
S w = a × b × R w Φ × R t m n
S o = 1 - S w
Sw: water saturation, f; So: oil saturation, f; a, b: lithological constants, dimensionless; m: lithological index, dimensionless; n: saturation index, dimensionless; Rw: formation water resistivity, Ω·m; Rt: formation true resistivity, Ω·m; Φ: porosity, f.

3.4.1. Porosity Classification Method for Calculating Oil Saturation

Firstly, the sandstone samples of the lower assemblage are selected, the resistivity value of the rock samples is measured, combined with the formation water resistivity Rw, the formation factor F is found, and the m-value and a-value are obtained using regression analysis; the centrifugal method is used to measure the saturation and resistivity under different centrifugal speeds, and the power function relationship is established by the cross plot of the resistivity coefficients with the water-bearing saturation degree, so that the n-value and b-value can be determined.
Based on the porosity–formation factor cross plot, the data are categorized according to the porosity of 7.1%. When the porosity Φ ≥ 7.1%, the corresponding rock electrical parameters a = 1.320, b = 1.0705, m = 1.736, n = 1.629 are calculated based on the relationship between porosity and formation factors and the relationship between water saturation and the resistivity index (Figure 9).
When the porosity Φ < 7.1%, the rock electrical parameters a = 1.8751, b = 1.1749, m = 1.297, n = 1.872 are determined in the same way (Figure 10).

3.4.2. Calculation of Oil Saturation by Acoustic Time Difference Logging

When the interplay between the “four properties” of the reservoir is examined, it becomes clear that in tight sandstone reservoirs, resistivity does not accurately reflect the oil-bearing nature of the reservoir. Consequently, using the resistivity curve to calculate reservoir oil saturation results in significant errors [46]. The logging curve is a comprehensive reflection of formation information, and the acoustic time-difference logging curve value contains formation skeleton information and porosity information, which in turn contains water-bearing porosity and oil-bearing porosity, and according to the definition of oil-bearing saturation, the ratio of oil-bearing porosity to total porosity is oil-bearing saturation [47]. Therefore, it is possible to build a volumetric model from the logging principle of compensated acoustic waves, convert it into a mathematical model, remove invalid information, extract the required information, and build a calculation model for oil bearing saturation (Figure 11).
The acoustic logging volume model is converted into an equivalent model to establish the relationship between each parameter, and the mathematical relationship equation between porosity and acoustic time difference is as follows:
A C = A C m a × ( 1 Φ w Φ o ) + A C o × Φ o + A C w × Φ w
It is known from the definition of porosity that the total porosity is the sum of oil-bearing porosity and water-bearing porosity of the formation; therefore:
Φ = Φ o + Φ w
This is then finalized according to the definition of oil-bearing saturation:
S o = ( A C A C m a ) ( A C o A C w ) × Φ ( A C w A C m a ) ( A C o A C w )
AC: acoustic time difference logging value, μs/m; ACw: sonic value of formation water at formation condition, μs/m; ACo: acoustic wave value of crude oil under formation conditions, μs/m; ACma: acoustic value of sandstone skeleton, μs/m; Φw: water-bearing porosity, f; Φo: oil bearing porosity, f; Φ: total porosity of formation, f.

4. Fluid Property Identification

Reservoir lithology, physical properties and oil-bearing aspects are inherently interrelated and mutually constraining. The logging curve serves as a comprehensive representation of the lithological, physical, and petrophysical properties. In tight sandstone reservoirs, the proportion of fluid in the logging response is reduced, making it difficult for the resistivity curve, which is optimal for reflecting fluid properties, to comprehensively and accurately represent the oil-bearing situation of the formation [48].
The cross-plot method is to select the pairs of logging parameters and draw a cross plot to classify the fluid properties. As mentioned above, the logging parameters such as GR, RT and AC can distinguish oil and water layers and can be used to construct a cross plot to semi-quantitatively identify the fluid properties of the lower assemblage tight reservoir, targeting the geological and logging characteristics of tight sandstone reservoirs, focusing on extracting oil-bearing information from logging signals, synthesizing and enhancing useful information, and eliminating factors that affect the identification of oil-bearing properties. The reservoir fluid properties are progressively recognized through four steps. Using the oil test data of the study area (Table 2), combined with the GR, AC, and RILD values of the test oil test formation, AC/GR-RILD, AC-RILD, GR-AC*RILD/100, and AC-GR*RILD/100 cross plots are made, respectively (Figure 12). The above steps lead to the final identification of fluid properties.
In the first step, the AC/GR-RILD cross plot is generated, and if AC/GR < 2.54, the formation is dry, the dry layer of the tight sandstone reservoir is effectively identified, and the identified dry layer(D) data are removed.
In the second step, the remaining data are used to produce AC-RILD cross plot; if RILD ≥ 58 Ω·m, the formation is an oil–water layer (O/W), the fluid properties of some layers can be identified, and the identified oil–water layer data are removed.
In the third step, the remaining data are used to generate the GR-AC*RILD/100 cross plot; if AC*RILD/100 > 2.6*GR-91.31, the reservoir is an oil–water layer, and the reservoir data with identified fluid properties are removed again.
In the fourth step, the AC-GR*RILD/100 cross plot is made with the remaining data; if GR*RILD/100 ≥ 110.5–0.41*AC, the reservoir is an oil–water layer, and the remaining reservoirs are water layers (W) and water with an oil layer (WWO).
The oil–water layer identification template established in four steps is used to finalize a linear discrimination criterion for oil–water layers:
When AC/GR < 2.54, the reservoir is a dry layer.
Condition 1: RILD ≥ 58 Ω·m;
Condition 2: AC*RILD/100 ≥ 2.6*GR-91.31;
Condition 3: GR*RILD/100 ≥ 110.5–0.41*GR.
If any one of conditions 1–3 is satisfied, the reservoir is an oil–water layer; otherwise, the reservoir is a water layer.
According to the statistical statistics, it is concluded that the accuracy of the fluid property identification template or linear discriminating criterion established by the four-step method to discriminate the fluid properties of tight sandstone is over 93.29%.

5. Examples of Logging Interpretation Model Applications

Using the newly constructed lithology, porosity, permeability and saturation interpretation model and interpretation standard, 20 wells in the study area are secondarily interpreted, and the interpretation error of each parameter is less than 5%, with 95.23% agreement between the interpretation conclusion and the oil test conclusion (Table 3).
Figure 13 shows a graph of the interpreted results for the L110 well. The interpreted porosity, permeability and oil-bearing saturation are close to the core analysis values. The logging depth is 1672–1680 m. The natural potential and natural gamma curve characteristics are consistent with the lithological characteristics of the sandy mudstone profile and the RLL8, RILM and RILD logging curve characteristics are consistent with the oil and water formations identified by the logging interpretation. Resistivity averages 32.7 Ω·m, porosity averages 9.96 PU, permeability is 0.87 × 10⁻³ µm2 and oil saturation is 51.3%. It can be seen from the shot hole layer that after the layer was put into production, the initial production of liquid was 8.33 m3, oil production was 2.70 t, and water bearing was 67.59%, which is an oil and water layer, which is consistent with the interpretation results.

6. Conclusions

(1)
The investigation of the evaluation method for tight sandstone reservoirs in the lower assemblage of the south-central Ordos involves the exploration of the interrelationships among the “four properties”. Based on this research, specialized models focusing on parameters such as the shale content, porosity, permeability, and saturation degree of tight sandstone reservoirs are developed or selected. These models demonstrate effective applicability to tight sandstones.
(2)
For the problem of high shale content in tight sandstone reservoirs, GR and AC (SP and AC) are used to calculate the shale index, and the weighting method is effective.
(3)
The established porosity classification method and acoustic time difference method for calculating oil saturation in tight sandstone reservoirs overcame the difficulty of resistivity reflecting the weakening of oil bearing and improved the accuracy of interpretation of oil saturation in reservoirs.
(4)
The multi-information four-step method gradually recognizes the fluid characteristics of tight sandstone reservoirs and improves the compliance rate of log interpretation, which is applied to 20 wells in the block with a compliance rate of 95.23%, and lays the foundation for accurately establishing the interpretation standard of tight sandstone. This method is not only important for the development of tight sandstone reservoirs in the lower assemblage of the Ordos Basin but also for the identification of fluid properties of tight sandstone reservoirs in other blocks.

Author Contributions

Writing—original draft: B.X.; writing—review and editing: Z.W. and T.W.; methodology: B.X. and T.S.; validation: S.Z. and J.P.; formal analysis: T.S. and Y.C. All authors have read and agreed to the published version of the manuscript.

Funding

This research received no external funding.

Data Availability Statement

We state that the data are unavailable due to privacy or ethical restrictions of the company and university.

Conflicts of Interest

Authors Zhenhua Wang, Shuxia Zhang were employed by the company Research Institute of Shannxi Yanchang Petroleum (Group) Co., Ltd. Author Ting Song was employed by the Changqing Oilfield Company. The remaining authors declare that the research was conducted in the absence of any commercial or financial relationships that could be construed as a potential conflict of interest.

References

  1. Zhou, L.H.; Chen, C.W.; Han, G.M.; Yang, F. Difference characteristics between continental shale and tight oil and exploration practice: A case from Huanghua Depression, Bohai Bay Basin. Earth Sci. 2021, 46, 555–571. [Google Scholar]
  2. Huang, W.; Zhang, X.L.; Zhao, J.Y. Fluild Identification of Tight Reservoir in Chang 9 Formation, Ordos Basin. J. Northwest Univ. 2015, 45, 811–818. [Google Scholar]
  3. Wen, B.; Zhou, Y. Study on fluid identification of low porosity and low permeability reservoir. Petrochem. Ind. Technol. 2017, 24, 126. [Google Scholar]
  4. Albrecht, D.; Reitenbach, V. Laboratory measurements of fluid transport properties on tight gas sandstones and applications. Energy Procedia 2014, 59, 366–373. [Google Scholar] [CrossRef]
  5. Bi, M.W.; Chen, S.Y.; Zhou, Z.H. Genesis of secondary pores of tight sandstone reservoir in He 8th Member in Su 6 area of Sulige gas field. J. China Univ. Petrol. 2015, 39, 8–16. [Google Scholar]
  6. Guo, J.; Ling, Z.; Xu, X.; Zhao, Y.; Yang, C.; Wei, B.; Zhang, Z.; Zhang, C.; Tang, X.; Chen, T.; et al. Saturation Determination and Fluid Identification in Carbonate Rocks Based on Well Logging Data: A Middle Eastern Case Study. Processes 2023, 11, 1282. [Google Scholar] [CrossRef]
  7. Bi, L.R.; Mao, Z.Q.; Xiao, C.W.; Liu, X.L. Application of normal distribution method in identifying oil (gas) and water zones. J. Oil Gas Technol. 2006, 28, 76–78. [Google Scholar]
  8. Cheng, X.Z.; Zhou, C.C.; Fan, Y.R.; Wang, Z.H.; Huang, S.X. Genesis and identification of low contrast pay zones in fresh-water reservoirs. J. Oil Gas Technol. 2007, 29, 62–68. [Google Scholar]
  9. Li, L.; Yuan, Z.; Hui, K.; Liu, S. Accumulation regularity of Upper Paleozoic gas in north Ordos Basin. Oil Gas Geol. 2000, 21, 268–271. [Google Scholar]
  10. He, X.; Chen, S.; Hu, C.; Zhang, H.; Mou, F.; Dai, L.; Lu, Y.; Fu, X.; Han, M. Pore Structure Change in the Continental Shale Oil Reservoir and Its Main Influencing Factors: A Case Study of the Chang 7 Member in the Ordos Basin. Processes 2023, 11, 2314. [Google Scholar] [CrossRef]
  11. Zhu, H.; Chen, K.; Liu, K.; He, S. A sequence stratigraphic model for reservoir sand-body distribution in the Lower Permian Shanxi Formation in the Ordos Basin, northern China. Mar. Pet. Geol. 2008, 25, 731–743. [Google Scholar] [CrossRef]
  12. Chen, Z.; Li, X.; Chen, H.; Duan, Z.; Qiu, Z.; Zhou, X.; Hou, Y. The Characteristics of Lithofacies and Depositional Model of Fine-Grained Sedimentary Rocks in the Ordos Basin, China. Energies 2023, 16, 2390. [Google Scholar] [CrossRef]
  13. Zheng, W.; Hu, X.; Chen, S.; Liu, J.; Jia, C. Characteristics of sedimentary evolution in the Upper Paleozoic Daniudi Gasfield, Ordos Basin. Acta Sedimentol. Sin. 2015, 33, 306–313. [Google Scholar]
  14. Mao, K.Y. Logs fluid typing methods and adaptive analysis of tight sandstone reservoir of Yingcheng formation in Lishu Fault. Adv. Earth Sci. 2016, 31, 1056–1066. [Google Scholar]
  15. Jamil, M.; Siddiqui, N.A.; Rahman, A.H.B.A.; Ibrahim, N.A.; Ismail, M.S.B.; Ahmed, N.; Usman, M.; Gul, Z.; Imran, Q.S. Facies Heterogeneity and Lobe Facies Multiscale Analysis of Deep-Marine Sand-Shale Complexity in the West Crocker Formation of Sabah Basin, NW Borneo. Appl. Sci. 2021, 11, 5513. [Google Scholar] [CrossRef]
  16. Jamil, M.; Siddiqui, N.A.; Usman, M.; Wahid, A.; Umar, M.; Ahmed, N.; Haq, I.U.; El-Ghali, M.A.K.; Imran, Q.S.; Rahman, A.H.A.; et al. Facies analysis and distribution of Late Palaeogene deep-water massive sandstones in submarine-fan lobes, NW Borneo. Geol. J. 2022, 57, 4489–4507. [Google Scholar] [CrossRef]
  17. Sun, J.M.; Wei, X.H.; Chen, X.L. Fluid identification in tight sandstone reservoirs based on a new rock physics model. J. Geophys. Eng. 2016, 13, 526–535. [Google Scholar] [CrossRef]
  18. Wang, F.; Yang, X.M.; Zhang, Y.H.; Bian, H.Y. Application of multi-algorithmic fusion methods to fluid identity in tight reservoir. Prog. Geophys. 2015, 30, 2785–2792. [Google Scholar]
  19. He, M.; Gu, H.M.; Wan, H. Log interpretation for lithology and fluid identification using deep neural network combined with MAHAKIL in a tight sandstone reservoir. J. Pet. Sci. Eng. 2020, 194, 107498. [Google Scholar] [CrossRef]
  20. Li, H.; Tang, H.M.; Qin, Q.R.; Zhou, J.L.; Qin, Z.J.; Fan, C.H.; Su, P.; Wang, Q.; Zhong, C. Characteristics, formation periods and genetic mechanisms of tectonic fractures in the tight gas sandstones reservoir: A case study of xujiahe formation in YB area, sichuan basin, China. J. Pet. Sci. Eng. 2019, 178, 723–735. [Google Scholar] [CrossRef]
  21. Li, B.; Tan, M.J.; Zhang, H.T. Interpretation method of nuclear magnetic resonance dual-TW logging in oil-wet tight sandstone reservoirs. Appl. Geophys. 2020, 5, 796–808. [Google Scholar] [CrossRef]
  22. Chen, J.; Xie, R.C.; Liu, C.C.; Duan, Y.; Li, H.; Xiang, Y. Logging fluid identification and quantitative evaluation of Jurassic tight sandstone gas reservoir in Zhongjiang gas field. Nat. Gas Ind. 2019, 39, 136–141. [Google Scholar]
  23. Fu, L.; Qin, Z.; Xie, A.; Chen, L.; Li, J.; Wang, N.; Qin, Q.; Mao, K. The relation of the “four properties” and fluid identification of the carboniferous weathering crust volcanic reservoir in the Shixi Oilfield, Junggar Basin, China. Front. Earth Sci. 2022, 10, 983572. [Google Scholar] [CrossRef]
  24. Zou, C.; Zhu, R.; Wu, S.; Yang, Z.; Tao, S.; Yuan, X. Types, characteristics, genesis and prospects of conventional and unconventional hydrocarbon accumulations: Taking tight oil and tight gas in China as an instance. Acta Pet. Sin. 2012, 33, 173–187. [Google Scholar]
  25. Dai, J.; Ni, Y.; Wu, X. Tight gas in China and its significance in exploration and exploitation. Pet. Explor. Dev. 2012, 39, 277–284. [Google Scholar] [CrossRef]
  26. Guo, X.; Liu, K.; Jia, C.; Song, Y.; Zhao, M.; Zhuo, Q.; Lu, X. Hydrocarbon accumulation processes in the Dabei tight-gas reservoirs, Kuqa Subbasin, Tarim Basin, northwest China. AAPG Bull. 2016, 100, 1501–1521. [Google Scholar] [CrossRef]
  27. Wu, H.; Zhao, J.; Wu, W.; Li, J.; Huang, Y.; Chen, M. Formation and diagenetic characteristics of tight sandstones in closed to semi-closed systems: Typical example from the Permian Sulige gas field. J. Pet. Sci. Eng. 2020, 199, 108248. [Google Scholar] [CrossRef]
  28. Shaogui, D.; Yiren, F.; Guoxin, L. Influence of formation water salinity on physical properties of argillaceous sandstone. Well Logging Technol. 2006, 30, 113–115. [Google Scholar]
  29. Haiyong, M.; Lifa, Z.; Xiuqin, D. Hydrochemical characteristics and geological significance of the Chang 8 formation of the Yanchang Formation in Jiyuan area, Ordos Basin. J. Northwest Univ. 2013, 43, 253–257. [Google Scholar]
  30. Fan, R.; Zhou, L.; Wu, J.; Zeng, T.; Zhou, X.F. Research on tight sandstone reservoir fluids identification in Xujiahe formation, northeastern Sichuan Basin. Petrol. Geol. Recov. Effic. 2015, 22, 67–71. [Google Scholar]
  31. Mode, A.W.; Anyiam, O.A.; Aghara, I.K. Identification and petrophysical evaluation of thinly bedded low-resistivity pay reservoir in the Niger Delta. Arab. J. Geosci. 2014, 8, 2217–2225. [Google Scholar] [CrossRef]
  32. Xu, Z.; Jiang, S.; Liu, L.; Wu, K.; Li, R.; Liu, Z.; Shao, M.; Jia, K.; Feng, Y. Natural gas accumulation processes of tight sandstone reservoirs in deep formations of Songliao Basin, NE China. J. Nat. Gas Sci. Eng. 2020, 83, 103610. [Google Scholar] [CrossRef]
  33. Wang, Q.; Chen, D.; Wang, F.; Gao, X.; Zou, Y.; Tian, Z.; Li, S.; Chang, S.; Yao, D. Origin and distribution of an under-pressured tight sandstone reservoir: The Shaximiao Formation, Central Sichuan Basin. Mar. Petrol. Geol. 2021, 132, 121–128. [Google Scholar] [CrossRef]
  34. Zhou, X.; Xu, G.; Cui, H.; Zhang, W. Fracture development and hydrocarbon accumulation in tight sandstone reservoirs of the Paleogene Huagang Formation in the central reversal tectonic belt of the Xihu Sag, East China Sea. Pet. Explor. Dev. 2020, 47, 499–512. [Google Scholar] [CrossRef]
  35. Jia, J.; Yin, W.; Qiu, N.; Wang, G.; Ma, L.; Liu, Y.; Liu, N. Migration and accumulation of crude oil in Upper Triassic tight sand reservoirs on the southwest margin of Ordos Basin, Central China: A case study of the Honghe Oilfield. Geol. J. 2017, 53, 2280–2300. [Google Scholar] [CrossRef]
  36. Yang, H.; Fu, J.; Wei, X.; Liu, X. Sulige field in the Ordos Basin: Geological setting, field discovery and tight gas reservoirs. Mar. Pet. Geol. 2008, 25, 387–400. [Google Scholar] [CrossRef]
  37. He, Y.H.; Yang, X.; Wang, X.J.; Zhong, Z.Q.; Hou, D.J. Fluid identification in low permeability reservoir in Jiyuan area, Ordos Basin. China Petrol. Explor. 2016, 21, 110–115. [Google Scholar]
  38. Wyllie, M.R.J.; Gregory, A.R.; Gardner, L.W. Elastic wave velocities in heterogeneous and porous media. Geo-Physics 1956, 21, 41–70. [Google Scholar] [CrossRef]
  39. Raymer, L.L.; Hunt, E.R.; Gardner, J.S. An improved sonic transit time-to-porosity transform. In Proceedings of the SPWLA 21st Annual Logging Symposium, Lafayette, LA, USA, 8 July 1980; SPWLA-1980-P. OnePetro: Richardson, TA, USA, 1980. [Google Scholar]
  40. Martin, J.P.; Nicoletis, S.; Raiga-Clemenceau, J. The concept of acoustic formation factor for more accurateporosity determination from sonic transit time data. Log Anal. 1988, 29, SPWIA-1988-v29n1a4. [Google Scholar]
  41. Gao, J.; Ma, B.; Lu, Y.; Zhang, W.; Cao, Q. Origin of authigenic kaolinite with implications for Permian tight gas sandstone reservoirs in the northern Ordos Basin, central China. J. Nat. Gas Sci. Eng. 2022, 99, 104429. [Google Scholar] [CrossRef]
  42. Wang, G.; Chang, X.; Yin, W.; Li, Y.; Song, T. Impact of diagenesis on reservoir quality and heterogeneity of the Upper Triassic Chang 8 tight oil sandstones in the Zhenjing area, Ordos Basin, China. Mar. Pet. Geol. 2017, 83, 84–96. [Google Scholar] [CrossRef]
  43. Zhao, G.P. Characterization of fluid inclusions and timing of gas accumulation in Upper Paleozoic reservoirs of Hangjinqi area, Ordos Basin. Oil Gas Geol. 2017, 38, 905–912. [Google Scholar]
  44. Archie, G.E. The electrical resistivity log as an aid in determining some reservoir characteristics. Trans. Am. 1942, 146, 41–56. [Google Scholar] [CrossRef]
  45. Liu, Y.; Ye, J.; Zong, J.; Wang, D.; Cao, Q.; Yang, B.; Li, W.; Zhao, J. Analysis of forces during tight oil charging and implications for the oiliness of the tight reservoir: A case study of the third member of the Palaeogene Shahejie Formation, Qibei slope, Qikou sag. Mar. Pet. Geol. 2022, 144, 105819. [Google Scholar] [CrossRef]
  46. He, Y.; Guo, H.; Lan, H.; Ling, C.; Fu, M. The Effect of Single Sandstone Stacking Pattern on the Sandstone Reservoir Physical Properties—A Case Study from the Shanxi Formation in the Daniudi Area, Northeastern Ordos Basin. Energies 2022, 15, 4740. [Google Scholar] [CrossRef]
  47. Zhao, G.; Li, X.; Liu, M.; Dong, C.; Chen, D.; Zhang, J. Reservoir Characteristics of Tight Sandstone and Sweet Spot Prediction of Dibei Gas Field in Eastern Kuqa Depression, Northwest China. Energies 2022, 15, 3135. [Google Scholar] [CrossRef]
  48. Wang, R.; Sun, W. A Study on Micro Cracks in Super Low Permeability Sandstone Reservoir of the Upper Triassic Yanchang Formation in the Ordos Basin. Geol. Rev. 2009, 55, 444–448. [Google Scholar]
Figure 1. Highly generalized tectonic map of the Ordos Basin study area.
Processes 12 00278 g001
Figure 2. Photographs of tight sandstones of the lower assemblage of the Yanchang Formation. (a) Coring well L96, depth 1635 m, convolute bedding. (b) Coring well L108, depth 1508 m, convolute bedding.
Processes 12 00278 g002
Figure 3. Pore characteristics of the lower assemblage tight sandstone of the Yanchang Formation. (a) Core electron microscope picture. (b) Picture of a thin section of a core cast.
Processes 12 00278 g003
Figure 4. Sandstone lithology analysis diagram. (a) Sandstone lithology statistical histogram. (b) Sandstone compositional triangulation. I—Pure quartz sandstone; II—quartz sandstone; III—secondary lithic feldspar sandstone or secondary feldspar lithic sandstone; IV—feldspar sandstone; V—lithic feldspar sandstone or feldspar lithic sandstone; VI—lithic sandstone.
Processes 12 00278 g004
Figure 5. L110 well logging composite histogram.
Processes 12 00278 g005
Figure 6. Physical characteristics distribution histogram. (a) Porosity distribution histogram. (b) Permeability distribution histogram.
Processes 12 00278 g006
Figure 7. Resistivity distribution histogram.
Processes 12 00278 g007
Figure 8. Oil-bearing characteristics distribution figure. (a) Logging grade distribution histogram. (b) Oil saturation distribution histogram.
Processes 12 00278 g008
Figure 9. The relevant parameter cross plot when the porosity ≥7.1%. (a) Porosity and formation factor cross plot. (b) Water saturation and resistivity index cross plot.
Processes 12 00278 g009
Figure 10. The relevant parameter cross plot when the porosity <7.1%. (a) Porosity and formation factor cross plot. (b) Water saturation and resistivity index cross plot.
Processes 12 00278 g010
Figure 11. Volumetric modeling for calculating oil bearing saturation.
Processes 12 00278 g011
Figure 12. Logging fluid identification cross plot. (a) AC/GR-RILD cross plot. (b) AC-RILD cross plot. (c) GR-AC*RILD/100 cross plot. (d) AC-GR*RILD/100 cross plot.
Processes 12 00278 g012
Figure 13. Comprehensive histogram of L110 logging interpretation.
Processes 12 00278 g013
Table 1. Statistical table of cast thin section identification of tight sandstones of some lower assemblage group.
Core SamplesWellDepthTerrigenous DebrisThin-Section Porosity (%)
Quartz (%)Feldspar (%)Lithic (%)
1L961634.533.0 58.08.0 4
2L1081507.331.0 57.06.0 8
3L1081513.528.0 67.05.0 3
4L711479.725.0 66.08.0 2
5L1201312.626.0 65.07.01
6L921677.728.0 67.04.0 2
7L921671.928.0 66.06.0 3
8L921751.420.0 72.08.0 1
9P1981418.121.0 67.011.0 5
10P1981531.529.0 61.010.0 4
11U113176725.0 67.07.95 3
12P2001817.427.8 63.38.89 1
13P2001820.228.6 64.86.59 2
14U1291745.725.6 64.410.0 5
15Q1832.931.4 52.316.28 2
16X1051081.327.2 64.18.7 5
17X1051193.631.5 55.413.04 7
18S10401080.228.2 64.77.06 2
19S321471.521.7 72.36.0 8
20S32155323.3 66.310.4 3
Table 2. Fluid identification data for some lower assemblage group tight sandstones.
WellGR/
API
AC/
μs/m
AC/GRRILD
/Ω·m
RILM
/Ω·m
LL8
/Ω·m
Explanation of Conclusions
L7794.45243.412.58 43.2943.4856.28O/W
L7688.81234.332.64 30.0835.4344.16O/W
L6399.32282.682.85 63.5664.96130.25O/W
L63100.19263.092.63 28.6126.5466.24O/W
L8995.2269.142.83 42.1857.61166O/W
L7878.85236.092.99 32.2932.9558.19O/W
L12850.23238.464.75 28.227.4534.1O/W
L7263.35240.663.80 30.4330.6931.74O/W
L10977.932383.05 28.0629.9835.41O/W
L13982.032452.99 35.3333.458.08O/W
L18373.64241.753.28 70.2968.7463.1O/W
L23277.76242.253.12 40.7834.4243.9O/W
L23384.02235.142.80 99.0365.62103.89WWO
L25284.78241.462.85 75.9255.2996.33WWO
L25176.412222.91 41.0249.6368.6WWO
L26173.66220.252.99 45.8953.03119.85WWO
L4682.55230.062.79 20.1322.9924.6WWO
L3767.63247.323.66 27.5330.3938.09WWO
L4381.19223.082.75 44.954.0855.15WWO
L4768.87231.653.36 21.522.7221.79WWO
L5579.76233.462.93 27.7926.9431.81W
L4183.01232.42.80 16.4419.8521.66W
L7659.38262.634.42 13.7313.7415.83W
L4081.652372.90 22.8523.4929.95W
L7587.62235.582.69 26.2630.2156.54W
L6383.44227.092.72 14.8414.4411.91W
L7498.25255.242.60 67.5860.0547.88W
L5085.44211.162.69 34.4738.3175.8D
L51108.62255.482.35 46.8659.9760.05D
P23104.9228.342.18 45.6937.386.7D
L8099231.52.34 20.9825.2632.35D
Table 3. Comparison of model interpretation results with actual interpretation findings.
WellGR/
API
AC/
μs/m
RILD
/Ω·m
POR
/%
PERM
/10−3 μm2
SW
/%
Oil Test (m3)Explanation of ConclusionsExplanatory Model
OilWaterCondition 1Condition 2Condition 3Result
L10862.29238.0922.0413.370.3658.962.0419.86O/W yesO/W
L3478.12232.5838.0310.350.5255.3212.6O/W yesO/W
L8075.29246.6158.4614.031.4730.721.831.84O/Wyes O/W
L9670.42251.8242.4115.631.9933.351.580.73O/W yes O/W
L11078.22253.5433.6415.950.9537.640.871.78O/W yesO/W
L12178.08253.0021.8915.371.6650.9630.4O/W yesO/W
L12853.95244.8332.3015.601.1939.502.75.63O/W yes O/W
L7180.61245.2536.1512.830.7845.1715O/W yesO/W
L9264.25231.1713.2711.360.1695.10//W W
L12084.34222.03116.276.738.5322.550.491.83O/Wyes O/W
P19867.30211.7430.436.340.0745.5221O/W yesO/W
P20089.89217.8719.297.070.7756.001.67O/W yesO/W
P20183.45259.1229.5616.521.2639.121.15.62O/W yesO/W
U11377.12253.0743.1415.831.7632.5658O/W yesO/W
U12782.73225.1730.367.810.2085.75031.55W yesO/W
U12962.46221.4452.309.011.0852.781.31.8O/W yes O/W
Q185.89216.1025.896.660.2860.151.42.88O/W yesO/W
X10562.22233.5044.0412.120.7442.765.99O/W yes O/W
S104085.03230.0840.229.670.4048.180.942.231O/W yesO/W
S3280.59243.5020.6913.270.3651.723.675.403O/W yesO/W
Disclaimer/Publisher’s Note: The statements, opinions and data contained in all publications are solely those of the individual author(s) and contributor(s) and not of MDPI and/or the editor(s). MDPI and/or the editor(s) disclaim responsibility for any injury to people or property resulting from any ideas, methods, instructions or products referred to in the content.

