The remanufacturing value of the failure surface is jointly affected by the return quality of the used part and the failure surface itself. In terms of parts, the length of the remaining life of the parts will directly affect the stability of the parts during the second service, and the economic benefit determines the willingness of the company. In terms of failure surface, different return quality (such as damage degree of positioning benchmark, processing area, etc.) will bring different process difficulties, energy consumption, and pollutant emission changes to the failure surface with the change of processing accuracy. These factors will also lead to different remanufacturing values of the failure surface.
2.1.1. Index Quantification
- 1.
Failure degree
The failure degree of the failure surface not only affects the formulation of the remanufacturing process scheme [
18], but also reflects the vulnerability of the failure surface when the product is in service. The higher the degree of damage, the greater is the vulnerability of the failure surface, indicating a higher conditional probability of failure under normal service conditions when subjected to initial events such as excessive operational loads, environmental factors (e.g., corrosion, temperature fluctuations), and accidental mechanical impacts. Obviously, under the same conditions, assigning a higher accuracy level to the failure surface, which is more vulnerable to damage, will cause the waste of processing resources.
To address the limitations of traditional failure degree evaluation methods, which classify failure as “high”, “medium”, or “low” and overly rely on the designer’s experience, leading to excessive subjectivity, FCE is used to quantify the failure degree of the failure surface. By refining fuzzy intervals, this approach reduces the influence of subjective judgment on the quantification results. After cleaning and testing, the damage volume of the failure surface can be obtained by the original CAD model [
19]. Then, a series of quantitative equations are then used to map the damage volume to the score interval of [0–1].
A failure quantification standard for a used gearbox was taken as an example; the failure feature of failure surface can be extracted as shown in
Table 1.
- 2.
Economic benefits
The economic benefits determine whether a company is willing to engage in the remanufacturing of used parts. The final economic benefits of used parts after remanufacturing are determined by the price of the new parts, the procurement (or sale) cost of the used parts, and the remanufacturing processing costs. Therefore, when a used part
N is determined to be remanufactured through the remanufacturability decision process [
20], the remanufacturing economic benefit of
N is shown as follows:
where
is the price of a new part for the remanufactured part
N to which the failure surface
i belongs;
and
represent the procurement (or sale) cost of used part
N and the historical average cost of used part
N when using the remanufacturing process scheme
j, respectively.
- 3.
Remaining life LiN
The remaining life of a used part is a key indicator that affects the market acceptance of the remanufactured products. The failure surface of a part with a higher remaining life also has a higher remanufacturing value. By establishing the relationship between design data and service data of the used parts, the remaining life of the used parts
N can be predicted as follows:
where
is the remaining life of the used parts;
and
are the average service life and actual service life of the used parts
N, respectively.
is a dynamic value that reflects the actual working time of the used parts in real service environment, and changes with variations in the service environment.
In this study, an artificial neural network (ANN) model is employed to predict the actual service life
due to its strong self-learning and adaptive capabilities. By using the service condition date as the input and the actual service life as the output, a mapping relationship between the service environment and service life is established to predict the actual service life of the used parts in real operating conditions. The model is shown in
Figure 3.
As shown in
Figure 3, the ANN model employs a five-layer predictive structure. Initially, the Service Condition Data (Input Layer 1) of the used parts are utilized to predict the Actual Life. Subsequently, based on the predicted Actual Life, the model incorporates the Remanufacturing Process and Failure Degree to ultimately forecast the Remaining Life. The relevant training data are derived from the enterprise history database, using a gearbox gear shaft as an example, the parameters of the input and output layers are specified as follows:
| Input Layer 1= {input power, operating speed, service time, operating temperature} |
| ↓ |
| Hidden Layer 1 |
| ↓ |
| Output Layer 1 = {Actually Life} |
| Input Layer 2 = {Actually Life, remanufacturing process, failure degree} |
| ↓ |
| Hidden Layer 2 |
| ↓ |
| Output Layer 2 = {Remaining Life} |
After obtaining the remaining service life
, the quantification of the remaining life indicator for remanufactured part
N, to which failure surface
i belongs, is shown as follows:
It is worth noting that when the remanufactured part
N has multiple failure surfaces needing tolerance design, the failure degree and remanufacturing process for each surface may differ, resulting in varying remaining life after remanufacturing. In this case, it should equal the remaining life of the failure surface with the shortest remaining life as follows:
- 4.
Process difficulty PiN and Eco-benefits ECiN
The performance of the failure surface in terms of processing difficulty, energy consumption, and pollutant emissions improves as the machining accuracy increases, but this performance varies across different failure surfaces [
21]. For example, the location of the failure surface and the degree of damage to the positioning datum affect the difficulty of positioning detection, which in turn impacts processing difficulty; The area of failure surface ultimately affects the eco-efficiency in energy consumption and pollutant by affecting the processing time when the machining accuracy is improved. Moreover, the impact of machining accuracy on the process difficulty and eco-benefits of the failure surface is also constrained by the processing capacity of the enterprises.
The influence degree of failure surface machining accuracy on process difficulty and eco-benefits can be quantitatively represented by a value between 0 and 1. A higher value indicates less added impact on process difficulty, energy consumption, and pollution emissions when improving the unit process accuracy of the failure surface, resulting in better process difficulty and eco-benefit performance. The indicator of ease of process difficulty (
PiN)and eco-benefits (
ECiN) can be expressed by the fuzzy set
[significant impact, moderate impact, minor impact, minimal impact], and its corresponding evaluation value is
. Then, the membership function between
PiN (
ECiN) and unit process accuracy improvement of the failure surface can be established, as shown in
Figure 4.
It is worth emphasizing that the fuzzy evaluation value set applies only to parts identified as suitable for remanufacturing. Following the preliminary remanufacturing feasibility assessment, the PiN and ECi values for remanufactured parts are guaranteed to fall within a reasonable range. Consequently, extreme scenarios, such as excessively high process difficulty or inadequate environmental benefits, are effectively excluded during the fuzzy evaluation process.
As shown in
Figure 4, the x-axis represents the process accuracy improvement preference of the failure surface which is quantified by experts, while the y-axis represents the membership between
PiN (
ECiN) and process accuracy improvement.
are the process accuracy improvement preferences responding to
, which means the greater the value of
the less the value of
. According to the previous quantified process accuracy improvement
and the scope of the process accuracy improvement
, the membership of process accuracy improvement
belonging to the evaluation value
can be determined as
(
i and
j are adjacent integers), so the quantified value of the indicator of process difficulty (
PiN) and eco-benefits (
ECiN) can be calculated as follows:
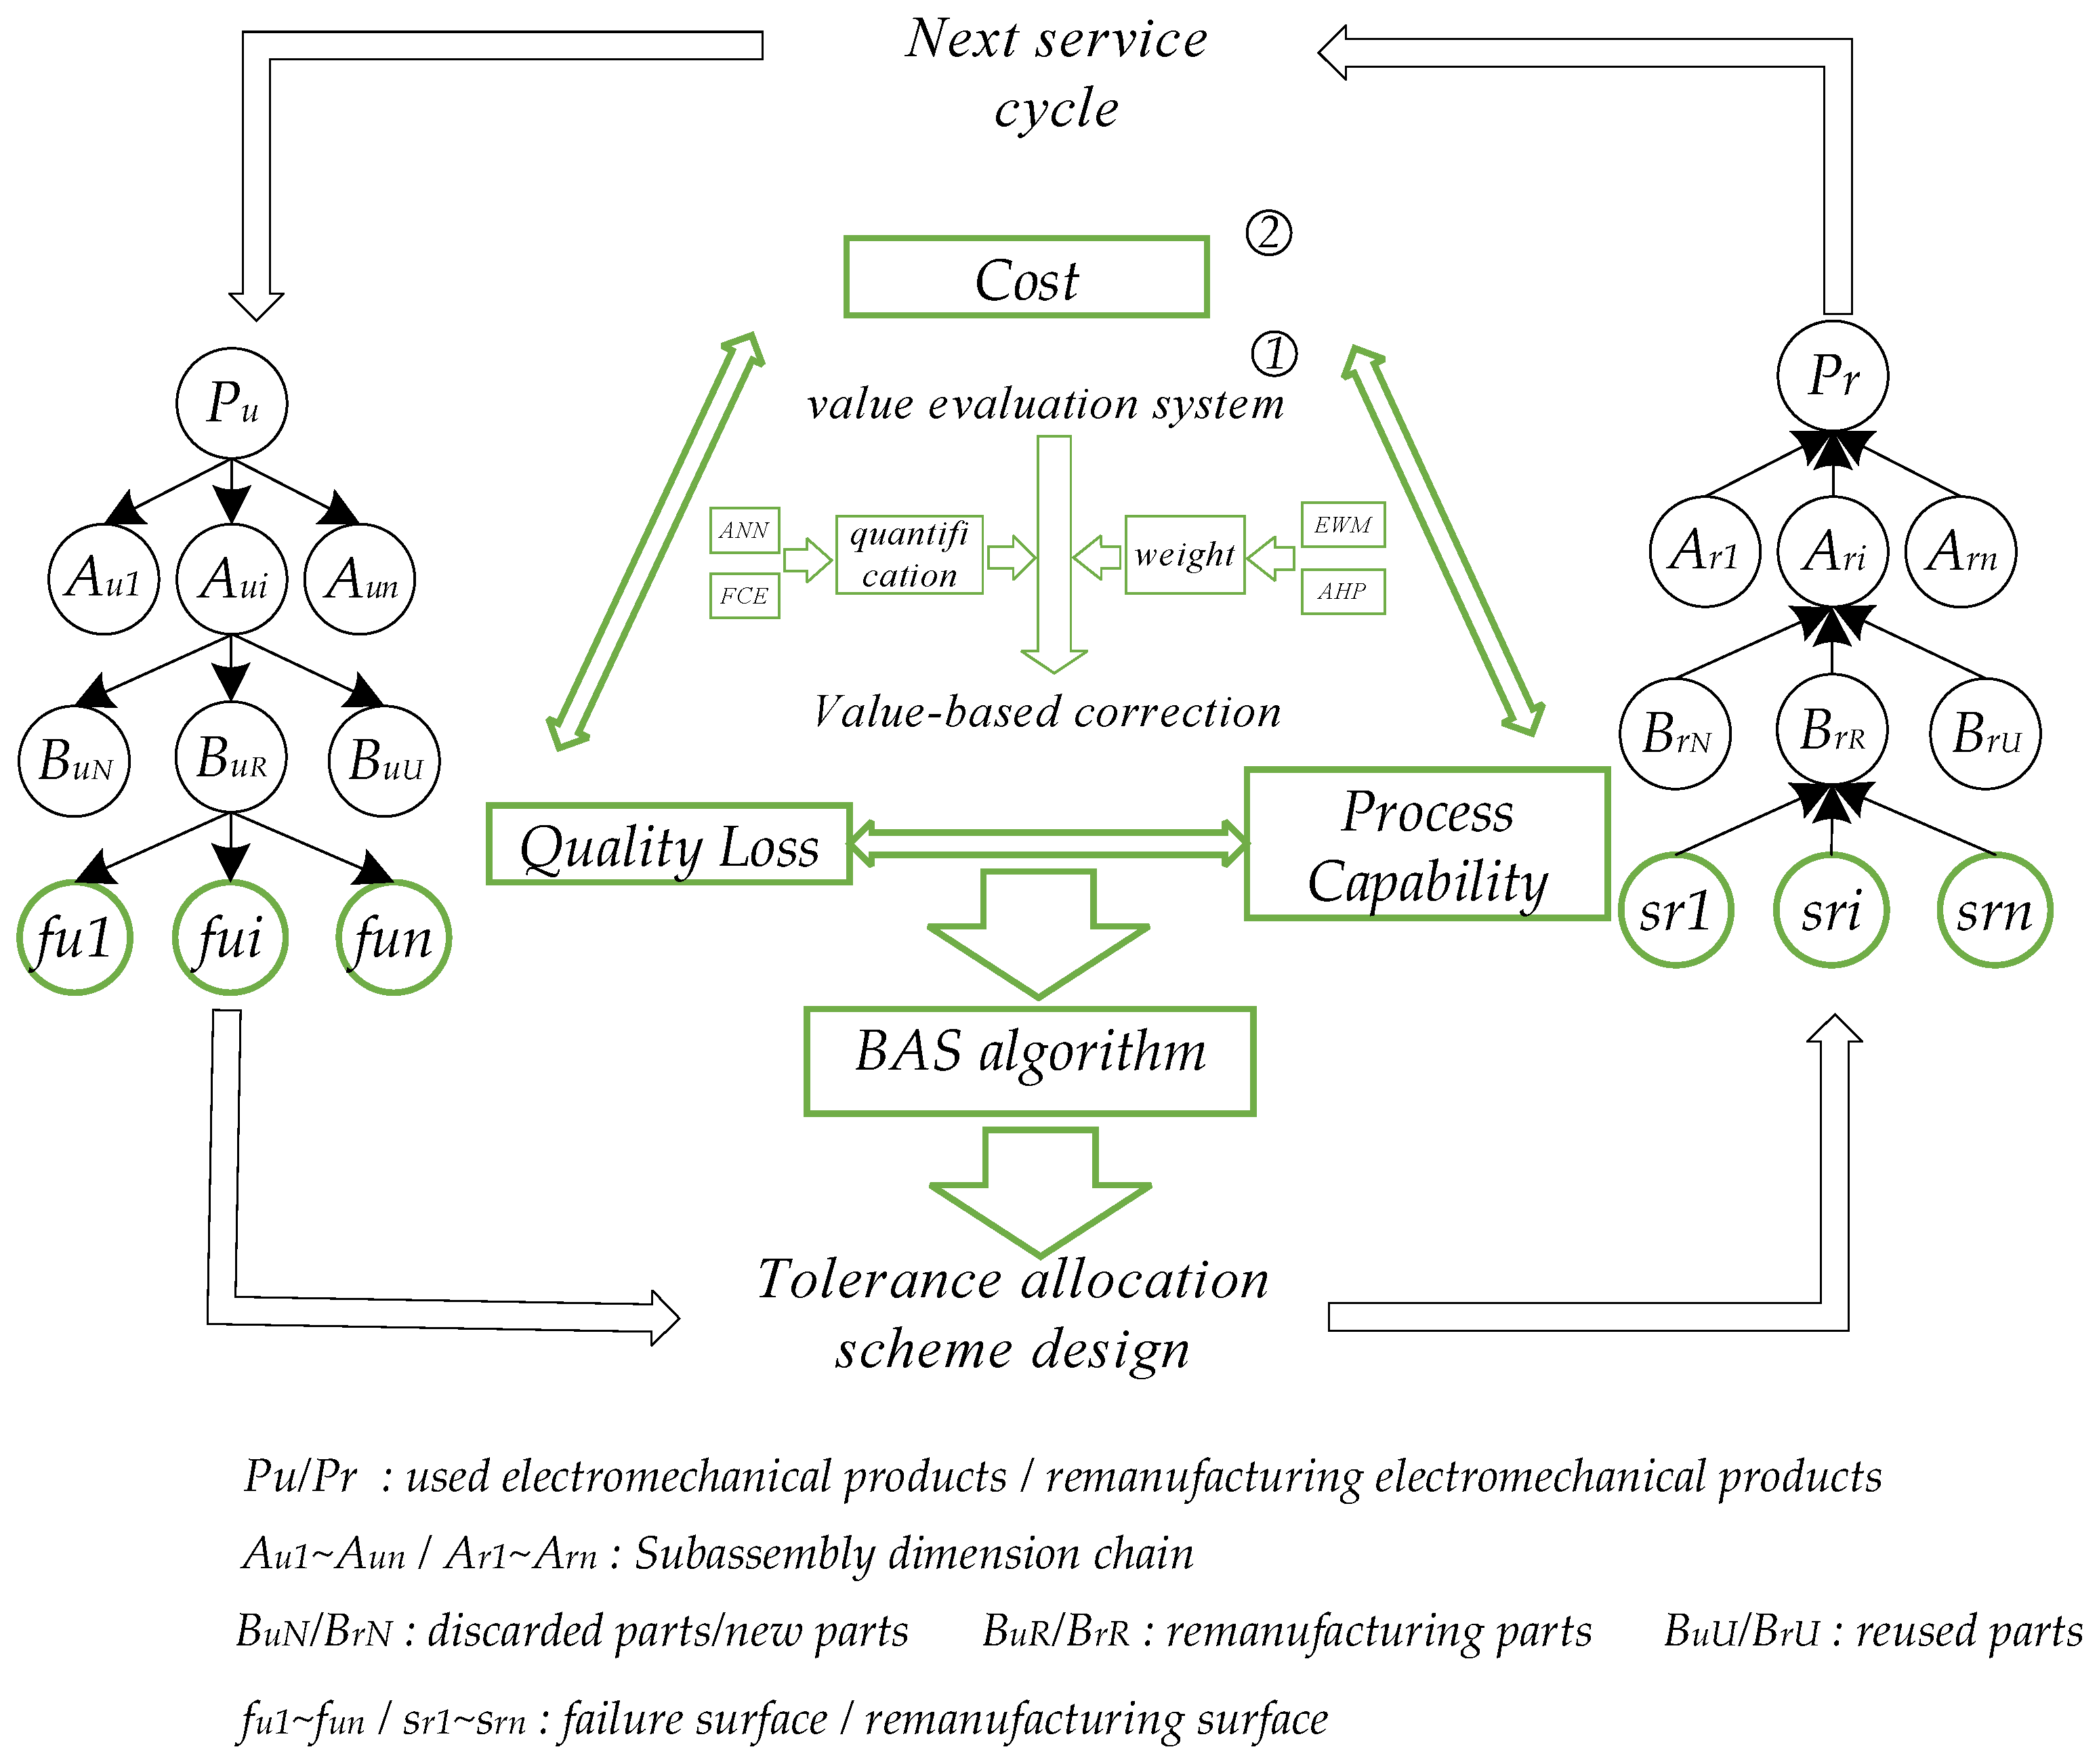
2.1.2. Index Weight
After obtaining the quantitative value of each index, the next step is to obtain the weight of the index. For the remanufacturing tolerance redistribution of used electromechanical products, there is a difference between the return quality of used parts and the production standards of enterprises. The entropy weight method and AHP (analytic hierarchy process) are used to comprehensively formulate the weight of the index [
22]. In which the entropy weight reflects the objective of the return quality differences between used parts, and AHP reflects the subjective production standards of the enterprises.
- a.
Objective weight by entropy
Due to the uncertainty of the quality of the used parts, the remanufactured products lack the uniformity of the parts quality in new products, resulting in a relative evaluation of “better or worse” remanufacturing value indicators among failure surfaces (i.e., machining surfaces) within the target remanufactured assembly dimension chain. In this paper, the entropy weight model is used to measure the objective uncertainty of the remanufacturing value difference. The processes are as follows:
Establishment of evaluation matrix. The number of failure surfaces is
n, the number of indexes is
m, according to
Figure 2, the evaluation matrix of the failure surface remanufacturing value can be established as
;
is the value of the
ith failure surface in the
jth index. The optimal set of remanufacturing value evaluations can be obtained as
,
; then the formation of the standardization of the evaluation matrix
is as follows:
where
.
Calculation of entropy. For evaluation index
j, the entropy value for the
i-th failure surface is defined as follows:
where
.
Calculation of the entropy weight. Based on entropy, the entropy weight of the evaluation index
j can be calculated as follows:
- b.
Subjective weight by AHP
The weight of AHP reflects the subjective importance of enterprises to different indexes in the remanufacture value evaluation system. AHP can determined the weight of the index through the pairwise comparison of the importance of each index. First, the importance of comparison of the pairwise index can be described as shown in
Table 2.
Then, the judgment matrix of importance between each index of the remanufacture value evaluation system is as follows, where is the importance of index
i compared to index
j:
Finally, the weight of evaluation index
b in AHP is defined as follows:
where
.
When the objective weight of the return quality and the subjective weight of the enterprise standard are obtained, respectively, the comprehensive weight of each evaluation index is shown as follows:
Then, the remanufacturing value of each failure surface can be standardized as below:


