Article

A New Use Strategy of Artificial Intelligence Algorithms for Energy Optimization in Plastic Injection Molding

by
Giovanni Pascoschi
*,
Luigi Alberto Ciro De Filippis
,
Antonio Decataldo
and
Michele Dassisti
Department of Mechanics, Mathematics and Management, Politecnico di Bari, Via Orabona 4, 70125 Bari, Italy
*
Author to whom correspondence should be addressed.
Processes 2024, 12(12), 2798; https://doi.org/10.3390/pr12122798
Submission received: 5 November 2024 / Revised: 1 December 2024 / Accepted: 4 December 2024 / Published: 7 December 2024
(This article belongs to the Section AI-Enabled Process Engineering)

Abstract

:
Plastic injection molding is a widespread industrial process in manufacturing. This article investigates the energy consumption in the injection molding process of fruit containers, proposing a new use strategy for the application of artificial intelligence algorithms. The aim is to optimize the process parameters, such as the mold temperatures, the injector temperatures, and the cycle time, to minimize energy consumption. This new use strategy, a hybrid use strategy, combines an unsupervised autoencoder with the K-Means algorithm to analyze production data and identify factors influencing energy consumption. The results show the capability of discovering different operating modes at different levels of energy requirements. An analysis of the process parameters reveals that the number of parts left to complete production, the current cycle counter, the number of shots left to complete the production, the material needed to complete the production, and the total time dedicated to production, so far, are the most relevant features for the optimization of the energy consumption per single piece. The study demonstrates the potential of common artificial intelligence algorithms if appropriately used to improve the sustainability of the plastic injection molding process.

1. Introduction

Plastic injection molding is a widespread industrial process for the production of a wide range of products, from electronics to consumer goods. Despite the technological advances, this process remains characterized by several challenges, including the variability of materials, the complexity of mold geometries, and the need to ensure high quality standards. Another important aspect concerns energy consumption, considering that, in general, the manufacturing process requires a significant consumption of energy.
This paper focuses on the manufacturing sustainability analysis of this process by addressing the energy consumption by means of the application of intelligent algorithms, referring to a real industrial case of the production of plastic boxes for fruit. In recent years, artificial intelligence (AI) has demonstrated enormous potential to transform different industries, offering innovative solutions to complex problems. A huge mass of algorithms is available in the literature so far and therefore tailoring their application for solving specific problems has become a critical task so far. The application of AI algorithms to plastic molding presents a promising opportunity to improve the efficiency, quality, and finally, the sustainability of this process; in particular, the application proposed is focused on the optimization of energy consumption.
Some studies have analyzed the technical aspects of plastic molding, offering important theoretical insights. In [1], the authors delve into the optimization of process parameters to reduce energy consumption. This study analyzes the energy consumption in hybrid injection molding using two ABS parts. It identifies the power usage profiles and specific energy consumption for each part, providing insights for energy-saving strategies by optimizing the process parameters.
Several articles describe cases of artificial intelligence analysis applied to plastic injection molding, particularly aimed at quality control monitoring. In [2,3,4,5,6,7,8,9], different artificial intelligence approaches are presented for quality control in the injection molding process. In paper [2], the authors focus on a fully automated closed-loop injection molding setup with an OPC UA communication platform. This setup includes automated in-line measurements, data analysis, and AI control to adjust machine parameters. A ResNet-18 CNN rates surface quality, while other machine learning models predict the part quality (weight, surface, dimensions) and the sensor data. In [3], the authors investigate the use of AI in plastic injection molding for real-time quality prediction. A European platform with AI tools called ZDMP (Zero-Defect Manufacturing Platform) is used to achieve zero-defect manufacturing. This study analyzes the data from different injection molding processes, using the EUROMAP 77 communication protocol and RAILES software for data collection and labeling. The authors in [4] study the influence of machine parameters on plastic part quality in injection molding using machine learning. This study analyzes data from 400 production cycles, using SolidWorks Plastic for initial design and simulation. Machine learning models, including random forest and gradient boosting, are used to predict the part quality based on parameters like hydraulic pressure and nozzle temperature. The authors in [5] present a two-phase anomaly detection framework for plastic injection molding using sensor data and deep learning. This framework includes data collection, model training (LSTM), and the clustering visualization (SOM) of the defective data. This system uses a semi-supervised approach with pseudo-labeling to identify the anomalies, and provides insights for the decision-makers. The study in [6] investigates machine learning for quality prediction in injection molding. Autoencoder models effectively capture complex variable relationships. Temperature and time are the most influential factors for quality. In paper [7], the authors introduce a closed-loop control and monitoring system for injection molding with AI. The goal is to achieve optimal performance by adjusting the process variables in real-time using AI methods. The system includes building a process model and using AI methods like neural networks for optimization. The authors in [8] compare machine learning techniques for classifying the quality of plastic molded products. Using data from road lens production, this study evaluates KNN, decision tree, random forest, GBT, SVM, and MLP. Ensembles of decision trees achieve 95% accuracy, showing the potential of ML for quality control. In paper [9], a review of current state-of-the-art injection molding, highlighting the process parameters, responses, materials, and modeling techniques, is presented. It discusses the importance of proper parameter setting for product quality and the use of AI for optimization. This review aims to summarize the research on process parameters and their impact on product quality.
The aspect of monitoring the energy efficiency in plastic injection molding using artificial intelligence algorithms is not so common in the scientific literature: in [10,11], the authors propose three ANN learning algorithms to successfully optimize process parameters and improve energy efficiency, using a simulation of the manufacturing process in the MATLAB environment. In particular, this study proposes an intelligent control system for energy-efficient injection molding. Using a case study with a polypropylene part, an artificial neural network model predicts energy consumption based on the process parameters. This system optimizes the process settings to achieve the desired product quality while minimizing energy consumption.
To summarize, we report, in Table 1, the few papers related to AI use for sustainability in plastic injection molding available so far in the literature.
The hybrid artificial intelligence technique is another interesting approach to identify the optimal production parameters for achieving optimal results in terms of quality and energy efficiency. In particular, this work aims to delve into this issue by proposing a new artificial intelligence-based using strategy for energy optimization in the injection molding process. This study refers to a real industrial case with a collection of a large dataset of process and product data. We then applied hybrid AI models (ANN + unsupervised) able to recognize the complex relationships between the various process parameters.
The results of this research offer a new perspective for addressing the sustainability of the plastic injection process.

2. Materials and Methods

2.1. Plastic Injection Molding

Plastic injection molding is a manufacturing process whereby molten material is introduced into a mold to create parts. Various materials can be molded into various shapes with plastic injection molding. Some of the commonly utilized materials are polyvinyl chloride PVC nylon, polyamide, polyester, and acrylic.
Plastic injection molding is capable indeed of producing accurate parts and maintaining good dimensional stability, thus offering higher design flexibility. One of the most relevant advantages of plastic injection molding is that it has a higher production rate: the amount of scraps derived from manufacture are minimal. The plastic injection process can be, in fact, automated, hence improving the production capacity significantly. Plastic injection molding is utilized for producing either smaller or huge parts: typically, the more extensive the part, the bigger and more complex the molds are, therefore impacting the overall production rate and efficiency. As a consequence, the speed of plastic injection molding is dependent on the size and complexity of the mold. Usually, plastic injection molding is utilized to fabricate parts from non-biodegradable materials such as plastics and polymers: from a sustainability point of view, the scrap rate should be maintained at the lowest value possible.
Despite these advantages, energy consumption remains a critical element to address for sustainable manufacturing. Postproduction (finishing) requires post-manufacturing, which is also less impacting, as high dimensional stability is maintained, and the surface finish is also good.
The analysis discussed in this paper refers to an industrial case example for proving the effectiveness of the use strategy proposed based on the data acquired in the manufacturing process of plastic fruit boxes (see Figure 1).
All data analyzed for this research has been collected by means of the MES (Manufacturing Execution System) of the plant (Figure 2).

2.2. Machine Learning

Generally, machine learning algorithms can be classified into two broad categories: supervised [12] and unsupervised [13]. Supervised learning algorithms have the capability to carry out predictions on the future or unknown data based on their previous learning. The output or the generated output of the machine will be compared with the expected output and then the model can be changed accordingly. Unsupervised learning algorithms are quite the opposite, since these are not trained to classify, but these obtain inferences from a function and describe the unlabeled dataset, i.e., data without labels/targets.
Below, we provide some hints that are useful for their selection for use in decision making and the optimization of sustainability, which paved the way for building our new use strategy, a hybrid one, combining an unsupervised autoencoder with the K-Means algorithm, to analyze the production data and identify the factors influencing energy consumption.

2.2.1. Supervised Learning Algorithms

There are two categories of supervised learning algorithms:
  • Regression;
  • Classification.
Regression algorithms [14] are used to predict a continuous numerical value. In other words, the aim is to find the mathematical function that best describes the relationship between the independent variables (features) and the dependent variable (target). The most famous techniques used for this purpose are linear regression or logistic regression.
Classification algorithms [15] are used to predict which category a new data point belongs to. In other words, the aim is to find a class label for a given data point. We have a lot of techniques for classification, like decision trees, SVM, naïve Bayes, K-Nearest Neighbors, and random forest.
Random forest classification was used for only the features related to energy: this is a machine-learning algorithm that combines multiple decision trees to make predictions. Each decision tree in the forest is trained on a random subset of the data and features, creating a diverse ensemble of models. This diversity helps to reduce overfitting and improve the overall performance of the model. Random forests can be used for both classification and regression tasks by building a multitude of decision trees at the time of training.

2.2.2. Unsupervised Learning Algorithms

The main classes of unsupervised learning algorithms available so far are K-Means, DBSCAN, and SOM Networks [16]. In our work, we used mostly K-Means clustering, an unsupervised learning algorithm that partitions a dataset into K distinct clusters. The algorithm works by iteratively assigning each data point to the nearest cluster center and then recalculating the cluster centers. This process continues until the clusters converge. The goal of K-means is to minimize the within-cluster sum of squares (WCSS), which is the sum of the squared distances between each data point and its assigned cluster center. By minimizing the WCSS, K-means aims to create clusters that are compact and well separated.

2.3. Neural Networks

The neural network is the sub-part of machine learning, and it is the core for deep learning [17]. Neural networks are also known as artificial neural networks or ANNs. This neural network is mainly inspired by the human brain and how the neurons send signals to each other. The artificial neural networks comprise three components: the input layer, the hidden layer, and finally, the output layer.
We have a lot of architectures for ANN, based on the following:
  • The number of layers: single-layer or multilayer;
  • The presence of feedback: feed-forward (without feedback) or recurrent (with feedback).
In our work, we used autoencoders [18], special neural networks that learn to compress and reconstruct data in input. They are trained to find a lower-dimensional representation of the input data while preserving its essential features. This process is achieved by minimizing the reconstruction error between the original input and the reconstructed output. Autoencoders have various applications, including dimensionality reduction, denoising, feature extraction, and anomaly identification. They are particularly useful for tasks where the goal is to learn the meaningful patterns and structures within data.

2.4. AI Applied to Plastic Injection Molding

The analysis of the factors that can influence energy consumption in plastic injection molding is a complex task and often relies on human multi-domain expertise, which can be subjective or insufficient. To address this question, a new hybrid use strategy based on ANN deep learning model is proposed, which is able to carry out the analysis of energy consumption. This used strategy offers several benefits:
  • It addresses the challenge of limited (or zero) labeled data by using an unsupervised learning approach;
  • It provides decision-makers with insights into potential factors through anomaly clustering and visualization.
Labeling all the records (i.e., insertion of tags), which can amount to millions of data points, is a significant challenge for practitioners due to the following reasons:
  • Time constraints: Manually labeling each data point is a tedious and time-consuming process, especially with large datasets;
  • Financial burden: The effort required to label all the records translates to substantial labor costs, making it financially impractical for most factories;
  • Expertise requirements: Accurate labeling often necessitates domain knowledge and expertise to correctly identify and categorize defects.
For this reason, the hybrid use strategy proposed here is based on an unsupervised strategy using an autoencoder neural network reinforced with a K-Means algorithm and applied to the unlabeled features.

3. Experiments and Results

As aforementioned, we proved our approach by testing it for energy consumption analysis, referring to a real industrial case of the plastic injection molding process of fruit containers. In the following, all the application details are presented and discussed.

3.1. Energy Consumption Analysis

The first aspect analyzed in this study refers to the energy consumption signature during the complete cycle in the molding process; for the scope of the analysis, three features were taken into account: the Energy_per_part, the Specific_Energy_per_part (Power), and the time_duration of molding cycle. The Energy_per_part is the energy consumed to produce a single part. The Specific_Energy_per_part is the electrical power necessary to produce each part. The time_duration is the period of time for one single cycle of production.
According to the data collected on the field, the resulting outcomes of the cross-correlation analysis of these features is good (see Figure 3), indicating that the features were quite independent of each other (a value of 1 indicates perfect correlation while a value of 0 indicates no correlation). On the right of the same figure, there is a colored scale that indicates the level of correlation between the features.
The application of the K-Means algorithm to these features (with K = 3 clusters) provides a representation as shown in Figure 4. We have used a fixed number k = 3 because our intention was to identify three phases of the entire production process (beginning part, intermediate part and final part).
It is evident that there is a clear negative correlation between the specific energy and energy per part. This means that as the specific energy increases, the energy consumed to produce a single part decreases. This is an expected outcome, as a more energy-efficient process (higher specific energy) will require less energy to produce the same part.
The clusters identified by the K-Means algorithm suggest the existence of three different operating modes:
  • Cluster 0 (blue): characterized by low specific energy and high energy per part. This could represent the production of parts with short molding cycles;
  • Cluster 1 (orange): shows higher specific energy and medium–high energy per part. This might indicate the production with medium molding cycles.
  • Cluster 2 (gray): exhibits the highest specific energy and the lowest energy per part. This likely refers to the production of parts that require more demanding process parameters (e.g., higher temperatures, longer cooling times). Black points are displayed due to overlapping of gray points.
To carry out a chronological analysis of these clusters, we have considered all the records of the dataset grouped in three different groups (first, 33% of the records; next, 33% of the records; last, 33% of the records) containing about 3000 records each.
Each cluster can be considered as a temporal progression of the entire molding process, as represented in Figure 5, Figure 6 and Figure 7.
These three additional graphs provide further insights into the energy consumption patterns of the plastic injection molding process, likely by breaking down the total energy used into two different phases:
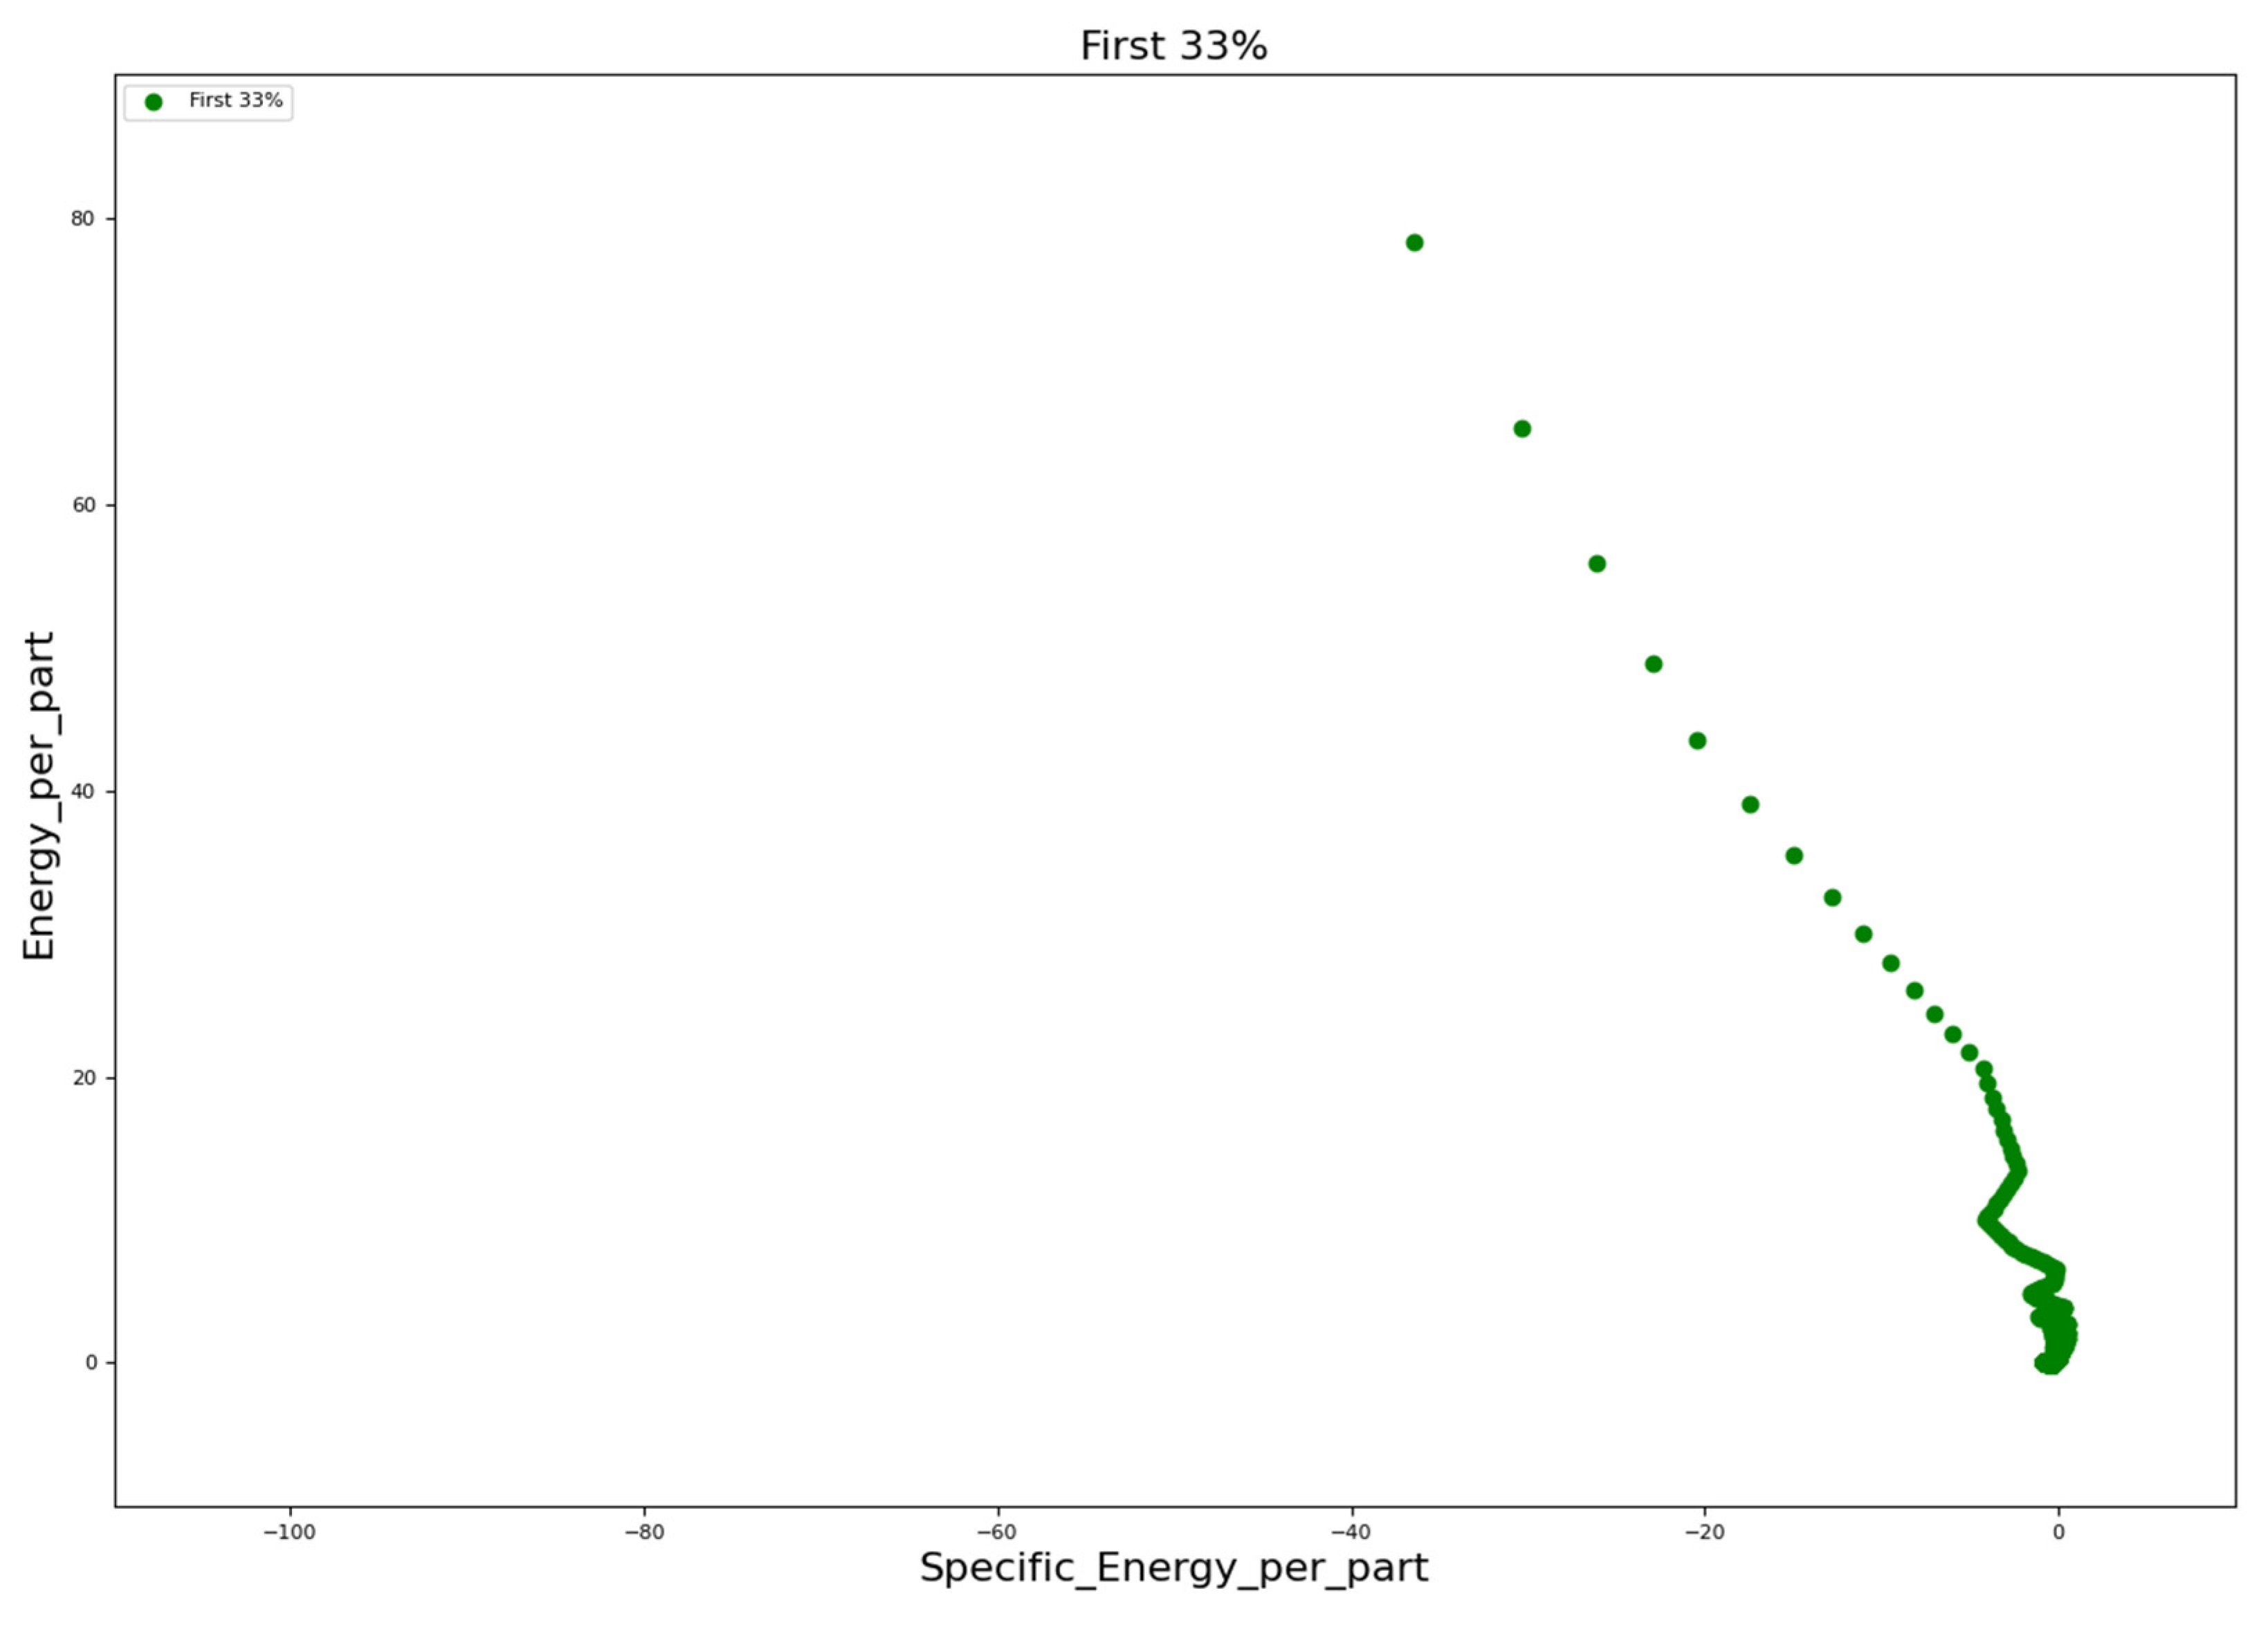
  • Graph 1 (green) can be referred to as the transient phase of the heating energy used to melt the plastic material and maintain the mold temperature. The pattern is similar to Cluster 1, suggesting a strong correlation between the heating energy and the total energy consumption;
  • Graph 2 (orange) and Graph 3 (red) can be referred to as the stationary and final phases of the molding process with a total energy consumption that is quite stable.

3.2. Analysis of Processing Parameters Influencing Energy Consumption

In order to test the new use strategy proposed here, we considered the acquisition and the analysis of several manufacturing parameters. The key features relevant for energy optimization, decided with the domain expert for this study, include the number of parts left to complete production, the current cycle counter, the number of shots left to complete the production, the material needed to complete the production, the total time dedicated to the production, and the energy consumption per single piece. Other considered parameters were the temperatures of the mold (16 sensors) and the temperatures of the plastic material inside the injectors (26 sensors). All the data had been collected via an MES system and had been analyzed following several phases.
In Figure 8, a basic flowchart of the entire process of analysis adopted in our paper is presented.
The initial phase of the analysis involved data preprocessing. This step is essential in any data analysis process to prevent outliers or missing values from compromising the performance of the algorithm. In this case, only the numerical values were initially considered (some auxiliary fields refer to color or material, which are not particularly useful for energy-related purposes), and then the missing values were handled: they were replaced with the column’s mean value (this is typically performed to avoid compromising the algorithm’s performance by introducing outliers). At the end, the data are normalized to ensure that each feature follows a normal distribution with a mean of zero and unit variance. In this manner, the algorithm was independent of the different scales of the data provided during training. By doing so, we ensured that no feature became more important than others during the training phase.
After the preprocessing phase, the data were then used to train an autoencoder. Various types of autoencoders were used, including:
  • Bottleneck: this refers to the central part of an autoencoder, where the data’s dimensionality was minimized. This reduction forced the network to learn a compressed representation of the data, retaining the most relevant information for reconstruction;
  • Dense: it used fully connected layers (dense layers) in both the encoder and the decoder. Each neuron was connected to all the neurons in the preceding and subsequent layers. This type of autoencoder is suited for tabular or structured data, where there are no spatial relationships. Since we were using only the encoding part of the signal, this type of autoencoder corresponded to a Multi-Layer Perceptron Regressor.
Each type of autoencoder has its own topology, but in every case, there is an innermost layer where the data are reduced to two dimensions.
In order to investigate the temporal relationships among the data, they were divided into three groups (Group 0—first 33%, Group 1—next 33%, Group 2—the last 33% of all the records), and clustering was performed on the innermost layer of the autoencoder.
Figure 9 and Figure 10 allow the comparison of the clustering obtained using the real temporal labels (i.e., groups) and that achieved by applying the K-Means technique. It can be observed that the temporal distribution of the data is preserved. Knowing that three temporal groups were identified in the original dataset, we specified that the number of clusters to be identified should be set to three.
As can be seen, the data were still too dispersed due to the high number of features. Therefore, we decided to investigate the importance of each feature in order to use only those relevant to energy-related purposes for training the autoencoder.
The computational framework started with a meticulously configured random forest model, strategically designed to evaluate the intrinsic importance of each feature through an ensemble of decision trees. By leveraging the SelectFromModel transformer, we implement a rigorous statistical filtering mechanism that transcended the traditional feature selection methods, allowing only the most informative variables to permeate our analytical model.
This model was fitted in a supervised way using the energy array as our target array. Figure 11 illustrates the importance of each feature in determining the total energy of each process. To enhance readability, only the top 20 features are displayed; however, it is evident that the lower-ranked features have negligible importance. Consequently, only features with an importance value greater than 0.001 were considered relevant. We used this value because, as shown in Figure 11, many features have zero importance (e.g., features representing process setpoints, such as temperatures fixed at 220 °C).
The transformation process was fundamentally anchored in a data-driven approach that statistically assessed each feature’s predictive potential. Through this methodology, we effectively reduced the dimensionality of our dataset while preserving the essential informational architecture that underpinned our predictive capabilities. The resultant model emerged not merely as a computational artifact, but as a refined, statistically substantiated instrument of scientific inquiry.
The features selected were as follows:
  • ActCntPrt: the number of pieces remaining to complete production;
  • ActCntCyc: the actual cycle counter;
  • @ActCntPrtLeft: the number of pieces remaining to complete production;
  • @ActMaterialNeeds: the material requirement to complete production;
  • @ActTimWrk: the total time spent on production up to this moment;
  • @ActEnergyPerPrt.1: the energy consumption per individual piece [Wh].
Some features, such as temperatures, were discarded because they were very similar across the different molding processing phases, resulting in a strong cross-correlation among them.
Figure 12 and Figure 13 show the clustering results for the collected dataset. In this case, the data results were better distributed (i.e., separation of clusters), leading to more effective clustering.
The figures show that the correspondence between the clusters and the groups was not exact; however, it can be observed that the distribution was preserved (e.g., Group 0 corresponds to Cluster 2 in Figure 13). This allows us to conclude that the temporal proximity between the points in the original dataset was maintained even in the two-feature space of the autoencoder’s code layer.
To the scope of our study, an energetic analysis was carried out, creating statistic boxes for each group/cluster. First of all, Figure 14 shows the boxplots associated with each group with a representation of median value (50% percentile) slightly reducing from Group 1 to Group 3, but with a similar Interquartile Range IQR (difference between the 75% and 25% percentile).
Figure 15 and Figure 16 show the boxplots obtained for each cluster with each type of autoencoder, considering all the features, while Figure 17 and Figure 18 show the boxplots obtained using only the relevant features. Focusing only on the energy-related aspects during training also improved the results, as fewer outliers were observed (and the distribution more closely resembles the real groups), with the exception of the mismatch between the clusters and the groups, which, as mentioned earlier, was not a critical issue.
In the “dense autoencoder” case it is evident that Cluster 3 had a lower median value in respect to the others.
The kind of energy analysis carried out here can be very useful for an optimization process of energy consumption and thus for manufacturing sustainability. Each cluster has specific characteristics at a statistical level. The results of autoencoder vary with respect to the normal behavior of the parameters of the manufacturing process. In our case, the autoencoder had been trained with a dataset, creating a specific “image” in the hidden layer (as a “footprint”). Using the trained autoencoder in real-time, it was possible to detect the abnormal situation with respect to the statistical characteristics of each cluster. This evidence proves that the analysis performed through our strategy can be very useful in a real-time control system. In this way, it may be possible to manage energy consumption, then allowing the energy optimization of the manufacturing process in real time (in our case, for instance, by monitoring the Cluster 3 characteristics).

4. Discussion

Plastic injection molding is a very complex manufacturing process from a sustainable point of view as well: the factors influencing energy consumption are numerous and complex.
Appropriately implementing advanced technologies like artificial intelligence (AI) and machine learning (ML) can help to optimize energy consumption. The AI/ML use strategy presented here to implement algorithms allowed us to analyze production data to identify patterns and optimize the process parameters in real time.
The new hybrid use strategy proposed combines an unsupervised autoencoder with the K-Means algorithm to analyze production data and identify key factors influencing energy consumption. Referring to a real industrial case of the plastic injection molding process of fruit containers, the importance of using an unsupervised learning approach for energy consumption analysis was proven. This is particularly relevant given that, in our case, manual data labeling was complex and expensive.
Three distinct operating modes with varying energy requirements were identified (start-up, transition, steady state) from the dataset thanks to the new use strategy proposed. The outcomes resulting from this particular application showed the impact of the use strategy in energy optimization; this can be adopted in the same way in any phase of the molding process as well.

5. Conclusions

The results of this study emphasize the potential of artificial intelligence algorithms in optimizing energy consumption in the plastic injection molding process but with an appropriate strategy. The latter is extremely important for improving the energy efficiency (and thus contributing to manufacturing sustainability) of the plastic injection molding process. The resulting impact of AI adoption can be really positive, not only at the economic level, but also at the environmental level.
The next steps of future research will be to consider the addition of new features to the dataset, such as pressures and cooling times, which could lead to significant improvements in analysis. This would require a different sensor system (especially for temperature sensors) which is always the real problem with this kind of approach. The investigation of other machine learning algorithms and their implementation strategy, as well as the integration of simulation models of the plastic injection molding process can be of interest to the optimization strategy.

Author Contributions

Conceptualization, G.P. and M.D.; methodology, G.P., L.A.C.D.F., M.D. and A.D.; software, G.P. and A.D.; validation, G.P., L.A.C.D.F., M.D. and A.D.; formal analysis, G.P., M.D. and A.D.; investigation, G.P. and A.D.; resources, G.P. and L.A.C.D.F.; data curation, G.P., L.A.C.D.F. and A.D.; writing—original draft preparation, G.P. and A.D.; writing—review and editing, G.P. and M.D.; visualization, G.P., M.D. and A.D.; supervision, L.A.C.D.F. and M.D.; project administration, G.P., L.A.C.D.F., M.D. and A.D.; funding acquisition, G.P., L.A.C.D.F. and M.D. All authors have read and agreed to the published version of the manuscript.

Funding

This research received no external funding.

Data Availability Statement

The data presented in this study are available on request from the corresponding author.

Acknowledgments

The authors appreciatively thank ECOLOGISTIC Spa for providing the dataset used in this paper.

Conflicts of Interest

The authors declare no conflicts of interest.

References

  1. Ávila-Cedillo, J.; Borja, V.; López-Parra, M.; Ramírez-Reivich, A.C. Energy Consumption Analysis of ABS Plastic Parts Injected in a Hybrid Injection Moulding Machine. Int. J. Sustain. Eng. 2019, 12, 115–122. [Google Scholar] [CrossRef]
  2. Aminabadi, S.S.; Tabatabai, P.; Steiner, A.; Gruber, D.P.; Friesenbichler, W.; Habersohn, C.; Berger-Weber, G. Industry 4.0 In-Line AI Quality Control of Plastic Injection Molded Parts. Polymers 2022, 14, 3551. [Google Scholar] [CrossRef] [PubMed]
  3. Silva, B.; Marques, R.; Faustino, D.; Ilheu, P.; Santos, T.; Sousa, J.; Rocha, A.D. Enhance the Injection Molding Quality Prediction with Artificial Intelligence to Reach Zero-Defect Manufacturing. Processes 2023, 11, 62. [Google Scholar] [CrossRef]
  4. Al-Ahmad, M.; Yang, S.; Qin, Y. Integrating Machine Learning with Machine Parameters to Predict Plastic Part Quality in Injection Moulding. MATEC Web Conf. 2024, 401, 08011. [Google Scholar] [CrossRef]
  5. Lee, S.; Yun, Y.; Park, S.; Oh, S.; Lee, C.; Jeong, J. Two Phases Anomaly Detection Based on Clustering and Visualization for Plastic Injection Molding Data. Procedia Comput. Sci. 2022, 201, 519–5266. [Google Scholar] [CrossRef]
  6. Jung, H.; Jeon, J.; Choi, D.; Park, A.J.Y. Application of Machine Learning Techniques in Injection Molding Quality Prediction: Implications on Sustainable Manufacturing Industry. Sustainability 2021, 13, 4120. [Google Scholar] [CrossRef]
  7. Ogorodnyk, O.; Martinsen, K. Monitoring and Control for Thermoplastics Injection Molding a Review. Procedia Cirp 2018, 67, 380–385. [Google Scholar] [CrossRef]
  8. Polenta, A.; Tomassini, S.; Falcionelli, N.; Contardo, P.; Dragoni, A.F.; Sernani, P. A Comparison of Machine Learning Techniques for the Quality Classification of Molded Products. Information 2022, 13, 272. [Google Scholar] [CrossRef]
  9. Farooque, R.; Asjad, M.; Rizvi, S.J.A. A Current State of Art Applied to Injection Moulding Manufacturing Process—A Review. Mater. Today Proc. 2020, 43, 441–446. [Google Scholar]
  10. Ghadoui, M.E.L. Intelligent Energy-Based Product Quality Control in the Injection Molding Process. In Proceedings of the E3S Web of Conferences; EDP Sciences: Ullis, France, 2023; Volume 469. [Google Scholar] [CrossRef]
  11. EL Ghadoui, M.; Mouchtachi, A.; Majdoul, R. A Hybrid Optimization Approach for Intelligent Manufacturing in Plastic Injection Molding by Using Artificial Neural Network and Genetic Algorithm. Sci. Rep. 2023, 13, 21817. [Google Scholar] [CrossRef] [PubMed]
  12. Nasteski, V. An Overview of the Supervised Machine Learning Methods. Horizons. B 2017, 4, 51–62. [Google Scholar] [CrossRef]
  13. Naeem, S.; Ali, A.; Anam, S.; Ahmed, M.M. An Unsupervised Machine Learning Algorithms: Comprehensive Review. Int. J. Comput. Digit. Syst. 2023, 13, 911–921. [Google Scholar] [CrossRef] [PubMed]
  14. Niu, W.J.; Feng, Z.K.; Feng, B.F.; Min, Y.W.; Cheng, C.T.; Zhou, J.Z. Comparison of Multiple Linear Regression, Artificial Neural Network, Extreme Learning Machine, and Support Vector Machine in Deriving Operation Rule of Hydropower Reservoir. Water 2019, 11, 88. [Google Scholar] [CrossRef]
  15. Alzubi, J.; Nayyar, A.; Kumar, A. Machine Learning from Theory to Algorithms: An Overview. J. Phys. Conf. Ser. 2018, 1142, 012012. [Google Scholar] [CrossRef]
  16. Mingoti, S.A.; Lima, J.O. Comparing SOM Neural Network with Fuzzy C-Means, K-Means and Traditional Hierarchical Clustering Algorithms. Eur. J. Oper. Res. 2006, 174, 1742–1759. [Google Scholar] [CrossRef]
  17. Wu, Y.C.; Feng, J.W. Development and Application of Artificial Neural Network. Wirel. Pers. Commun. 2018, 102, 1645–1656. [Google Scholar] [CrossRef]
  18. Li, P.; Pei, Y.; Li, J. A Comprehensive Survey on Design and Application of Autoencoder in Deep Learning. Appl. Soft Comput. 2023, 138, 110176. [Google Scholar] [CrossRef]
Figure 1. The mold machine in the manufacturing process.
Processes 12 02798 g001
Figure 2. Graphical interface with process parameters: ((a,b) “mold temperatures”; (c) “barrel temperature”).
Processes 12 02798 g002
Figure 3. Correlation matrix for the 3 features.
Processes 12 02798 g003
Figure 4. Application of K-Means algorithm (x = specific energy; y = energy/part).
Processes 12 02798 g004
Figure 5. First group of records (first 33%)—(x = specific energy; y = energy/part).
Processes 12 02798 g005
Figure 6. Next group of records (next 33%)—(x = specific energy; y = energy/part).
Processes 12 02798 g006
Figure 7. Last group of records (last 33%)—(x = specific energy; y = energy/part).
Processes 12 02798 g007
Figure 8. Flowchart of the analysis process.
Processes 12 02798 g008
Figure 9. Difference between clustering with K-Means technique (on the left) and real groups (on the right) for “bottleneck” autoencoder.
Processes 12 02798 g009
Figure 10. Difference between clustering with K-Means technique (on the left) and real groups (on the right) for “dense” autoencoder using the whole dataset.
Processes 12 02798 g010
Figure 11. Importance of each feature for the energy values.
Processes 12 02798 g011
Figure 12. Difference between clustering with K-Means technique (on the left) and real groups (on the right) for bottleneck autoencoder using only the relevant features.
Processes 12 02798 g012
Figure 13. Difference between clustering with K-Means technique (on the left) and real groups (on the right) for dense autoencoder using only the relevant features.
Processes 12 02798 g013
Figure 14. Boxplots of energy for each group.
Processes 12 02798 g014
Figure 15. Boxplots of energy for each cluster for “bottleneck” autoencoder using the whole dataset.
Processes 12 02798 g015
Figure 16. Boxplots of energy for each cluster for” dense” autoencoder using the whole dataset.
Processes 12 02798 g016
Figure 17. Boxplots of energy for each cluster for “bottleneck” autoencoder using only relevant features.
Processes 12 02798 g017
Figure 18. Boxplots of energy for each cluster for “dense” autoencoder using only relevant features.
Processes 12 02798 g018
Table 1. State-of-the-art AI for sustainability in plastic injection molding.
ReferenceArea of InterestKPI AddressedAI ApproachPRO’SCON’S
[2]fully automated closed-loop injection molding AI control to adjust machine parametersResNet-18 CNN High precision in defect detection and parameter adjustment; supports zero-defect manufacturingLimited to specific parameters; needs high-quality sensor data
[3]zero-defect manufacturing, sustainabilityOverall Equipment Effectiveness (OEE), downtime reductionData augmentation, human-in-the-loop labelingReduces defective parts and environmental impact; increases OEE and process efficiencyHigh initial implementation costs; dependence on real-time data integration
[4]machine parameter optimizationDefect rate, production efficiencyLogistic regression, random forest, gradient boostingHigh classification accuracy (>98%), robust analysis of sensor dataPotential overfitting, requires extensive sensor setup
[5]anomaly detection in injection moldingDetection rate, system robustness Clustering, visualization Enhances anomaly detection precision through clustering; adaptable to different datasetsRequires significant computational resources
[6]sustainable manufacturingAccuracy, precision, recall, F1-scoreDecision trees, regression models, autoencodersAutoencoder performs best; highlights temperature and time as key factors affecting qualitySelection of algorithms depends heavily on input data quality
[7]process monitoring and controlQuality consistency, system adaptability Various machine learning methods Comprehensive overview of monitoring technologies; real-time application Broad scope lacks specific implementation details
[8]quality classification for molded products Classification accuracy, error rates Random forest, neural networks, support vector machines Provides comparative performance of different algorithms; flexible setup Accuracy depends on the size and diversity of training datasets
[9]process optimization in injection molding Defect minimization, mechanical properties Artificial neural networks, genetic algorithms, Taguchi methods Comprehensive overview of optimization techniques; highlights significant process parameters such as cooling time and holding pressure Variability in process parameters reduces general applicability; limited specific experimental results
Disclaimer/Publisher’s Note: The statements, opinions and data contained in all publications are solely those of the individual author(s) and contributor(s) and not of MDPI and/or the editor(s). MDPI and/or the editor(s) disclaim responsibility for any injury to people or property resulting from any ideas, methods, instructions or products referred to in the content.

