Article

Optimal Air Flow Modeling in Real Healthcare Facilities for Quick Removal of Contaminated Air

1
Department of Biomedical Technology, College of Applied Medical Science, King Saud University, Riyadh 11433, Saudi Arabia
2
Department of Biomedical Engineering, School of Control Science and Engineering, Shandong University, Jinan 250061, China
3
Center of Excellence in Biotechnology Research, King Saud University, Riyadh 11451, Saudi Arabia
*
Author to whom correspondence should be addressed.
Processes 2024, 12(12), 2799; https://doi.org/10.3390/pr12122799
Submission received: 25 October 2024 / Revised: 20 November 2024 / Accepted: 4 December 2024 / Published: 7 December 2024
(This article belongs to the Section Process Control and Monitoring)

Abstract

:
Background: Contaminated air can have a negative impact on patient recovery, leading to longer hospital stays, higher healthcare costs, and even death. Objective: Our study focuses on improving indoor air quality for patient recovery in healthcare facilities. Methods: We conducted computational analysis using the finite element modeling (FEM) technique to investigate the flow of contaminated air exhaled by a patient. Distinct models were examined: a neonatal intensive care unit (NICU) with two-beds and a coronavirus isolation room (CIR). Using ANSYS, we designed models using actual and real specifications of both NICUs and IRs from local hospitals. We determined the optimal dimensions and locations of outlet vents in NICUs and CIRs using simulations with ANSYS software drawing on our designed modeling of air flow. Outlet vent dimensions and locations were modified to achieve optimal air flow for quickly venting out contaminated air from a patient in a room. Results: The results show a substantial improvement in directly venting out the contaminated air from the patient. Conclusions: It can be concluded that the optimal design of outlet vent locations and dimensions using ANSYS simulation results in finding the optimal path for the quick removal of contaminated air flow from the patient in an NICU and CIR.

1. Introduction

The impact of indoor air quality on patient recovery is particularly pronounced in healthcare facilities. Contaminated air can negatively impact patient recovery, leading to extended hospital stays, increased healthcare expenses, or fatalities. A link has been found between poor air quality and hospital-acquired infections (HAIs), making breathing problems worse in people who already have them, and making it take longer for them to get better [1,2]. Mohamadi and Fazeli state that a variety of pollutants, including particulate matter, gasses, and microorganisms, contaminate indoor air [3]. Consequently, it is imperative to understand the role of polluted air in the recuperation of patients and develop strategies to mitigate its adverse consequences [4].
In the interim, the quality of indoor air within healthcare facilities significantly impacts the well-being and health of both patients and healthcare providers. Healthcare environments may harbor airborne pollutants that present significant risks to the well-being of healthcare professionals. These risks include an elevated susceptibility to respiratory infections, exacerbations of asthma, and allergic reactions [5]. In addition, staff turnover, decreased productivity, and increased sick leave can result from exposure to contaminated air, all of which have a negative impact on patient care [6]. As a result, healthcare providers must have a thorough understanding of the significance of contaminated air in order to establish healthy and secure work environments [7].
The transmission of viruses and diseases through the air is a significant public health concern. Individuals in close proximity inhale infectious agents carried by droplets, aerosols, or dust particles, contributing to this mode of transmission. Airborne disease and virus transmission can occur in a variety of environments, including public transportation, healthcare facilities, and crowded indoor spaces, according to research [8,9]. Identifying efficacious approaches to prevent and regulate airborne transmission of infectious diseases is crucial due to the substantial body of documentation demonstrating the detrimental effects of contaminated air [10].
In recent times, the COVID-19 pandemic has brought to the forefront the critical importance of indoor air quality and its immense influence on the virus’s transmission. SARS-CoV-2, the viral pathogen responsible for COVID-19, is confirmed to be transmitted via aerosols or contaminated air particles, according to recent research [9,11]. This mode of transmission profoundly impacts infection prevention and control measures in healthcare facilities, workplaces, and public spaces. The objective of this scientific investigation is to review the existing body of literature concerning the airborne transmission of COVID-19. An in-depth examination of the variables that influence aerosol propagation and the potential ramifications for public health is of utmost significance. Furthermore, it is imperative to investigate approaches to mitigating the likelihood of airborne transmission and the complexities associated with executing efficient control protocols [8].
In critical environments such as healthcare facilities, personnel, visitors, and patients are all susceptible to contracting infections. In order to mitigate the risk of infection transmission, the COVID-19 pandemic has strengthened the case for maintaining high indoor air quality. One of the simplest and most effective ways to eliminate pathogens and reduce the likelihood of infections in healthcare facilities is by diluting room air with sanitized air [12]. This, nevertheless, is not the sole approach. To mitigate the transmission of microorganisms, healthcare facilities employ a range of techniques for air purification, including barrier protection and disinfection of clinical contact surfaces [12].
By significantly contributing to the design and optimization of ventilation systems, computational fluid dynamics (CFD) can significantly improve indoor air quality. By simulating the movement and spread of airborne pollutants, CFD lets us test how well different ventilation plans work and find places where air is not moving [13]. Ventilation system design and optimization applications of CFD include the analysis of indoor airborne particle dispersion, temperature distribution, and airflow patterns. A lot of research has also shown how important computational fluid dynamics (CFD) is for comparing the effectiveness of different ventilation methods and finding the best way to set up ventilation systems to enhance the quality of indoor air [13,14]. In addition, recent research and modeling of the COVID-19 pandemic have employed CFD [3].
After trying numerous techniques, both new and old [15,16], we selected the two model models used in this study due to their efficiency with minimum modification required using software. Thus, in this study, we present two methodologies (models) for determining the most efficient means of removing COVID-19-contaminated air from hospital rooms while minimizing its spread. By developing the initial model for the ventilation system within the isolation rooms of City University Hospital, we effectively increased the protection rate of health practitioners in the health isolation departments against virus infection and decreased the transmission of micro-droplets from patients infected with Coronavirus (COVID-19). The second model centered on newborns and premature neonates admitted to King Abdullah bin Abdulaziz University Hospital (KAAUH) and the neonatal intensive care unit (NICU) therein. The locations of both case studies were Riyadh and Saudi Arabia.

2. Materials and Methods

2.1. Study Design

For quick air removal, we subjected two distinct rooms to optimal computational modeling design and analysis in this study. The first room was a neonatal intensive care unit in the hospital (KAAUH), which was redesigned and modeled to include critical variables such as inlet and outlet distributions, room volume, and vent specifications. The room had a volume of 4.71 m × 4.42 m × 2.57 m, with four square-shaped vents measuring 58mm in length and width. The two beds in the room had the same dimensions, 0.905 m × 0.6 m × 1.3 m, and were designed to include a circular shape resembling the baby’s face with an embedded inlet for the nose and the mouth. Taken from the University Medical City (UMC), the second room was matched to and designed with the same specifications as the first room, in this case being a negative pressure isolation room, making it a Coronavirus isolation room with a size of 24 cubic meters (6 × 4) and a height of 3 m with four square-shaped vents measuring 58 mm in length and width. One bed in the room had the dimensions of 2.03 m × 0.9 m × 0.64 m, and was designed to include a circular shape resembling an adult face with an embedded inlet for the nose and the mouth.
We used ANSYS (CFX-Pre) software version number 11.11 [17] to simulate the normal state of each room with closed doors. The ANSYS (CFX-Pre) software is considered one of the most reliable and creditable pieces of software for the simulation of computational fluid dynamics processes. The simulation followed the widely recognized ANSI/ASHRAE standards for ventilation system design and indoor air quality (IAQ) standards. Specifically, air change per hour (ACH) = 12 was employed to ensure that the simulation met the recommended ventilation standards [18].

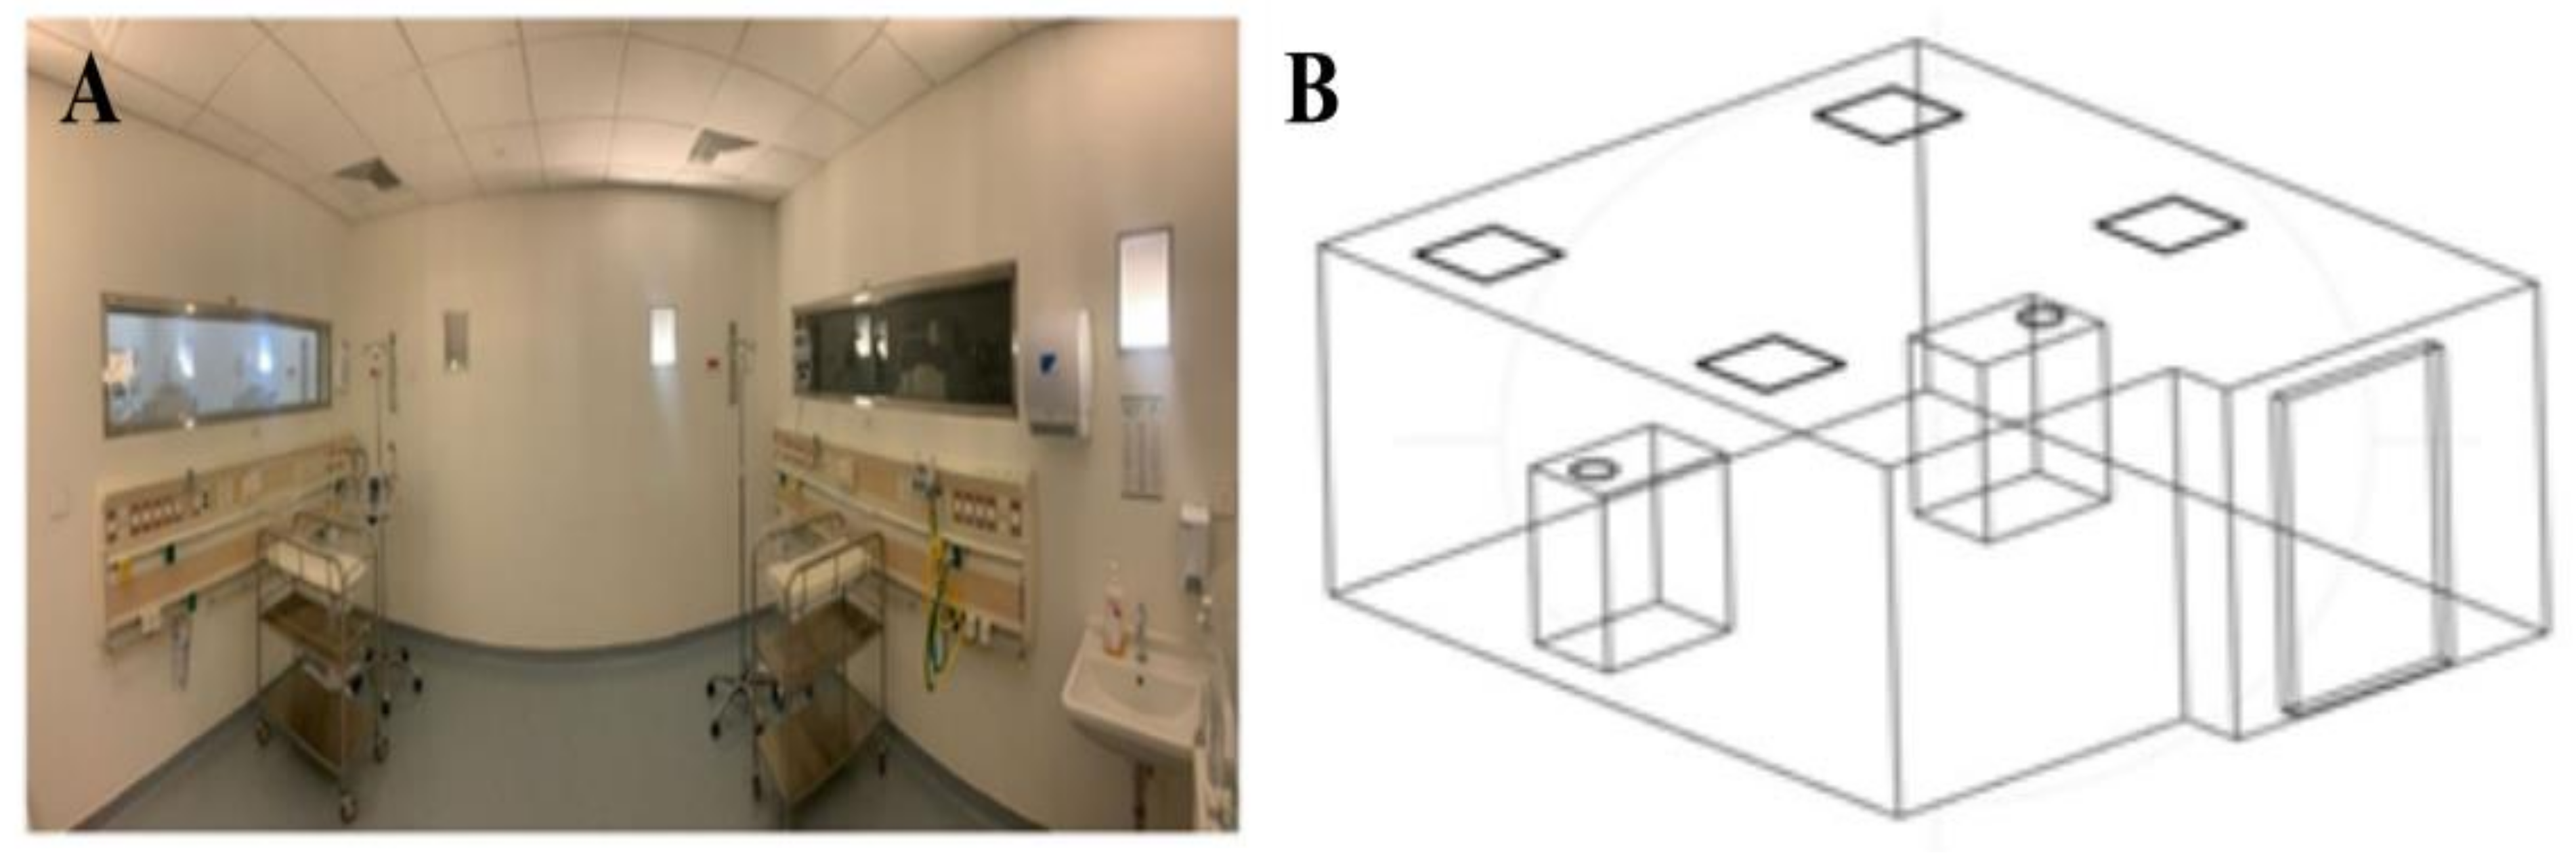
2.2. Three-Dimensional Model Construction

For Model 1, a three-dimensional (3D) model was created based on all the measurements taken from the room. Figure 1A,B depict the picture of the actual room and 3D model construction of the room, respectively.
For Model 2, a design was developed using SolidWorks software version 2011 to match the dimensions of the room, which were 24 cubic meters in size (6 × 4) and 3 m in height. Figure 2A,B depict the picture of the actual room and 3D model construction of the room, respectively.

2.3. Simulation Design

To conduct a simulation study or generate a digital model, meshing is frequently used to split the model into cells called “elements”. By default, the software selects a higher number of elements, which is more accurate in giving solutions, and the larger the simulations become, the longer solve times will be, given that the designs are well sampled over the relevant physical domains [19]. Supply vents were considered as inlets to the room, the air mass flow rate was calculated from Equation (1) 0.24 m3/s, and the age of air was added as a value with an amount of 1 s. Return vents were considered outlets from the room, and the mass flow rate was selected. Two patients were considered inlets to the room with a normal speed, with the average exhaled air for infants being around 1.49 m/s with a time of air of 1 s. This value was selected after reading the literature [20,21].
Through these calculations, it is possible to calculate the movement of air and the movement of particles in a location, whether internal or external, and this program enables showing the results in the form of illustrations and three-dimensional colored lines. The model’s structural design included the boundary conditions, and the measurements of the room and the ventilation system were calculated. The amount of inlet air was calculated with the following equation:
V i = V r     A C H
where Vi is the volume of inlet air per hour, Vr is the volume of room, and ACH is the air change per hour (ACH).
ACH was set to 12 according to in-hospital standards (ANSI/ASHREA STANDARD).
The values of the parameters used in Equation (1) are as follows:
V i = 6     4     3     12 = 864   m 3 / h   =   0.24   m 3 / s
The CFD analyses of fluid flow problems in both models were based on a well-known mathematical equation: the Navier–Stokes Equation (2) using the Finite Volume Method [22]. This equation is as follows:
ρ q t + q q g · q = p + μ 2 q · q = 0
where p is pressure, ρ and µ are blood density and dynamic viscosity, q   is velocity vector, and q g is the local coordinate velocity vector.

3. Results

In this study, two different models were created and the findings of these two models are illustrated using ANSYS post-processing contours as described in the following section.

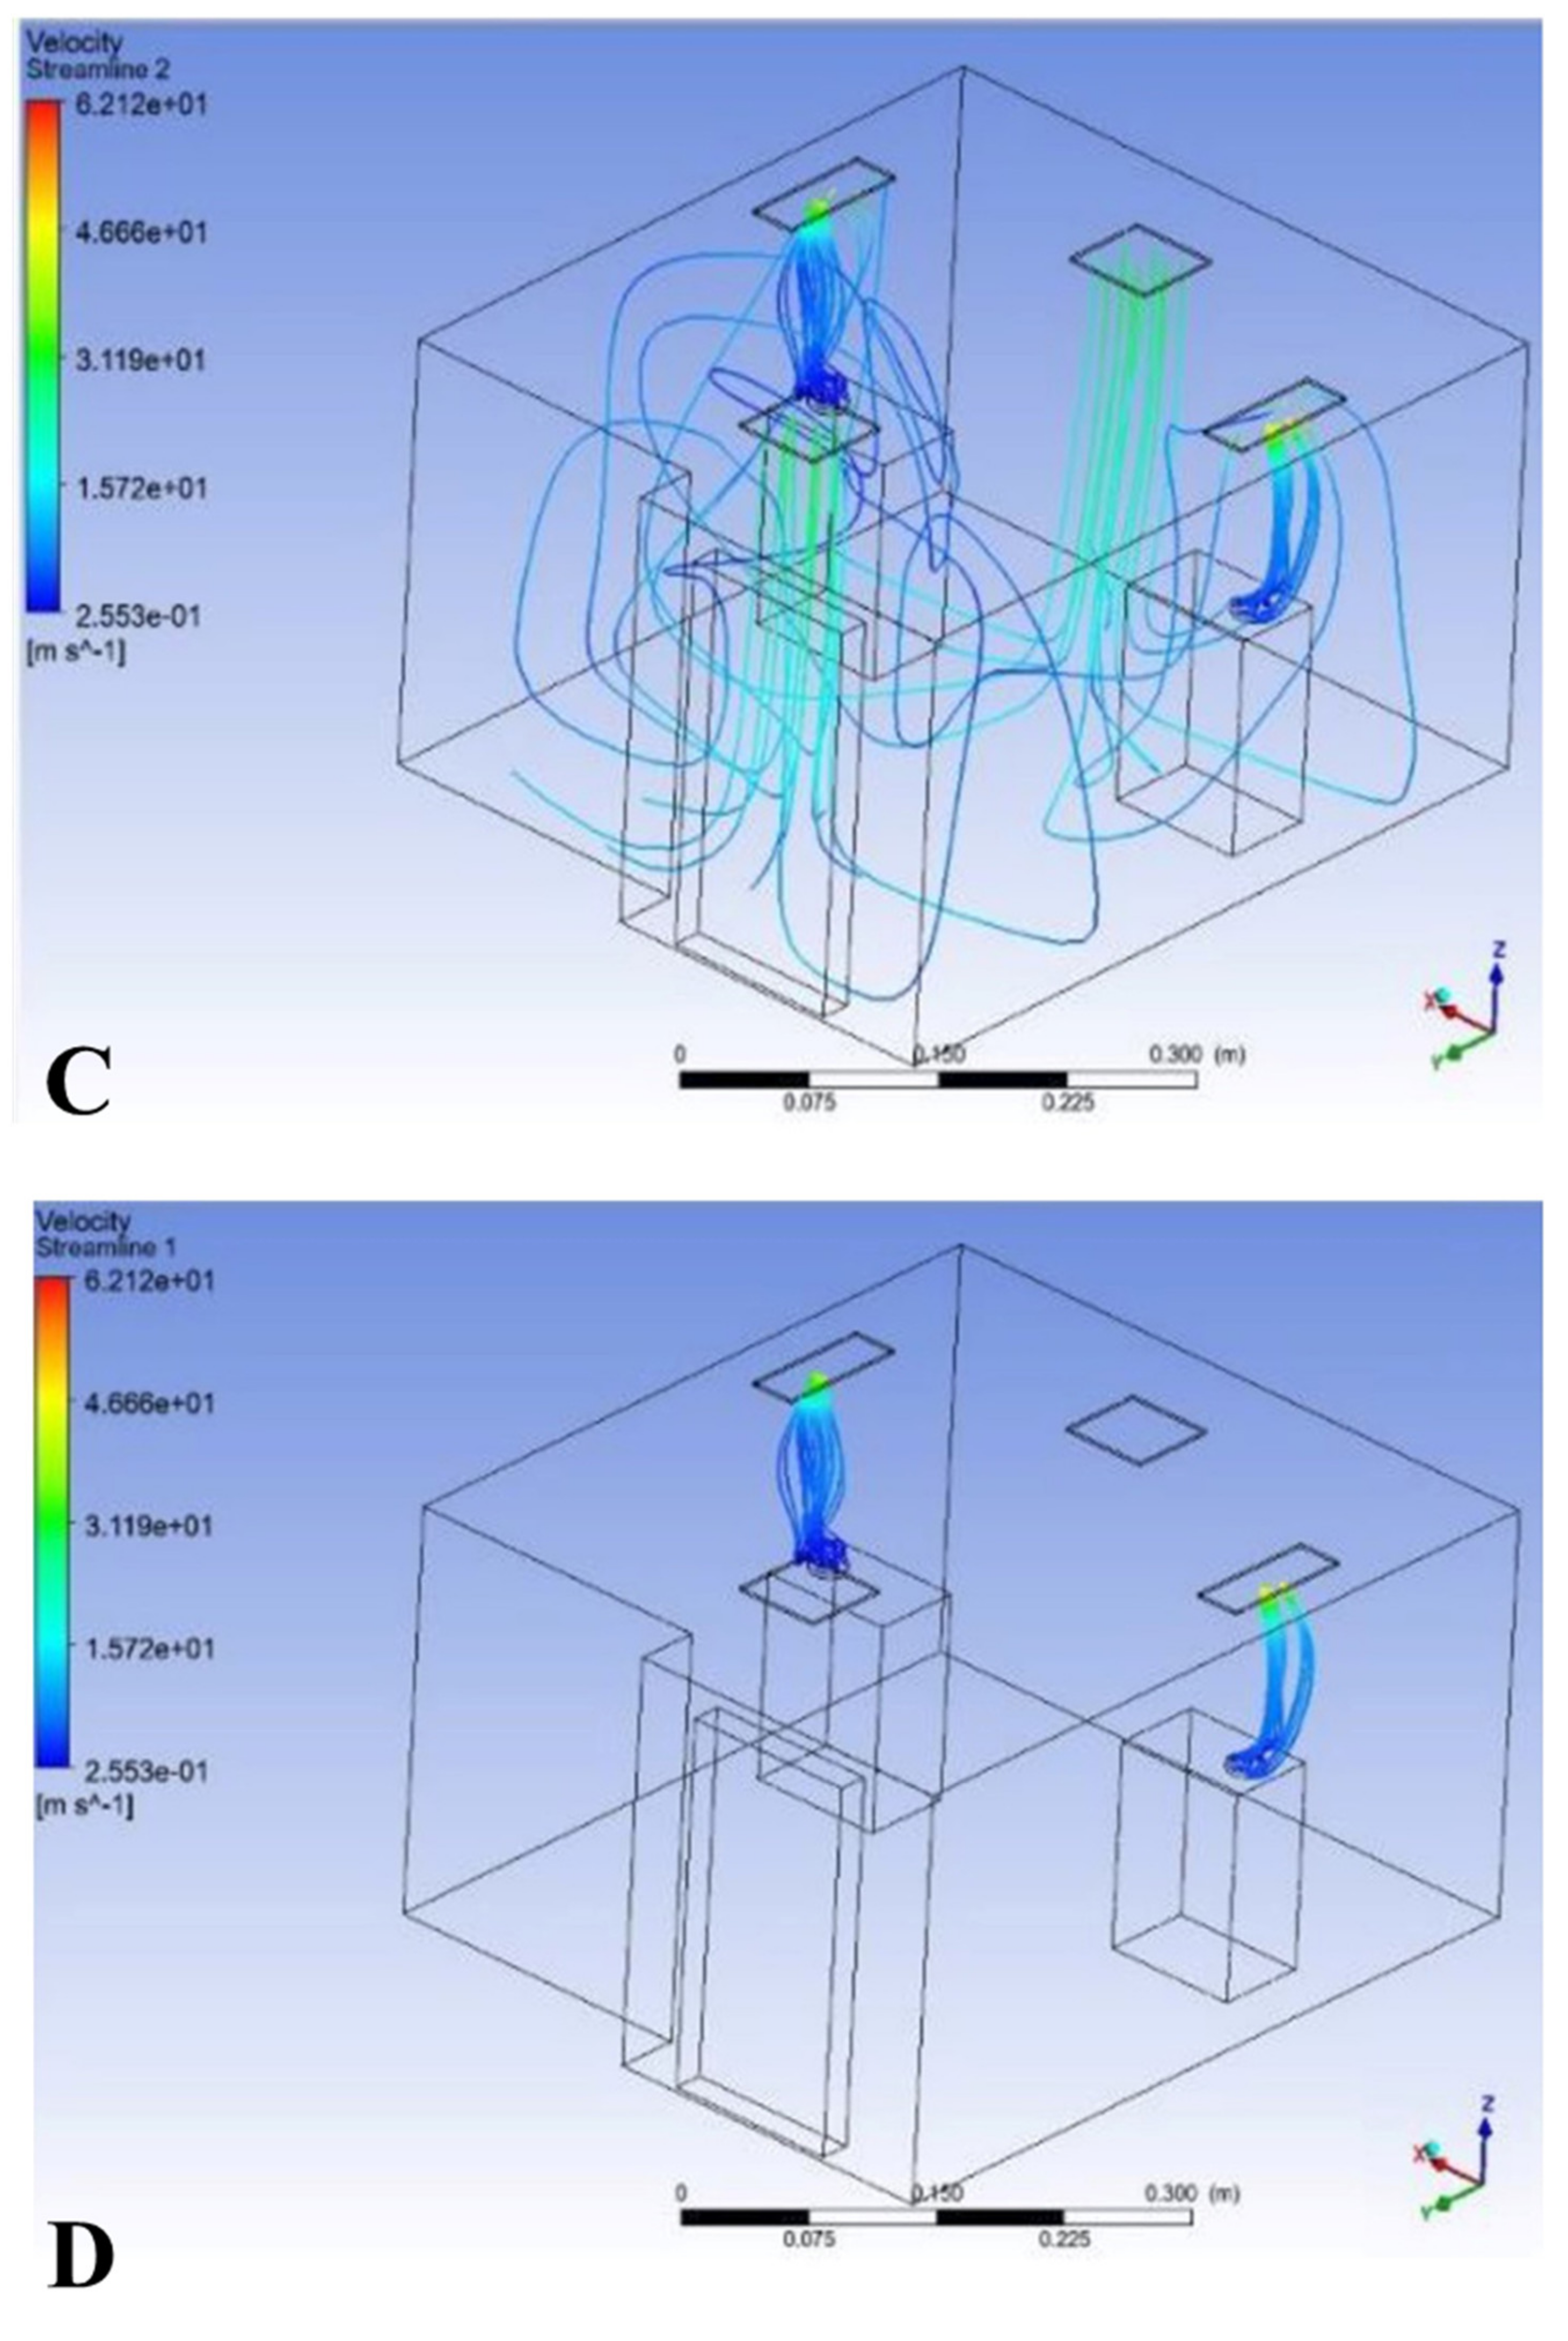
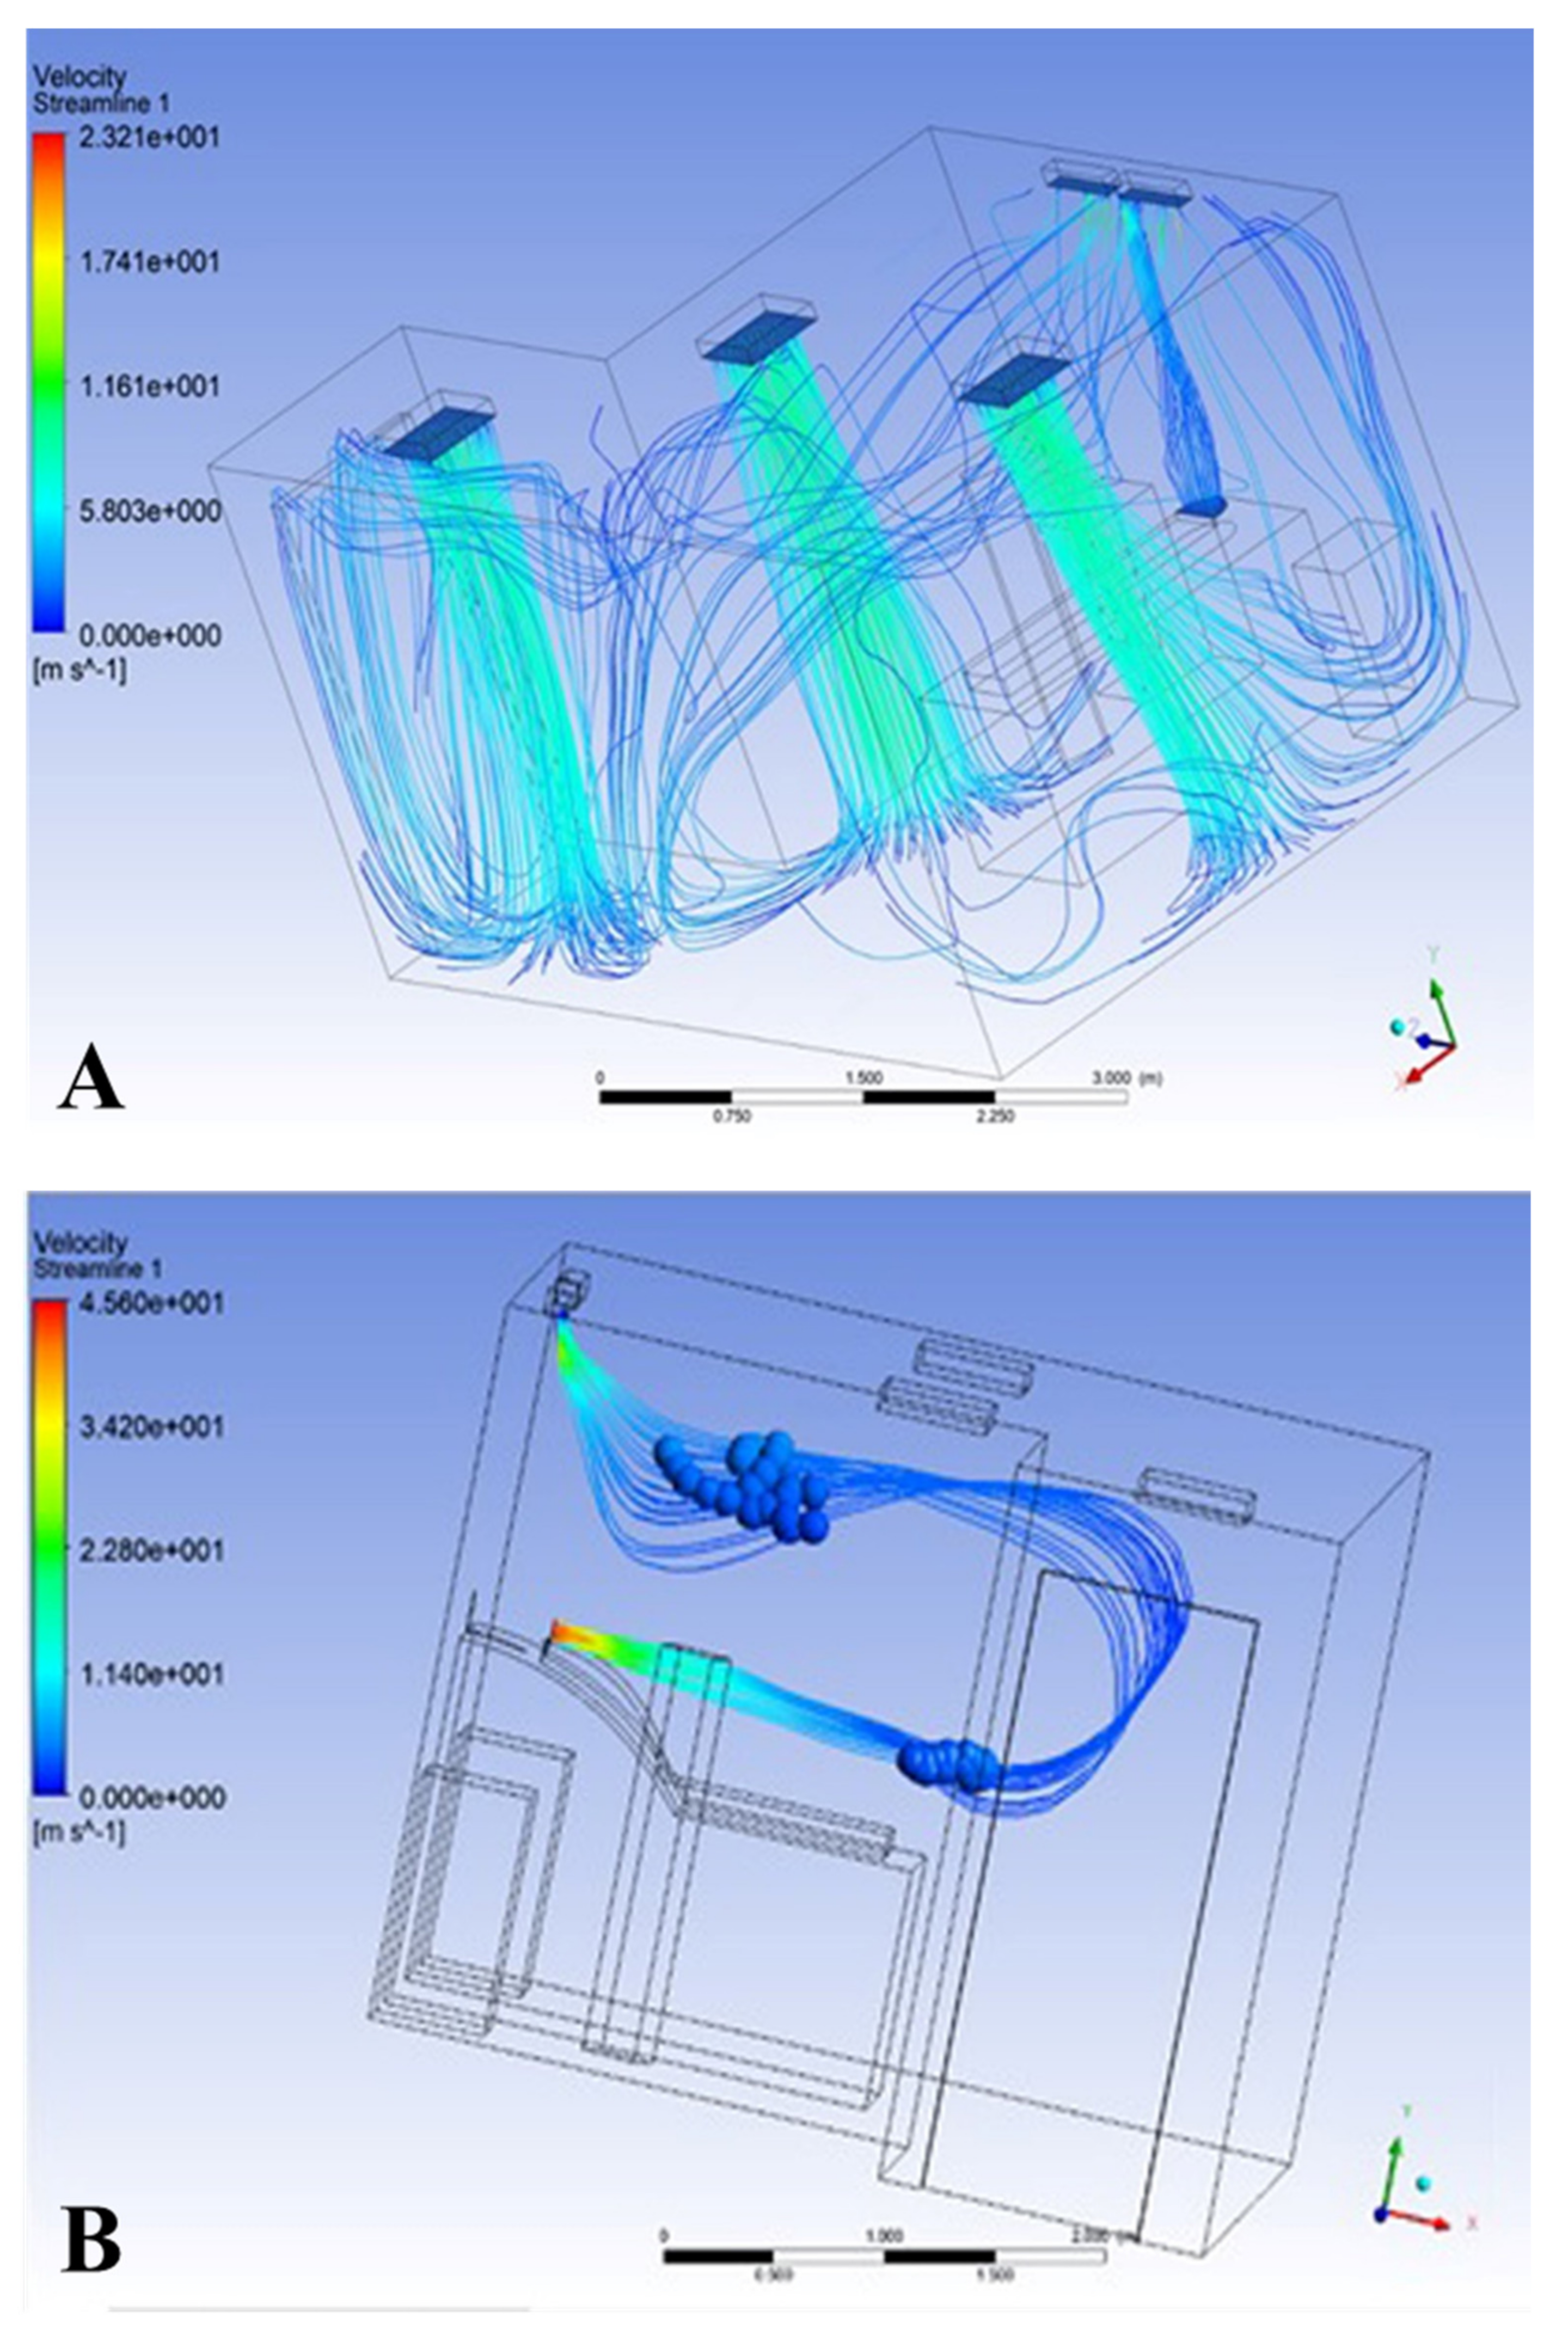
3.1. Result of Model 1

The movement of exhaled air from the patient to the return vents is meant to take the fastest path and have the shortest spread. Therefore, an iterative search of the optimal placements and dimensions for the vents was conducted. Figure 3A,C show the path of exhaled air in the original room in the UMC. Figure 3B,D show the optimal path of the air flow as the exhaled patient air takes the fastest route to return vents and is associated with no visible spread within the room.

3.2. Results of Model 2

In order to find the shortest spread and the fastest way for the small particles to exit, we looked at several patient positions to confirm the system’s effectiveness and measure the spread’s extent, as shown in Figure 4A,B.
After that, we developed these results and discovered that moving one of the outlet air vents improved the result and shortened the path of air diffusion, leading to a decrease in the presence of small particles in the room. When we placed one of the air outlets in the middle, we reduced the spread of small particles, whether the patient was lying on a bed or moving inside the room; these results are shown in Figure 4C,D.

4. Discussion

This study aimed to find out the optimal airflow path in healthcare facilities in order to remove contaminated air quickly. Figure 3 shows a case where a patient’s airflow follows a lengthy path to the return vents and spreads extensively within the room. As a result, the study’s aim led to the establishment of different designs. One of the first scenarios conducted was switching between the placement of the supply and return vents. The results shown in Figure 3 show an even larger spread throughout the room, increasing the chances of contaminated air transmission between neonates in addition to having a longer path until reaching the return vents. Compared to other simulated scenarios, this scenario was clearly the worst suggestion for the placement of vents. After multiple attempts, we changed the shape of the return vents’ drills from square to rectangular and adjusted their placement directly above the infant bed while maintaining the same number of vents (four vents: two supply and two return).
To maintain cost-effectiveness, we executed another attempt with the same distribution while retaining the hospital’s original square vent shape. The figures illustrate the best scenario as a result. Figure 3C,D met the study objectives mentioned at the beginning of this review, as they reduced the number of cross-infections by quickly removing the contaminated air within the room. Figure 4 shows the overall air distribution in the contaminated room. We conducted a simulation with the ANSYS program for all possible locations and dimensions of outlets in the room to study the path of the air leaving a simulated patient.
The findings of Model 1 show agreement with an earlier study [4] regarding particle trajectories moving within a contaminated room. The importance of developing ventilation systems is clear given that studies have proven that the Coronavirus, COVID-19, is transmitted through the air and causes infection, especially in closed places, as is the case with other viruses that travel and infect humans through the air. Ventilation systems also strongly improve the air quality in isolation rooms and reduce the distance of virus spreading and the time a virus stays in the air inside such rooms. One of the important steps in dealing with the Coronavirus is to protect medical staff who take care of COVID-19 patients in medical isolation departments because they face a higher risk of infection transmission given the nature of their work. This project may help reduce the number of infections in hospitals, especially in health isolation departments. Applying this project by changing the location, size, and volume of air vents in isolation rooms is easy and expected to significantly improve air quality inside isolation rooms, while also limiting the spread and survival of viruses in the air of these rooms. However, the present study has a limitation insofar as it did not involve measuring and calculating empirical values of airflow contamination before and after changes in air vent location and size in different rooms.

5. Conclusions

Using ANSYS simulations to find the best placement and size of outlet vents is the best way to quickly stop contaminated air flow from patients NICUs and CIRs, according to the results.
Isolation sections can adopt this study’s findings due to their ease of implementation, the improvement in air quality within isolation rooms that they predict, and their ability to limit virus dispersion and survival in room air for extended periods. We will be able to evaluate real-world results related to impacts on air flow when we implement specific ventilation system changes using the outlined CFD technique. Future investigations are strongly recommended that would measure values for contaminated air presence in isolation rooms with and without applying our model. Additionally, for infant isolation rooms, exhaled air from attendees should also be considered when measuring empirical values.

Author Contributions

Conceptualization, O.A. and R.J.; methodology, O.A. and Y.A.A.; software, R.A., S.A. and R.J.; validation, R.A., S.A., Y.A.A., K.A. and R.J.; formal analysis, A.F., M.A. and K.A.; investigation, R.A., S.A., R.J. and O.A.; resources, O.A., R.J., M.A. and A.F.; data curation, K.A., O.A. and Y.A.A.; all authors contributed equally in writing—original draft preparation; all authors contributed equally in writing—review and editing.; visualization, S.A., R.A., O.A. and R.J.; supervision, O.A., R.J. and A.S.; project administration, O.A., R.J. and A.S.; funding acquisition, A.F., O.A., M.A. and A.S. All authors have read and agreed to the published version of the manuscript.

Funding

This research was funded by the Researchers Supporting Project number (RSPD2024R901), King Saud University, Riyadh, Saudi Arabia.

Data Availability Statement

Data are available upon request by email.

Acknowledgments

Researchers would like to thank and acknowledge the support of the Researchers Supporting Project number (RSPD2024R901), King Saud University, Riyadh, Saudi Arabia.

Conflicts of Interest

The authors declare no conflicts of interest.

References

  1. Monegro, A.; Muppidi, V.; Regunath, H. Hospital Acquired Infections. In Cambridge Handbook of Psychology, Health and Medicine; Cambridge University Press: Cambridge, UK, 2022; pp. 736–738. [Google Scholar]
  2. Settimo, G.; Gola, M.; Capolongo, S. The relevance of indoor air quality in hospital settings: From an exclusively biological issue to a global approach in the Italian context. Atmosphere 2020, 11, 361. [Google Scholar] [CrossRef]
  3. Mohamadi, F.; Fazeli, A. A review on applications of CFD modeling in COVID-19 pandemic. Arch. Comput. Methods Eng. 2022, 29, 3567–3586. [Google Scholar] [CrossRef] [PubMed]
  4. Wang, J.-X.; Cao, X.; Chen, Y.-P. An air distribution optimization of hospital wards for minimizing cross-infection. J. Clean. Prod. 2021, 279, 123431. [Google Scholar] [CrossRef] [PubMed]
  5. Ibrahim, F.; Samsudin, E.Z.; Ishak, A.R.; Sathasivam, J. Hospital indoor air quality and its relationships with building design, building operation, and occupant-related factors: A mini-review. Front. Public Health 2022, 10, 1067764. [Google Scholar] [CrossRef]
  6. Kanchongkittiphon, W.; Mendell, M.J.; Gaffin, J.M.; Wang, G.; Phipatanakul, W. Indoor environmental exposures and exacerbation of asthma: An update to the 2000 review by the Institute of Medicine. Environ. Health Perspect. 2015, 123, 6–20. [Google Scholar] [CrossRef] [PubMed]
  7. Baudet, A.; Baurès, E.; Guegan, H.; Blanchard, O.; Guillaso, M.; Le Cann, P.; Gangneux, J.-P.; Florentin, A. Indoor air quality in healthcare and care facilities: Chemical pollutants and microbiological contaminants. Atmosphere 2021, 12, 1337. [Google Scholar] [CrossRef]
  8. Tellier, R. Aerosol transmission of influenza A virus: A review of new studies. J. R. Soc. Interface 2009, 6 (Suppl. 6), S783–S790. [Google Scholar] [CrossRef] [PubMed]
  9. Morawska, L.; Cao, J. Airborne transmission of SARS-CoV-2: The world should face the reality. Environ. Int. 2020, 139, 105730. [Google Scholar] [CrossRef]
  10. Gralton, J.; Tovey, E.; McLaws, M.L.; Rawlinson, W.D. The role of particle size in aerosolised pathogen transmission: A review. J. Infect. 2011, 62, 1–13. [Google Scholar] [CrossRef] [PubMed]
  11. World Health Organization. Roadmap to Improve and Ensure Good Indoor Ventilation in the Context of COVID-19; World Health Organization: Geneva, Switzerland, 2021. [Google Scholar]
  12. Bolashikov, Z.D.; Melikov, A.K. Methods for air cleaning and protection of building occupants from airborne pathogens. Build. Environ. 2009, 44, 1378–1385. [Google Scholar] [CrossRef] [PubMed]
  13. Aryal, P.; Leephakpreeda, T. CFD analysis on thermal comfort and indoor air quality affected by partitions in air-conditioned building. Appl. Mech. Mater. 2016, 836, 121–126. [Google Scholar] [CrossRef]
  14. Jia, L.-R.; Han, J.; Chen, X.; Li, Q.-Y.; Lee, C.-C.; Fung, Y.-H. Interaction between thermal comfort, indoor air quality and ventilation energy consumption of educational buildings: A comprehensive review. Buildings 2021, 11, 591. [Google Scholar] [CrossRef]
  15. Tsang, T.-W.; Mui, K.-W.; Wong, L.-T. Computational Fluid Dynamics (CFD) studies on airborne transmission in hospitals: A review on the research approaches and the challenges. J. Build. Eng. 2023, 63, 105533. [Google Scholar] [CrossRef]
  16. Mousavi, E.S.; Kananizadeh, N.; Martinello, R.A.; Sherman, J.D. COVID-19 outbreak and hospital air quality: A systematic review of evidence on air filtration and recirculation. Environ. Sci. Technol. 2020, 55, 4134–4147. [Google Scholar] [CrossRef]
  17. Altwijri, O.; Javed, R.; Albedah, A.; Addokhi, A. 3D Modeling and Simulation of Airflow and Aerosol Deposition of Idealized Human Oral Airways. J. Biomater. Tissue Eng. 2018, 8, 933–940. [Google Scholar] [CrossRef]
  18. Kim, M.; Jeong, S.G.; Park, J.; Lee, J.H. Assessment of pre-filter systems to control indoor inflow of particulate matter. J. Build. Eng. 2021, 43, 103052. [Google Scholar] [CrossRef]
  19. Algabri, Y.A.; Altwijri, O.; Chatpun, S. Visualization of Blood Flow in AAA Patient-Specific Geometry: 3-D Reconstruction and Simulation Procedures. BioNanoScience 2019, 9, 966–976. [Google Scholar] [CrossRef]
  20. Sola Martinez, R.A.; Pastor Hernandez, J.M.; Yanes Torrado, O.; Canovas Diaz, M.; de Diego Puente, T.; Vinaixa Crevillent, M. Exhaled volatile organic compounds analysis in clinical pediatrics: A systematic review. Pediatr. Res. 2021, 89, 1352–1363. [Google Scholar] [CrossRef] [PubMed]
  21. Maurya, L.; Kaur, P.; Chawla, D.; Mahapatra, P. Non-contact breathing rate monitoring in newborns: A review. Comput. Biol. Med. 2021, 132, 104321. [Google Scholar] [CrossRef] [PubMed]
  22. Kaewchoothong, N.; Algabri, Y.A.; Assawalertsakul, T.; Nuntadusit, C.; Chatpun, S. Computational Study of Abdominal Aortic Aneurysms with Severely Angulated Neck Based on Transient Hemodynamics Using an Idealized Model. Appl. Sci. 2022, 12, 2113. [Google Scholar] [CrossRef]
Figure 1. Model 1; (A) the NICU room at KAAUH, and (B) the 3D model construction.
Processes 12 02799 g001
Figure 2. Model 2; (A) the NICU room at KAAUH, and (B) the 3D model construction.
Processes 12 02799 g002
Figure 3. NICU room. (A,C) Exhaled air with natural route to return to vents. (B,D) Exhaled air with fastest route to return to vents.
Processes 12 02799 g003aProcesses 12 02799 g003b
Figure 4. Isolation room. (A,B) Exhaled air with natural route to return to vents (C,D). Exhaled air with fastest route to return to vents.
Processes 12 02799 g004aProcesses 12 02799 g004b
Disclaimer/Publisher’s Note: The statements, opinions and data contained in all publications are solely those of the individual author(s) and contributor(s) and not of MDPI and/or the editor(s). MDPI and/or the editor(s) disclaim responsibility for any injury to people or property resulting from any ideas, methods, instructions or products referred to in the content.

