
Prediction of Chemical Composition of Gas Combustion Products from Thermal Waste Conversion


Abstract
1. Introduction
1.1. Energy Potential of Thermal Waste Conversion Products
1.1.1. Gaseous Products
1.1.2. Solid Products
1.1.3. Liquid Products
1.2. Utilisation of Gases from Thermal Conversion
- The possibility of managing environmentally hazardous plastic waste, RDF waste and post-production bio-waste, as well as the gaseous products of the thermal conversion of these wastes;
- The possibility of reducing the use of natural gas to fuel heating furnaces, which will translate into economic benefits.
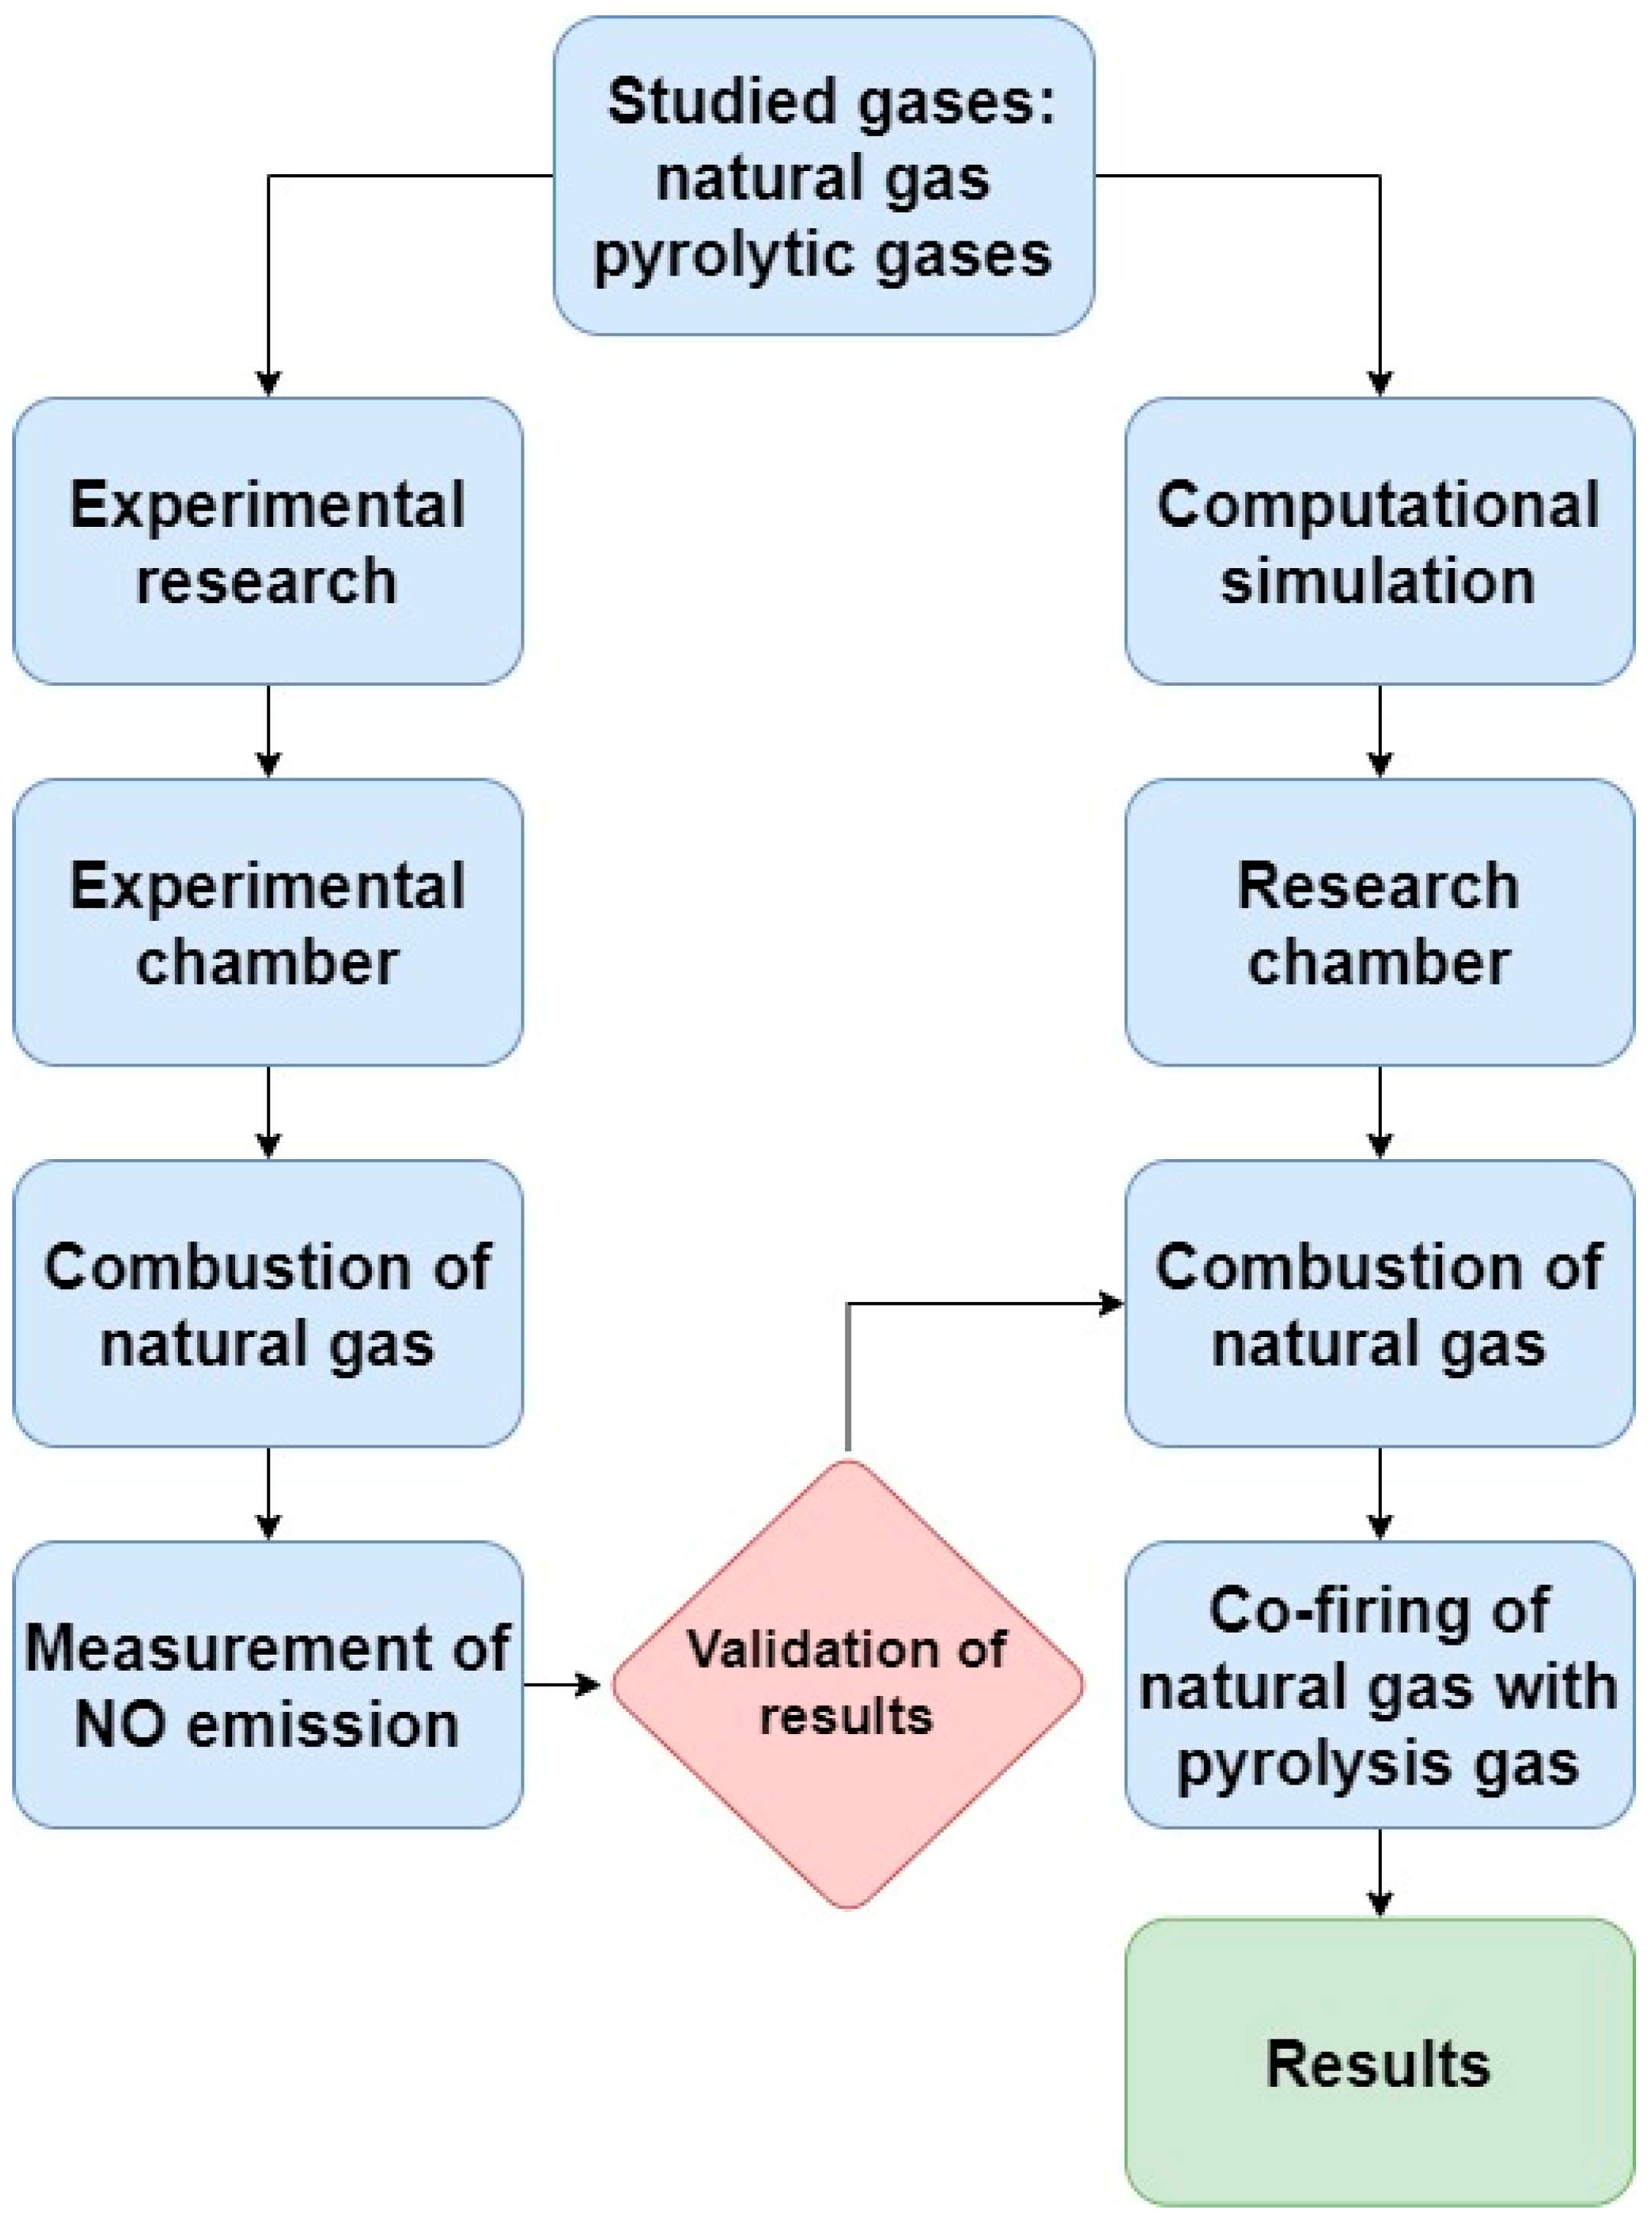
2. Materials and Methods
- Natural gas combustion.
- Co-combustion of natural gas with pyrolysis gases from the thermal conversion of various wastes.
2.1. Material
2.2. Modelling Procedure in Ansys Chemkin PRO (Ver. 2021 R1)
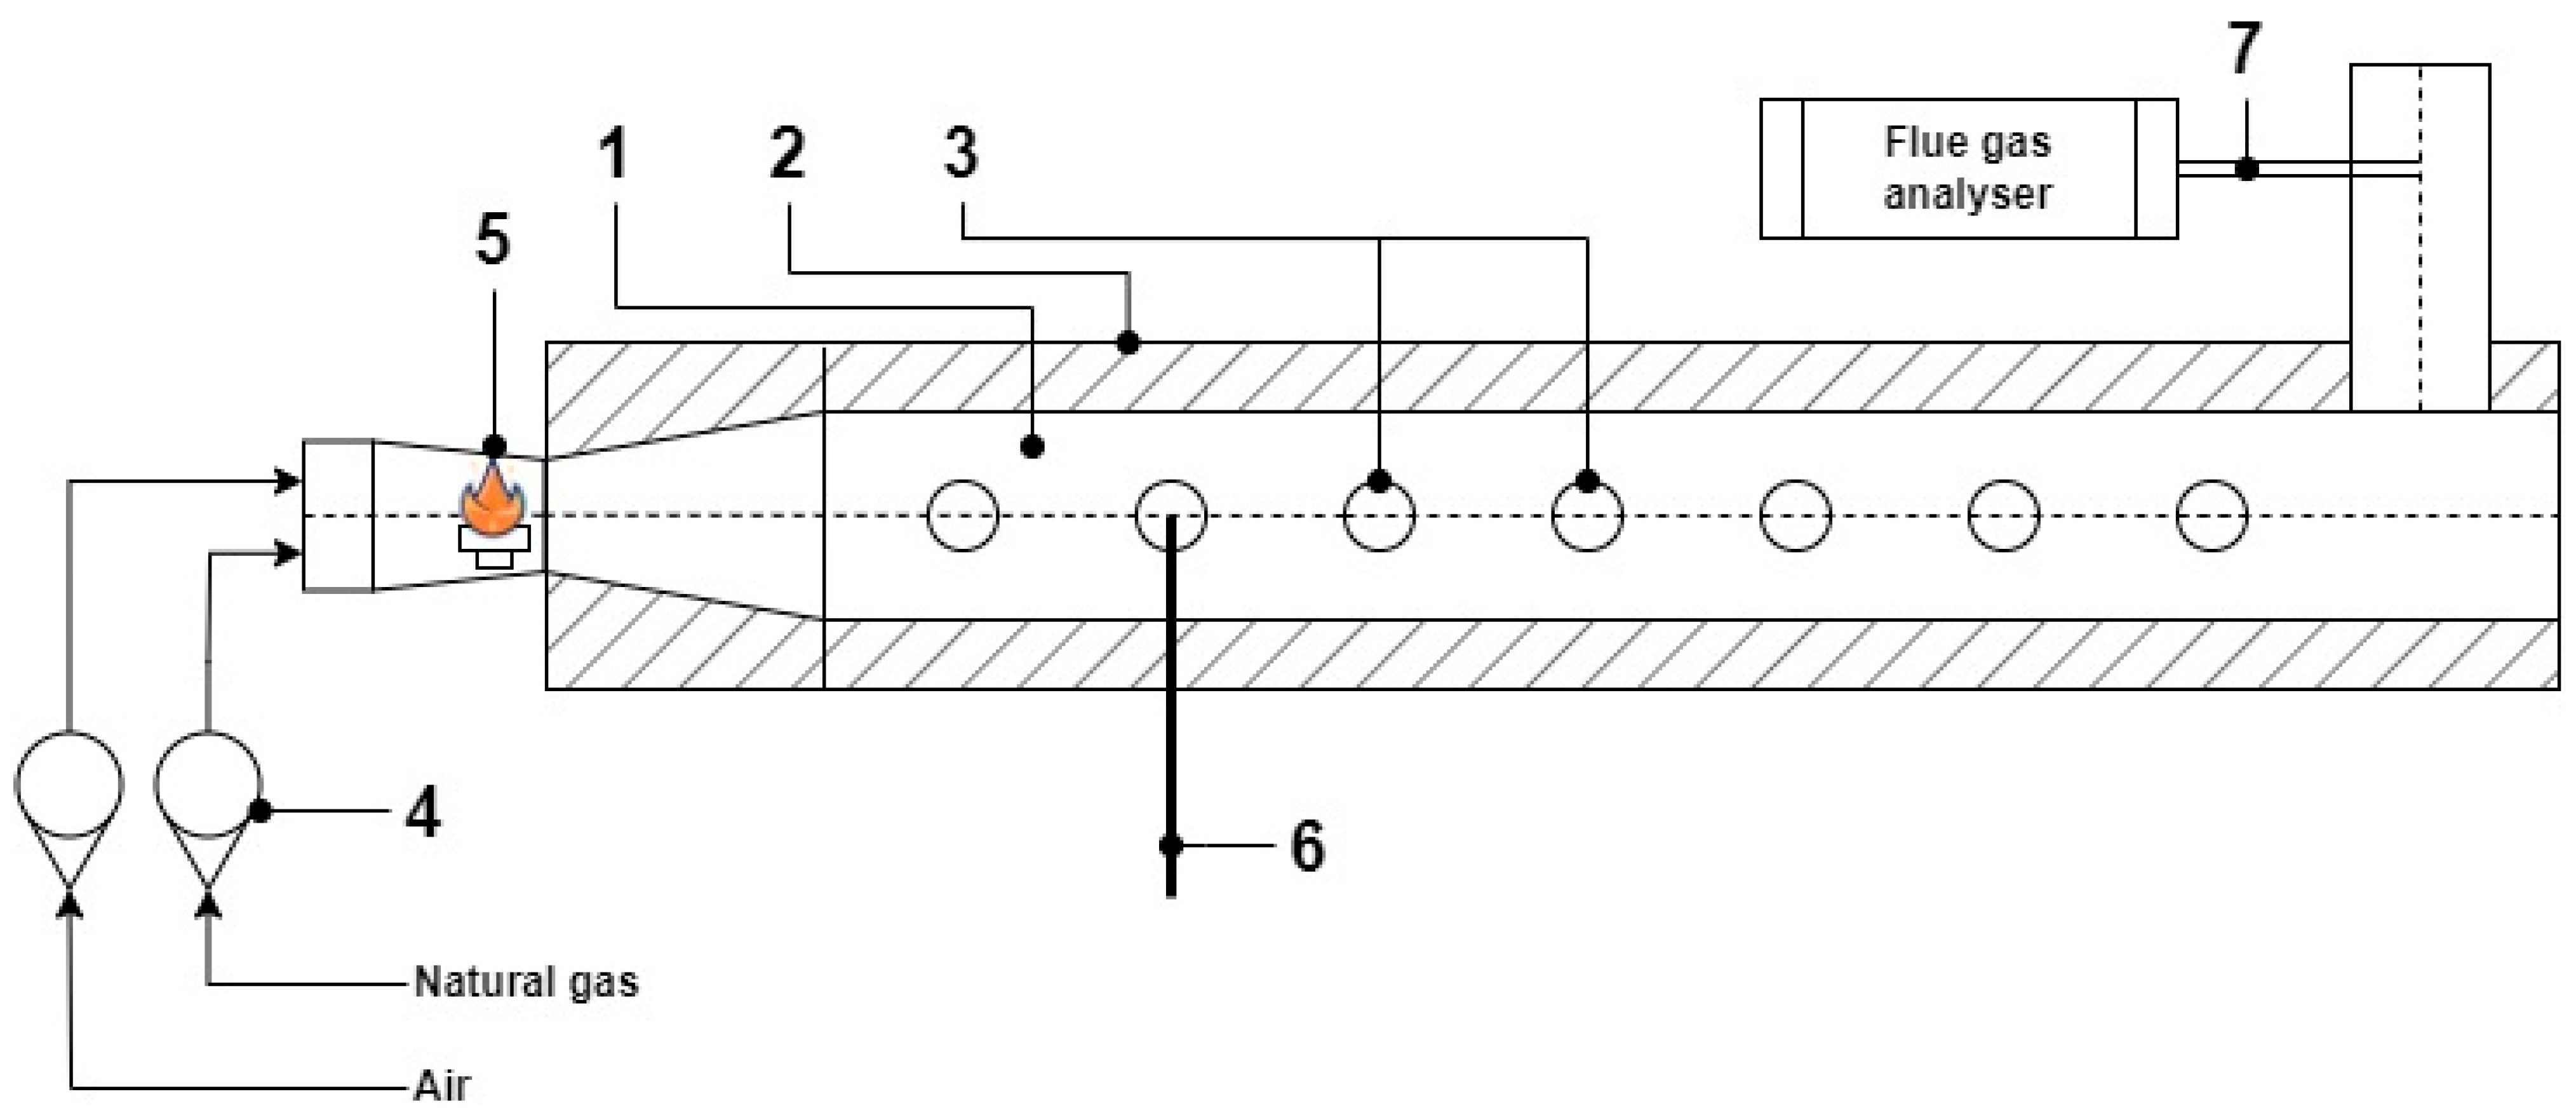
2.3. Preliminary Research
2.4. Computer Simulations
- Mass flow of reactants (air and gas).
- Chemical composition of reagents.
- Temperature of supplied media.
- Pressure.
- Adiabatic combustion temperature.
- Temperature profile in the combustion chamber.
- Chamber dimensions (diameter, length).
- Residence time of the reagents in the highest temperature zone.
3. Results
3.1. Combustion of Natural Gas in a Laboratory Chamber
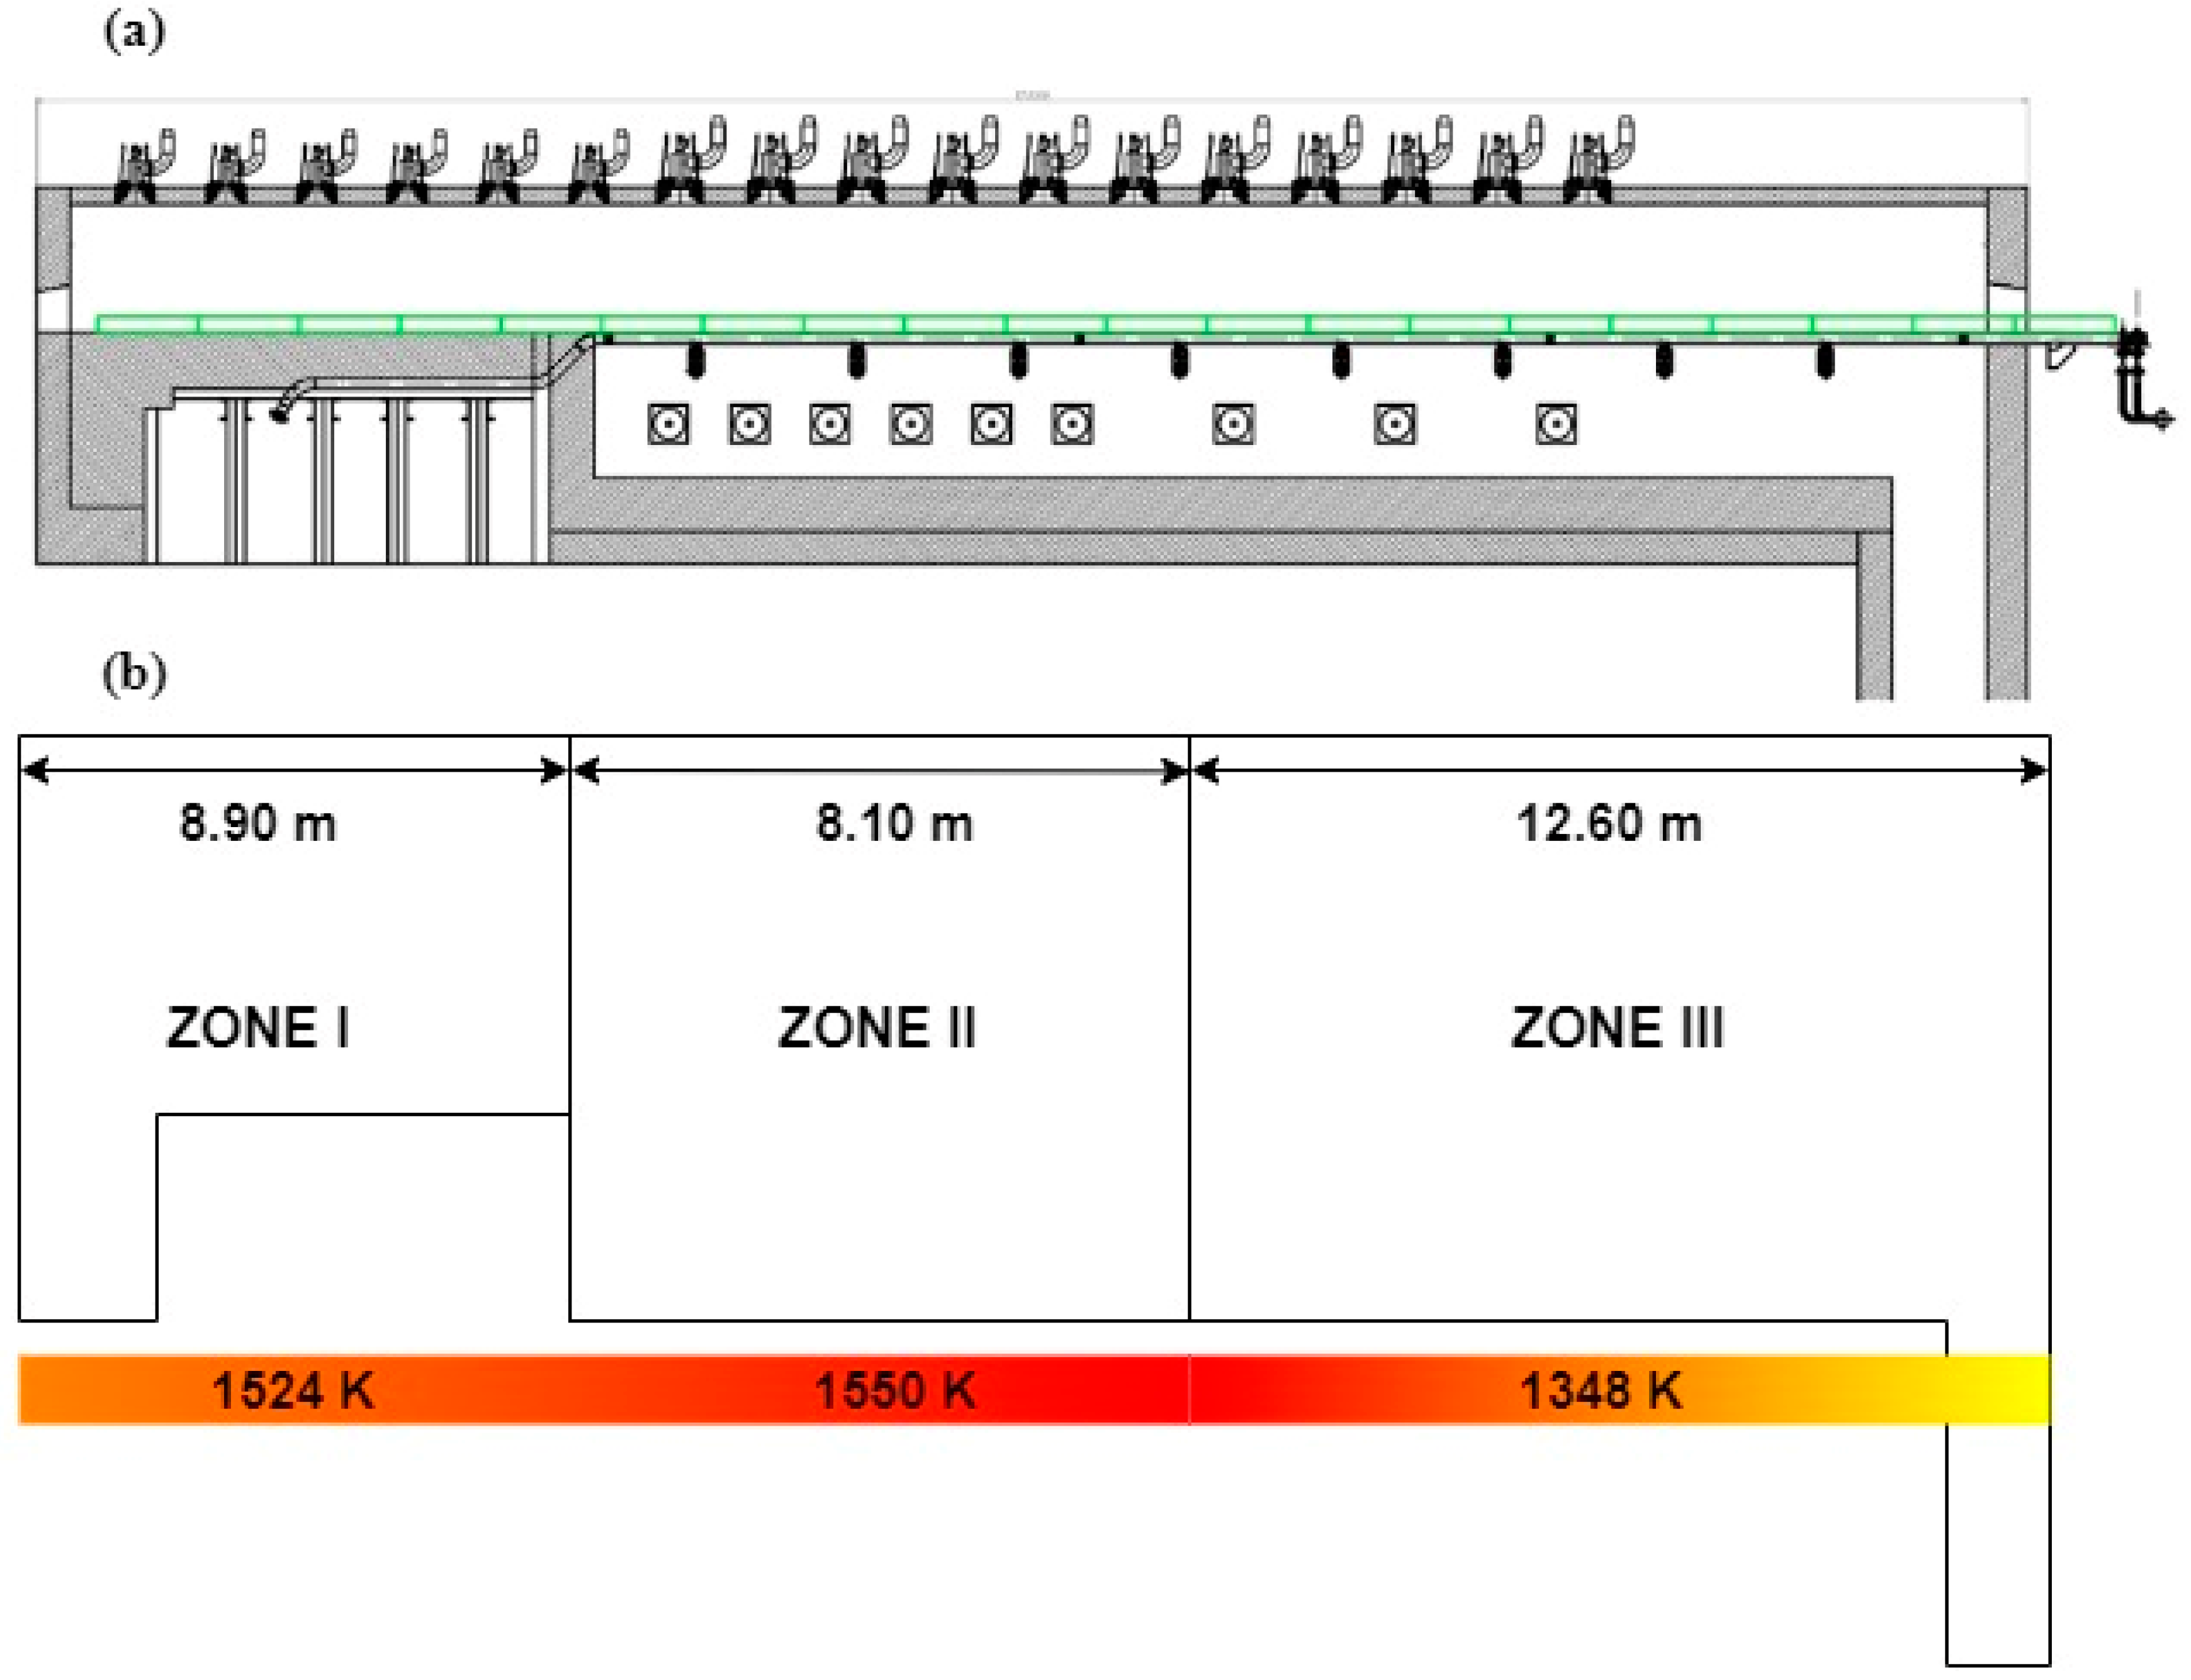
3.2. Co-Combustion of Gases from Waste Pyrolysis in Reheating Furnace
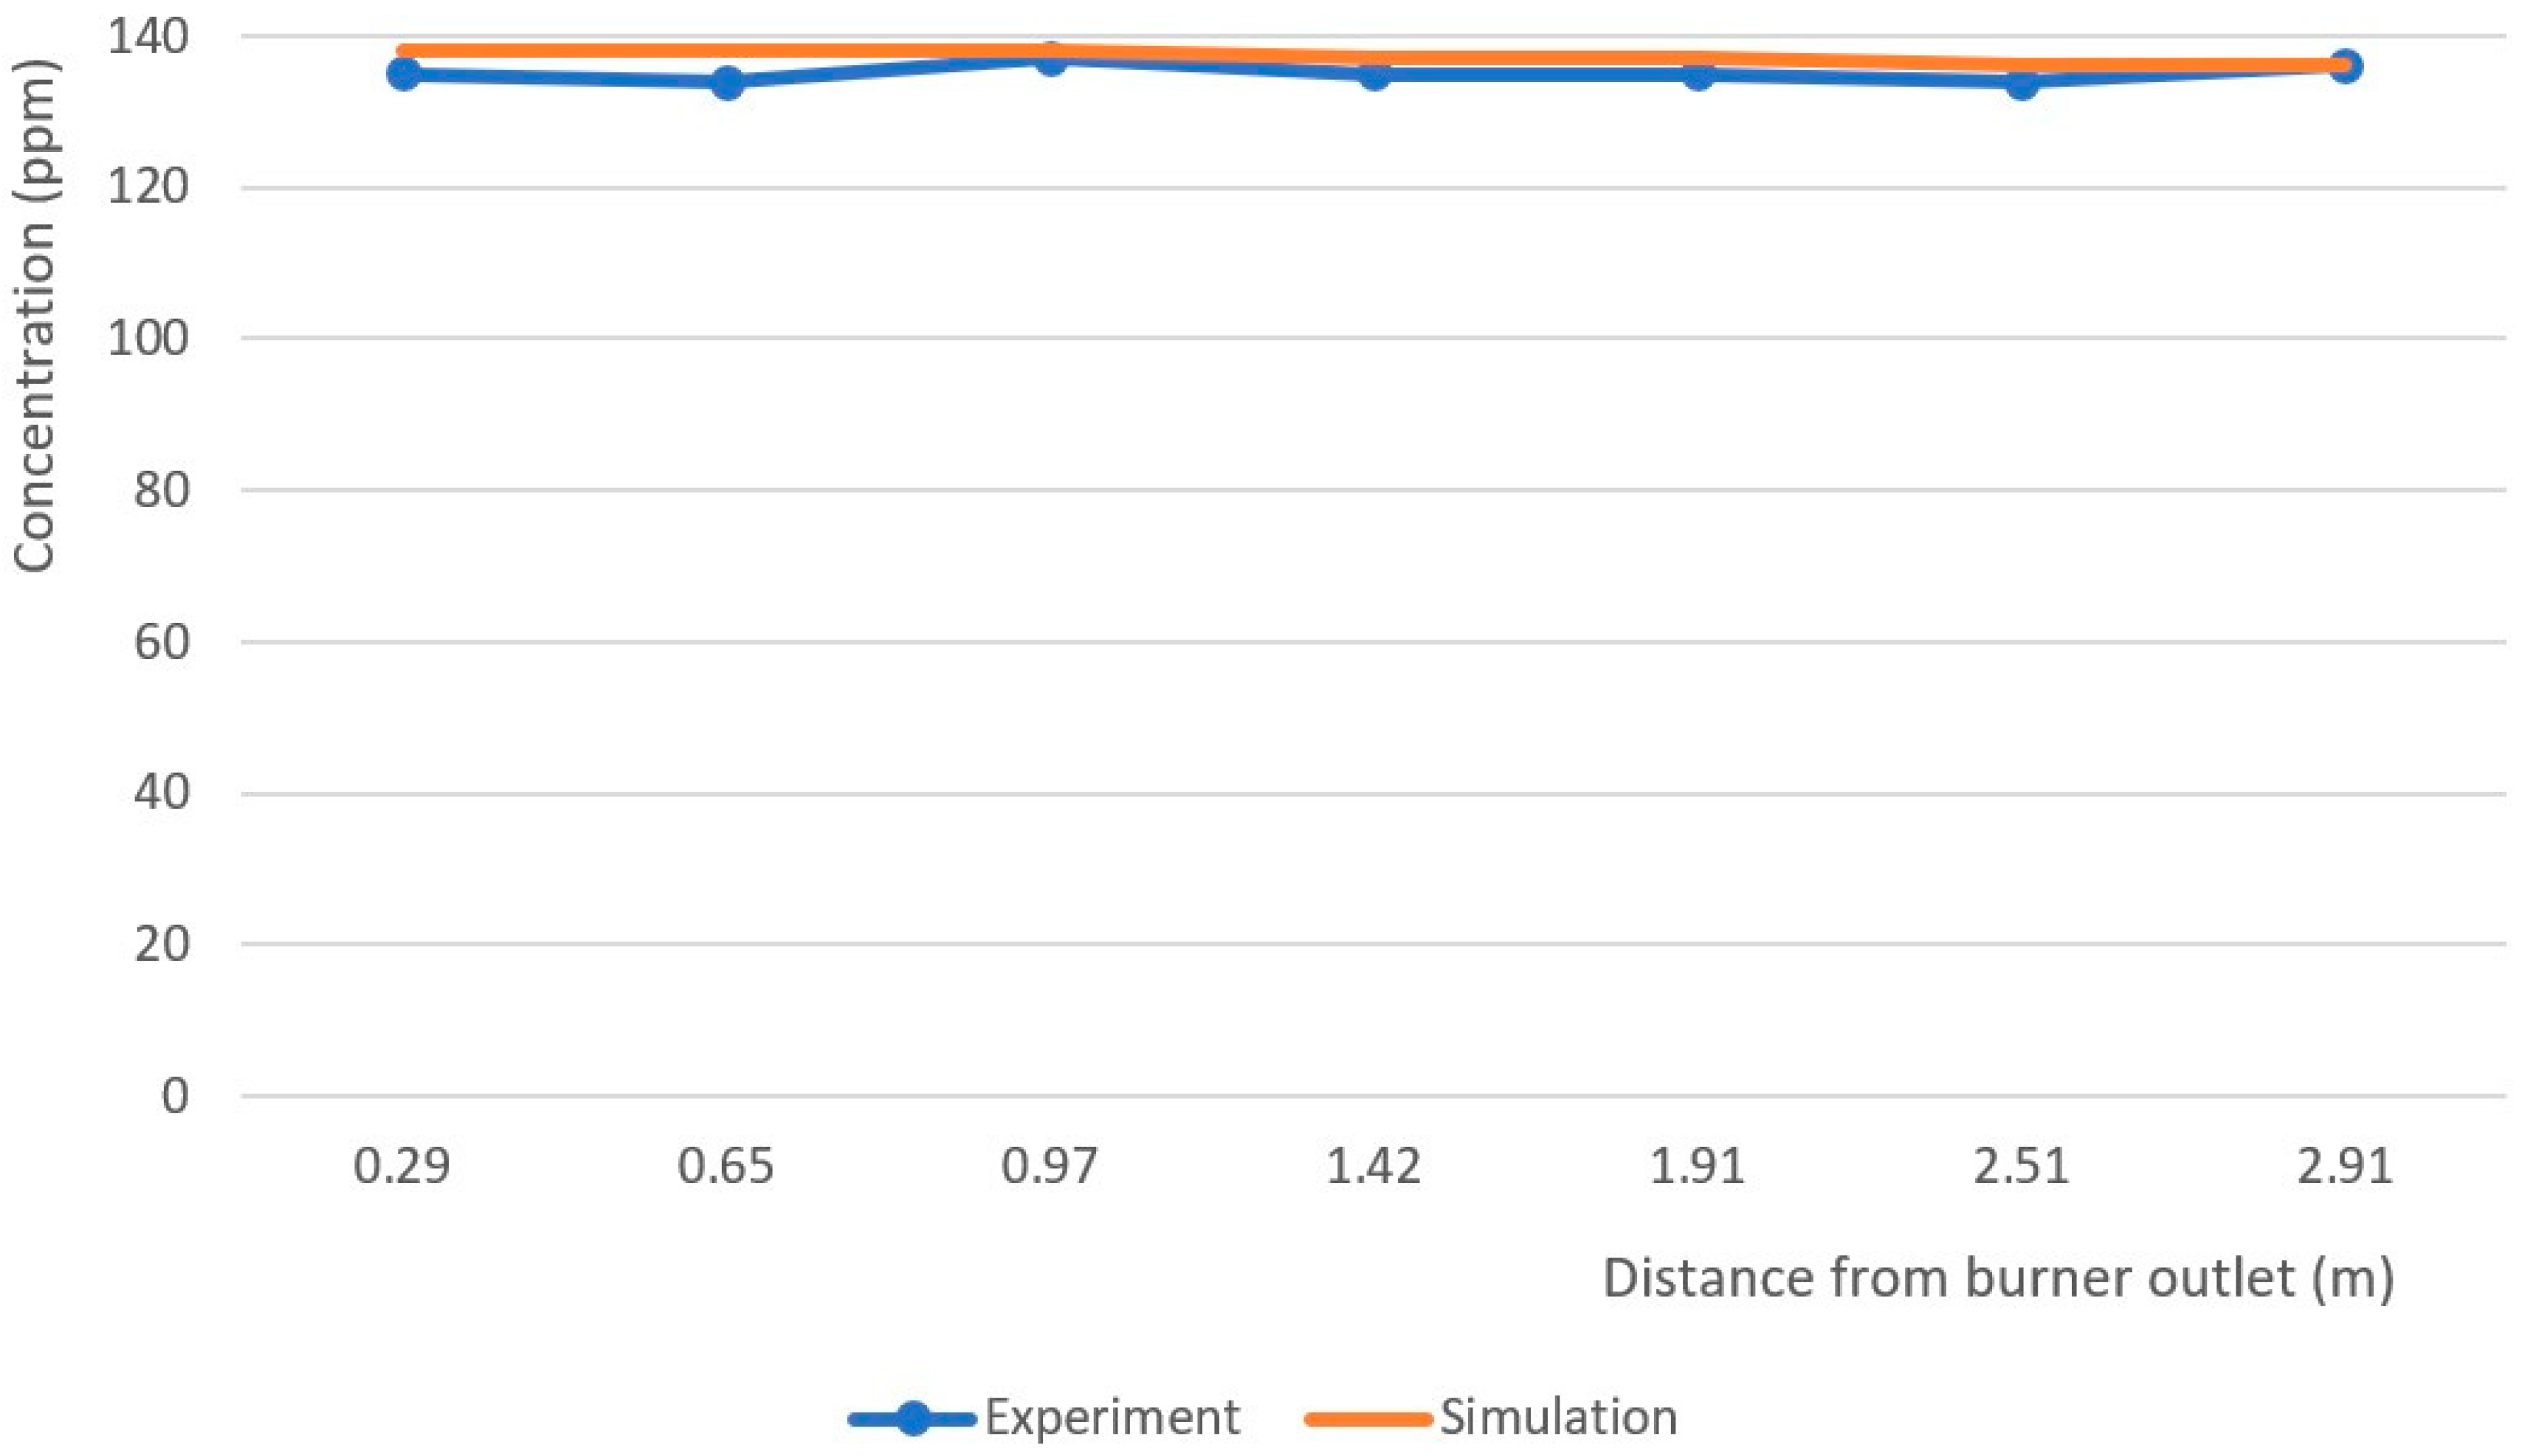
3.3. Measurement Error Analysis
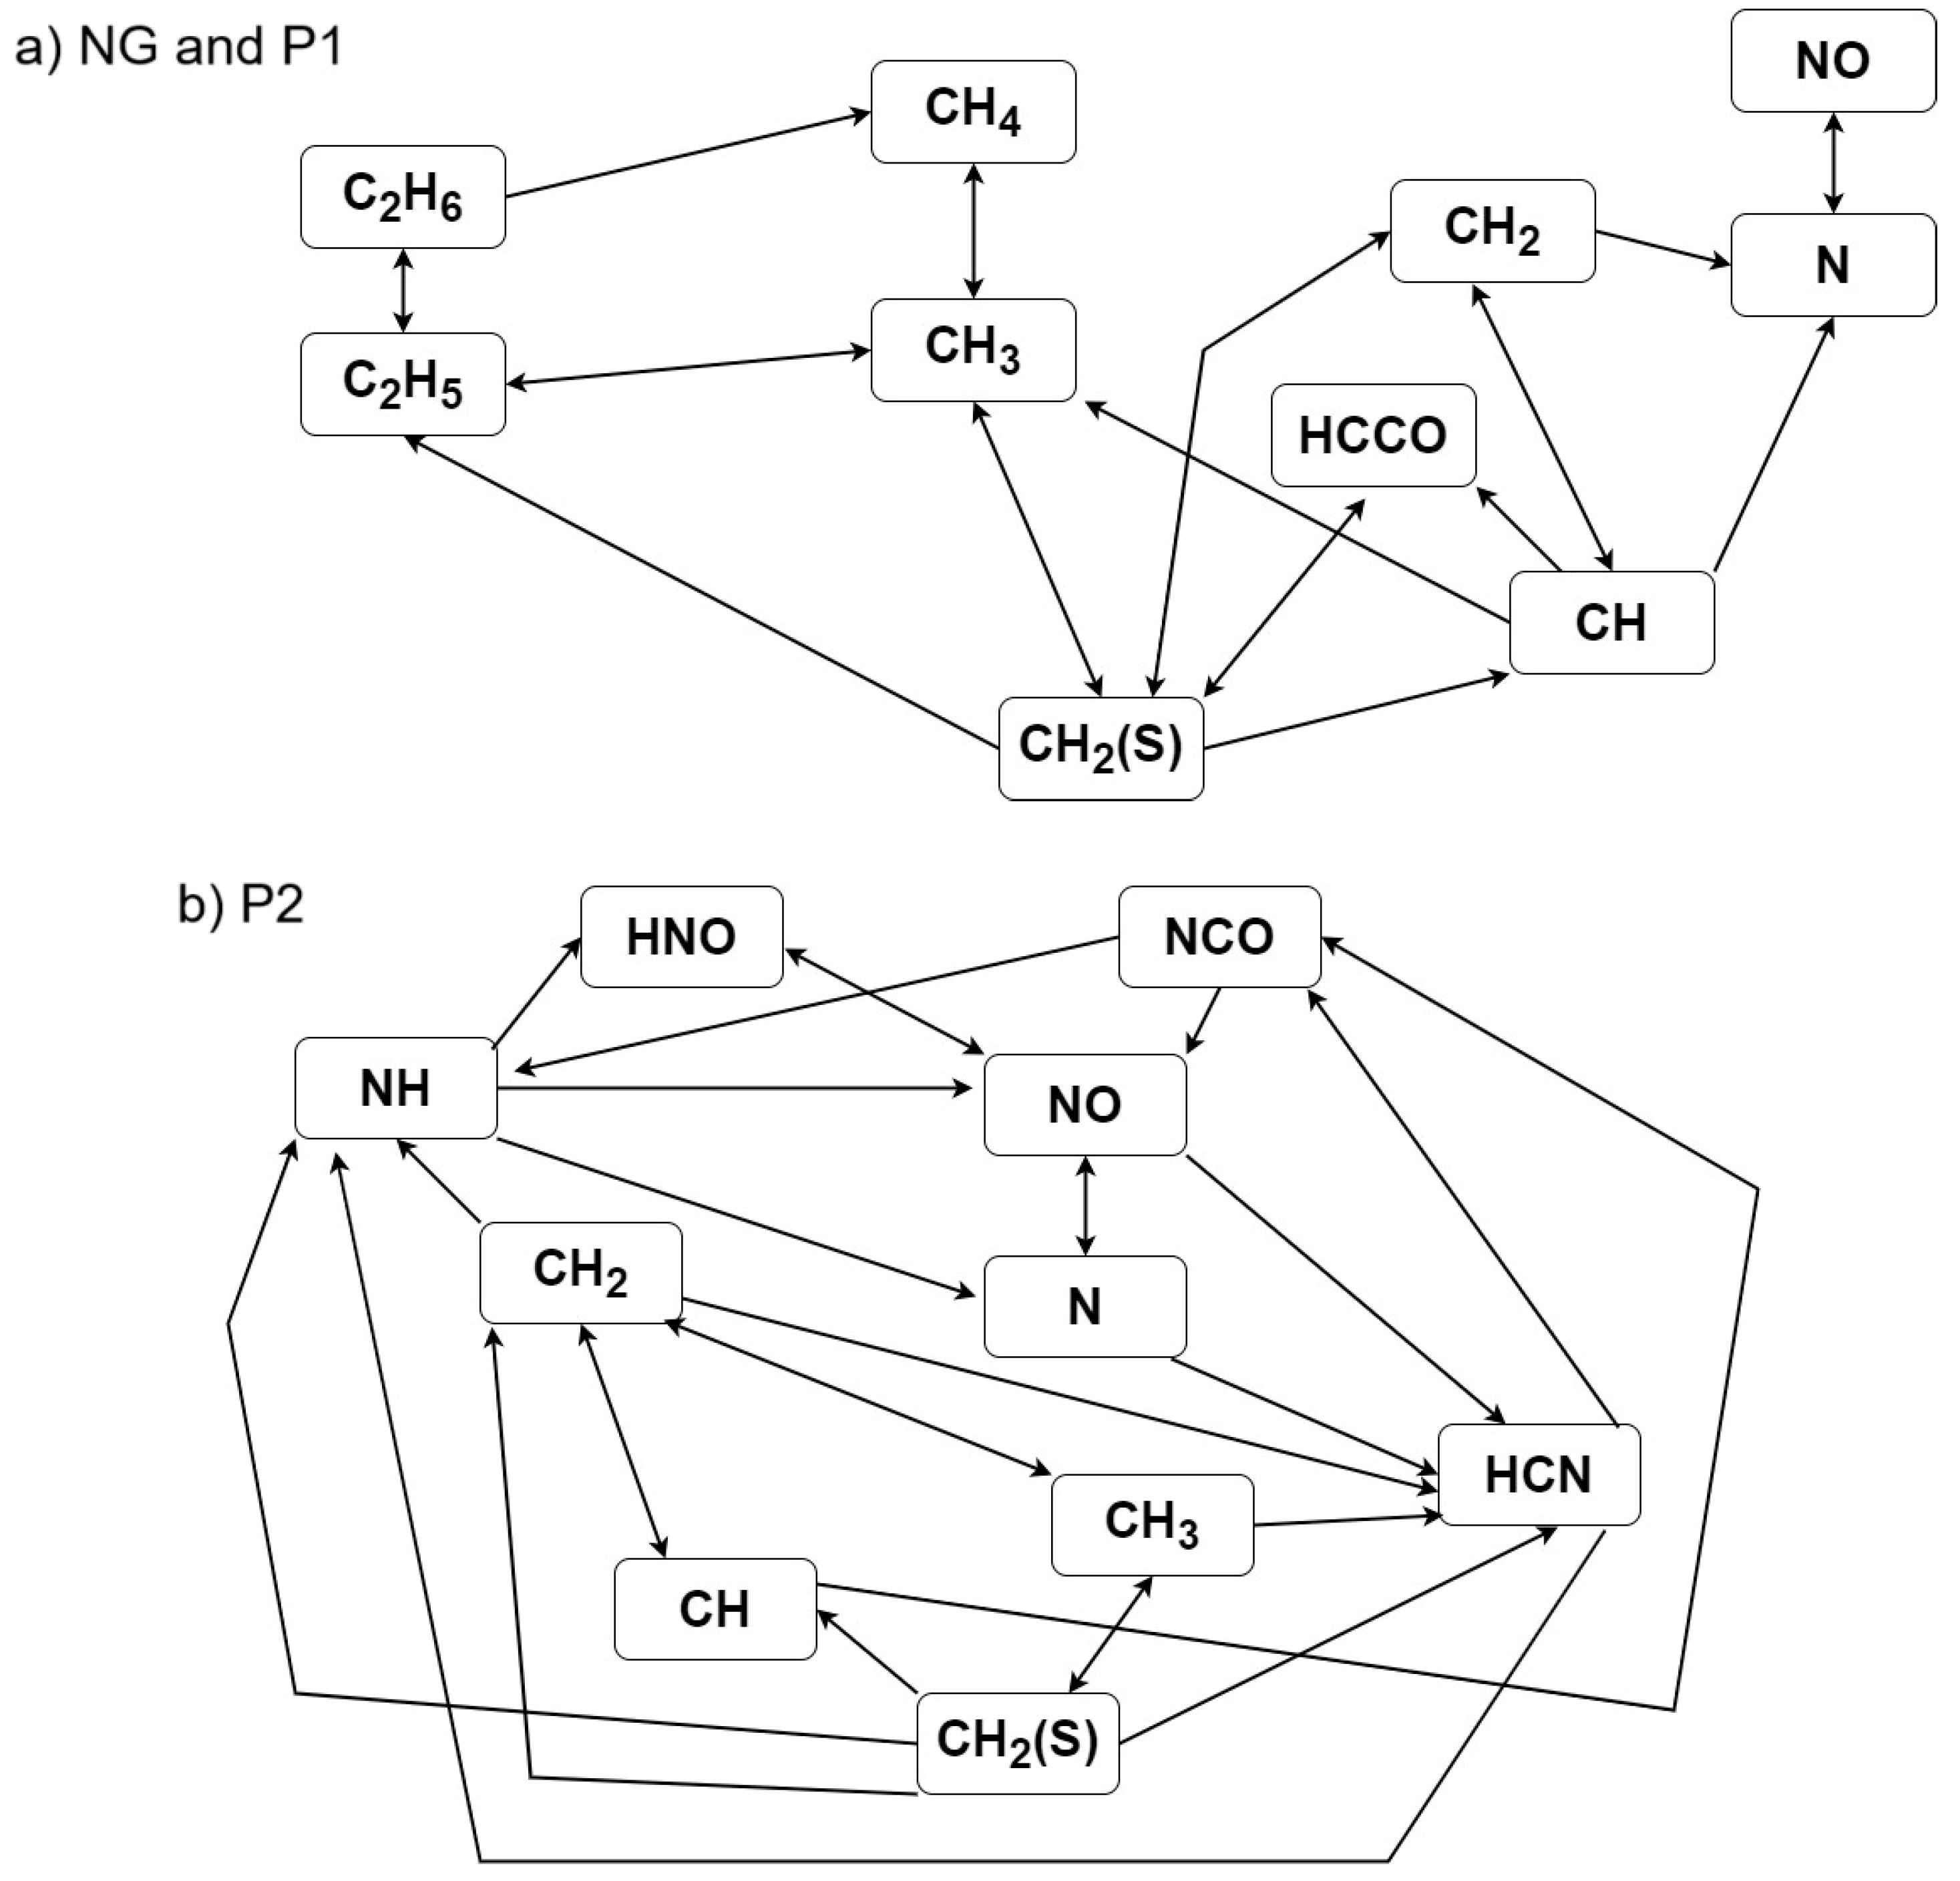
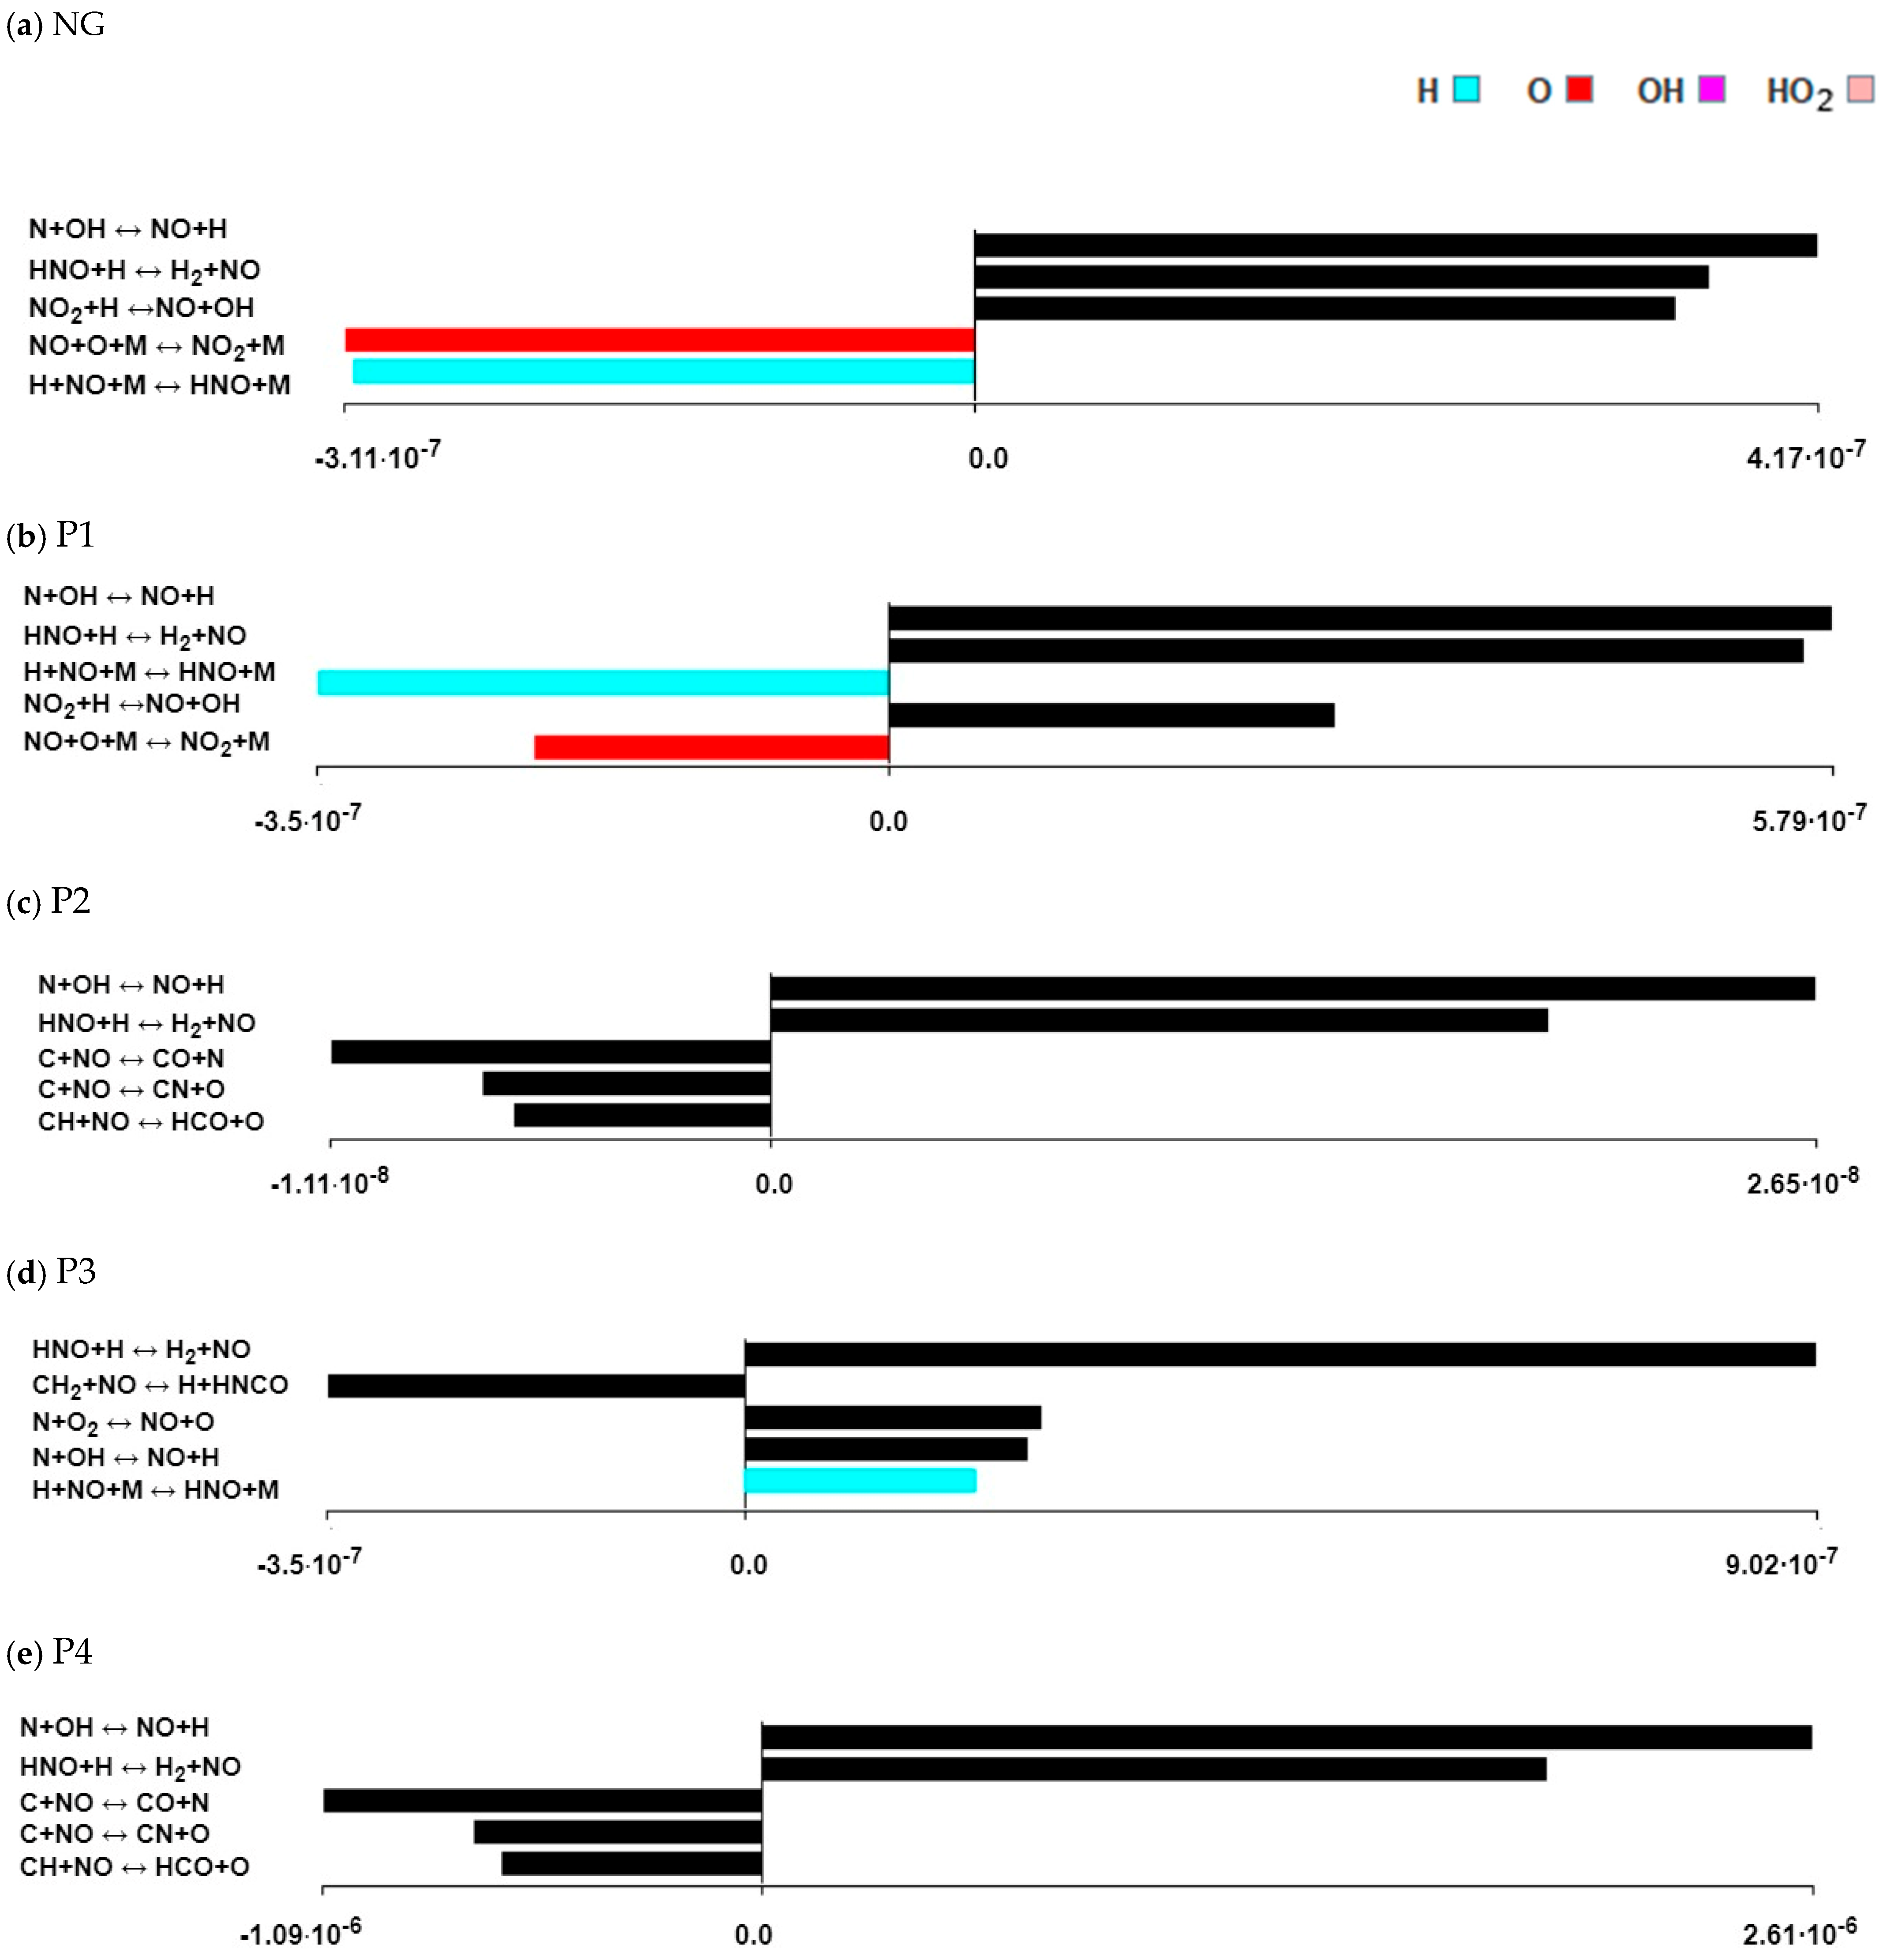
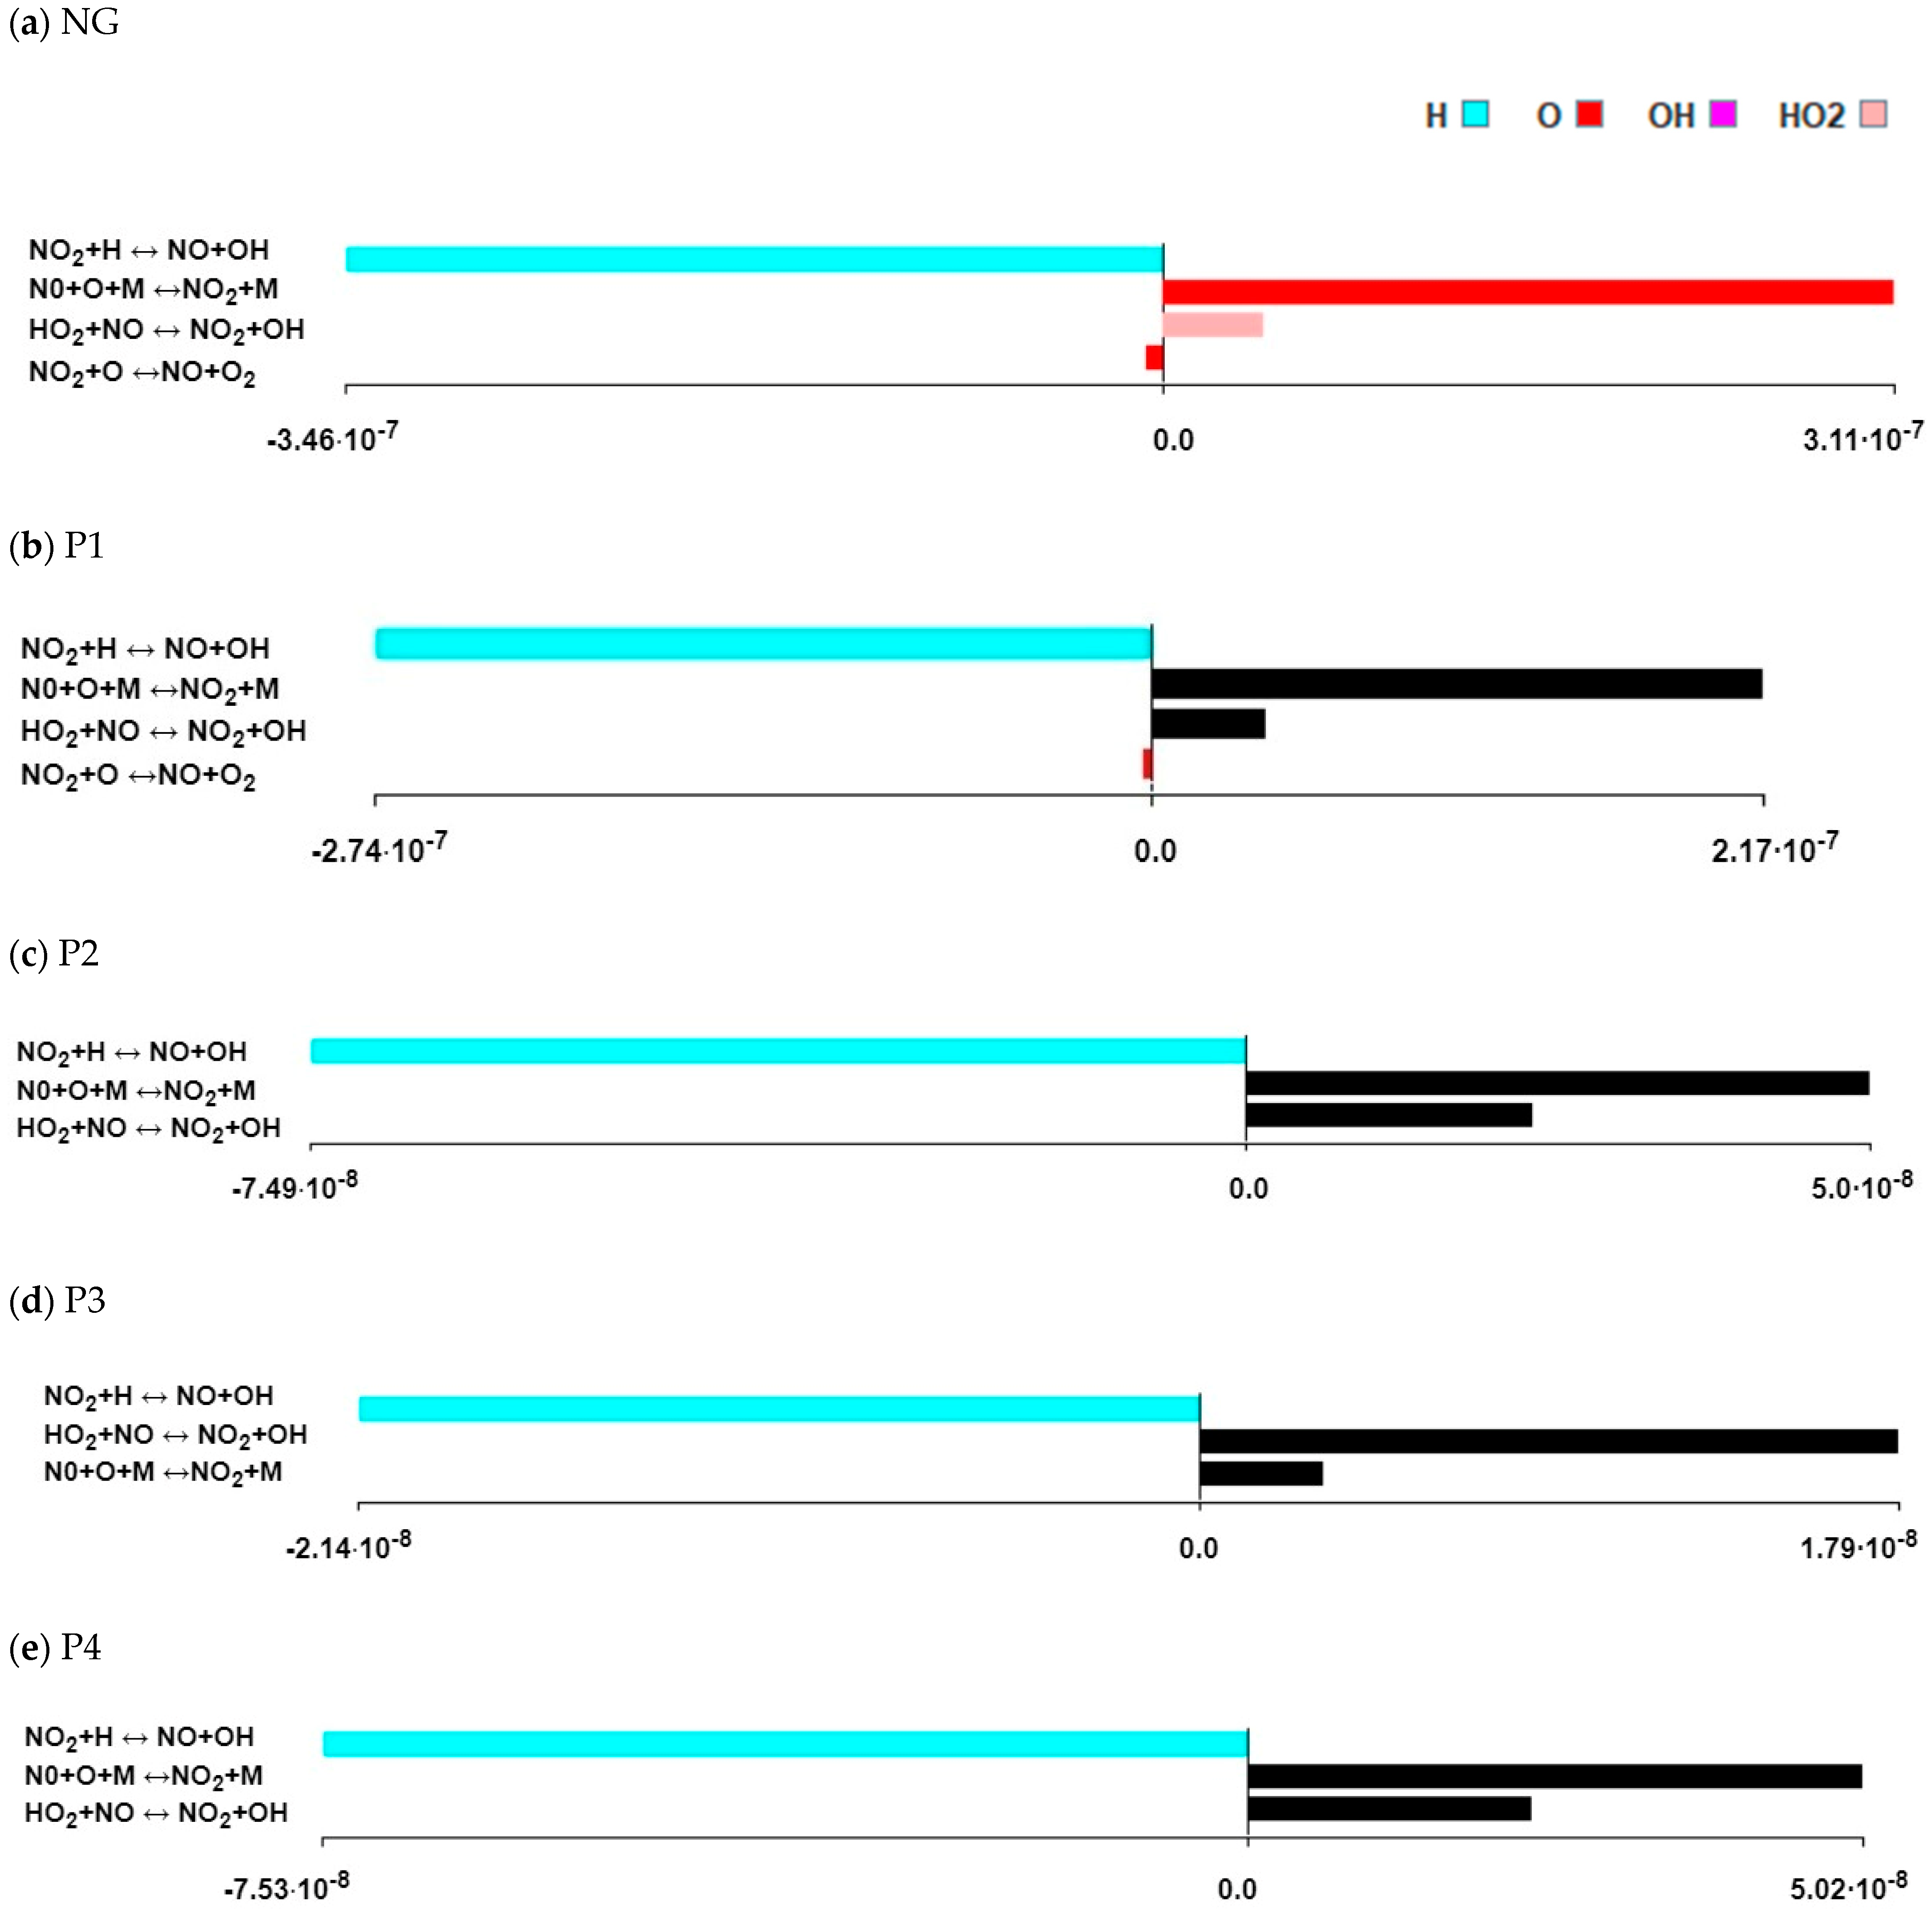
3.4. Formation Path Analysis and Sensitivity Analysis
4. Conclusions
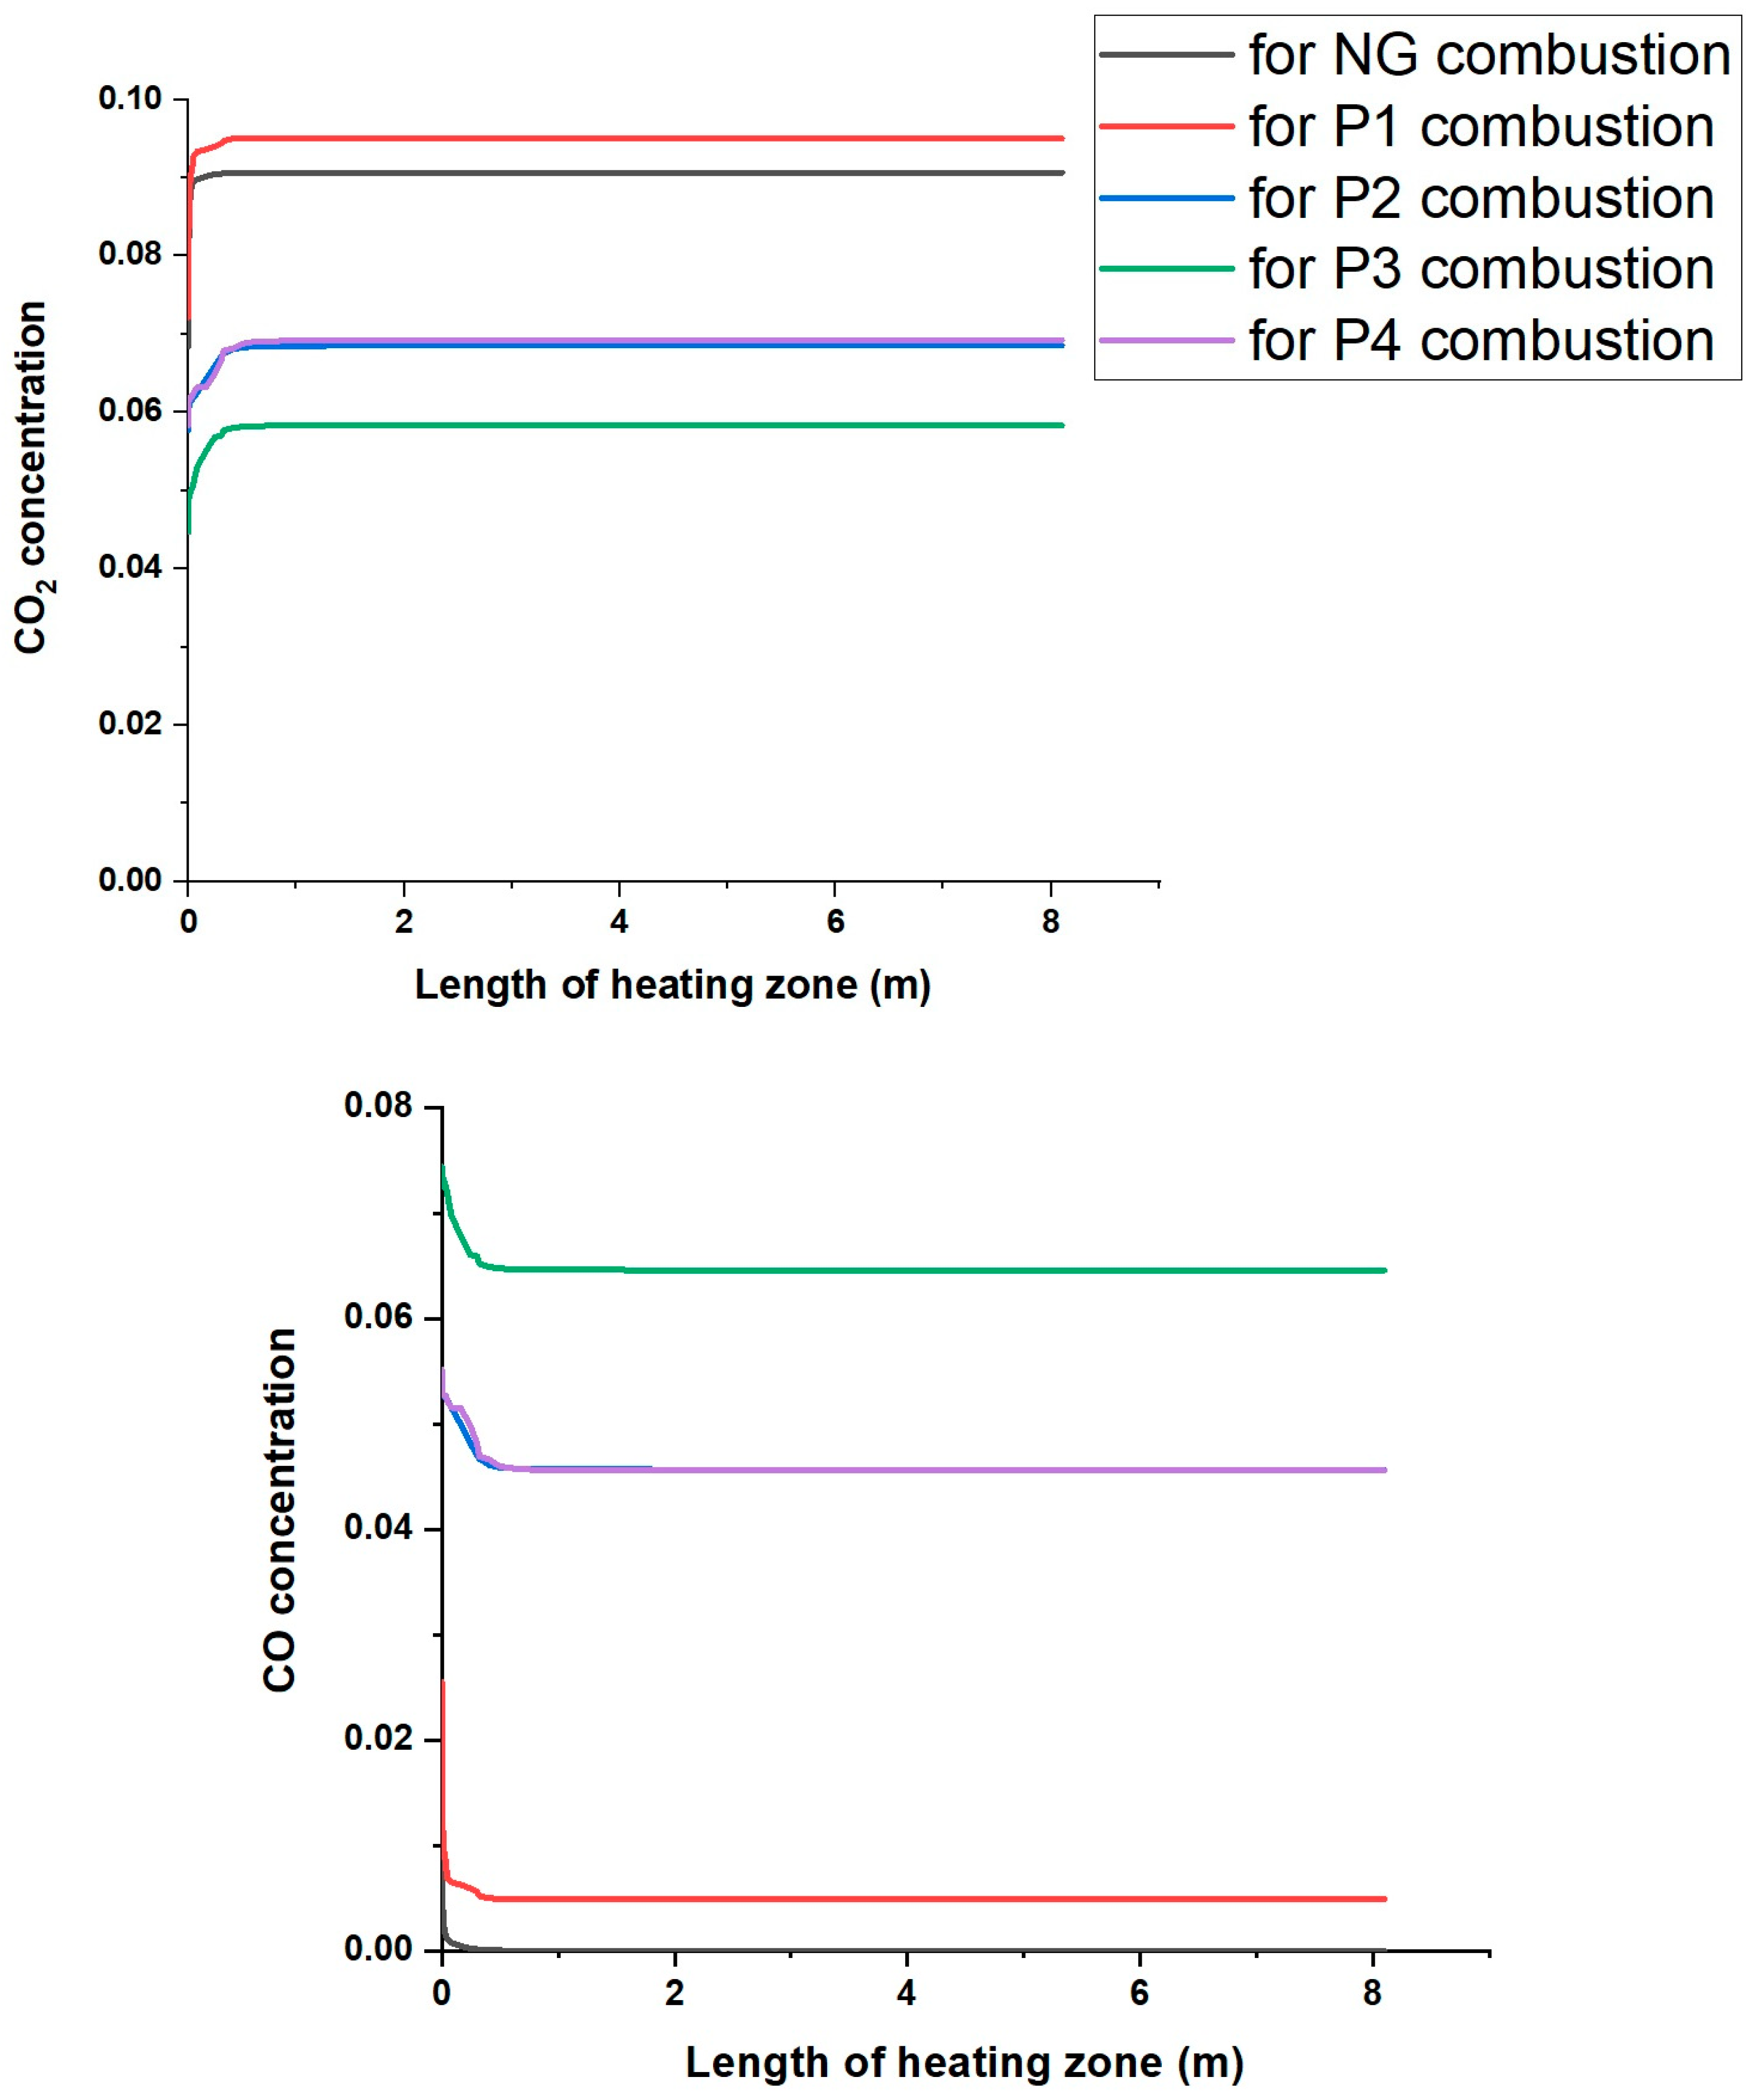
- The performed computer simulations show that the chemical composition of the flue gases resulting from the co-combustion of pyrolysis gases is qualitatively similar to the composition of flue gases obtained from the combustion of natural gas alone.
- The results most similar to the combustion of natural gas alone, in terms of the composition of the flue gases, were obtained for the P1 mixture.
- The greatest influence on the differences in the composition of the resulting flue gases is the composition of the pyrolysis gas co-fired with natural gas.
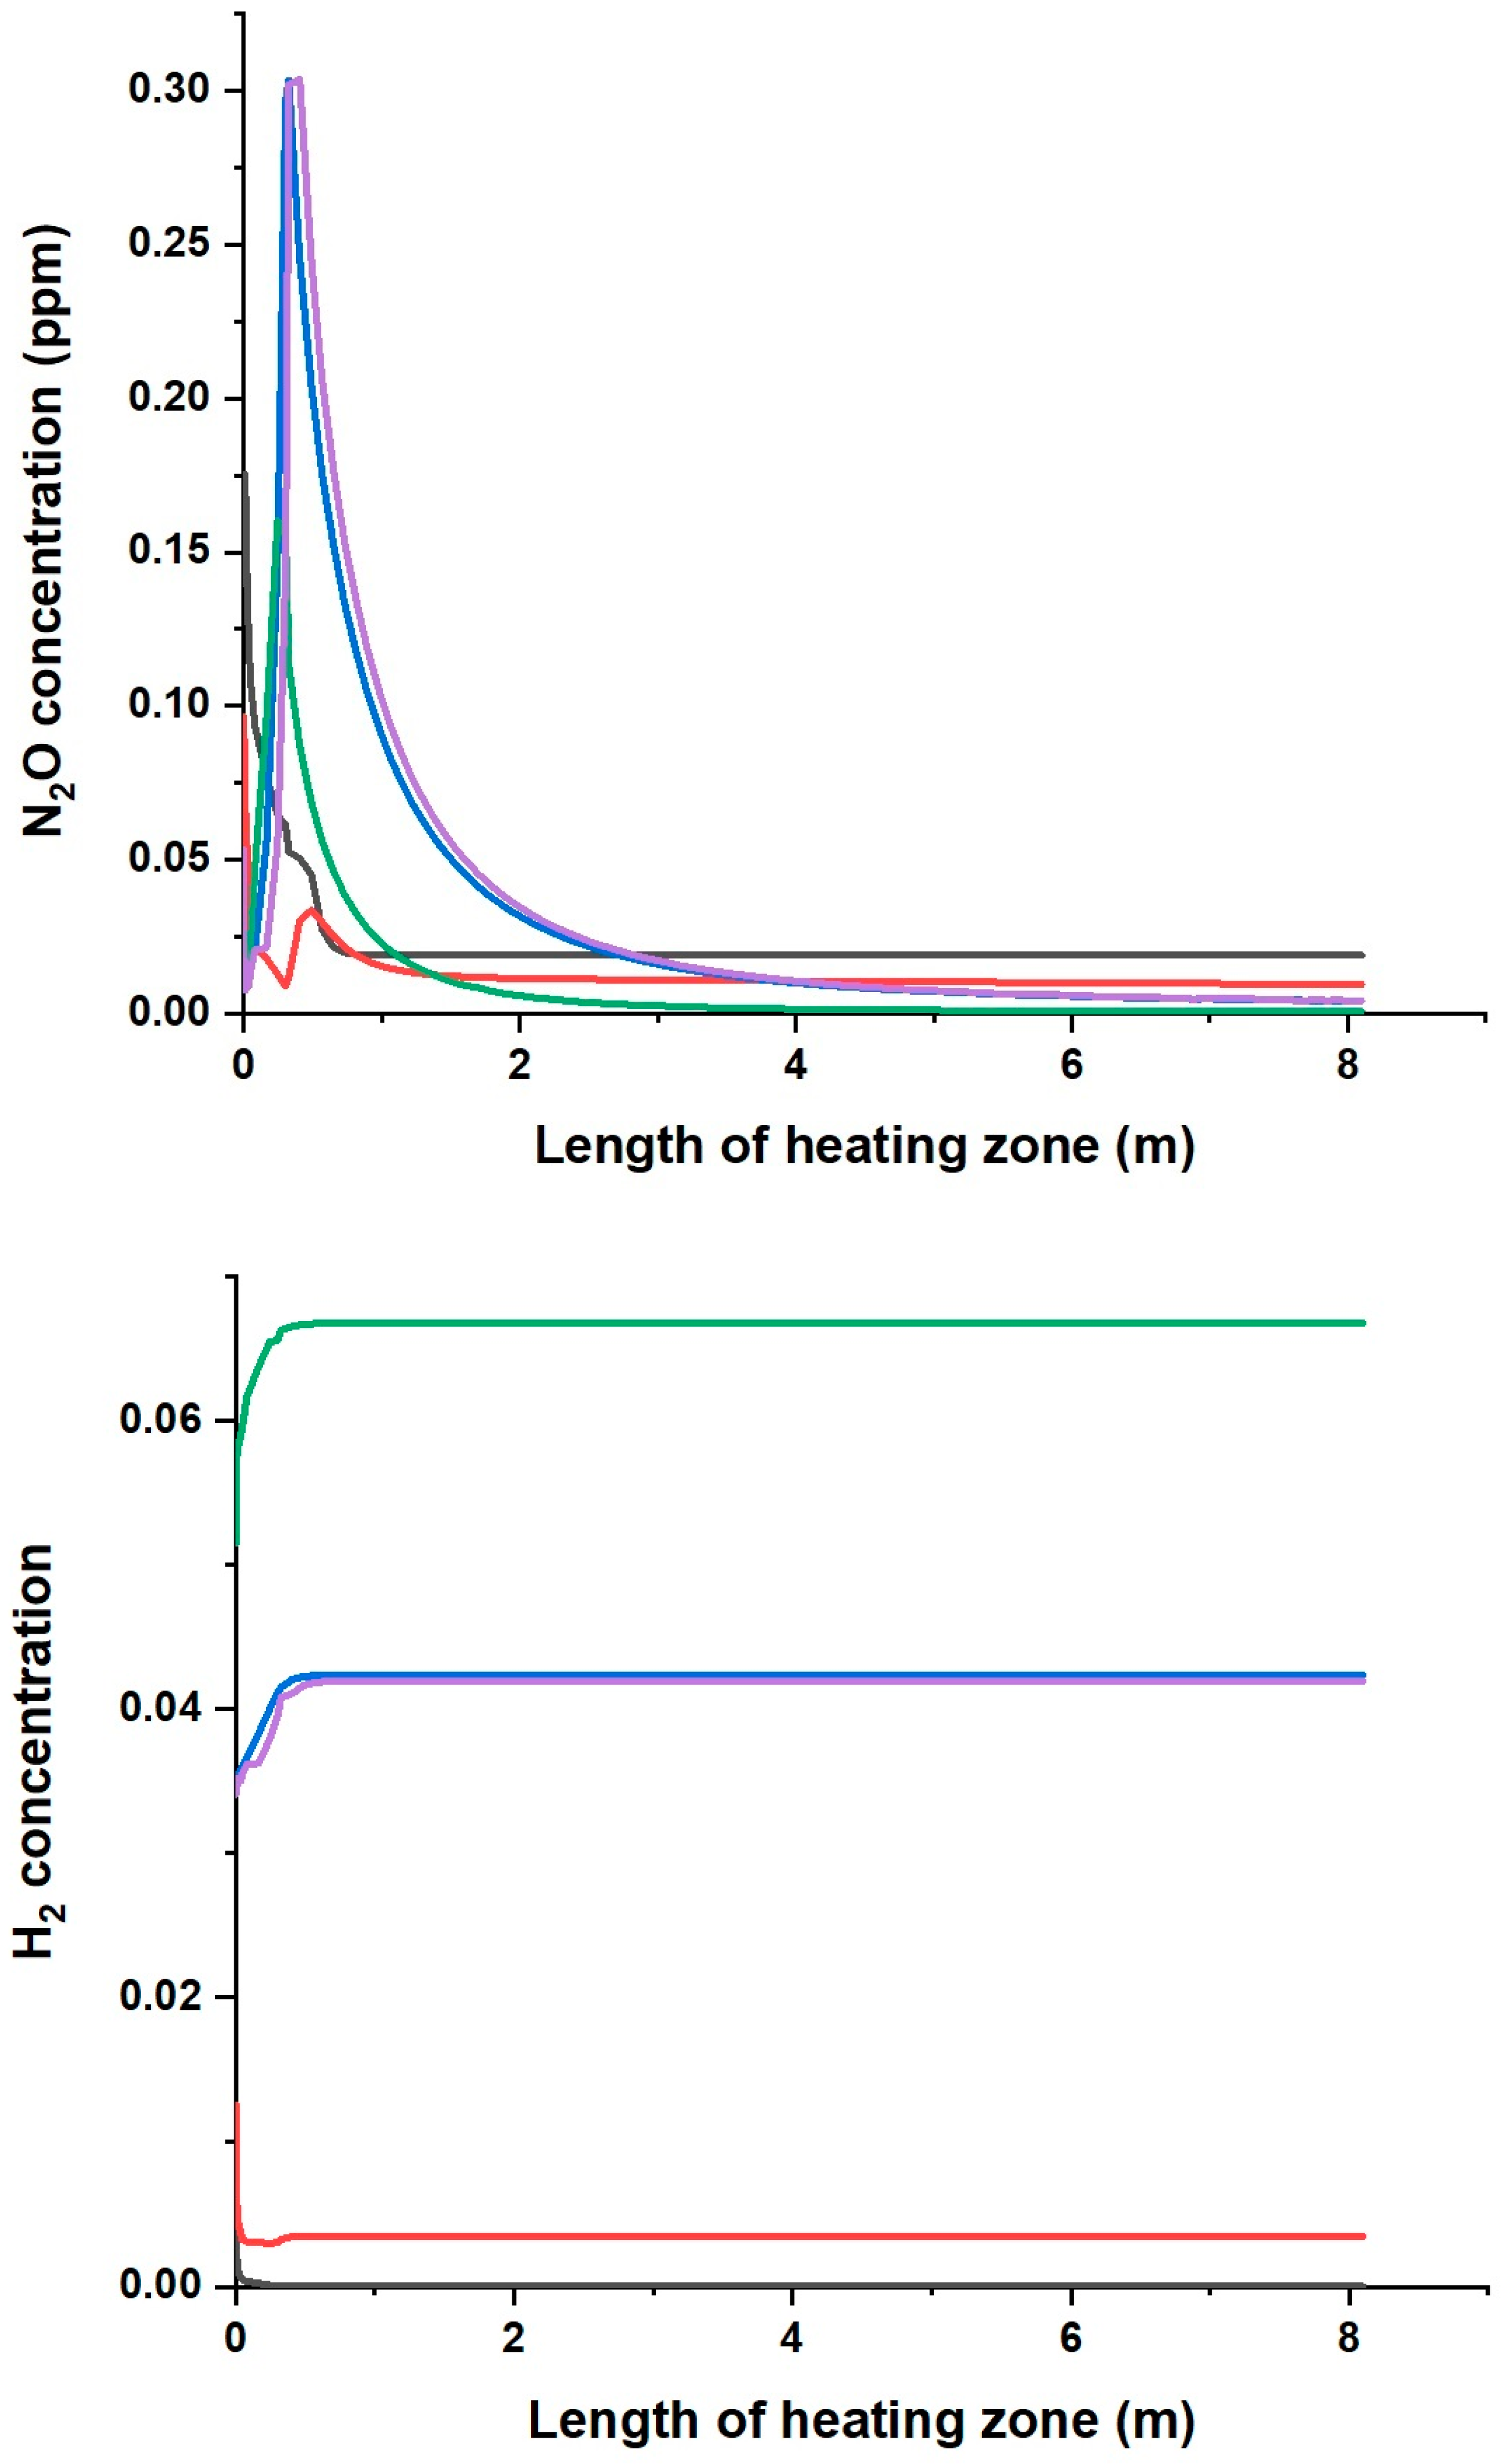
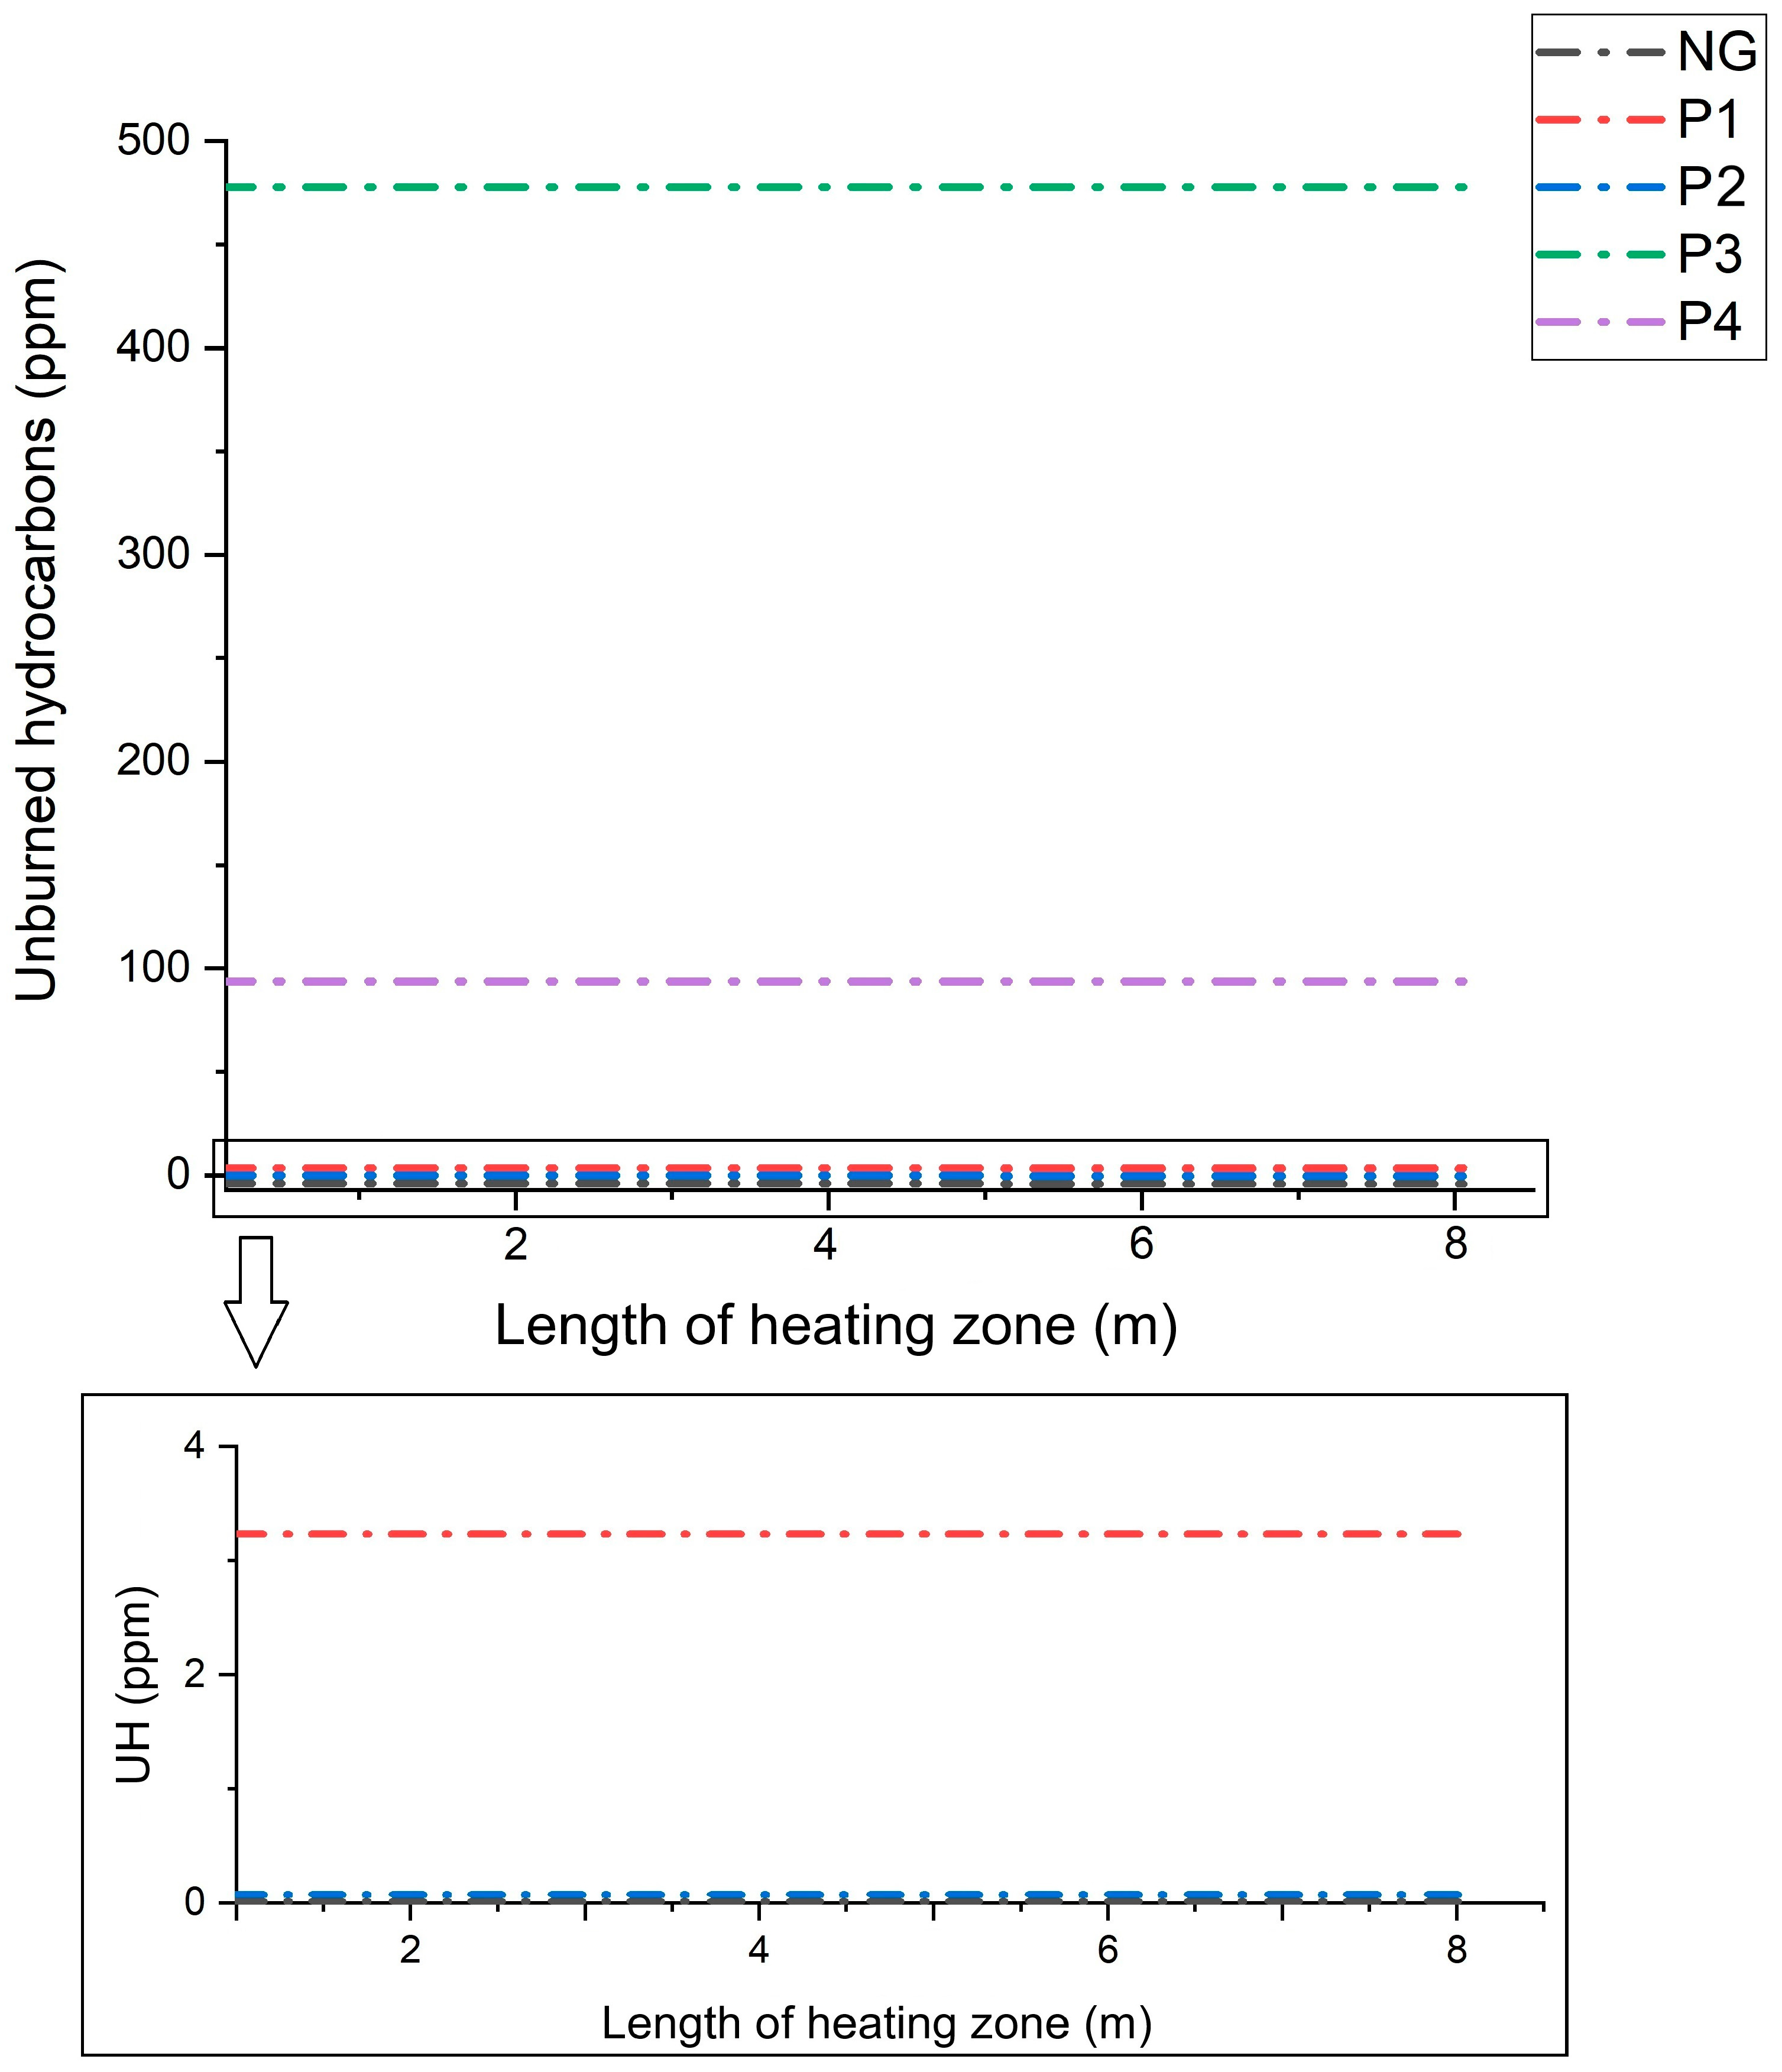
- The addition of gas from the pyrolysis of biomass waste with the addition of PP leads to a higher concentration of CO and H2 as well as unburned hydrocarbons in the flue gases than for the other mixtures.
- The smaller the share of CO and H2 in the composition of the pyrolysis gas, the lower the concentration of these compounds in the combustion products is.
- The highest concentration of CO and H2 in the flue gases was observed for the co-combustion of natural gas with gas from the pyrolysis of alder chips with polypropylene (P3), while the lowest was for the gas from the pyrolysis of RDF (P1), which is related to the addition of polypropylene in the P3 and P4 mixtures at a level of 30%.
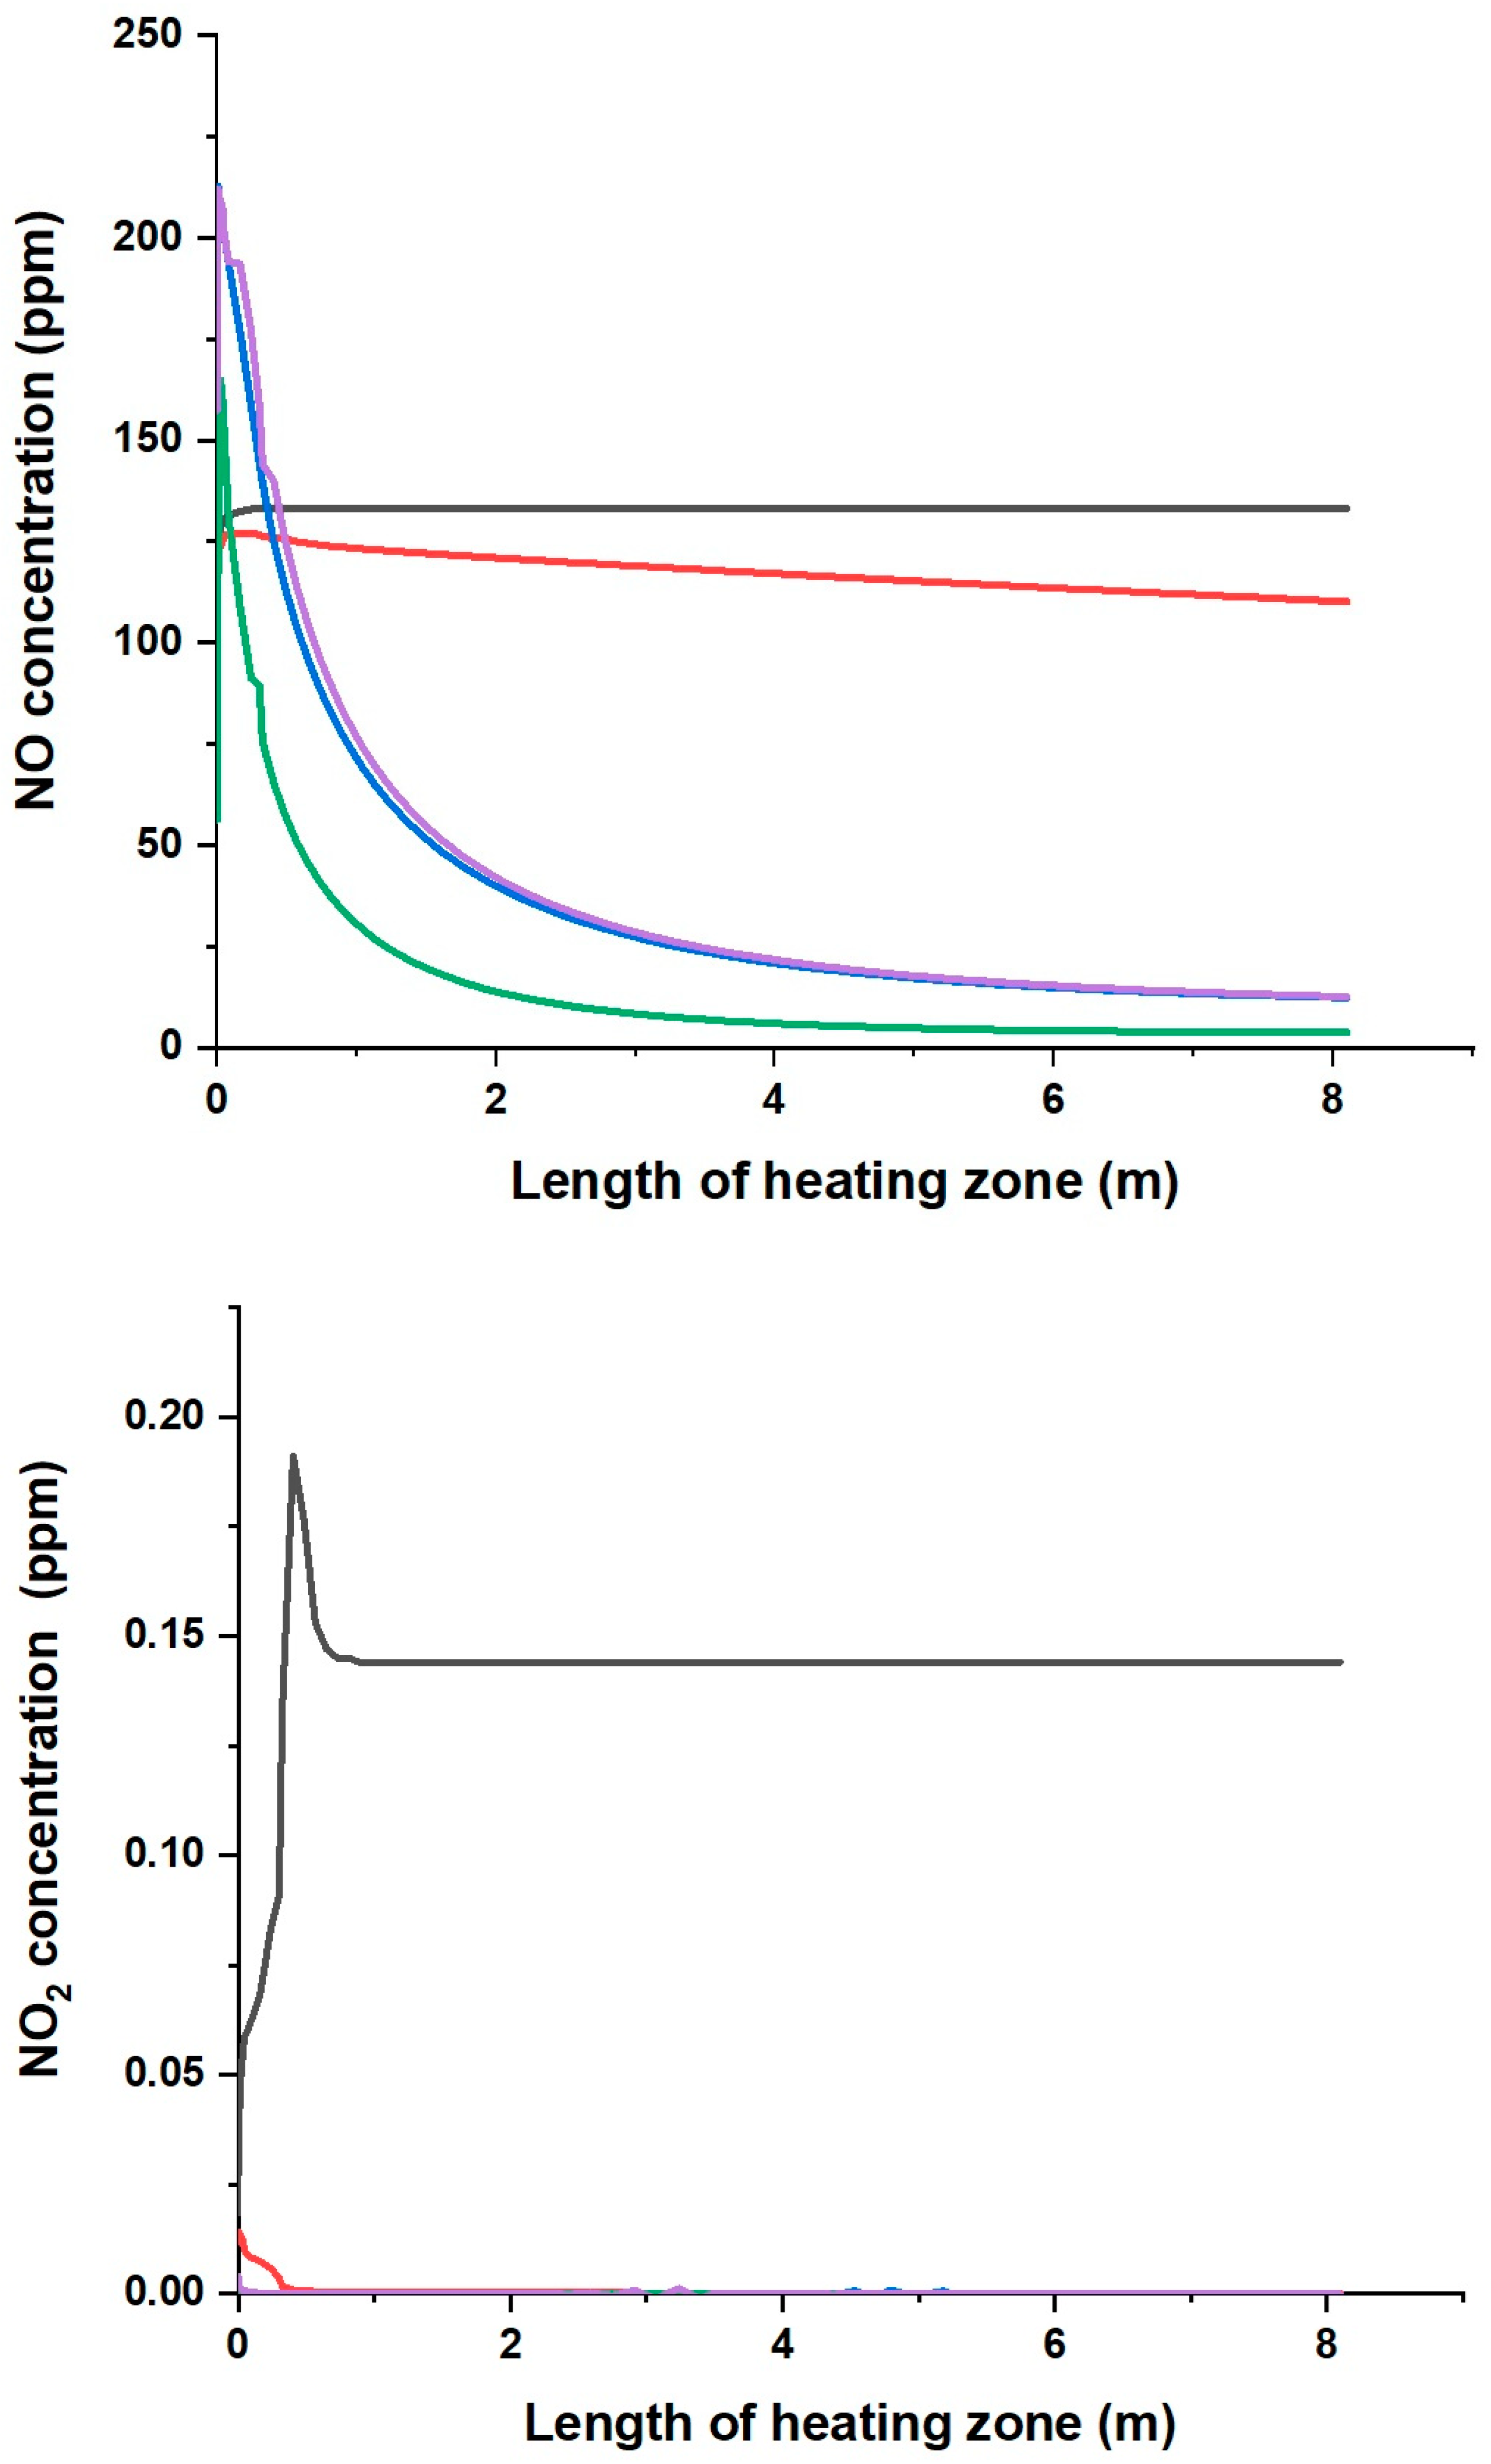
- By analysing the formation paths, it can be seen that the mechanism of nitrogen oxide formation during the combustion of mixtures of natural gas with the P2, P3 and P4 gases is much more complex than for the combustion of natural gas alone and with P1 gas. In NO formation, not only do CH radicals participate, but so do HNO, NCO, NH, HCN, NH2, HNCO and H2O.
- The analysis has shown that the addition of pyrolysis gas does not increase nitrogen oxide emissions, which will not result in increased emission charges.
- Managing unused waste, including agricultural waste, will have a positive impact on the waste market in Poland. Large companies (e.g., steel mills) using pyrolysis to meet their own energy needs will become regular consumers of this waste.
- We will see the formation of an outlet market for RDF waste, which, in Poland, due to legal conditions, is stored without thermal use.
Supplementary Materials
Author Contributions
Funding
Data Availability Statement
Conflicts of Interest
References
- Yang, Y.; Zhang, L.; Yuan, Y.; Sun, J.; Che, Z.; Qiu, Z.; Du, T.; Na, H.; Che, S. Muti-Objective Optimization on Energy Consumption, CO2 Emission and Production Cost for Iron and Steel Industry. J. Environ. Manag. 2023, 347, 119102. [Google Scholar] [CrossRef] [PubMed]
- Guo, Z.C.; Fu, Z.X. Current Situation of Energy Consumption and Measures Taken for Energy Saving in the Iron and Steel Industry in China. Energy 2010, 35, 4356–4360. [Google Scholar] [CrossRef]
- Szwaja, S.; Zajemska, M.; Szwaja, M.; Maroszek, A. Integration of Waste Biomass Thermal Processing Technology with a Metallurgical Furnace to Improve Its Efficiency and Economic Benefit. Clean Technol. Environ. Policy 2021, 25, 577–587. [Google Scholar] [CrossRef]
- Conejo, A.N.; Birat, J.P.; Dutta, A. A Review of the Current Environmental Challenges of the Steel Industry and Its Value Chain. J. Environ. Manag. 2020, 259, 109782. [Google Scholar] [CrossRef] [PubMed]
- Ren, M.; Lu, P.; Liu, X.; Hossain, M.S.; Fang, Y.; Hanaoka, T.; O’Gallachoir, B.; Glynn, J.; Dai, H. Decarbonizing China’s Iron and Steel Industry from the Supply and Demand Sides for Carbon Neutrality. Appl. Energy 2021, 298, 117209. [Google Scholar] [CrossRef]
- Zhang, S.; Worrell, E.; Crijns-Graus, W.; Wagner, F.; Cofala, J. Co-Benefits of Energy Efficiency Improvement and Air Pollution Abatement in the Chinese Iron and Steel Industry. Energy 2014, 78, 333–345. [Google Scholar] [CrossRef]
- Yang, H.; Liu, J.; Jiang, K.; Meng, J.; Guan, D.; Xu, Y.; Tao, S. Multi-Objective Analysis of the Co-Mitigation of CO2 and PM2.5 Pollution by China’s Iron and Steel Industry. J. Clean. Prod. 2018, 185, 331–341. [Google Scholar] [CrossRef]
- Zhu, X.; Li, H.; Chen, J.; Jiang, F. Pollution Control Efficiency of China’s Iron and Steel Industry: Evidence from Different Manufacturing Processes. J. Clean. Prod. 2019, 240, 118184. [Google Scholar] [CrossRef]
- Wang, R.Q.; Jiang, L.; Wang, Y.D.; Roskilly, A.P. Energy Saving Technologies and Mass-Thermal Network Optimization for Decarbonized Iron and Steel Industry: A Review. J. Clean. Prod. 2020, 274, 122997. [Google Scholar] [CrossRef]
- Muslemani, H.; Liang, X.; Kaesehage, K.; Ascui, F.; Wilson, J. Opportunities and Challenges for Decarbonizing Steel Production by Creating Markets for ‘Green Steel’ Products. J. Clean. Prod. 2021, 315, 128127. [Google Scholar] [CrossRef]
- Shen, J.; Zhang, Q.; Xu, L.; Tian, S.; Wang, P. Future CO2 Emission Trends and Radical Decarbonization Path of Iron and Steel Industry in China. J. Clean. Prod. 2021, 326, 129354. [Google Scholar] [CrossRef]
- Zhu, X.; He, M.; Li, H. Environmental Regulation, Governance Transformation and the Green Development of Chinese Iron and Steel Enterprises. J. Clean. Prod. 2021, 328, 129557. [Google Scholar] [CrossRef]
- Mallett, A.; Pal, P. Green Transformation in the Iron and Steel Industry in India: Rethinking Patterns of Innovation. Energy Strateg. Rev. 2022, 44, 100968. [Google Scholar] [CrossRef]
- Sun, W.; Wang, Q.; Zhou, Y.; Wu, J. Material and Energy Flows of the Iron and Steel Industry: Status Quo, Challenges and Perspectives. Appl. Energy 2020, 268, 114946. [Google Scholar] [CrossRef]
- Zhang, Q.; Wang, Y.; Zhang, W.; Xu, J. Resources, Conservation & Recycling Energy and Resource Conservation and Air Pollution Abatement in China’s Iron and Steel Industry. Resour. Conserv. Recycl. 2019, 147, 67–84. [Google Scholar] [CrossRef]
- Sun, W.; Wang, Q.; Zheng, Z.; Cai, J. Material–Energy–Emission Nexus in the Integrated Iron and Steel Industry. Energy Convers. Manag. 2020, 213, 112828. [Google Scholar] [CrossRef]
- Quader, M.A.; Ahmed, S.; Ghazilla, R.A.R.; Ahmed, S.; Dahari, M. A Comprehensive Review on Energy Efficient CO2 Breakthrough Technologies for Sustainable Green Iron and Steel Manufacturing. Renew. Sustain. Energy Rev. 2015, 50, 594–614. [Google Scholar] [CrossRef]
- Sejm Rzeczypospolitej Polskiej Ustawa z Dnia 20 Maja 2016 r. o Efektywności Energetycznej. 2013; pp. 1–10. Available online: https://isap.sejm.gov.pl/isap.nsf/DocDetails.xsp?id=WDU20160000831 (accessed on 1 September 2024).
- Available online: https://www.gov.pl/web/klimat/efektywnosc-energetyczna (accessed on 1 September 2024).
- Jerzak, W.; Ku, M. The Effect of Adding CO2 to the Axis of Natural Gas Combustion Flames on CO and NOx Concentrations in the Combustion Chamber. J. Power Technol. 2014, 94, 202–210. [Google Scholar]
- Mariños Rosado, D.J.; Rojas Chávez, S.B.; Amaro Gutierrez, J.; Mayworm de Araújo, F.H.; de Carvalho, J.A.; Mendiburu, A.Z. Energetic Analysis of Reheating Furnaces in the Combustion of Coke Oven Gas, Linz-Donawitz Gas and Blast Furnace Gas in the Steel Industry. Appl. Therm. Eng. 2020, 169, 114905. [Google Scholar] [CrossRef]
- Mouneir, S.M.; El-Shamy, A.M. A Review on Harnessing the Energy Potential of Pyrolysis Gas from Scrap Tires: Challenges and Opportunities for Sustainable Energy Recovery. J. Anal. Appl. Pyrolysis 2024, 177, 106302. [Google Scholar] [CrossRef]
- Liu, X.; Chang, F.; Wang, C.; Jin, Z.; Wu, J.; Zuo, J.; Wang, K. Pyrolysis and Subsequent Direct Combustion of Pyrolytic Gases for Sewage Sludge Treatment in China. Appl. Therm. Eng. 2018, 128, 464–470. [Google Scholar] [CrossRef]
- Hossain, A.; Davies, P. Pyrolysis Liquids and Gases as Alternative Fuels in Internal Combustion Engines—A Review. Renew. Sustain. Energy Rev. 2013, 21, 165–189. [Google Scholar] [CrossRef]
- Zajemska, M.; Magdziarz, A.; Iwaszko, J.; Skrzyniarz, M.; Poskart, A. Numerical and Experimental Analysis of Pyrolysis Process of RDF Containing a High Percentage of Plastic Waste. Fuel 2022, 320, 123981. [Google Scholar] [CrossRef] [PubMed]
- Aluri, S.; Syed, A.; Flick, D.W.; Muzzy, J.D.; Sievers, C.; Agrawal, P.K. Pyrolysis and Gasification Studies of Model Refuse Derived Fuel (RDF) Using Thermogravimetric Analysis. Fuel Process. Technol. 2018, 179, 154–166. [Google Scholar] [CrossRef]
- Chavando, J.A.M.; de Matos, E.C.J.; Silva, V.B.; Tarelho, L.A.C.; Cardoso, J.S. Pyrolysis Characteristics of RDF and HPDE Blends with Biomass. Int. J. Hydrogen Energy 2022, 47, 19901–19915. [Google Scholar] [CrossRef]
- Chen, D.; Zheng, Z.; Fu, K.; Zeng, Z.; Wang, J.; Lu, M. Torrefaction of Biomass Stalk and Its Effect on the Yield and Quality of Pyrolysis Products. Fuel 2015, 159, 27–32. [Google Scholar] [CrossRef]
- Ren, S.; Lei, H.; Wang, L.; Bu, Q.; Chen, S.; Wu, J.; Julson, J.; Ruan, R. Bioresource Technology The Effects of Torrefaction on Compositions of Bio-Oil and Syngas from Biomass Pyrolysis by Microwave Heating. Bioresour. Technol. 2013, 135, 659–664. [Google Scholar] [CrossRef]
- Manouchehrinejad, M.; Mani, S. Energy Conversion and Management: X Process Simulation of an Integrated Biomass Torrefaction and Pelletization (IBTP) Plant to Produce Solid Biofuels. Energy Convers. Manag. X 2019, 1, 100008. [Google Scholar] [CrossRef]
- Janakova, I.; Malikova, P.; Drabinova, S.; Kasparkova, A.; Motyka, O.; Smelik, R.; Brozova, K.; Heviankova, S. Energy Recovery from Sewage Sludge Waste Blends: Detailed Characteristics of Pyrolytic Oil and Gas. Environ. Technol. Innov. 2024, 35, 103644. [Google Scholar] [CrossRef]
- Stančin, H.; Strezov, V.; Mikulčić, H. Life Cycle Assessment of Alternative Fuel Production by Co-Pyrolysis of Waste Biomass and Plastics. J. Clean. Prod. 2023, 414, 137676. [Google Scholar] [CrossRef]
- Sathish, T.; Surakasi, R.; KishoreT, L.; Rathinasamy, S.; Ağbulut, Ü.; Shaik, S.; Park, S.G.; Afzal, A. Waste to Fuel: Pyrolysis of Waste Transformer Oil and Its Evaluation as Alternative Fuel along with Different Nanoparticles in CI Engine with Exhaust Gas Recirculation. Energy 2023, 267, 126595. [Google Scholar] [CrossRef]
- Scheibe, A.S.; de Araujo, I.P.; Janssen, L.; de Campos, T.A.; Martins, V.d.P.; Vasques Mendonça, A.R.; Borges Valle, J.A.; Siqueira Curto Valle, R.d.C.; Guelli Ulson de Souza, S.M.A.; Ulson de Souza, A.A. Products from Pyrolysis Textile Sludge as a Potential Antibacterial and Alternative Source of Fuel Oil. Clean. Eng. Technol. 2022, 6, 100408. [Google Scholar] [CrossRef]
- Trada, A.; Chaudhary, A.; Patel, D.; Upadhyay, D.S. An Alternative Fuel Production from Sawdust through Batch-Type Pyrolysis Reactor: Fuel Properties and Thermodynamic Analysis. Process Saf. Environ. Prot. 2022, 167, 332–342. [Google Scholar] [CrossRef]
- Chaiya, C.; Pankumpet, N.; Buapibal, B.; Chalermsinsuwan, B. Alternative Liquid Fuel from Pyrolysis of Polyethylene Wax. Energy Rep. 2020, 6, 1262–1267. [Google Scholar] [CrossRef]
- Chen, Y.; Wu, X.; Ma, T.; Chen, W.; Hu, J.; Chang, C.; Pang, S.; Li, P. Synergistic Effects of Fe@C Catalysts Prepared at Different Carbonization Temperatures on Microwave Co-Pyrolysis of Biomass and Plastic for High-Value Oil and Gas Production. Fuel 2024, 373, 132290. [Google Scholar] [CrossRef]
- Cho, S.H.; Lee, T.; Cha, H.; Chen, W.H.; Tsang, Y.F.; Kwon, E.E. Production of Combustible Gas via Incorporating CO2 to Pyrolysis of Medicinal Herbal Waste. Ind. Crops Prod. 2024, 219, 119110. [Google Scholar] [CrossRef]
- Abdi-Khanghah, M.; Wu, K.C.; Soleimani, A.; Hazra, B.; Ostadhassan, M. Experimental Investigation, Non-Isothermal Kinetic Study and Optimization of Oil Shale Pyrolysis Using Two-Step Reaction Network: Maximization of Shale Oil and Shale Gas Production. Fuel 2024, 371, 131828. [Google Scholar] [CrossRef]
- Zhang, J.; Cheng, J.; Du, T.; Xiao, X.; Zhang, S.; Liao, X.; Shi, B. Product Regulation of Potassium Catalyzed Pyrolysis of Chinese Baijiu Grains: Towards the Production of Combustible Gases and the Reduction of Tar Formation. Ind. Crops Prod. 2024, 218, 118935. [Google Scholar] [CrossRef]
- Calero, M.; Solís, R.R.; Muñoz-Batista, M.J.; Pérez, A.; Blázquez, G.; Ángeles Martín-Lara, M. Oil and Gas Production from the Pyrolytic Transformation of Recycled Plastic Waste: An Integral Study by Polymer Families. Chem. Eng. Sci. 2023, 271, 118569. [Google Scholar] [CrossRef]
- Martínez, J.D.; Puy, N.; Murillo, R.; García, T.; Navarro, M.V.; Mastral, A.M. Waste Tyre Pyrolysis—A Review. Renew. Sustain. Energy Rev. 2013, 23, 179–213. [Google Scholar] [CrossRef]
- Sieradzka, M.; Rajca, P.; Zajemska, M.; Mlonka-Mędrala, A.; Magdziarz, A. Prediction of Gaseous Products from Refuse Derived Fuel Pyrolysis Using Chemical Modelling Software-Ansys Chemkin-Pro. J. Clean. Prod. 2020, 248, 119277. [Google Scholar] [CrossRef]
- Rajca, P.; Poskart, A.; Chrubasik, M.; Sajdak, M.; Zajemska, M.; Skibiński, A.; Korombel, A. Technological and Economic Aspect of Refuse Derived Fuel Pyrolysis. Renew. Energy 2020, 161, 482–494. [Google Scholar] [CrossRef]
- Williams, P.T.; Horne, P.A. The Influence of Catalyst Type on the Composition of Upgraded Biomass Pyrolysis Oils. J. Anal. Appl. Pyrolysis 1995, 31, 39–61. [Google Scholar] [CrossRef]
- Haydary, J.; Rapčanová, E.; Škulec, M. Purification of Syngas from Refuse-Derived Fuel (RDF) Gasification: Techno-Economic Analysis. Therm. Sci. Eng. Prog. 2023, 44, 102024. [Google Scholar] [CrossRef]
- Cao, J.; Jiang, Y.; Tan, X.; Li, L.; Cao, S.; Dou, J.; Chen, R.; Hu, X.; Qiu, Z.; Li, M.; et al. Sludge-Based Biochar Preparation: Pyrolysis and Co-Pyrolysis Methods, Improvements, and Environmental Applications. Fuel 2024, 373, 132265. [Google Scholar] [CrossRef]
- Keller, A.A.; Li, W.; Floyd, Y.; Bae, J.; Marie, K.; Thomas, E.; Han, Z.; Adeleye, A.S. Elimination of Microplastics, PFAS, and PPCPs from Biosolids via Pyrolysis to Produce Biochar: Feasibility and Techno-Economic Analysis. Sci. Total Environ. 2024, 947, 174773. [Google Scholar] [CrossRef]
- Chen, Y.; Zhou, C.; Xing, X.; Chen, L.; Yao, B.; Chao, L.; Zhang, Y.; Wang, J.; Dong, J.; Liu, C.; et al. Interconnected Pyrolysis and Activation with In-Situ H3PO4 Activation of Biochar from Pear Wood Chips in a Pilot Scale Dual Fluidized Bed. Chem. Eng. J. 2024, 495, 153579. [Google Scholar] [CrossRef]
- Szwaja, S.; Poskart, A.; Zajemska, M. A New Approach for Evaluating Biochar Quality from Virginia Mallow Biomass Thermal Processing. J. Clean. Prod. 2019, 214, 356–364. [Google Scholar] [CrossRef]
- El Hanandeh, A.; Albalasmeh, A.; Gharaibeh, M. Effect of Pyrolysis Temperature and Biomass Particle Size on the Heating Value of Biocoal and Optimization Using Response Surface Methodology. Biomass Bioenergy 2021, 151, 106163. [Google Scholar] [CrossRef]
- Uzun, B.B.; Pütün, A.E.; Pütün, E. Composition of Products Obtained via Fast Pyrolysis of Olive-Oil Residue: Effect of Pyrolysis Temperature. J. Anal. Appl. Pyrolysis 2007, 79, 147–153. [Google Scholar] [CrossRef]
- Sanahuja-Parejo, O.; Veses, A.; Navarro, M.V.; López, J.M.; Murillo, R.; Callén, M.S.; García, T. Catalytic Co-Pyrolysis of Grape Seeds and Waste Tyres for the Production of Drop-in Biofuels. Energy Convers. Manag. 2018, 171, 1202–1212. [Google Scholar] [CrossRef]
- Faisal, F.; Rasul, M.G.; Jahirul, M.I.; Chowdhury, A.A. Waste Plastics Pyrolytic Oil Is a Source of Diesel Fuel: A Recent Review on Diesel Engine Performance, Emissions, and Combustion Characteristics. Sci. Total Environ. 2023, 886, 163756. [Google Scholar] [CrossRef] [PubMed]
- Li, X.; Chen, Z.; Liu, P.; Wang, Z.; Sun, T.; Wu, S.; Wu, Y.; Lei, T. Oriented Pyrolysis of Biomass for Hydrogen-Rich Gas and Biochar Production: An Energy, Environment, and Economic Assessment Based on Life Cycle Assessment Method. Int. J. Hydrogen Energy 2024, 62, 979–993. [Google Scholar] [CrossRef]
- Bhatt, K.P.; Patel, S.; Upadhyay, D.S.; Patel, R.N. Production of Hydrogen-Rich Fuel Gas from Waste Plastics Using Continuous Plasma Pyrolysis Reactor. J. Environ. Manag. 2024, 356, 120446. [Google Scholar] [CrossRef]
- Ma, X.; Wang, J.; Li, L.; Wang, X.; Gong, J. Co-Pyrolysis Model for Polylactic Acid (PLA)/Wood Composite and Its Application in Predicting Combustion Behaviors. Renew. Energy 2024, 225, 120267. [Google Scholar] [CrossRef]
- Li, J.; Yang, X.; Hou, L.; Yan, B.; Cheng, Z.; Zhao, J.; Chen, G. Pyrolysis-Combustion of Rural Solid Waste: Self-Sustaining Operation and Pollutants Emission. Fuel 2024, 368, 131575. [Google Scholar] [CrossRef]
- Pessoa Filho, J.S.; Penha, B.A.S.; Satto, S.V.; Lima, E.A.P.; Borges, V.L.; Silva, V.M.; Santos, M.B.; Trovó, A.G.; Carvalho, S.R. Mass Yields of Products and Composition of Syngas from Pyrolysis of Brazilian Plastic Solid Wastes: Combustion Simulation and Burner Design to Minimize COx and CxHy Emissions. Process Saf. Environ. Prot. 2024, 186, 264–273. [Google Scholar] [CrossRef]
- Masfuri, I.; Amrullah, A.; Farobie, O.; Anggoro, T.; Rian, S.F.; Prabowo, W.; Rosyadi, E. Temperature Effects on Chemical Reactions and Product Yields in the Co-Pyrolysis of Wood Sawdust and Waste Tires: An Experimental Investigation. Results Eng. 2024, 23, 102638. [Google Scholar] [CrossRef]
- Baeck, S.; Lee, Y.K.; Lee, H. Classical and Reactive Simulations of Plastic Co-Pyrolysis: Effects of Polystyrene and Its Fragments on Product Yields, Aggregation, and Reaction Mechanisms. Chem. Eng. J. 2024, 497, 154857. [Google Scholar] [CrossRef]
- Li, L.; Luo, Z.; Miao, F.; Du, L.; Wang, K. Prediction of Product Yields from Lignocellulosic Biomass Pyrolysis Based on Gaussian Process Regression. J. Anal. Appl. Pyrolysis 2024, 177, 106295. [Google Scholar] [CrossRef]
- Belrhazi, I.; Sair, S.; Ait Ousaleh, H.; Abdellaoui, Y.; Zahouily, M. Catalytic Transformation of Plastic Waste: Harnessing Zeolite for Enhanced Energy Product Yield in Pyrolysis. Energy Convers. Manag. 2024, 318, 118897. [Google Scholar] [CrossRef]
- Al-Mrayat, T.; Al-Hamaiedeh, H.; El-Hasan, T.; Aljbour, S.H.; Al-Ghazawi, Z.; Mohawesh, O. Pyrolysis of Domestic Sewage Sludge: Influence of Operational Conditions on the Product Yields Using Factorial Design. Heliyon 2022, 8, e09418. [Google Scholar] [CrossRef] [PubMed]
- Lee, Y.R.; Choi, H.S.; Park, H.C.; Lee, J.E. A Numerical Study on Biomass Fast Pyrolysis Process: A Comparison between Full Lumped Modeling and Hybrid Modeling Combined with CFD. Comput. Chem. Eng. 2015, 82, 202–215. [Google Scholar] [CrossRef]
- Che, D.; Li, S.; Yang, W.; Jia, J.; Zheng, N. Application of Numerical Simulation on Biomass Gasification. Energy Procedia 2012, 17, 49–54. [Google Scholar] [CrossRef]
- Pelucchi, M.; Cavallotti, C.; Cuoci, A.; Faravelli, T.; Frassoldati, A.; Ranzi, E. Detailed Kinetics of Substituted Phenolic Species in Pyrolysis Bio-Oils. React. Chem. Eng. 2019, 4, 490–506. [Google Scholar] [CrossRef]
- Debiagi, P.E.A.; Trinchera, M.; Frassoldati, A.; Faravelli, T.; Vinu, R.; Ranzi, E. Algae Characterization and Multistep Pyrolysis Mechanism. J. Anal. Appl. Pyrolysis 2017, 128, 423–436. [Google Scholar] [CrossRef]
- Ranzi, E.; Debiagi, P.E.A.; Frassoldati, A. Mathematical Modeling of Fast Biomass Pyrolysis and Bio-Oil Formation. Note I: Kinetic Mechanism of Biomass Pyrolysis. ACS Sustain. Chem. Eng. 2017, 5, 2867–2881. [Google Scholar] [CrossRef]
- Ranzi, E.; Debiagi, P.E.A.; Frassoldati, A. Mathematical Modeling of Fast Biomass Pyrolysis and Bio-Oil Formation. Note II: Secondary Gas-Phase Reactions and Bio-Oil Formation. ACS Sustain. Chem. Eng. 2017, 5, 2882–2896. [Google Scholar] [CrossRef]
- Alikulov, K.; Aminov, Z.; Anh, L.H.; Tran Dang, X.; Kim, W. Effect of Ammonia and Hydrogen Blends on the Performance and Emissions of an Existing Gas Turbine Unit. Int. J. Hydrogen Energy 2024, 61, 432–443. [Google Scholar] [CrossRef]
- Hasnain, M.F.U.; Ali, H.O.; Aziz, S.; Kouotou, P.M.; Waqas, M.; Naqvi, S.M.A.; Athar, M.H.; Ammar, M.; Shah, I.; Jung, D.W. Optimization and Techno-Economic Analysis of Catalytic Gasification of Wheat Straw Biomass Using ASPEN PLUS Model. Arab. J. Chem. 2024, 17, 105821. [Google Scholar] [CrossRef]
- Cruz Sánchez-Alarcos, E.; Garcia, M.T.; Gracia, I.; Rodriguez, J.F.; Garcia-Vargas, J.M. Modelling of the Equilibrium of Supercritical CO2 + Lavender Essential Oil with Aspen Plus®. J. Supercrit. Fluids 2024, 209, 106239. [Google Scholar] [CrossRef]
- Mlonka-Mędrala, A.; Dziok, T.; Magdziarz, A.; Nowak, W. Composition and Properties of Fly Ash Collected from a Multifuel Fluidized Bed Boiler Co-Firing Refuse Derived Fuel (RDF) and Hard Coal. Energy 2021, 234, 121229. [Google Scholar] [CrossRef]
- Chen, X.X.; Chen, R.B.; Wu, C.Y. Prediction and Optimization of Heat Transfer Performance of Premixed Methane Impinging Flame Jet Using the Kriging Model and Genetic Algorithm. Appl. Sci. 2024, 14, 3731. [Google Scholar] [CrossRef]
- Zhang, J.; Zhu, J.; Liu, J. Experimental Studies on Preheating Combustion Characteristics of Low-Rank Coal with Different Particle Sizes and Kinetic Simulation of Nitrogen Oxide. Energies 2023, 16, 7078. [Google Scholar] [CrossRef]
- Cameretti, M.C.; De Robbio, R.; Palomba, M. Numerical Analysis of Dual Fuel Combustion in a Medium Speed Marine Engine Supplied with Methane/Hydrogen Blends. Energies 2023, 16, 6651. [Google Scholar] [CrossRef]
- Reyes, M.; Sastre, R.; Giménez, B.; Sesma, C. Experimental, Kinetic Modeling and Morphologic Study of the Premixed Combustion of Hydrogen/Methane Mixtures. Energies 2022, 15, 3722. [Google Scholar] [CrossRef]
- An, S.; Jung, J.C. Kinetic Modeling of Thermal Reactor in Claus Process Using CHEMKIN-PRO Software. Case Stud. Therm. Eng. 2020, 21, 100694. [Google Scholar] [CrossRef]
- Zajemska, M. Modelowanie Numeryczne Składu Chemicznego Spalin w Piecach Grzewczych; Monografie; Wydawnictwo Wydziału Inżynierii Procesowej, Materiałowej i Fizyki Stosowanej: Częstochowa, Poland, 2013. [Google Scholar]
- Maroszek, A. Badanie Zależności Stopnia Uwęglenia Karbonizatu Od Wybranych Parametrów Torgazu w Ślimakowym Reaktorze Toryfikującym; Czestochowa University of Technology: Częstochowa, Poland, 2019. [Google Scholar]
- Sajdak, M.; Muzyka, R. Use of Plastic Waste as a Fuel in the Co-Pyrolysis of Biomass. Part I: The Effect of the Addition of Plastic Waste on the Process and Products. J. Anal. Appl. Pyrolysis 2014, 107, 267–275. [Google Scholar] [CrossRef]
- Zajemska, M.; Poskart, A. Mozliwości Zastosowania Metod Numerycznych Do Przewidywania i Ograniczania Emisji Zanieczyszczeń z Instalacji Spalania Stosowanych w Przemyśle Chemicznym i Rafineryjnym. Przem. Chem. 2013, 92, 357–361. [Google Scholar]
- Telejko, T. Wstęp Do Metod Opracowania Wyników Pomiarów z Przykładami; Skrypty Uczelniane AGH: Kraków, Poland, 1999. [Google Scholar]
- Szecówka, L. Wpływ Pulsacji Na Spalanie Paliw Gazowych i Emisję Zanieczyszczeń; Seria Metalurgia, nr 17; Wydawnictwo Wydziału Metalurgii i Inżynierii Materiałowej: Częstochowa, Poland, 2001. [Google Scholar]
- Ma, H.; Lv, S.; Zhou, L.; Chew, J.W.; Zhao, J. Detailed Kinetic Modeling of H2S Formation during Fuel-Rich Combustion of Pulverized Coal. Fuel Process. Technol. 2020, 199, 106276. [Google Scholar] [CrossRef]


| Compound (vol%) | H2 | CO | CO2 | CH4 | C2–C5 | Calorific Value (MJ/m3) | Ref. |
|---|---|---|---|---|---|---|---|
| LDPE:SS | 25.57 | 2.71 | 4.14 | 46.31 | 21.27 | 43.82 | [31] |
| Tyre | 21.50 | 5.10 | 26.20 | 17.30 | 29.90 | 30.30 | [42] |
| RDF | 29.40 | 11.30 | 13.20 | 32.90 | 7.20 | 22.80 | [43] |
| RDF | 12.37 | 29.69 | 11.89 | 17.83 | 25.70 | 29.94 | [44] |
| Biomass | 0.02 | 6.70 | 6.80 | 0.69 | 0.91 | - | [45] |
| Material (wt%) | C | H | N | S | O | Calorific Value (MJ/kg) | Ref. |
|---|---|---|---|---|---|---|---|
| Tyre waste | 80.82 | 1.46 | 0.53 | 2.41 | - | 30.0 | [42] |
| Pear wood | 84.00 | 1.91 | 0.65 | 0.01 | 7.26 | 33.55 | [49] |
| Virginia mallow | 49.90 | 5.69 | 0.39 | 0.10 | 37.42 | 18.51 | [50] |
| Material | Elemental Composition (wt%) | HHV (MJ/kg) | Ref. | |||||
|---|---|---|---|---|---|---|---|---|
| N | C | H | O | Cl | S | |||
| PE | 0.30 | 84.28 | 13.79 | 1.63 | n.d. | n.d. | 48.06 | [41] |
| PVC | 0.11 | 56.88 | 8.76 | 34.09 | 0.16 | n.d. | 18.45 | |
| LDPE:SS | 0.60 | 80.40 | 14.50 | n.d. | n.d. | <0.3 | 37.65 | [31] |
| Olive oil residue | 1.64 | 70.24 | 8.42 | 19.70 | n.d. | n.d. | 32.36 | [52] |
| Waste tyres | 0.60 | 88.10 | 10.70 | 0.06 | n.d. | 0.60 | 43.30 | [53] |
| Material | Product Yield (vol%) | Ref. | ||
|---|---|---|---|---|
| Biochar | Bio-Oil | Gas | ||
| Pear wood | 30.10 | 21.10 | 34.40 | [49] |
| Tyre | 44.20 | 38.30 | 17.50 | [42] |
| Sewage sludge | 54.53 | 18.62 | 26.85 | [64] |
| HDPE | 0.88 | 1.11 | 98.01 | [59] |
| Measurement Point Number | T1 | T2 | T3 | T4 | T5 | T6 | T7 |
|---|---|---|---|---|---|---|---|
| Distance from burner outlet (m) | 0.29 | 0.65 | 0.97 | 1.42 | 1.91 | 2.51 | 2.91 |
| Parameter | Value ** |
|---|---|
| Air flow (m3/s) | 0.00428 |
| Gas flow (m3/s) | 0.00045 |
| Air temperature (K) | 293 |
| Gas temperature (K) | 293 |
| Adiabatic temperature * (K) | 1980 |
| Chamber length (m) | 3 |
| Chamber dimeter (m) | 0.12 |
| Residence time (ms) | 0.15 |
| Pressure (atm) | 1 |
| Gas | Natural Gas—NG | RDF1 —P1 | RDF2 —P2 | AW + PP * —P3 | PW + PP * —P4 |
|---|---|---|---|---|---|
| LHV (MJ/m3) | 34.4 | 29.94 | 24.2 | 21.67 | 24.2 |
| n | 1 | 1.145 | 1.410 | 1.587 | 1.421 |
| (m3/s) | 0.3669 | 0.3302 | 0.3302 | 0.3302 | 0.3302 |
| (m3/s) | - | 0.0420 | 0.0517 | 0.0582 | 0.0521 |
| Gas composition (vol%) | |||||
| H2 | - | 12.37 | 13.2 | 8.28 | 7.94 |
| CO2 | 0.315 | 11.89 | 21.1 | 32.65 | 29.44 |
| CO | - | 29.69 | 19.8 | 27.07 | 26.43 |
| CH4 | 96.648 | 17.83 | 18.9 | 16.47 | 23.15 |
| C2H4 | - | 13.84 | 7.1 | 1.6 | 1.47 |
| C2H6 | 1.836 | 4.03 | 2.3 | 3.08 | 2.88 |
| C3H6 | - | 7.34 | - | 5.34 | 5.56 |
| C3H8 | - | 0.43 | 6.1 | 1.15 | 1.08 |
| C4H10 | - | 0.05 | 3.7 | 0.41 | 0.47 |
| C5H12 | - | 0.01 | - | 1.41 | 0.28 |
| N2 | 1.201 | - | - | - | - |
| Ref. | [83] | [44] | [25] | [82] | [82] |
| Parameter | Value * |
|---|---|
| Air temperature (K) | 623 |
| Gas temperature (K) | 293 |
| Combustion chamber temperature (K) | 1550 |
| Chamber length (m) | 8.1 |
| Cross section (m2) | 9.75 |
| Residence time (ms) | 1 |
| Pressure (atm) | 1 |
| Air flow (m3/s) | 35.583 |
| Distance from Burner Outlet (m) | 0.29 | 0.65 | 0.97 | 1.42 | 1.91 | 2.51 | 2.91 | Measurement Uncertainty |
|---|---|---|---|---|---|---|---|---|
| NO Concentration (ppm) | 135 | 134 | 137 | 135 | 135 | 134 | 136 | ±5 ppm |
| Temperature (K) | 1583 | 1488 | 1413 | 1302 | 1194 | 1101 | 996 | ± 1 °C |
| Measured Quantity | Measurement Range | Accuracy | Resolution |
|---|---|---|---|
| VARIO PLUS analyser | |||
| NO, ppm | 0 ÷ 5000 | ±5 ppmv ±5% (<1000 ppmv) ±10% (>1000 ppmv) | 1.00 |
| PtRh10-Pt thermocouple | |||
| Temperature, °C | Up to 1800 | ±1 | 0.10 |
Disclaimer/Publisher’s Note: The statements, opinions and data contained in all publications are solely those of the individual author(s) and contributor(s) and not of MDPI and/or the editor(s). MDPI and/or the editor(s) disclaim responsibility for any injury to people or property resulting from any ideas, methods, instructions or products referred to in the content. |
© 2024 by the authors. Licensee MDPI, Basel, Switzerland. This article is an open access article distributed under the terms and conditions of the Creative Commons Attribution (CC BY) license (https://creativecommons.org/licenses/by/4.0/).
Share and Cite
Skrzyniarz, M.; Morel, S.; Rzącki, J. Prediction of Chemical Composition of Gas Combustion Products from Thermal Waste Conversion. Processes 2024, 12, 2728. https://doi.org/10.3390/pr12122728
Skrzyniarz M, Morel S, Rzącki J. Prediction of Chemical Composition of Gas Combustion Products from Thermal Waste Conversion. Processes. 2024; 12(12):2728. https://doi.org/10.3390/pr12122728
Chicago/Turabian StyleSkrzyniarz, Magdalena, Sławomir Morel, and Jakub Rzącki. 2024. "Prediction of Chemical Composition of Gas Combustion Products from Thermal Waste Conversion" Processes 12, no. 12: 2728. https://doi.org/10.3390/pr12122728
APA StyleSkrzyniarz, M., Morel, S., & Rzącki, J. (2024). Prediction of Chemical Composition of Gas Combustion Products from Thermal Waste Conversion. Processes, 12(12), 2728. https://doi.org/10.3390/pr12122728