Article

Optimization of Extraction Process for Improving Polyphenols and Antioxidant Activity from Papaya Seeds (Carica papaya L.) Using Response Surface Methodology

by
Silvia Mitzel Robles-Apodaca
1,
Ricardo Iván González-Vega
2,
Saúl Ruíz-Cruz
3,*,
María Isabel Estrada-Alvarado
1,*,
Luis A. Cira-Chávez
1,
Enrique Márquez-Ríos
3,
Carmen Lizette Del-Toro-Sánchez
3,
José de Jesús Ornelas-Paz
4,
Guadalupe M. Suárez-Jiménez
3 and
Víctor Manuel Ocaño-Higuera
5
1
Departamento de Biotecnología y Ciencias Alimentarias, Instituto Tecnológico de Sonora, 5 de Febrero 818 sur, Ciudad Obregón 85000, Sonora, Mexico
2
Departamento de Ciencias de la Salud, Centro Universitario de los Valles (CUVALLE), Universidad de Guadalajara, Carr. A Guadalajara KM. 45.5, Ameca, Guadalajara 46600, Jalisco, Mexico
3
Departamento de Investigación y Posgrado en Alimentos, Universidad de Sonora, Encinas y Rosales s/n, Hermosillo 83000, Sonora, Mexico
4
Centro de Investigación en Alimentación y Desarrollo, A.C, Av. Río Conchos S/N Parque Industrial, Cuauhtémoc 31570, Chihuahua, Mexico
5
Departamento de Ciencias Químico Biológicas, Universidad de Sonora, Encinas y Rosales s/n, Hermosillo 83000, Sonora, Mexico
*
Authors to whom correspondence should be addressed.
Processes 2024, 12(12), 2729; https://doi.org/10.3390/pr12122729
Submission received: 9 October 2024 / Revised: 13 November 2024 / Accepted: 27 November 2024 / Published: 2 December 2024
(This article belongs to the Special Issue Research and Optimization of Food Processing Technology)

Abstract

:
Papaya seeds (Carica papaya L.), a by-product of the food industry, contain primary metabolites and offer secondary health benefits, but are often considered a waste with no value. Therefore, the aim of this research was to optimize the extraction process of polyphenols from papaya seeds (Carica papaya L.) to maximize their antioxidant activity using the response surface methodology (RSM). A design of experiment (DOE) approach was applied to produce the optimum conditions of factors such as solvent concentration (0–100%), temperature (30–60 °C), time (1–6 h), and exhaustion (1–6 times) to improve the extraction process. The response variables were the number of phenols and flavonoids, and the inhibition capacity of the DPPH and ABTS radicals. The main findings indicated that optimal conditions—100% solvent concentration, a temperature of 30 °C, an extraction time of 6 h, and 6 depletion cycles—maximized the yield of total polyphenols, total flavonoids, and antioxidant capacity, as evaluated using ABTS and DPPH assays. The extracts presented values of 2.521 to 6.168 mg AGE/g DW for total polyphenols and 30.830 to 68.599 mg QE/g DW for total flavonoids. Likewise, they presented an antioxidant capacity using DPPH and ABTS methods with values of around 15.151 to 72.389 and 29.434 to 165.393 μM TE/g DW, respectively. Identification was also performed using liquid chromatography to determine the presence of sugars (glucose, fructose, and sucrose) and organic acids (oxalic, citric, tartaric, malic, quinic, and succinic). However, optimal values were presented outside the study area, which indicates the maximum point of the surface was at intervals higher than those studied in this investigation. The papaya seed can be applied in future research for the optimization of bioactive compounds extracted from vegetable waste and it represents a matrix with potential in the area of technological development and health.

1. Introduction

Around the world, more than 500 million tons of wastes are generated from the fruit processing industries. The availability of this raw material has encouraged the realization of studies on the potential value of these wastes [1]. By-products from the fruit and vegetable industry have gained interest due to their low cost and abundant availability. The presence of bioactive molecules in agroindustrial waste, such as phenolic and flavonoid compounds, makes the remains of fruits and vegetables more valuable for the food industry [2]. Compounds with antioxidant, antimutagenic, and antimicrobial properties have been found [3]. Some of these agricultural by-products, such as citrus, have already been studied as a source of dietary fiber. However, papaya seeds, although potentially important, have not been established to have the ability to neutralize free radicals, providing health benefits. Agricultural by-products, particularly tropical fruits, are commonly studied for their potential as sources of dietary fiber and with possibilities of being used in the nutraceutical industry [4]. One of these is the papaya, which is a fruit that is consumed principally for its pulp; however, the seeds they generate have biological properties including the prevention of oxidative stress, as well as being a low-calorie food and highly digestive.
Our research lies in its focus on papaya seeds, an underutilized by-product of the fruit processing industry, to harness their potential as a source of bioactive compounds. While agroindustrial waste from fruits and vegetables, including citrus, has been studied as a source of dietary fiber and bioactive molecules, papaya seeds remain relatively unexplored [2]. By employing the response surface methodology (RSM) for optimizing the extraction of polyphenols from papaya seeds, this study contributes to advancing the frontier of knowledge in food science and nutraceuticals. Optimizing extraction processes for the maximum polyphenol yield could not only enhance the potential use of papaya seeds as a cost-effective antioxidant source, but also addresses the large volumes of waste generated by the fruit processing industry, estimated to be over 500 million tons annually [5]. This study supports the sustainable utilization of agricultural by-products and adds value to tropical fruits like papaya, which are often consumed only for their pulp. Ultimately, it provides the scientific foundation for further applications of papaya seeds in the food and nutraceutical industries, making it a valuable contribution to waste valorization and functional food development.
In previous studies, Hossain et al. [6] confirmed that both the extraction time and particle size are significant process factors for maximizing the oil yield, as shown using an analysis of variance. The integration of the crow search algorithm with the response surface methodology (RSM) enabled the identification of a global optimal solution, achieving a maximum oil yield of 29.96% under conditions of 6.5 h of extraction and a particle size of 0.85 mm. This finding was consistent with results obtained through the desirability function-based optimization approach. The predicted optimal configuration was experimentally validated, yielding 31.1% with a variation of less than 5%, confirming the robustness of the proposed model and its effectiveness in optimizing the oil extraction process from papaya seeds. In a study by Nyorere et al. [7], the extraction of papaya seed oil was optimized using the response surface methodology (RSM-BBD) and artificial neural networks coupled with a genetic algorithm (ANN-GA). The ANN-GA demonstrated greater accuracy, achieving an extraction yield of 44.42% and validating its superiority with an R2 of 99.90%. The physicochemical parameters of the oil met acceptable standards.
In other studies, for the recovery of phenolic compounds and the evaluation of papaya seeds, an extraction using supercritical fluids (SFE) was used. A completely randomized factorial design was used, evaluating different extraction parameters, such as temperature (40 and 60 °C) and pressure (10 and 30 MPa), on the yield (21.02–26.46%) and the total content of phenols (TPC) (15.34–34.23 mg GAE/g). The factorial design was based on a first-order equation obtaining a response surface without curvature, resulting in a poor interaction between independent factors [8]. Although the SFE is a green technology and suitable in biological studies, the factorial design is not enough to assess and find the optimal biological performances and activities. A central composite design (CCD), in addition to reducing the costs and extraction time, was used to select the best criterion for the evaluation of data obtained from the interaction of different factors [9]. The response surface methodology (RSM) together with the CCD was used to obtain a curvature, where the surface area gave us the optimized maximum point through a better use of the interactions of the independent factors. In our study, the extraction method involved preparing several freeze-dried papaya seed samples, which were homogenized with methanol based on the parameters provided by the central composite design. The samples then underwent mechanical maceration, followed by ten minutes of sonication. Afterward, the mixture was centrifuged at 2500 rpm for 10 min at 25 °C. The supernatant was subsequently recovered through filtration (Whatman No. 3 paper) and stored at −20 °C until analysis. This process ensured the integrity and preservation of the extracted compounds for accurate assessment [10]. The RSM was based on a secondary polynomial equation, using a central composite design approach. Therefore, the aim of this work was to optimize the extraction method to determine the free radical scavenging capacity of the phenolic and flavonoid content of papaya seeds (Carica papaya L.) using the response surface methodology and the support of a central composite design, ensuring a systematic exploration of the extraction conditions.

2. Materials and Methods

2.1. Materials and Chemicals

Papaya seeds were collected from a juice vendor. They were cleaned, washed with distilled water, and after were dried at 45 °C for 24 h in a convection oven (CGA Precision Scientific, Chicago IL, USA) and then powdered and passed through a No. 20 sieve (WS Tyler, USA). The power sample was packed in eppendorf tube and store in refrigerated at 4 °C during experimental period. All solvents were of analytical grade and purchased from Sigma Chemical Co. (St. Louis, MO, USA).

2.2. Response Surface Methodology and Experiment Design

To determine the optimal extraction conditions for obtaining bioactive compounds and evaluating their biological properties, a central composite design (CCD) was used in the study. The CCD matrix was performed to evaluate different extraction methods, yielding 26 treatments to obtain the best conditions. The optimization matrix was composed of four independent variables (Table 1): concentration of the solvent (X1), temperature (X2), time (X3), and exhaustion (X4). This advanced design of experiment (DOE) tool helped us to better understand the interactions between the factors. Response surface methodology (RSM) was used to determine the best conditions for extracting total polyphenol (TPC) and flavonoid (TFC) and evaluate the antioxidant activity (DPPH and ABTS). In addition, it was used to evaluate the optimal antioxidant activity of the papaya. Second-order polynomial equations in RSM allow for modeling interactions and nonlinear effects between variables, facilitating the identification of optimal conditions. They are essential for accurately representing the response based on multiple factors. The variation in the responses related to the factors was evaluated using the model of a second-order polynomial equations for each by the following Equation (1):
Y = β 0 + β i X i + β i i X i 2 + β i j X i X j
where Y is the predicted response; β0 is the fixed response at the central point; βi, βii, and βij are the linear, quadratic, and interaction coefficients, respectively; and Xi and Xj are the levels of the independent variables.

2.3. Extraction Conditions Provided by Statistical Optimization

Several freeze-dried papaya seed samples were homogenized with methanol to obtain the extract. Herein information provided by the central composite design was used. The extraction process involved homogenizing freeze-dried papaya seed samples with methanol, followed by mechanical maceration to ensure thorough extraction. This mixture was then sonicated for ten minutes, centrifuged at 2500 rpm for 10 min at 25 °C, and the supernatant was collected through filtration (using Whatman No. 3 paper). Finally, the extract was stored at −20 °C for preservation until analysis. This method was adapted from standard procedures [11].

2.4. Total Polyphenol (TPC) and Flavonoid (TFC) Content

The concentration of total phenolic content was determined using the Folin–Ciocalteu method described by Tang et al. [12] with some modifications. The reaction was performed by combining 150 μL of 1 N Folin–Ciocalteu reagent (1:10) with 30 μL of extracts and 120 μL of sodium carbonate (7.5%), the reaction was incubated at room temperature for 30 min. Following the incubation, the absorbance was read at 750 nm using a spectrophotometer microplate reader (Multiskan GO, Thermo Scientific, Whatmam, MA, USA). The content of total phenols was expressed as mg of gallic acid equivalents per g of dried weight (mg GAE/g DW) using a calibration curve prepared with gallic acid as a standard.
The total flavonoid content was determined using the method described by Al-Jadidi and Hossain [13] with some modifications. First, 100 μL of extract was mixed with 430 μL of NaNO3 solution (5%), and the solution was incubated for 5 min; 30 μL of AlCl3 (10%) was then added, and the reaction was incubated for an additional 1 min and then mixed with 440 μL of NaOH (1 M). The absorbance was measured at 490 nm using a spectrophotometer microplate reader (Multiskan GO, Thermo Scientific, Whatmam, MA, USA). A standard quercetin (Q) curve was prepared, and the total flavonoid contents are expressed as mg equivalents of quercetin per gram dried weight (mg QE/g DW).

2.5. Free Radical Scavenging Capacity

2.5.1. DPPH Assay

Free radical scavenging capacity of the DPPH radical was measured according the procedure described by Briones-Labarca et al. [14] and Gurnani et al. [15] with some modifications. DPPH radical (0.0025 g) was prepared with 100 mL of methanol solution (80:20 v/v); the absorbance of the radical solution was adjusted to 0.7 ± 0.02 nm using a microplate reader at 515 nm (Multiskan GO, Thermo Scientific, Waltham, MA, USA). Thereafter, 280 μL of DPPH radical was mixed with 20 μL of extracts and incubated in the dark for 30 min at room temperature. A control reaction mixture was prepared without any extract. The absorbance was read a microplate reader at 515 nm. The antioxidant activity was calculated using a Trolox calibration curve and expressed as Trolox equivalents per g of dried weight (μmol TE/g DW).

2.5.2. ABTS Assay

This assay was conducted according to the procedure described by Ang et al. [16] with modifications. The ABTS cation was generated using ABTS radical (0.019 g) dissolved in 5 mL of water with 88 μL of potassium persulfate solution (0.0378 g/mL); the mixture was incubated in the dark at room temperature for 16 h. Thereafter, 500 μL of ABTS radical was added to 30 mL of ethanol, and the absorbance was adjusted to 0.7 ± 0.02 nm using a microplate reader at 734 nm (Multiskan GO, Thermo Scientific, Whatham, MA, USA). The reaction mixture was placed in a microplate with 295 μL of ABTS solution and 5 μL of extract and incubated for 7 min. The absorbance was read at 734 nm. Trolox was used as a standard, and the antioxidant capacities are expressed as micromoles of Trolox equivalents per gram dried weight (μmol TE/g DW).

2.6. Identification of Sugars and Organic Acids

Determinations of sugar and organic acid compounds were extracted as described by Ornelas-Paz et al. [17] with some modifications. Briefly, 2 g of dried papaya seed was homogenized using 15 mL of ultrapure distilled water. The solution was vortexed for 1 min, homogenized in an Ultraturrax for 1 min, sonicated for 2 min, and centrifuged at 20,000× g for 10 min. The supernatant was recovered, and aliquots were filtered through a nylon membrane with a pore size of 0.45 µm.
For sugars determinations, 20 µL samples were injected into an HPLC system (Varian Inc., CA, USA) equipped with a ternary pump (Model 9012), a refractive index detector (Star Model 9040) and a UV/Vis detector (Model 9050). Separation was performed using a shodex SC-1821 analytical column equipped with a shodex SC-LG precolumn (Showa Denko America Inc., Tokyo, Japan) and column maintained at 70 °C. The separation was isocratic with HPLC grade water as the mobile phase, with a flow rate of 0.6 mL/min and a running time of 30 min. The identification and quantification of sugar compounds were performed by comparing the chromatographic characteristics of unknown peaks to commercially available external standards and calibration curves, respectively.
For organic acids identifications (20 μL samples were injected) using an Agilent 1200 series HPLC system (Agilent Inc., CA, USA) equipped with ternary pump, mixer, degasser, and a diode array detector. The separation was performed with an Aminex HPX-87H column (7.78 × 300 mm) equipped with a Bio-Rad precolumn (4.6 × 30 mm) (Bio-Rad Laboratories, CA, USA) maintained at 60 °C. The separation was isocratic with sulfuric acid 5 mM/acetonitrile (90:10 w/w) as the mobile phase, using a flow of 0.4 mL/min with a running time of 45 min, and the organic acids were monitored at 210 nm. The content of organic acids was expressed in milligrams of organic acid by gram of dry weight (mg/g DW). The calibration curves for each compound were made with the standards.

2.7. Statistical Analysis

The statistical optimization and response surface plots were generated using JMP 13.2.1 software (SAS Institute Inc., Cary, NC, USA). The response variables data were evaluated with an analysis of variance (ANOVA). The experimental model was validated at a confidence level of p < 0.05. A correlation analysis of the experimental and predicted values using the equation was performed to validate the model [18].

3. Results and Discussion

3.1. Central Composite Design (CCD) and Validation of the Statistical Methodology

In this study, the response surface method was employed by using CCD to determine the optimal conditions for extracting bioactive compounds from papaya seeds. The total number of experiments thrown by the model was based on Equation (2):
N = k 2 + 2 k + C p
where N is the number of treatments, K is the number of factors that were used in the design (in this case there were four), and Cp is the number of replicas of the central point.
Table 1 and Table 2 show the result of CCD matrix for the optimization of the extraction methods of papaya seeds. The matrix contains the experimental data and prediction formula data of the different extract conditions for obtaining the TPC and TFC, as well as the optimal free radical scavenging capacity (ABTS and DPPH). In order to define a model for the experiments, Table 3 shows equations for each response, based on the second-order polynomial equation, which was additionally related to the data predicted by the formula. These equations are used to substitute the values of the factors for others desired and thus arrive at a predicted answer mathematically [19]. The results predicted by the formulas serve to obtain all the data and the kinetics of the interactions of the factors [20,21]. To validate the model, a correlation was made using the experimental against predicted values (Figure 1). The R2 determines the coefficients of variation, indicating a greater dependence on the results and the total variance. A high correlation was found for ABTS, DPPH, and TPC (R2 = 0.8998, R2 = 0.8137, and R2 = 0.8104, respectively). The analysis of variance (ANOVA) showed the significance of the model (p < 0.001). A high correlation was found for ABTS (R2 coefficient of determination = 0.8998, R2 adjusted = 0.8325, R2 predicted = 0.9164), DPPH (R2 coefficient of determination = 0. 8137, R2 adjusted = 0.7637, R2 predicted = 0.8612), and TPC (R2 coefficient of determination = 0.8104, R2 adjusted = 0.7892, R2 predicted = 0.8852). The inclusion of model fit indicators provided a stronger validation of the model’s accuracy and predictive ability. The analysis of variance (ANOVA) shows the significance of the model (p < 0.001), while the coefficient of determination (R2) indicates that the model explains the variability of the data well. The adjusted R2 is especially important when there are multiple predictors, as it penalizes the number of variables in the model. Meanwhile, the predicted R2 evaluates the model’s ability to predict new values.
The ANOVA performed on polyphenols showed a significant model (p < 0.05), while the solvent factors (p < 0.05) and exhaustion (p < 0.01) show greater acceptance by the model. The F-value (18.8227) showed high values while the p-value (0.0012) remained low, which indicates the approval by the model (Table 4). However, in the ANOVA for the solvent–depletion interaction, an F-value (3.1312) with low values and p-value (0.1045) with values higher than the degree of significance established for this type of research were shown. The flavonoid model did not present a “lack of fit” (0.7018); subsequently, more information about the interaction of solvent and depletion will be provided through the RSM plot. On the other hand, the ANOVA performed on flavonoids showed a non-significant model (p > 0.05) for most factors (Table 5). The solvent–depletion interaction that stood out for polyphenols showed a non-significant F-value (p > 0.05), but showed a p-value below the degree of significance (p < 0.05). It should be noted that the flavonoid model did not present a “lack of fit” (0.0627), exceeding the upper threshold, which indicated that the model could proceed with the established standards for optimization. The factors that fit the model were temperature and exhaustion (p < 0.05). The values were significant.
Once again, the interaction that stood out for the free radical DPPH scavenging activity was solvent depletion (p < 0.01) (Table 6). This interaction was the one that obtained a better coupling with the optimization model used, which indicates that there was no “lack of fit”, as shown above with the values of significance. The ANOVA ABTS for the model was significant (p < 0.01) (Table 7). The model designed for the radical ABTS presented four highly significant factors, showing p-values of 0.0016 (solvent), 0.0087 (temperature), 0.0030 (time), and 0.0030 (exhaust). In addition, the interaction of solvent and temperature was significant p < 0.05, exceeding the degree of significance of the TPC, TFC, and DPPH. The “lack of fit” (3.034) was non-significant for this variable (ABTS), since the model was adjusted to the variables studied for the optimized extraction method and increased the free radical scavenging capacity from papaya seed.
The most important thing to note is the lack of adjustment value (p > 0.05), since it was required that the values conform to the model. The most significant variables expressed a mixture of a small p-value and a considerably high F-value. The parameters (coefficient of variation, the value of p-value, and the F-value) were significant, indicating that the model was valid to optimize the extraction method [22]. This study demonstrates that applying DOE and CCD significantly increased the free radical scavenging capacity of the compounds found in the various extracts. On the other hand, the effect of the different factors was of less impact to obtain the TPC and TFC. This may be because other biomolecules were found that are capable of electron donation or transfer other than the polyphenols quantified for papaya seeds. In addition, these compounds may not have the mechanism of inhibition to neutralize the free radicals ABTS and DPPH. In subsequent studies it is suggested to quantify more biomolecules that could be intervening in the biological activity.

3.2. Response Surface Methodology (RSM)

3.2.1. Optimization of Papaya Seed Extraction

The data from the matrix revealed (see Table 1 and Table 2) that the concentration of the solvent (x1) plays a crucial role in the extraction of bioactive compounds such as total polyphenols (TPC) and total flavonoids (TFC). The solvent concentrations used in the experiment varied from 0% to 100%, indicating that both aqueous- and methanol-based extractions were tested. As expected, higher solvent concentrations, particularly at 100%, generally resulted in higher values for both the TPC and TFC. This suggests that methanol is a more efficient solvent for extracting these compounds compared to water. For instance, treatment 6, with a 100% solvent concentration, 30 °C, and 6 h of extraction, yielded the highest TPC value of 6.168 mg AGE/g W.D. This trend was consistent across most treatments, highlighting the importance of the solvent concentration in maximizing the extraction efficiency of polyphenols and flavonoids.
The temperature (x2) also significantly impacted the extraction process, with values ranging from 30 °C to 60 °C. Higher temperatures, particularly 60 °C, tended to improve the yield of both TPC and TFC in some cases. For example, treatment 1, which was conducted at 60 °C, resulted in 5.970 mg AGE/g WD for TPC and 43.058 mg QE/g WD for TFC. However, this trend was not entirely consistent, as the interaction between the temperature, solvent concentration, and other factors, such as extraction time and depletion cycles, played a role in determining the final outcome. This indicates that temperature is an important factor, but it may need to be optimized in conjunction with other variables for best results.
Extraction time (x3) was another critical factor influencing the yield of bioactive compounds. The times evaluated in the experiment ranged from 1 h to 6 h. Longer extraction times generally led to higher yields, especially when paired with higher solvent concentrations. This was evident in treatment 6, where a 6 h extraction with 100% solvent at 30 °C produced the highest TPC value in the matrix, at 6.168 mg AGE/g WD. This finding supports the idea that extending the extraction period allows for a more thorough extraction of compounds like polyphenols and flavonoids, particularly when using methanol as the solvent.
Lastly, the depletion time (x4), or the number of extraction cycles (ranging from 1 to 6) also played a significant role in enhancing antioxidant capacities such as DPPH and ABTS. For example, treatment 1, which involved six depletion cycles, demonstrated the highest DPPH scavenging capacity at 165.393 μM ET/g WD. This suggests that repeated depletion cycles enhance the antioxidant activity by allowing more time for the solvent to interact with the papaya seed matrix, thereby extracting a greater amount of antioxidant compounds. This trend was seen consistently across treatments, indicating that the depletion time is a key factor in optimizing the antioxidant potential of the extracts.
The results from the matrix emphasize the importance of optimizing multiple factors—solvent concentration, temperature, extraction time, and depletion cycles—in order to maximize the extraction of TPC, TFC, and antioxidant capacities (DPPH and ABTS) from papaya seeds. Each factor contributes differently, and their interactions are crucial for obtaining the highest yields of bioactive compounds. The matrix clearly demonstrates the significance of solvent concentration and extraction time in optimizing TPC and TFC extraction, as well as antioxidant capacity as measured by DPPH and ABTS assays. Methanol (100% solvent concentration) appears to be particularly effective in extracting polyphenols and promoting antioxidant activity, especially when combined with higher temperatures and longer extraction times. However, flavonoid extraction appears to be more variable, with the highest values observed at both extremes of solvent concentration (0% and 100%).
The repeated depletion cycles positively influenced DPPH and ABTS scavenging capacities, likely due to the increased contact between the solvent and papaya seed matrix, allowing for a more complete extraction of antioxidant compounds. Treatments with higher depletion times (six cycles) consistently showed higher antioxidant activities, suggesting that extending the extraction process increases the bioactive compound yield. Additionally, treatments with moderate solvent concentrations (50%) and mid-range temperatures (45 °C) also performed well in terms of antioxidant capacity, particularly in the ABTS assay, suggesting that intermediate conditions can sometimes outperform more extreme ones, depending on the specific compounds being targeted.
The matrix shows that optimizing extraction conditions for polyphenols and flavonoids, as well as antioxidant capacity, is a complex task influenced by multiple factors. A balance between solvent concentration, temperature, extraction time, and depletion is key to maximizing bioactive compound yields.

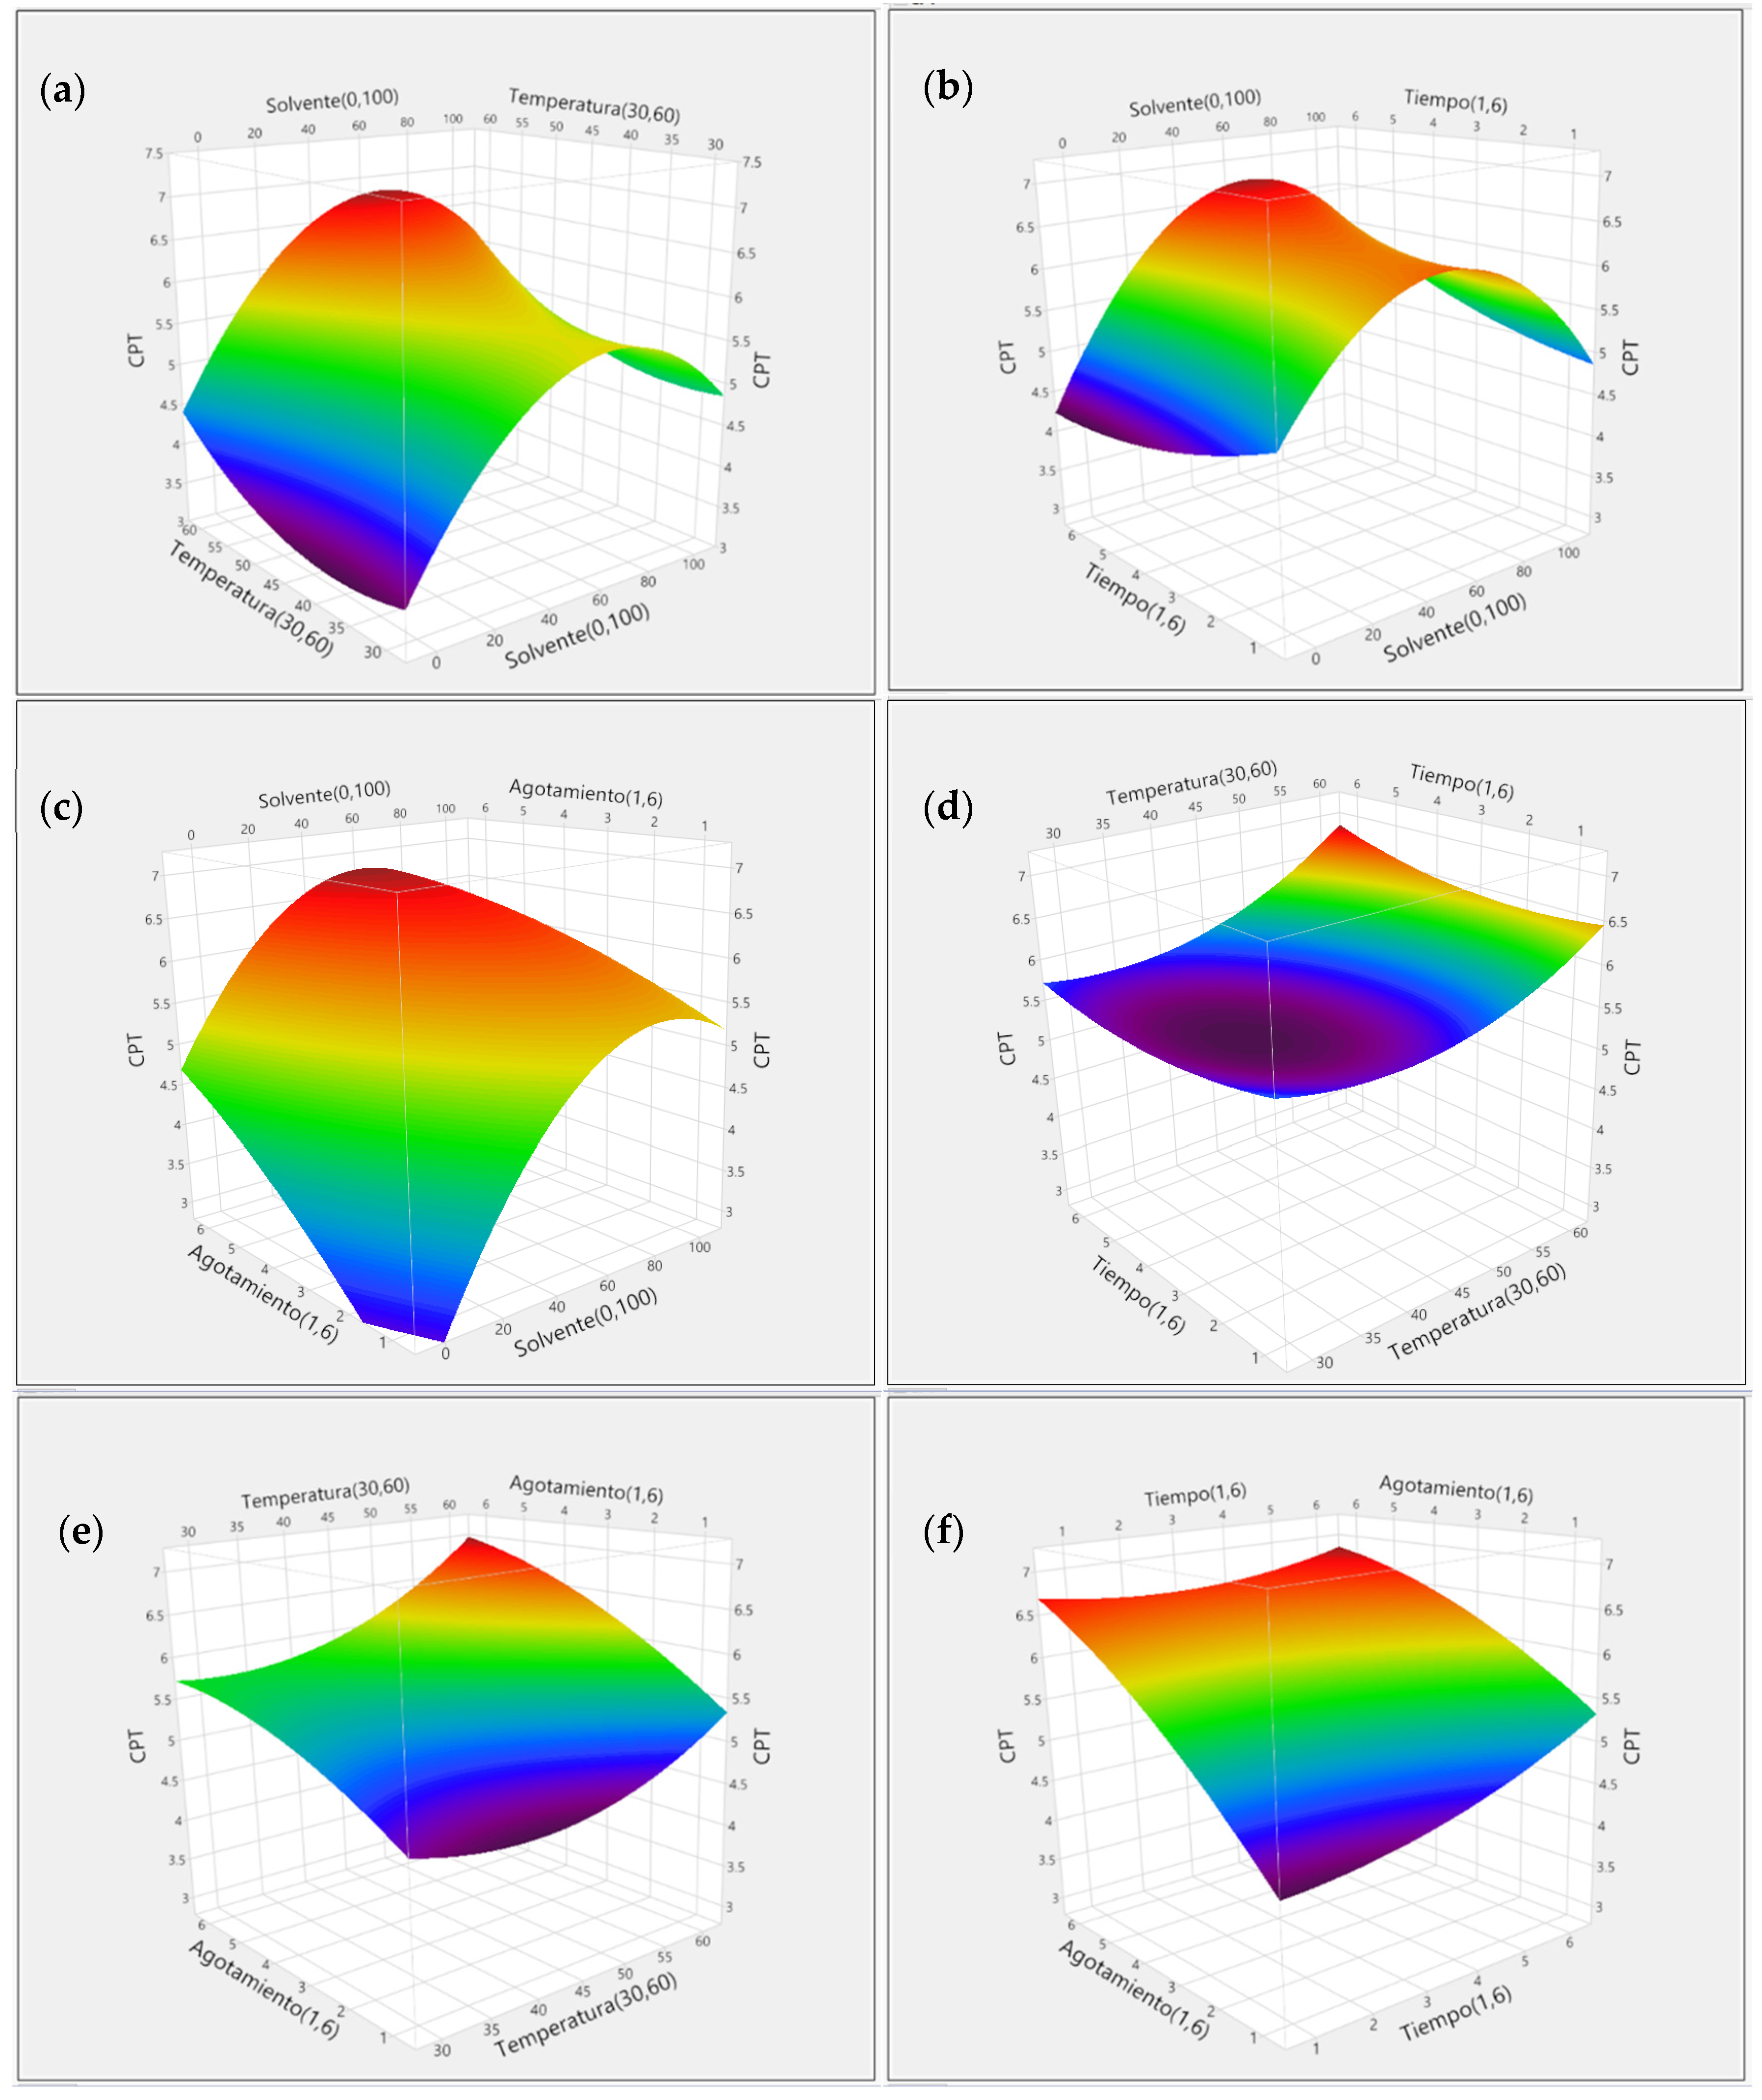
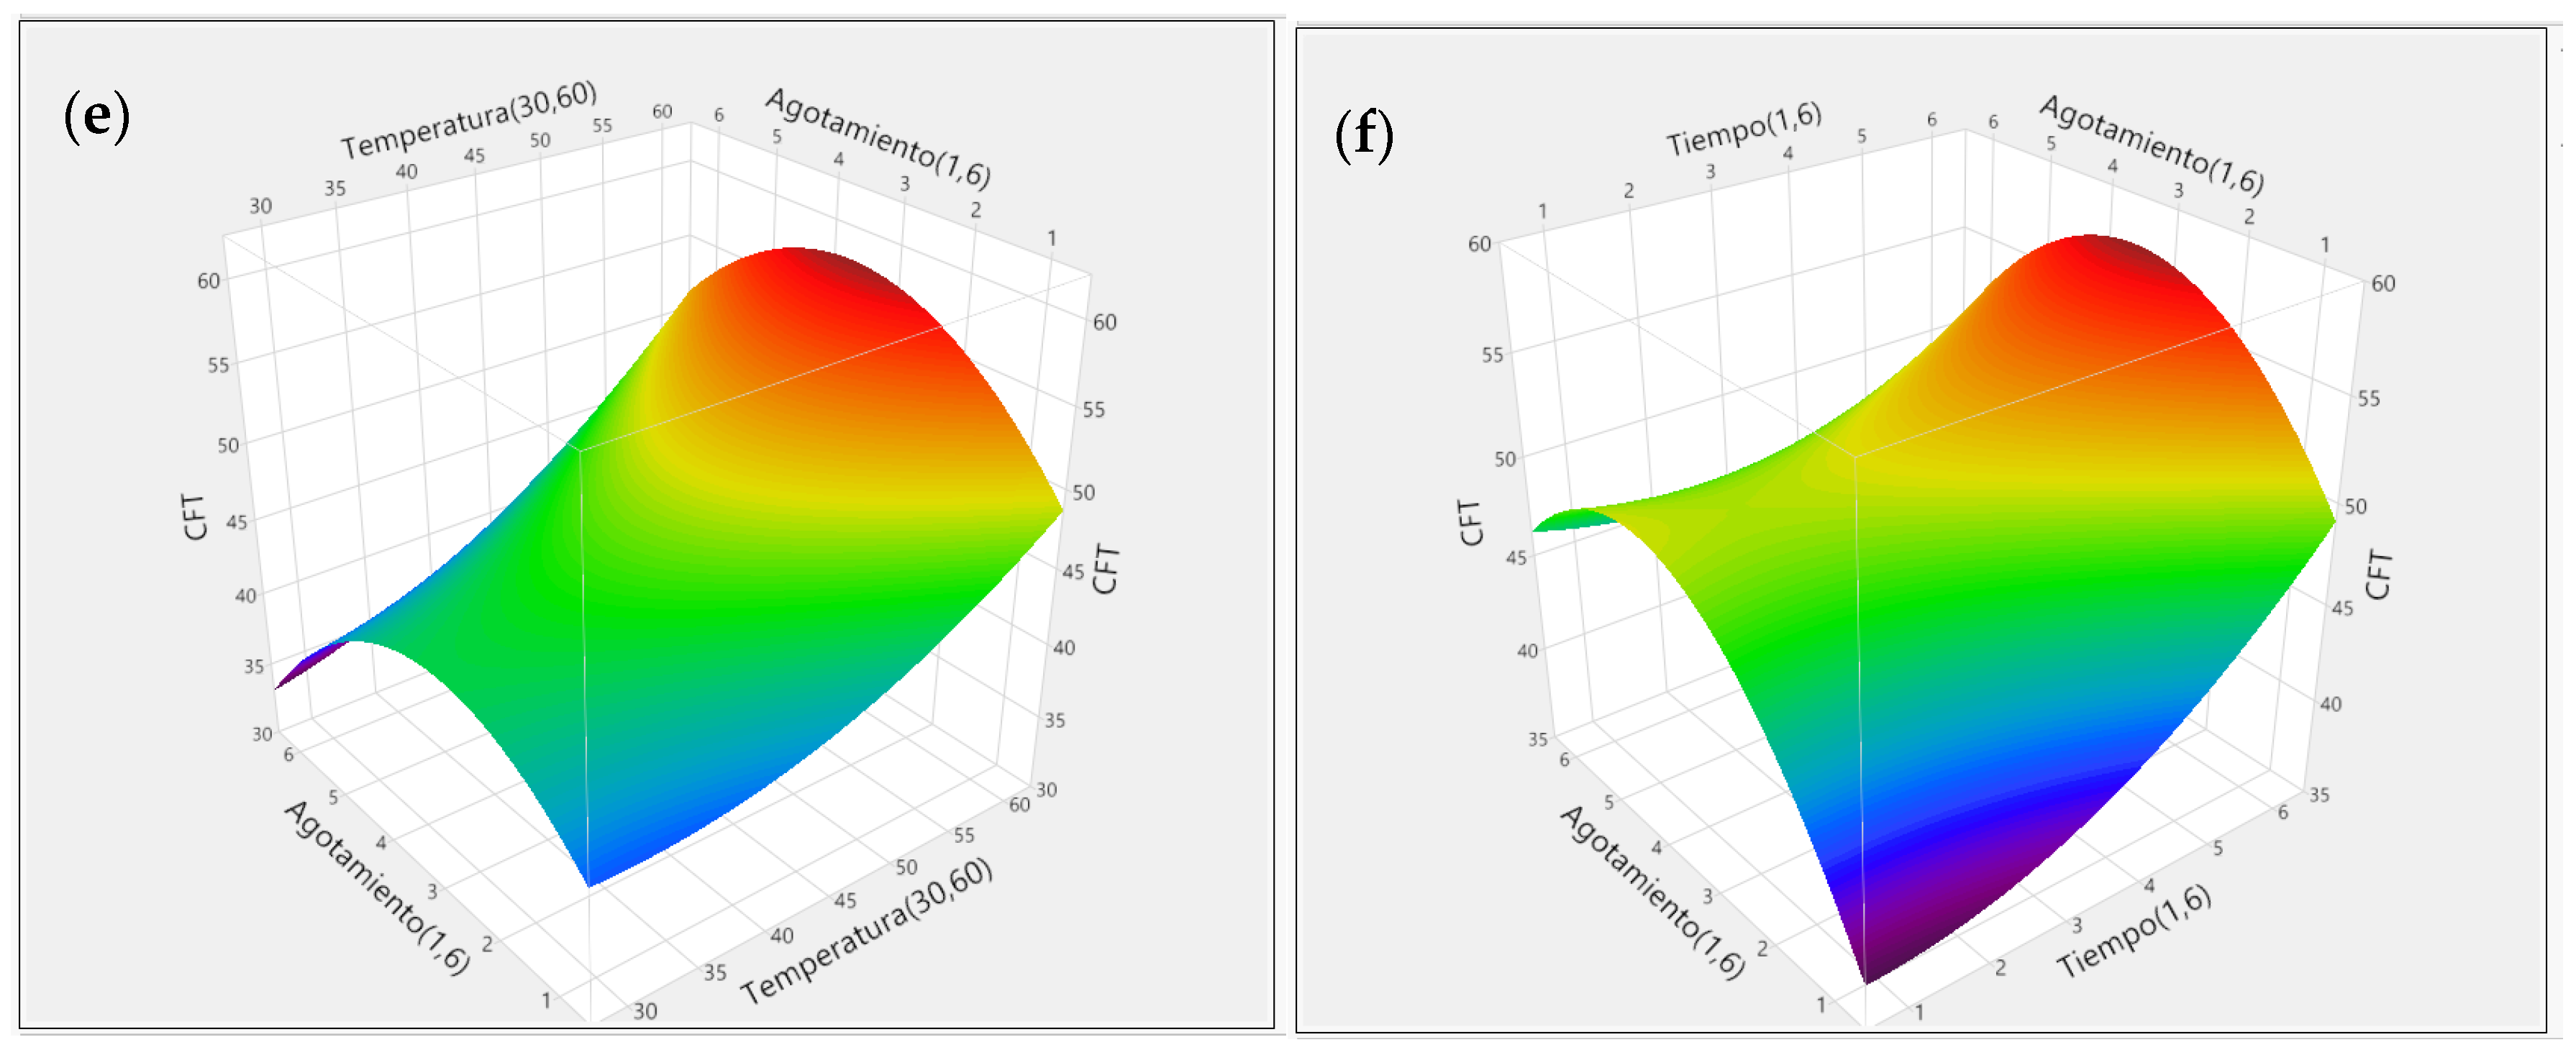
3.2.2. Effect of Extraction Variables on TPC and TFC

The RSM is a statistical technique based on the fitting of an equation to the experimental data, which must describe the behavior of a data set in order to make statistical predictions. Polyphenols are phytochemicals found in an immense range of organisms, such as plants. They represent an important group of secondary metabolites, since they are chemopreventive agents in cardiovascular diseases and neurodegenerative disorders, which are associated with oxidative stress. The extraction of phenolic compounds from seeds depends on several factors: solvent, temperature, time, and exhaustion. The TPC values shown by the CCD suggest that the variability of the results was low. The interactions between each factor were not highly important for their extraction. However, a tendency was observed for certain levels of solvent (100%) and temperature (30 °C) to present the highest value in this treatment. The low TPC values were presented in the extracts with 0% methanol (aqueous extract) at low temperatures. The extraction of the polyphenols depended directly on the polarity of the solvent. The results indicated that less polar compounds could be found, which is why they were better extracted with methanol, which has a polarity index of 5.1. The results obtained in our study are different from those reported by [23]. They reported higher concentrations under the same study conditions. Time was a limiting factor for the study, as research by Hall et al. [24] obtained higher values during the first 20 min. These differences in TPC values may be due to the nature of the raw material, the growing conditions, and the ripening time. Phenolic compounds are part of the metabolism of the plant and, therefore, are in constant fluctuation, in addition to the influence of external factors and extraction methods [24,25].
The main difference between previous studies and our study is the design of experiments used and the response surface methodology. The response surface plots present the main effects of the different interactions between factors. Figure 2 details the lack of fit in the levels of each factor, because most interactions show the highest point in the graph outside the study area. Therefore, the range of study should be extended for some variables. The interactions between the solvent, time, and temperature were found outside the study area, while the solvent–depletion interaction was the most appropriate (Figure 2c). This interaction was shown with a 60% solvent (methanol/water, 60/40 ratio). The methanol–water mixture improved the extraction of polar phytochemicals such as polyphenols. The addition of water to mixtures with organic solvents improves the penetration with the plant material and thus increases the contact area between the solid material and the solvent [26]. On the other hand, the effect of temperature (Figure 2) showed a tendency to increase the TPC. The dissolution constant of each phenol was different depending on the concentration of the solvent and type of solvent, resulting in a variation in the extraction time. The solubility and polarity of the compounds in the extracts were the main source of variation.
Based on the second-order polynomial equation, the optimal value for the TPC was 5.46 mg AGE/g DW. In addition to the parameters of the model, the optimal value depended on the sum of the coefficients of variation, which multiply each variable, and interactions between factors, elevated to the square’s factors. The latter gives curvature to the surface, which allows the modeling of the response. The surface plot revelated that the optimal factor was 100% solvent and depletion six times.
The obtained TFC values did not behave in a similar way to the TPC values. The CCD showed non-significant values (p > 0.05) with low F-values (0.9380) and high p-values (0.5530). The factors and their interactions were not effective to obtain the optimum flavonoid extraction. The factors and their interactions were not significant, showing p-values above the confidence interval (95%). The value closest to the confidence interval was the solvent–depletion interaction (p-value 0.0797), as well as for the extraction of the TPC. The source of variation denomination “lack of fit” confirmed what was said previously, since it presented a lack of adjustment in the model. The surface plot shows that the ranges of the study area were not sufficient, since the optimal production point for the TFC was not found. In this part, it was necessary to add axial points, to increase the study range and thus ensure that the response surface reached the optimum point of production [27]. The TFC increased when extracting water in the interactions with temperature (60 °C) and time (six times) with a production of around 67 mg AGE/g DW (Figure 3a,b). The solvent–exhaustion interaction showed maximum values at the extremes of the response surface, adopting a chair shape, with a production of around 65 mg AGE/g DW (Figure 3c). The temperature–depletion (Figure 3e), temperature–time (Figure 3d), and time–depletion (Figure 3f) interactions presented the lowest TFC extraction values. Unlike the TPC, PFCs do not need a greater number of depletions to maximize their extraction. Here, degradation can be present due to excess solvent, making it difficult to extract [21]. Derived on the second-order polynomial equation, the optimal value for the TPC was 57.74 mg AGE/g DW. This may be due to the polar nature of the compounds themselves and the solvent that enhanced their production. However, the ranges in the established factors were not adequate for the extraction of the TFC; in this case, most polyphenols are flavonoids.

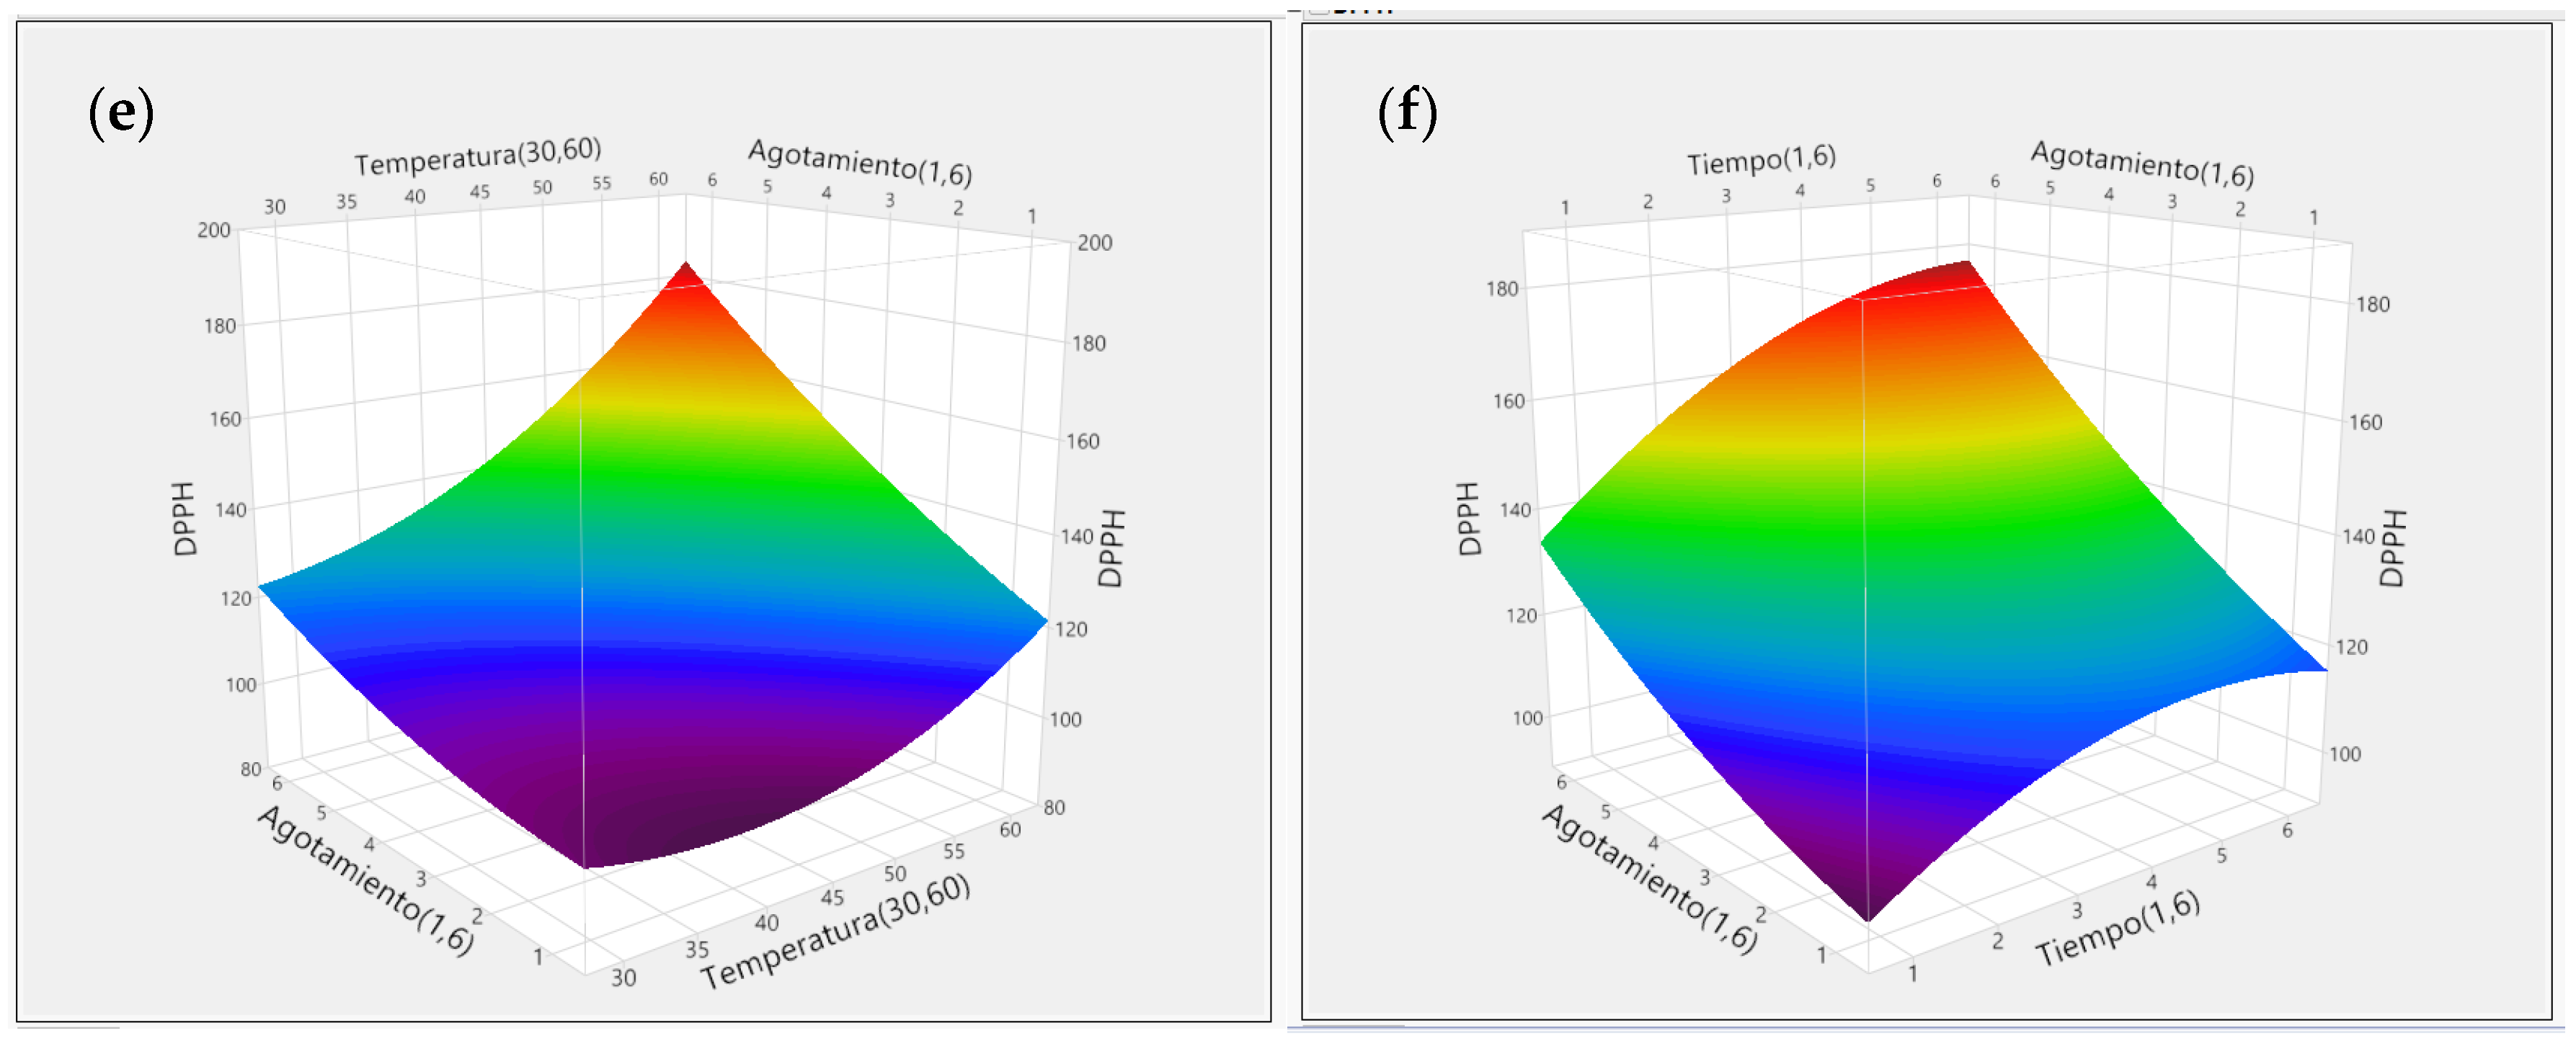
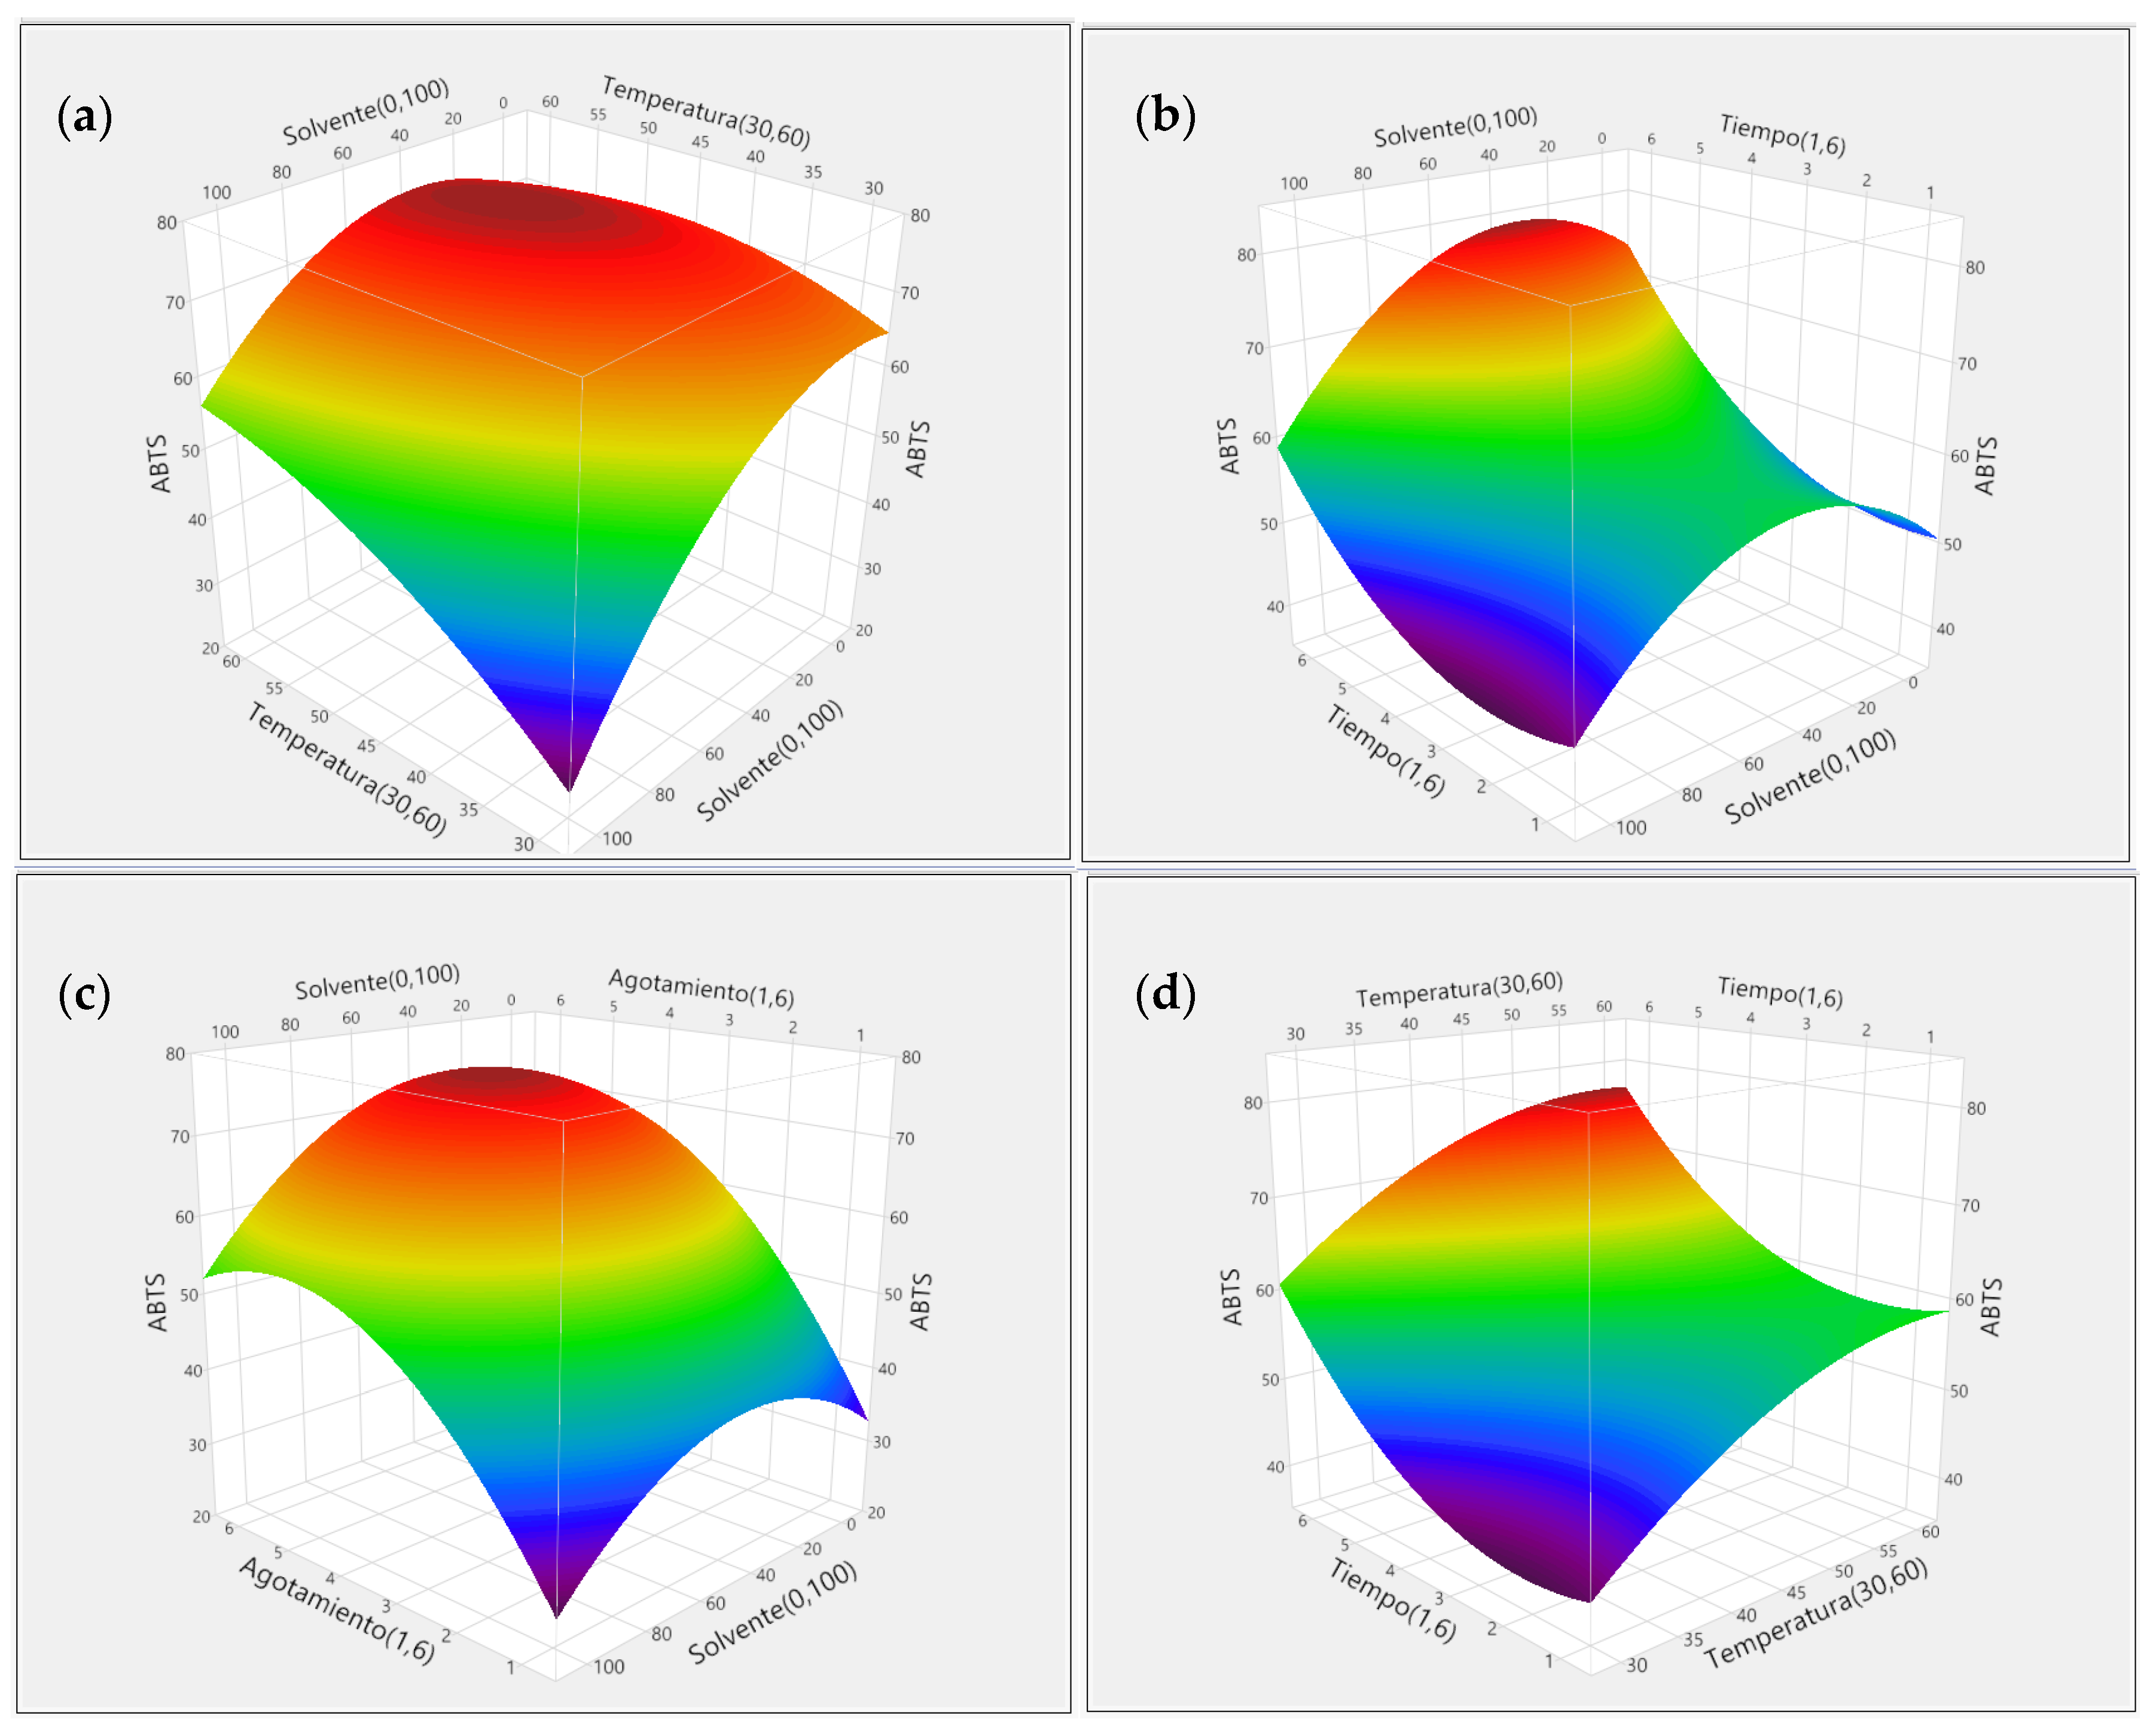
3.2.3. Effect of Extraction Method for Free Radical DPPH and ABTS Scavenging Capacity Using RSM

Free radicals are responsible for cellular oxidation, which is associated with different chronic degenerative diseases. Therefore, it is appropriate to elucidate a new route to inhibit free radicals. Free radical activity depends on the compounds synthesized by an organism, in this case the seeds of the papaya, and a determining factor as the extraction method. For this reason, determining and evaluating the optimum extraction methods is of the utmost importance for the study using statistical tools such as CCD and RSM. The inhibition will also depend on the type of antioxidant, the radical, and the extraction conditions. A large number of antioxidants inhibit the DPPH radical through hydrogen atom transfer mechanisms (HAT). The transfer of protons stabilizes this radical through a reductive reaction [28].
The validation of the model used for free radical DPPH radical scavenging was carried out using an ANOVA. The validation method evaluated the interaction of the different parameters used and measured the relationship with the antioxidant compounds. Table 6 shows the linear, quadratic, and interaction effects of the different factors that affected the trapping analysis of the DPPH radical. The main factors affecting the analysis were time and depletion, while the solvent factor was significant (p < 0.05), despite having a relationship in conjunction with exhaustion, affecting the result [29]. The model (0.0232), temperature (0.0181), depletion (0.0292), solvent–depletion interaction (0.0072), and solvent–solvent interaction (0.0425) were the sources of significant variation (p < 0.05); however, the solvent–depletion interaction presented a greater degree of significance (p < 0.01).
The scavenging capacity of the DPPH free radical of the papaya seed extracts ranged from 29,434 (treatment 9) to 165,393 μM TE/g DW (Table 6). In general, the lowest results were presented at solvent concentrations of 100%, unlike in the TPC and TFC, where they obtained values lower than 0% solvent (aqueous extract). On the other hand, the maximum value of AOX activity for DPPH coincided with the maximum values for the TFC (treatment 3), while for the TPC there were three treatments (1, 10, and 15). This indicates that the polyphenols could be related to the AOX capacity [30]. In a study by Nieto-Calvache et al. [31], the values (4.50 to 4.85 μg ET/g DW) obtained in pulp and papaya peel were lower than in our study. In this part of the discussion, we observe that the optimization process probably plays a very important role when establishing extraction conditions. On the other hand, in studies by Briones-Labarca et al. [14,32], the obtained values were in the range of 30–120 μg TE/g DW of papaya seed, which are similar to those present in our study. The extraction conditions were different, but in this investigation, they used ultrasound-assisted extraction. The assistance in the extraction by the use of these tools increases the penetration of the solvent to the tissues of the sample being studied and degrading non-covalent bonds of the cell membranes, allowing a better extraction for the similarity of results. The concentration and polarity of the solvents used for the extraction of antioxidant compounds require a posteriori analysis of the concentrations and polarity of the solvent to be evaluated, and also the type of sample that is evaluated. It has been observed that the maximum concentrations used an 80% solvent concentration. Because of its polarity and the structure of the polyphenols, the ethanol–water mixture was more effective. This is due to the presence of functional groups such as hydroxyls (-OH), ethers (R-O-R), and aldehydes (-CHO), in addition to them containing double bonds in their structure [33].
Figure 4 shows the response surface plot to observe more clearly the interactions that occurred in the treatments. The response surfaces plot obtained for the DPPH radical inhibition highlight a trend towards the extremes of the highest values. For this reason, the maximum point on the surfaces was not obtained, indicating that the intervals used in the factors did not favor optimization, since the maximum values were outside the study area. However, if the ranges were expanded, the AOX capacity would continue to increase, until reaching the maximum point on the surface, optimizing its extraction. On the other hand, the tendency to use the solvent at around 60% remains latent, as shown in Figure 4a–c. This behavior has similarities to the values obtained from the TFC, since it shows that when an extraction cycle is repeated, the antioxidant activity increases; however, when performing a third cycle of extraction, the increase in its antioxidant action observed in other investigations was not shown [34]. The maximum value shown as a result of the multiplication of the coefficients of variation for each individual factor, interaction, and factors squared, show at most an AOX capacity of 191.67 μg TE/g DW.
In relation to the validation of the model used for free radical ABTS radical scavenging, this was carried out using an ANOVA and its respective coefficients of variation. The validation method evaluated the interaction of the different parameters used and measured the relationship with the antioxidant compounds. Table 7 shows the linear, quadratic, and interaction effects of the different factors that affected the trapping analysis of the ABTS radical. The model presented a significate p-value (p < 0.05). The main factors affecting the analysis were the solvent (0.0016), temperature (0.0087), time (0.0030), depletion (0.004), and solvent–temperature interaction (0.0454), all of which were sources of significant variation (p < 0.05), However, the depletion factor presented the higher significance (p < 0.01).
The main factors affecting the analysis were time and depletion, while the solvent factor was not significant (p < 0.05), despite having a relationship in conjunction with exhaustion that affected the result [29]. The model (0.0232), temperature (0.0181), depletion (0.0292), solvent–depletion interaction (0.0072), and solvent–solvent interaction (0.0425) were the sources of significant variation (p < 0.05); however, the solvent–depletion interaction presented a greater degree of significance (p < 0.01). The papaya seed extracts showed an antioxidant activity for the ABTS radical of around 15,151 (treatment 9) to 72,389 μM ET/g DW (treatment 11) (Table 8). The activity against the radical ABTS decreased at concentrations of 100% solvent and at an extraction temperature of 30 °C, with a behavior similar to the low values present for the DPPH radical. The values showed a relationship contrary to the concentrations of the TPC and TFC found for the same factors. However, an increase in AOX activity was observed, showing a tendency to use solvent concentrations of 60% but with prolonged times and depletion (6 h and from four to eight depletion cycles, respectively). Nevertheless, treatments 10 (TFC) and 18 (TPC) coincided with the values obtained for the antioxidant capacity for ABTS. In the case of the ABTS analysis, it only coincided in one treatment with the TFC, which was treatment 10, and one for the TPC, which was treatment 18.
Figure 5 shows response surface plots of the interactions that occurred between interaction factors. The response surface plot showed the optimum point within the study area, where the solvent–temperature (Figure 5a), solvent–depletion (Figure 5c), and exhaustion–temperature (Figure 5e) interactions presented the maximum of the surface. The number of extractions made to the sample is very important for the activity against the radical ABTS, since it extracts a greater number of compounds capable of inhibiting it [34,35]. In this context, in some cases two extractions are sufficient [36], where the first extract contains more than 80% of the total extractable compounds and the second contains approximately 10%, presenting a small amount of these compounds in the third and fourth extract. The behavior and trend of the increase in activity against the ABTS radical was similar to that observed for the DPPH radical, leading the effect of the variables to the extremes, as the maximum point for some interactions was outside the study area (Figure 5b,d,f). The treatment with the solvent around 60% showed the maximum value. This behavior has been observed and evaluated in another investigation [34]. The maximum value shown as a result of the multiplication of the coefficients of variation for each individual factor, interaction, and the factors squared, showed at most an AOX capacity of 69.866 μg TE/g DW in the treatment with 0% of solvent, 60 °C, 6 h, and six depletion cycles.
Although DPPH and ABTS assays measure antioxidant capacity, a difference in the responses of the ABTS test can be observed for the treatments analyzed. This may be because the ABTS assay is based on the generation of a radical that is applicable to both hydrophilic and lipophilic antioxidant systems, while the DPPH assay uses a radical dissolved in organic media and, therefore, is applicable to hydrophobic systems [30]. These results showed a difference with other investigations, in which they obtained results of around 0.4 μM TE/g DW in papaya seeds and peels [37,38]. The difference between the results may be due to the fact that the treatment used for the extraction of the mentioned investigations was from electric pulse fields (EPFs), which has the characteristics of being a non-thermal method of very short duration, which causes an effect of semi permeability in the membrane, so that the temperature can be a feature in the methods that helps improve the performance of extraction of compounds with antioxidant capacity [39].

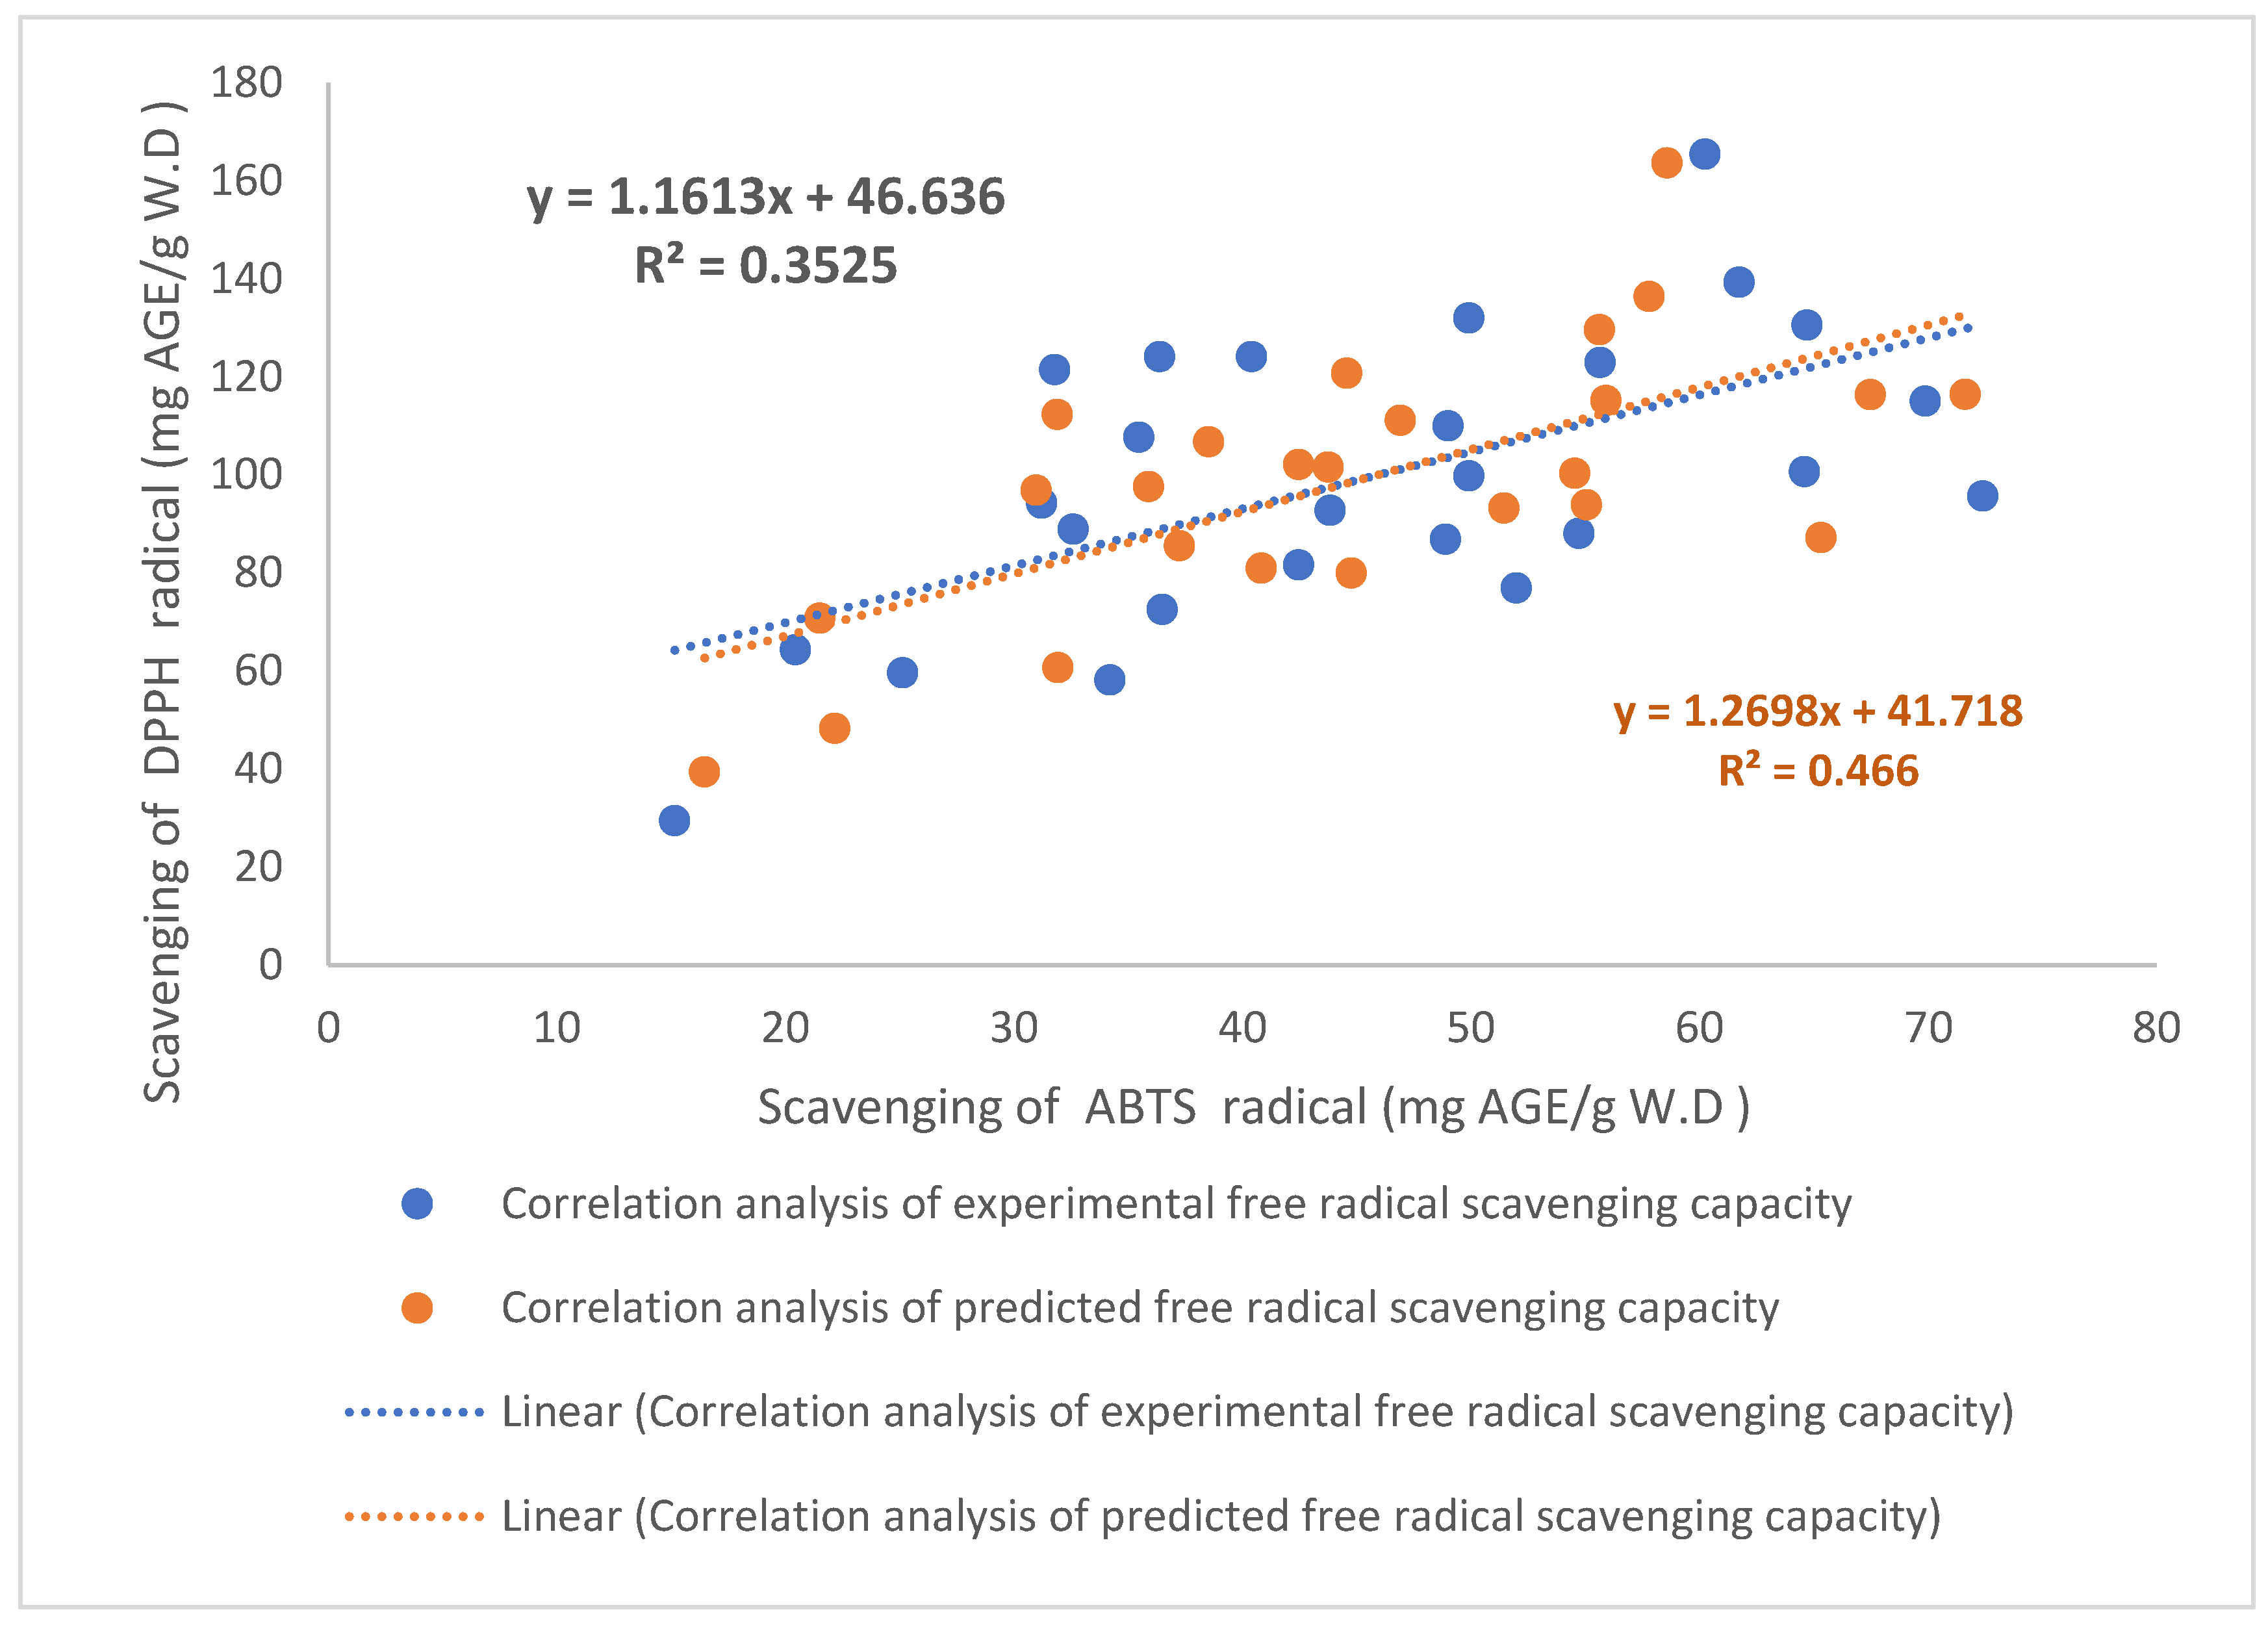
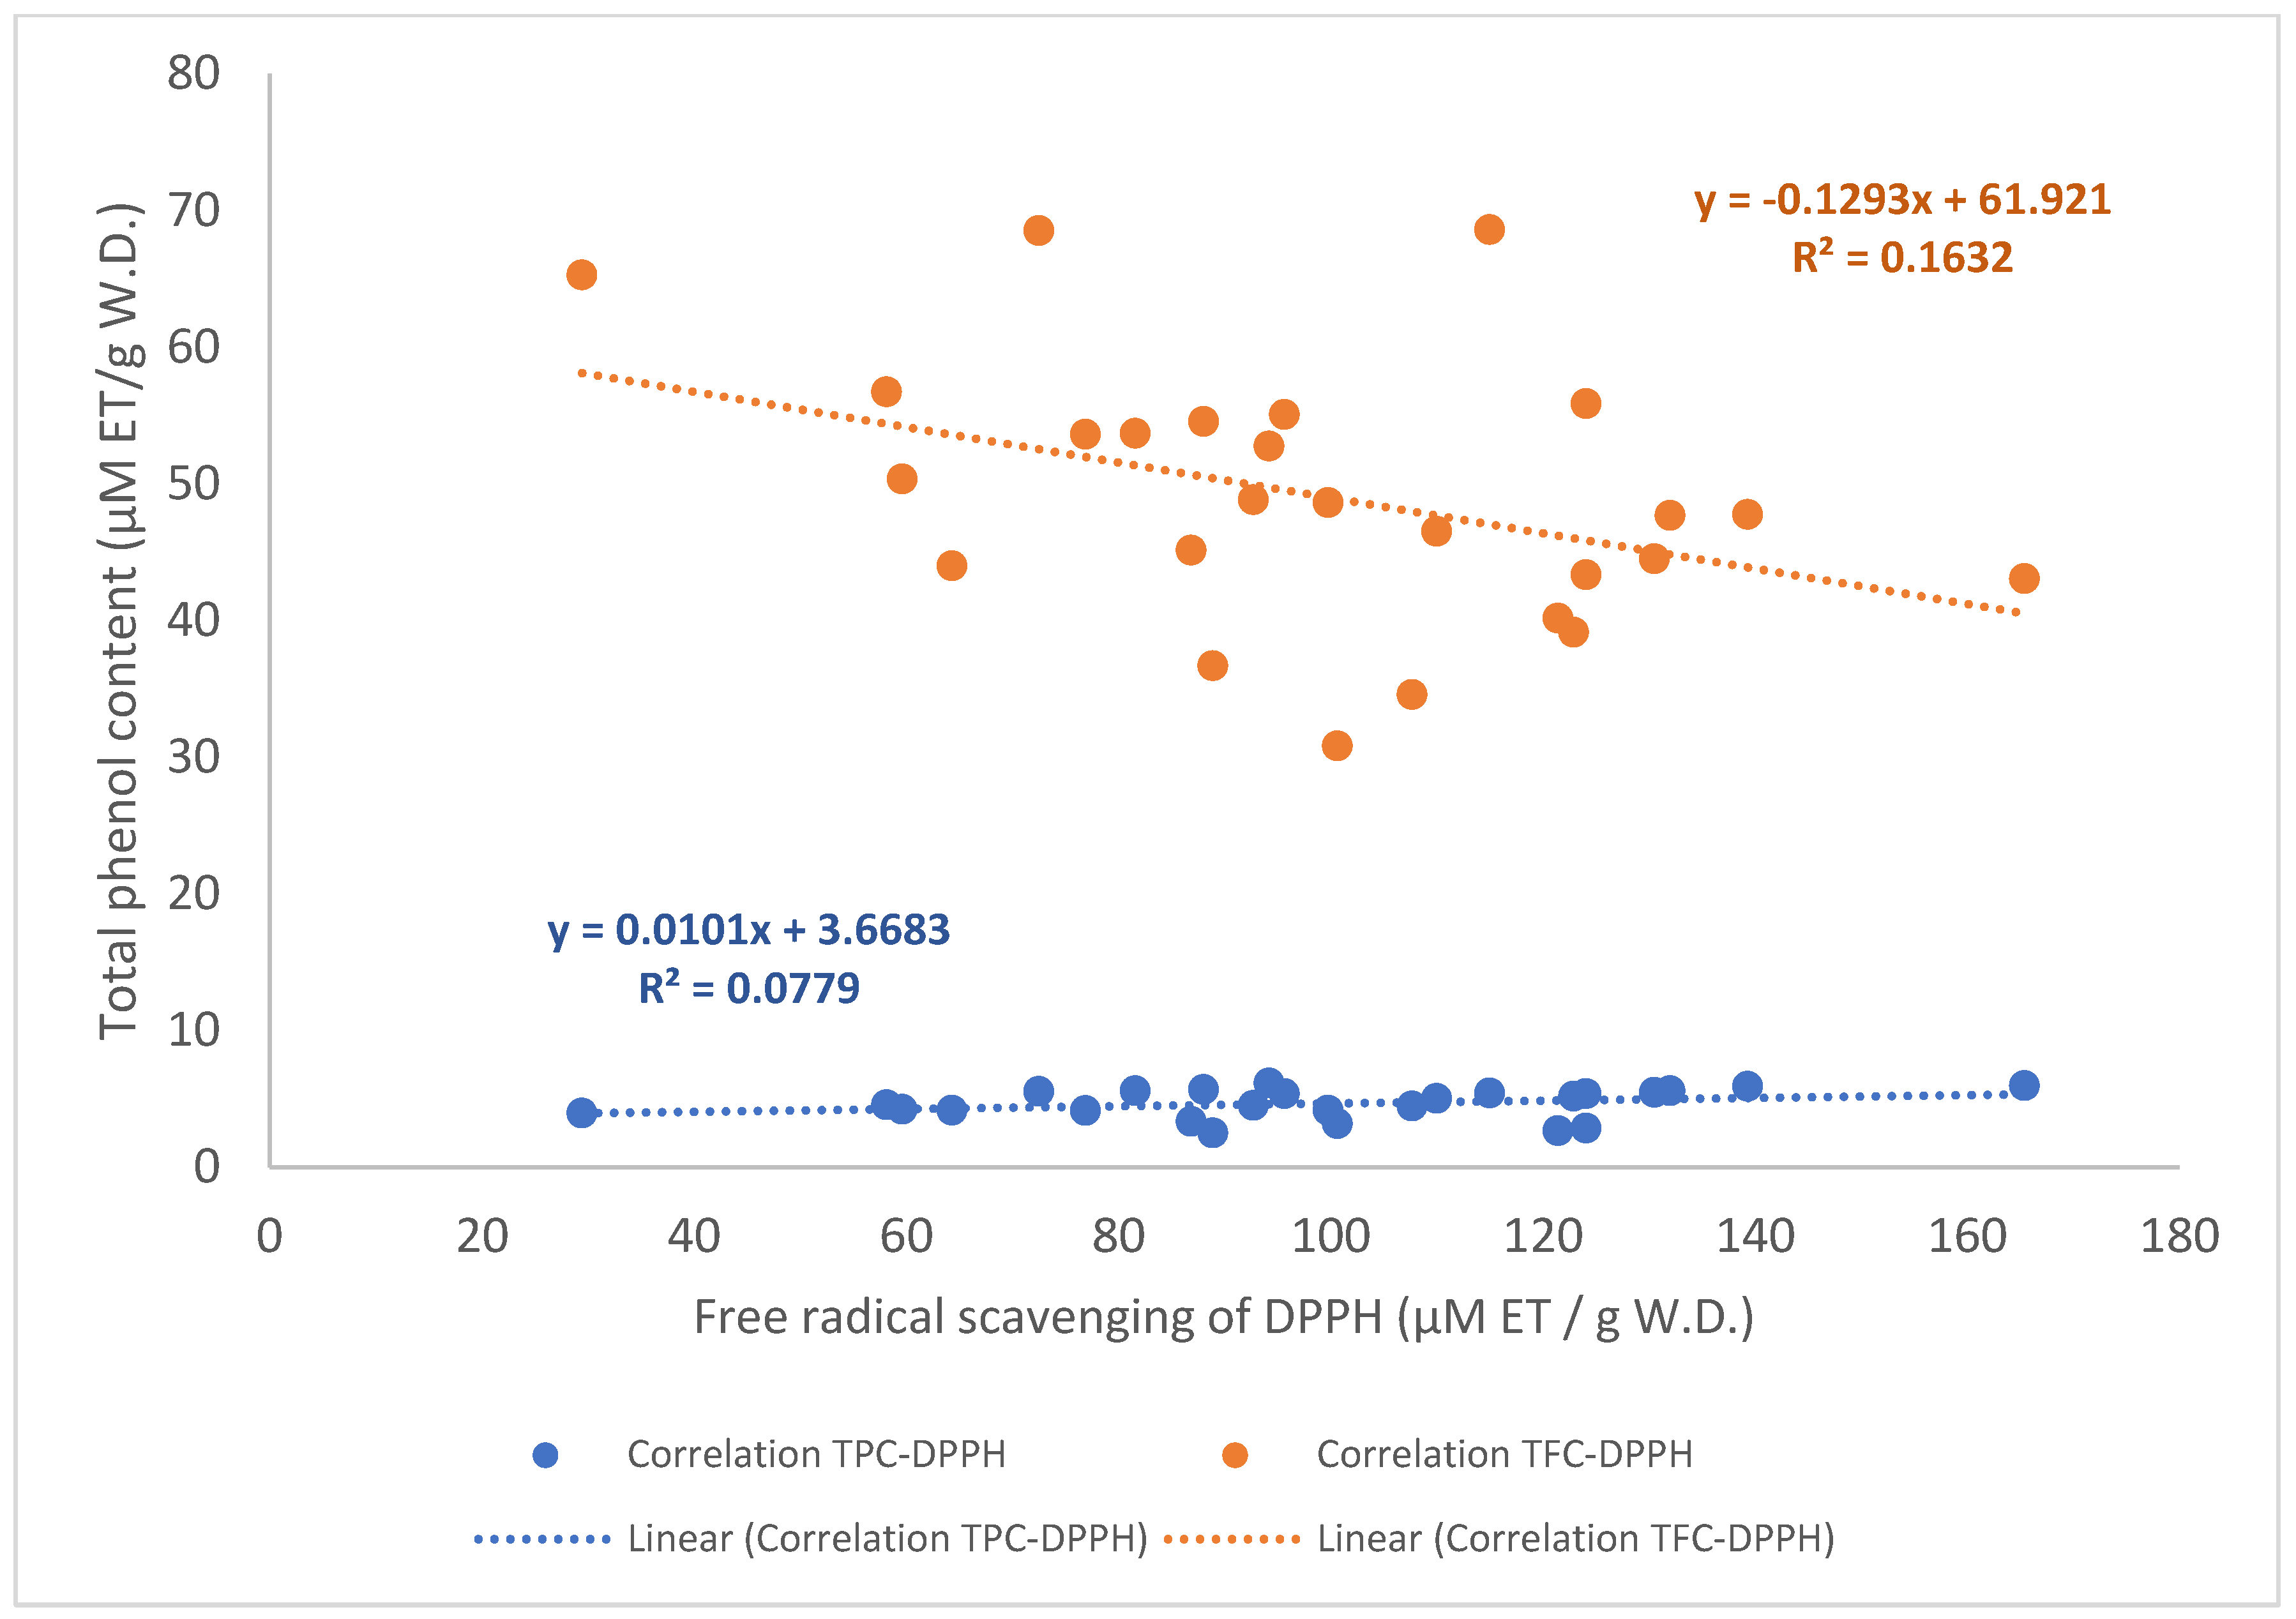
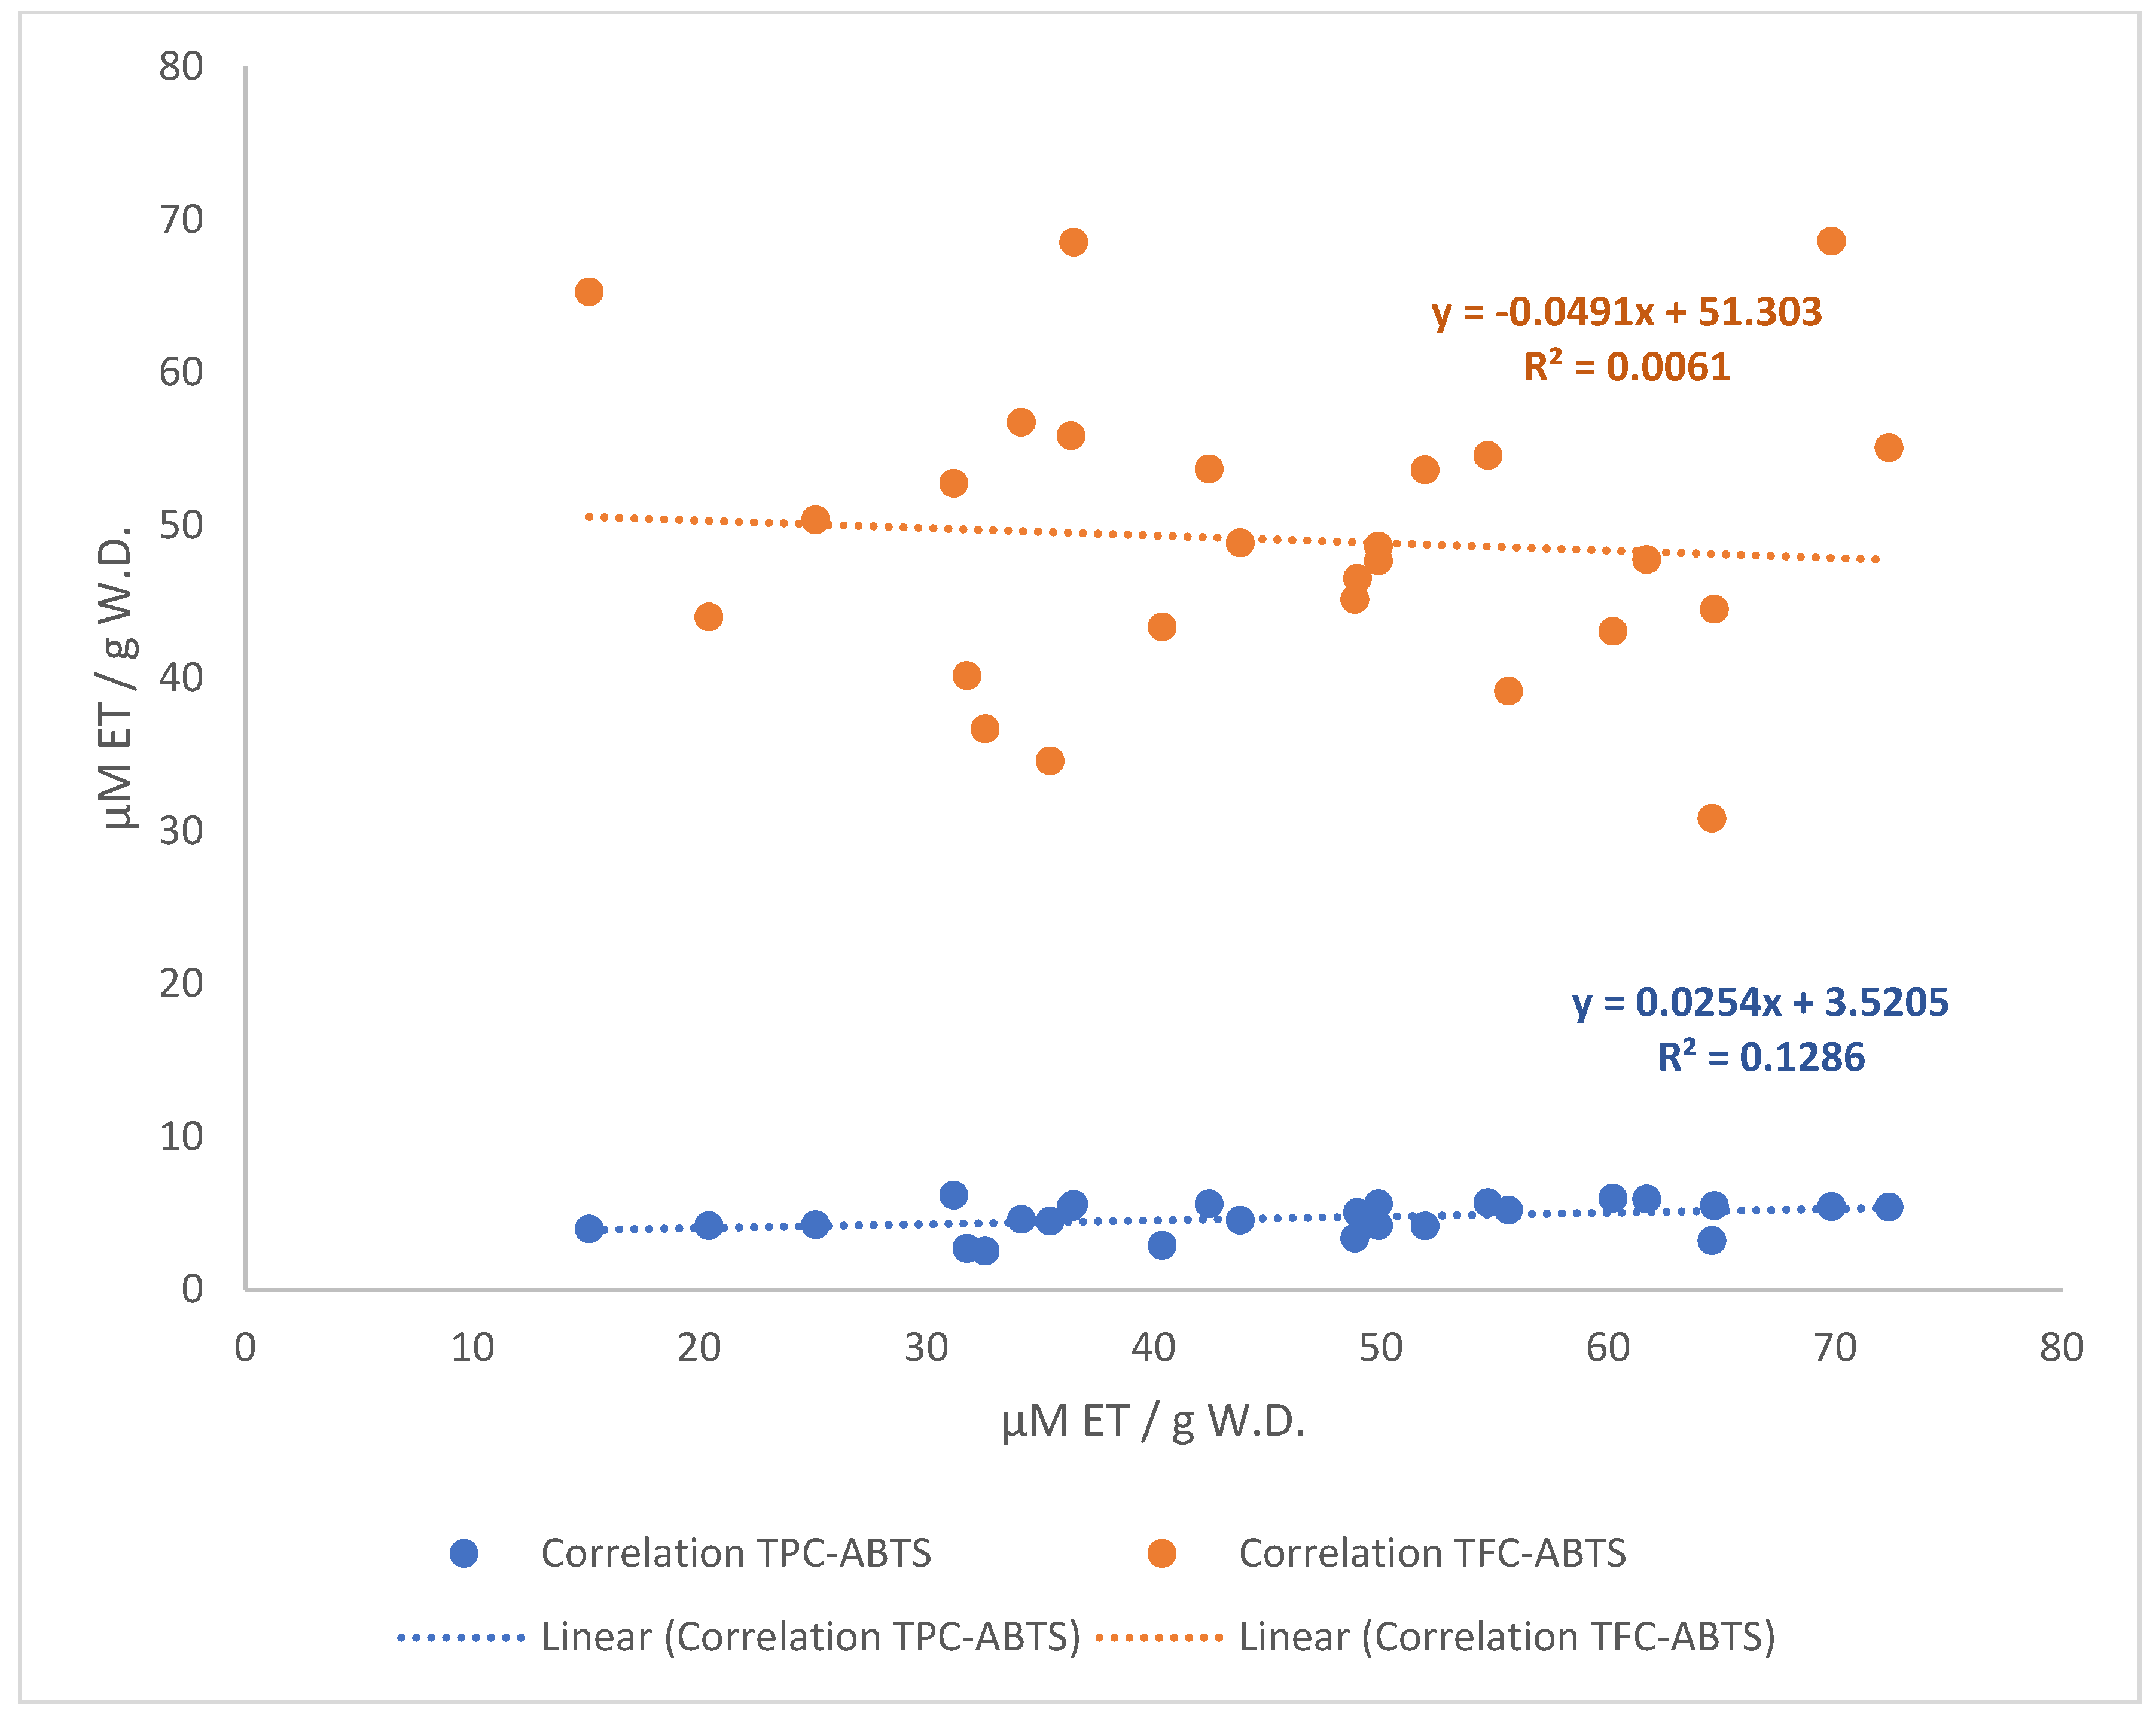
3.3. Correlation of the Free Radical Scavenging Activity and Polyphenol Compound

The main objective of evaluating the correlation between the results of the dependent variables (TPC, TFC, DPPH, and ABTS) was to determine the intensity of the relationship between them. This study helped us to determine and evaluate the relationship of two or more variables. This tool allows us to observe the increase or decrease in the variables. In general, it shows whether the phenolic compounds are the ones that provide the most amount of capacity to inhibit the DPPH and ABTS radicals.
Figure 6 shows the correlation analysis of the experimental and predicted values of the ability to inhibit the DPPH and ABTS radicals. It can be observed that the relation of DPPH-ABTS activity was higher in the predicted values (R2 = 0.466) than in the experimental ones (R2 = 0.3525). This is due to the R2 that was present in the validation models (Figure 2). The inhibition of DPPH and ABTS radicals are reported in the same units (μM TE/g DW), so the information that throws us is directed by its mechanism of inhibition. It can be observed that in the experimental values there is a ratio of 35.25% of possibilities that the same mechanism of action is being presented. It is probably related to the HAT mechanism, since both are proton scavengers. The flavonoids possess -OH groups that can transfer the proton to reduce the oxidizing compound, while diverse compounds dissolved in the extracts could be contributing to the inhibitory activity of free radicals. That is why a correlation analysis between the phenols/flavonoids and DPPH and phenols/flavonoids and ABTS free radicals was performed, in order to generate a hypothesis about its mechanism of inhibition.
Figure 7 shows that the correlation between TPC and DPPH and TFC and DPPH was low (0.77 and 16.32%, respectively). That is to say, polyphenols and flavonoids were not found to provide the greatest inhibition activity of the DPPH radical. However, the correlation between the TFC and DPPH was higher. Similar values were presented in the correlation of the TPC and ABTS and the TFC and ABTS (012.86 and 0.61%, respectively). On the other hand, the TFC–ABTS correlation was the one that presented the highest correlation value (Figure 8). Here, it can be deduced that different mechanisms of inhibition are presented either by donation, since a discrepancy between the correlations was observed.

3.4. Identification of Sugars and Organic Acids

Derived from the optimization using the RSM for the extraction of compounds of interest, later, the identification of sugars and organic acids was carried out. The HPLC showed the presence of three sugars (Table 8) identified in the optimized extract of the papaya seed. The most abundant sugar was glucose (14.49 mg/g DW). Glucose is the main energy component of the seeds that is necessary for its germination. In a study by Gogna et al. [39], they identified sugars through a metabolomic profile based on nuclear magnetic resonance (NMR). In addition to glucose, they confirmed the presence of sucrose and other sugars included the anomeric protons of beta-glucose and alpha-glucose. Glucose, sucrose, and fructose are the main sugars found in papaya with similar proportions [40]. The highest percentage of sugars is found in the pulp of the fruit, since they are necessary for the synthesis of metabolites such as vitamins, pigments, and aromatic compounds, which give sensory characteristics to the fruit [9]. The identification of sugars is related to the inhibition of oxidative stress. A relationship has been observed between the increase in antioxidant activity and the increase in the concentration of sugars. Simple sugars such as glucose are sensitive to heat, accelerating maillard reactions, inducing the production of bioactive compounds such as melanoidins, which possess a powerful antioxidant activity [41]. The identification of organic acids was carried out using HPLC, confirming the presence of seven analytes of the eight (ascorbic acid) evaluated (Table 8). The analyte with the highest concentration was citric acid (48.7583 mg/g DW) (p < 0.05). Similar results were found in studies by Gogna et al. [39] and Kayashima and Katayama [42], where they detected several analytes (ascorbic, oxalic, tartaric, fumaric, citric, malic, quinic, and succinic acid), coinciding with those identified in our study. It is known that organic acids are recognized for their acidifying properties, and in their structures they have functional groups carboxyls (−COOH), where the hydroxyl (part of this carboxyl group) is capable of transferring protons and/or electrons to inhibit free radicals, turning them into powerful antioxidants [42,43].

4. Conclusions

In this study, the extraction process for bioactive compounds from papaya seeds was optimized using the response surface methodology (RSM) coupled with a central composite design (CCD). The main findings indicated that the optimal conditions—100% solvent concentration, a temperature of 30 °C, an extraction time of 6 h, and 6 depletion cycles—maximized the yield of total polyphenols (TPC), total flavonoids (TFC), and antioxidant capacity, evaluated using ABTS and DPPH assays. The combination of a polar solvent like methanol with suitable extraction conditions promotes the efficient release and recovery of antioxidant compounds from papaya seeds. These results confirm the effectiveness of the RSM-CCD model in identifying conditions that enhance antioxidant extraction from plant matrices, providing an efficient and reproducible approach to maximize the use of agricultural residues as sources of bioactive compounds.
The analysis of variance (ANOVA) revealed a significant relationship between extraction factors and the bioactive compound yield, validating the accuracy of the proposed model. However, limitations were identified, such as the limited study range for certain variables, suggesting the need to expand the study range in future research to achieve even higher extraction yields. Additionally, it is recommended to explore alternative solvents, such as ethanol, which may be safer for applications in food and nutraceuticals. These findings not only have implications for optimizing processes in the food industry, but also contribute to sustainability by promoting the comprehensive use of agricultural by-products in the development of functional ingredients. Furthermore, the successful application of this model opens opportunities for future research in optimizing the extraction of bioactive compounds from vegetable waste.

Author Contributions

Conceptualization and methodology, S.M.R.-A., R.I.G.-V., and S.R.-C.; formal analysis and interpretation of data, S.M.R.-A., R.I.G.-V., C.L.D.-T.-S., E.M.-R., L.A.C.-C., V.M.O.-H., J.d.J.O.-P., and S.R.-C.; investigation and resources, M.I.E.-A., L.A.C.-C., and S.R.-C.; writing—original draft preparation, S.M.R.-A., R.I.G.-V., M.I.E.-A., and S.R.-C.; supervision, G.M.S.-J., and C.L.D.-T.-S.; project administration, S.R.-C., and M.I.E.-A. All authors have read and agreed to the published version of the manuscript.

Funding

This research was funded by Universidad de Sonora (grant number USO313009140) and Instituto Tecnológico de Sonora for funding (project PROFAPI 2024-0628 and project 2024-CA-0599).

Data Availability Statement

The original contributions presented in the study are included in the article, further inquiries can be directed to the corresponding author.

Acknowledgments

We gratefully acknowledge the Mexican Council for Science and Technology (Conahcyt) for the postgraduate scholarship granted to the first author.

Conflicts of Interest

The authors declare no conflicts of interest.

References

  1. Banerjee, J.; Singh, R.; Vijayaraghavan, R.; MacFarlane, D.; Patti, A.F.; Arora, A. Bioactives from fruit processing wastes: Green approaches to valuable chemicals. Food Chem. 2017, 225, 10–22. [Google Scholar] [CrossRef] [PubMed]
  2. Oomah, B.D.; Mazza, G. Functional food. In The Wiley Encyclopedia of Science & Technology, 2nd ed.; Francis, F.J., Ed.; Wiley: New York, NY, USA, 2000; pp. 1176–1182. [Google Scholar]
  3. Vodnar, D.C.; Călinoiu, L.F.; Dulf, F.V.; Ştefănescu, B.E.; Crişan, G.; Socaciu, C. Identification of the bioactive compounds and antioxidant, antimutagenic and antimicrobial activities of thermally processed agro-industrial waste. Food Chem. 2017, 231, 131–140. [Google Scholar] [CrossRef] [PubMed]
  4. Figuerola, F.; Hurtado, M.L.; Estévez, A.M.; Chiffelle, I.; Asenjo, F. Fiber concentrates from apple pomace and citrus peel as potential fibre sources for food enrichment. Food Chem. 2005, 91, 395–401. [Google Scholar] [CrossRef]
  5. Kandemir, K.; Piskin, E.; Xiao, J.; Tomas, M.; Capanoglu, E. Fruit juice industry wastes as a source of bioactives. J. Agric. Food Chem. 2022, 70, 6805–6832. [Google Scholar] [CrossRef] [PubMed]
  6. Hossain, S.M.Z.; Taher, S.; Khan, A.; Sultana, N.; Irfan, M.F.; Haq, B.; Razzak, S.A. Experimental study and modeling approach of response surface methodology coupled with crow search algorithm for optimizing the extraction conditions of papaya seed waste oil. Arab. J. Sci. Eng. 2020, 45, 7371–7383. [Google Scholar] [CrossRef]
  7. Nyorere, O.; Oluka, S.I. Impact of optimization on carica papaya seeds oil extraction. Explor. J. Eng. Technol. 2024, 5, 34–41. [Google Scholar]
  8. Castro-Vargas, H.I.; Baumann, W.; Ferreira, S.R.S.; Parada-Alfonso, F. Valorization of papaya (Carica papaya L.) agroindustrial waste through the recovery of phenolic antioxidants by supercritical fluid extraction. J. Food Sci. Technol. 2019, 56, 3055–3066. [Google Scholar] [CrossRef]
  9. Li, M.; Dunwell, J.M.; Zhang, H.; Wei, S.; Li, Y.; Wu, J.; Zhang, S. Network analysis reveals the co-expression of sugar and aroma genes in the Chinese white pear (Pyrus bretschneideri). Gene 2018, 677, 370–377. [Google Scholar] [CrossRef]
  10. González-Vega, R.I.; Cárdenas-López, J.L.; López-Elías, J.A.; Ruiz-Cruz, S.; Reyes-Díaz, A.; Perez-Perez, L.M.; Cinco-Moroyoqui, F.J.; Robles-Zepeda, R.E.; Borboa-Flores, J.; Del-Toro-Sánchez, C.L. Optimization of growing conditions for pigments production from microalga Navicula incerta using response surface methodology and its antioxidant capacity. Saudi J. Biol. Sci. 2021, 28, 1401–1416. [Google Scholar] [CrossRef]
  11. Tan, C.X.; Tan, S.T.; Tan, S.S. Bioactive phytochemicals from papaya seed oil processing by-products. In Bioactive Phytochemicals from Vegetable Oil and Oilseed Processing By-Products; Ramadan Hassanien, M.F., Ed.; Reference Series in Phytochemistry; Springer: Cham, Switzerland, 2023; pp. 391–402. [Google Scholar] [CrossRef]
  12. Tang, Y.; Li, X.; Zhang, B.; Chen, P.R.L.; Tsao, R. Characterisation of phenolics, betanins and antioxidant activities in seeds of three Chenopodium quinoa Willd. genotypes. Food Chem. 2015, 166, 380–388. [Google Scholar] [CrossRef]
  13. Al-Jadidi, H.S.; Hossain, M.A. Studies on total phenolics, total flavonoids and antimicrobial activity from the leaves crude extracts of neem traditionally used for the treatment of cough and nausea. Beni-Suef Univ. J. Basic Appl. Sci. 2015, 4, 93–98. [Google Scholar]
  14. Briones-Labarca, V.; Plaza-Morales, M.; Giovagnoli-Vicuña, C.; Jamett, F. High hydrostatic pressure and ultrasound extractions of antioxidant compounds, sulforaphane and fatty acids from Chilean papaya (Vasconcellea pubescens) seeds: Effects of extraction conditions and methods. LWT-Food Sci. Technol. 2015, 60, 525–534. [Google Scholar] [CrossRef]
  15. Gurnani, N.; Gupta, M.; Mehta, D.; Mehta, B.K. Chemical composition, total phenolic and flavonoid contents, and in vitro antimicrobial and antioxidant activities of crude extracts from red chilli seeds (Capsicum frutescens L.). J. Taibah Univ. Sci. 2016, 10, 462–470. [Google Scholar] [CrossRef]
  16. Ang, Y.K.; Sia, W.C.; Khoo, H.E.; Yim, H.S. Antioxidant potential of carica papaya peel and seed. Foc. Mod. Food Ind. 2012, 1, 11–16. [Google Scholar]
  17. Ornelas-Paz, J.J.; Yahia, E.M.; Pérez-Martínez, J.D.; Escalante-Minakata, M.P.; Ibarra-Junquera, V.; Acosta-Muñiz, C.; Ochoa-Reyes, E. Physical attributes and chemical composition of organic strawberry fruit (Fragaria x ananassa Duch, Cv. Albion) at six stages of ripening. Food Chem. 2013, 138, 372–381. [Google Scholar] [CrossRef]
  18. D’Archivio, A.A.; Maggi, M.A.; Ruggieri, F. Extraction of curcuminoids by using ethyl lactate and its optimisation by response surface methodology. J. Pharm. Biomed. Anal. 2018, 149, 89–95. [Google Scholar] [CrossRef]
  19. Mäkelä, M. Experimental design and response surface methodology in energy. Ene. Conv. Manag. 2017, 151, 630–640. [Google Scholar] [CrossRef]
  20. Bilgin, M.; Elhussein, E.; Özyürek, M.; Güçlü, K.; Şahin, S. Optimizing the extraction of polyphenols from Sideritis montana L. using response surface methodology. J. Pharmac. Biom. Anal 2018, 158, 137–143. [Google Scholar] [CrossRef]
  21. Sarfarazi, M.; Jafari, S.M.; Rajabzadeh, G. Extraction optimization of saffron nutraceuticals through response surface methodology. Food Anal. Methods 2015, 8, 2273–2285. [Google Scholar] [CrossRef]
  22. Dahmoune, F.; Spigno, G.; Moussi, K.; Remini, H.; Cherbal, A.; Madani, K. Pistacia lentiscus leaves as a source of phenolic compounds: Microwave-assisted extraction optimized and compared with ultrasound-assisted and conventional solvent extraction. Ind. Crops Prod. 2014, 61, 31–40. [Google Scholar] [CrossRef]
  23. Khor, E.S.; Wong, N.K. Potential antioxidant and cytotoxic properties of secondary metabolite extracts from carica papaya fruits and seeds. Int. J. Pharm. Pharm. Sci. 2014, 7, 220–224. [Google Scholar]
  24. Hall, R.M.; Mayer, D.A.; Mazzutti, S.; Ferreira, S.R. Simulating large scale SFE applied to recover bioactive compounds from papaya seeds. J. Supercrit. Fluids 2018, 140, 302–309. [Google Scholar] [CrossRef]
  25. Kim, H.J.; Yoon, K.Y. Optimization of ultrasound-assisted deep eutectic solvent extraction of bioactive compounds from pomegranate peel using response surface methodology. Food Sci. Biotechnol. 2023, 32, 1851–1860. [Google Scholar] [CrossRef] [PubMed]
  26. Živković, J.; Šavikin, K.; Janković, T.; Ćujić, N.; Menković, N. Optimization of ultrasound-assisted extraction of polyphenolic compounds from pomegranate peel using response surface methodology. Sep. Purifi. Technol. 2018, 194, 40–47. [Google Scholar] [CrossRef]
  27. Bezerra, M.A.; Santelli, R.E.; Oliveira, E.P.; Villar, L.S.; Escaleira, L.A. Response surface methodology (RSM) as a tool for optimization in analytical chemistry. Talanta 2008, 76, 965–977. [Google Scholar] [CrossRef] [PubMed]
  28. Molyneux, P. The use of the stable radical Diphenylpicrylhydrazyl (DPPH) for estimating antioxidant activity. Songklanakarin J. Sci. Technol. 2004, 26, 211–219. [Google Scholar]
  29. Sood, A.; Gupta, M. Extraction process optimization for bioactive compounds in pomegranate peel. Food Biosci. 2015, 12, 100–106. [Google Scholar] [CrossRef]
  30. Floegel, A.; Kim, D.O.; Chung, S.J.; Koo, S.I.; Chun, O.K. Comparison of ABTS/DPPH assays to measure antioxidant capacity in popular antioxidant-rich US foods. J. Food Compos. Anal. 2011, 24, 1043–1048. [Google Scholar] [CrossRef]
  31. Nieto-Calvache, J.; Cueto, M.; Farroni, A.; de Escalada Pla, M.; Gerschenson, L.N. Antioxidant characterization of new dietary fiber concentrates from papaya pulp and peel (Carica papaya L.). J. Funct. Foods 2016, 27, 319–328. [Google Scholar] [CrossRef]
  32. Briones-Labarca, V.; Venegas-Cubillos, G.; Ortiz-Portilla, S.; Chacana-Ojeda, M.; Maureira, H. Effects of high hydrostatic pressure (HHP) on bioaccessibility, as well as antioxidant activity, mineral and starch contents in Granny Smith Apple. Food Chem. 2011, 128, 520–529. [Google Scholar] [CrossRef]
  33. Ali, A.; Lim, X.Y.; Chong, C.H.; Mah, S.H.; Chua, B.L. Optimization of ultrasound-assisted extraction of natural antioxidants from Piper betle using response surface methodology. LWT-Food Sci. Technol. 2018, 89, 681–688. [Google Scholar] [CrossRef]
  34. Torres-León, C.; Rojas, R.; Serna-Cock, L.; Belmares-Cerda, R.; Aguilar, C.N. Extraction of antioxidants from mango seed kernel: Optimization assisted by microwave. Food Bioprod. Process. 2017, 105, 188–196. [Google Scholar] [CrossRef]
  35. Ryu, D.; Koh, E. Application of response surface methodology to acidified water extraction of black soybeans for improving anthocyanin content, total phenols content and antioxidant activity. Food Chem. 2018, 261, 260–266. [Google Scholar] [CrossRef] [PubMed]
  36. Wissam, Z.; Ghada, B.; Wassim, A.; Warid, K. Effective extraction of polyphenols and proanthocyanidins from Pomegranate’s peel. International. J. Pharm. Pharm. Sci. 2012, 4, 675–682. [Google Scholar]
  37. Parniakov, O.; Barba, F.J.; Grimi, N.; Lebovka, N.; Vorobiev, E. Impact of pulsed electric fields and high voltage electrical discharges on extraction of high-added value compounds from papaya peels. Food Res. Int. 2014, 65, 337–343. [Google Scholar] [CrossRef]
  38. Parniakov, O.; Roselló-Soto, E.; Barba, F.J.; Grimi, N.; Lebovka, N.; Vorobiev, E. New approaches for the effective valorization of papaya seeds: Extraction of proteins, phenolic compounds, carbohydrates, and isothiocyanates assisted by pulsed electric energy. Food Res. Int. 2015, 77, 711–717. [Google Scholar] [CrossRef]
  39. Gogna, N.; Hamid, N.; Dorai, K. Metabolomic profiling of the phytomedicinal constituents of Carica papaya L. leaves and seeds by 1H NMR spectroscopy and multivariate statistical analysis. J. Pharm. Biom. Anal. 2015, 115, 74–85. [Google Scholar] [CrossRef]
  40. Kelebek, H.; Selli, S.; Gubbuk, H.; Gunes, E. Comparative evaluation of volatiles, phenolics, sugars, organic acids and antioxidant properties of Sel-42 and Tainung papaya varieties. Food Chem. 2015, 173, 912–919. [Google Scholar] [CrossRef]
  41. Shen, Y.; Chen, G.; Li, Y. Bread characteristics and antioxidant activities of Maillard reaction products of white pan bread containing various sugars. LWT-Food Sci. Technol. 2018, 95, 308–315. [Google Scholar] [CrossRef]
  42. Kayashima, T.; Katayama, T. Oxalic acid is available as a natural antioxidant in some systems. Biochim. Biophy. Acta Gen. Subj. 2002, 1573, 1–3. [Google Scholar] [CrossRef]
  43. Pereira, D.M.; Faria, J.; Gaspar, L.; Ferreres, F.; Valentão, P.; Sottomayor, M.; Andrade, P.B. Exploiting catharanthus roseus roots: Source of antioxidants. Food Chem. 2010, 121, 56–61. [Google Scholar] [CrossRef]
Figure 1. Correlation of the experimental vs predicted values for evaluate extraction methods by TPC, TFC, DPPH, and ABTS.
Processes 12 02729 g001
Figure 2. Surface response plot of the effect of (a) solvent–temperature, (b) solvent–time, (c) solvent–depletion, (d) temperature–time, (e) temperature–depletion, and (f) time–depletion for the content of total polyphenols (TPC). For each graph, the levels of the other two factors remained at a constant range.
Processes 12 02729 g002
Figure 3. Surface response plot of the effect of (a) solvent–temperature, (b) solvent–time, (c) solvent–depletion, (d) temperature–time, (e) temperature–depletion, and (f) time–depletion interaction for the total polyphenols content (TFC). For each graph, the levels of the other two factors remained at a constant range.
Processes 12 02729 g003aProcesses 12 02729 g003b
Figure 4. Surface response plot of the effect of (a) solvent–temperature, (b) solvent–time, (c) solvent–depletion, (d) temperature–time, (e) temperature–depletion, and (f) time–depletion interactions for the antioxidant capacity by the DPPH method. For each graph, the levels of the other two factors remained at a constant range.
Processes 12 02729 g004aProcesses 12 02729 g004b
Figure 5. Surface response plot of the effect of (a) solvent–temperature, (b) solvent–time, (c) solvent–depletion, (d) temperature–time, (e) temperature–depletion, and (f) time–depletion interactions for the antioxidant capacity by the ABTS method. For each graph, the levels of the other two factors remained at a constant range.
Processes 12 02729 g005aProcesses 12 02729 g005b
Figure 6. Correlation of the experimental vs predicted values of the inhibition of DPPH and ABTS radical (mg AGE/g DW).
Processes 12 02729 g006
Figure 7. Correlation of the TPC and DPPH and the TFC and DPPH (mg AGE/g DW).
Processes 12 02729 g007
Figure 8. Correlation of the TPC and ABTS and the TFC and ABTS (mg AGE/g DW).
Processes 12 02729 g008
Table 1. Response values of experimental obtained for TPC, TFC, DPPH, and ABTS of each treatment.
TreatmentFactorsResponse Variables
X1
Solvent (%)
X2
(°C)
X3
(h)
X4
(Time)
TPC
(mg AGE/g WD)
TFC
(mg QE/g WD)
DPPH
(µM ET/g WD)
ABTS
(µM ET/g WD)
110060665.970 43.058 165.393 60.230
210060615.559 68.526 72.508 36.487
310060165.391 55.864 124.078 36.372
410060114.583 56.733 58.150 34.192
5100453.544.181 48.629 99.758 49.907
610030666.168 52.753 94.191 31.210
710030614.177 43.998 64.303 20.428
810030164.247 50.365 59.615 25.131
910030113.960 65.270 29.434 15.151
1050603.545.925 47.761 139.315 61.722
115045645.391 55.068 95.656 72.389
1250453.565.488 44.505 130.524 64.704
1350453.544.526 48.846 92.726 43.828
1450453.545.61247.688 131.990 49.907
1550453.514.481 34.592 107.669 35.454
165045145.206 39.151 122.906 55.642
1750303.545.047 46.531 110.013 48.989
18060665.440 68.599 114.995 69.866
19060612.878 43.347 124.078 40.387
20060165.687 54.562 88.037 54.725
21060112.521 36.691 88.916 32.587
220453.544.163 53.621 76.903 51.972
23030663.205 30.830 100.637 64.589
24030613.351 45.156 86.865 48.875
25030165.607 53.694 81.591 42.451
26030112.693 40.164 121.441 31.784
X1 = concentration of the solvent (%), X2 = temperature (°C), X3 = time (h), X4 = depletion (Time).
Table 2. Response values of predicted formula obtained for TPC, TFC, DPPH, and ABTS of each treatment.
TreatmentFactorsPredicted Formula
X1
Solvent (%)
X2
(°C)
X3
(h)
X4
(Time)
TPC
(mg AGE/g WD)
TFC
(mg QE/g WD)
DPPH
(µM ET/g WD)
ABTS
(µM ET/g WD)
110060665.970 43.058 165.393 60.230
210060615.559 68.526 72.508 36.487
310060165.391 55.864 124.078 36.372
410060114.583 56.733 58.150 34.192
5100453.544.181 48.629 99.758 49.907
610030666.168 52.753 94.191 31.210
710030614.177 43.998 64.303 20.428
810030164.247 50.365 59.615 25.131
910030113.960 65.270 29.434 15.151
1050603.545.925 47.761 139.315 61.722
115045645.391 55.068 95.656 72.389
1250453.565.488 44.505 130.524 64.704
1350453.544.526 48.846 92.726 43.828
1450453.545.61247.688 131.990 49.907
1550453.514.481 34.592 107.669 35.454
165045145.206 39.151 122.906 55.642
1750303.545.047 46.531 110.013 48.989
18060665.440 68.599 114.995 69.866
19060612.878 43.347 124.078 40.387
20060165.687 54.562 88.037 54.725
21060112.521 36.691 88.916 32.587
220453.544.163 53.621 76.903 51.972
23030663.205 30.830 100.637 64.589
24030613.351 45.156 86.865 48.875
25030165.607 53.694 81.591 42.451
26030112.693 40.164 121.441 31.784
X1 = concentration of the solvent (%), X2 = temperature (°C), X3 = time (h), X4 = depletion (time).
Table 3. Quadratic equation for each response variable.
AnalysisEquation
Y T P C = 5.35659 + 0.04344 x 1 + 0.13746 x 2 + 0.26130 x 3 + 0.54031 x 4 + 0.00011 x 1 x 2 + 0.00266 x 1 x 3   + 0.00250 x 1 x 4 + 0.00212 x 2 x 3 + 0.00317 x 2 x 4 + 0.02357 x 3 x 4 + 0.00039 x 1 2   + 0.00149 x 2 2 + 0.02359 x 3 2 + ( 0.02665 ) x 4 2
Y T F C = 57.12952 + 0.07458   x 1 + ( 1.03430 ) x 2 + ( 5.21927 ) x 3 + 7.46896 x 4 + ( 0.00180 ) x 1 x 2 + ( 0.01136 ) x 1 x 3   + ( 0.03740 ) x 1 x 4 + 0.09406 x 2 x 3 + 0.03955 x 2 x 4 + ( 0.21414 ) x 3 x 4 + 0.00241 x 1 2   + 0.00920 x 2 2 + 0.32547 x 3 2 + ( 0.88429 ) x 4 2
Y D P P H = 211.28140 + ( 0.15475 ) x 1 + ( 4.25360 ) x 2 + 1.52960 x 3 + ( 16.33639 ) x 4 + 0.01226 x 1 x 2 + 0.03926 x 1 x 3     + 0.12746 x 1 x 4 + 0.10646 x 2 x 3 + 0.19143 x 2 x 4 + 0.72082 x 3 x 4 + ( 0.01109 ) x 1 2     + 0.03822 x 2 2 + ( 1.08519 ) x 3 2 + 0.48529 x 4 2
Y A B T S = ( 2.34616 ) + 0.02872 x 1 + 1.34231 x 2 + ( 3.62114 ) x 3 + 10.59592 x 4 + 0.00546 x 1 x 2 + ( 0.01233 ) x 1 x 3     + ( 0.01566 ) x 1 x 4 + ( 0.00249 ) x 2 x 3 + 0.05066 x 2 x 4 + 0.34753 x 3 x 4 + ( 0.00319 ) x 1 2     + ( 0.01579 ) x 2 2 + 0.81720 x 3 2 + ( 1.41264 ) x 4 2
Table 4. Analysis of variance for TPC model.
Source GFSum of SquaresMean SquaresF-Valuep-ValueSignificance
Model1423.45341.67523.35850.0250*
Solvent14.19634.19638.41270.0144*
Temperature11.67991.67993.36790.0936
Time10.27980.27980.56080.4696
Exhaust 19.38899.388918.82270.0012**
Solvent * Temperature10.10260.10260.20560.6590
Solvent * Time11.77361.77363.55560.0860
Solvent * Exhaust11.56191.56193.13120.1045
Temperature * Time10.10100.10100.20240.6615
Temperature * Exhaust10.22590.22590.45280.5149
Time * Exhaust10.34720.34720.69610.4218
Solvent * Solvent12.45472.45474.92120.0485*
Temperature * Temperature10.28730.28730.57610.4638
Time * Time10.05570.05570.11160.7446
Exhaust * Exhaust10.07100.07100.14240.7131
Lack of fit104.89720.48970.83050.7018
Residual115.48690.4988
pure error 10.58970.5897
Total Correlation 2528.9403
* p-value < 0.05; ** p-value < 0.01.
Table 5. Analysis of variance for TFC model.
SourceGFSum of SquaresMean SquaresF-Valuep-ValueSignificance
Model141232.559888.04000.93800.5530
Solvent1190.3331190.33312.02780.1822
Temperature1119.5058119.50581.27320.2832
Time10.07460.07460.00080.9780
Exhaust 121.676721.67670.23090.6402
Solvent * Temperature129.052129.05210.30950.5891
Solvent * Time132.256732.25670.34370.5696
Solvent * Exhaust1349.8209349.82093.72690.0797
Temperature * Time1199.0639199.06392.12080.1733
Temperature * Exhaust135.200535.20050.37500.5527
Time * Exhaust128.660028.66000.30530.5916
Solvent * Solvent193.727593.72750.99860.3391
Temperature * Temperature110.980510.98050.11700.7388
Time * Time110.596810.59680.11290.7432
Exhaust * Exhaust178.227578.22750.83340.3809
Lack of fit101031.8272103.183153.89340.0627
Residual111032.497793.8634
pure error 10.67050.6700
Table 6. Analysis of variance for DPPH model.
SourceGFSum of SquaresMean SquaresF-Valuep-ValueSignificance
Model1417,983.0861284.513.43140.0232*
Solvent1747.9809747.9811.99820.1852
Temperature12872.31472872.3157.67310.0182*
Time11159.33971159.343.09710.1062
Exhaust 12350.62532350.6256.27940.0292*
Solvent * Temperature11352.29031352.293.61250.0839
Solvent * Time1385.4154385.4151.02960.3321
Solvent * Exhaust14061.57664061.57710.85010.0072**
Temperature * Time1255.0249255.0250.68130.4267
Temperature * Exhaust1824.5512824.5512.20270.1658
Time * Exhaust1324.7384324.7380.86750.3716
Solvent * Solvent11969.68831969.6885.26180.0425*
Temperature * Temperature1189.4341189.4340.50610.4917
Time * Time1117.809117.8090.31470.5860
Exhaust * Exhaust123.559523.5590.06290.8065
Lack of fit103346.8716334.6870.43420.8399
Residual114117.7020374.3400
pure error 1770.8308770.8310
* p-value < 0.05; ** p-value < 0.01.
Table 7. Analysis of variance for ABTS model.
SourceGFSum of SquaresMean SquaresF-Valuep-ValueSignificance
Model145197.8154371.2737.05270.0012**
Solvent1912.0436912.04417.32510.0016**
Temperature1533.1201533.1210.12710.0087**
Time1753.0563753.05614.3050.0030**
Exhaust 11316.40941316.40925.00640.0004***
Solvent * Temperature1268.0997268.15.09280.0454*
Solvent * Time138.010338.010.7220.4136
Solvent * Exhaust161.281561.2811.16410.3037
Temperature * Time10.13890.1390.00260.9599
Temperature * Exhaust157.748657.7491.0970.3174
Time * Exhaust175.485775.4861.43390.2563
Solvent * Solvent1162.6148162.6153.0890.1066
Temperature * Temperature132.320432.320.6140.4498
Time * Time166.806766.8071.26910.2839
Exhaust * Exhaust1199.6319199.6323.79220.0775
Lack of fit10560.5939756.05943.0340.4214
Residual11579.071152.643
pure error 118.4771218.4771
* p-value < 0.05; ** p-value < 0.01; *** p-value < 0.001.
Table 8. Identification and quantification of sugars and organic acids in papaya seeds.
Sugarmg/g DWOrganic Acidsmg/g DW
Saccharose0.35 c ± 0.029Oxalic12.9793 ± 0.3086
Glucose14.49 a ± 0.564Citric48.7583 ± 1.7241
Fructose5.72 b ± 0.215Tartaric2.9542 ± 0.2187
Malic6.3562 ± 0.3227
AscorbicND
Quinic6.3213 ± 0.0873
Succinic16.2580 ± 0.6597
Fumaric3.8212 ± 0.1612
Values are mean ± standard deviation of at least three repetitions (n ≥ 3). Different letters are different at a significance level of p < 0.05. ND: Not Detected
Disclaimer/Publisher’s Note: The statements, opinions and data contained in all publications are solely those of the individual author(s) and contributor(s) and not of MDPI and/or the editor(s). MDPI and/or the editor(s) disclaim responsibility for any injury to people or property resulting from any ideas, methods, instructions or products referred to in the content.

