1. Introduction
The global demand for oil and gas resources is experiencing significant growth due to factors such as population increase, industrial activities, and improved living standards [
1]. Shale reserves and tight formations have become crucial contributors to oil and gas production in the United States [
2]. Currently, approximately 65% of U.S. production comes from these unconventional sources, and this percentage is projected to reach 75% by 2050 (EIA). North America accounts for 23% of recoverable unconventional resources [
3]. Although horizontal drilling and multistage hydraulic fracturing techniques have been successfully applied in shale reservoirs and tight formations [
4,
5,
6,
7], the recovery factor remains relatively low. Primary depletion of oil in these reservoirs typically results in a recovery factor of less than 10% [
8], leaving a significant amount of hydrocarbons unrecovered. One common method employed in the development of unconventional reservoirs is the huff-n-puff technique using natural gas, CO
2, and N
2 [
9,
10,
11]. Field trials of natural gas huff-n-puff applications in the Eagle Ford formation, as analyzed by Hoffman [
12], demonstrated the technique’s viability in extending field life and increasing oil recovery. Similarly, Pospisil et al. [
13] evaluated a rich gas multi-well cyclic huff-n-puff pilot in the Bakken formation, finding that a three-month injection cycle with a gas injection rate of 3 MMcfd could potentially yield an incremental recovery ranging from 4% to 26%. Additionally, Sanaei et al. [
14] investigated the application of CO
2 huff-n-puff in the Bakken and Three Forks reservoirs, exploring its effectiveness in enhancing oil recovery. The introduction of solvent into the fracture system enhances the recovery rate by elevating the diffusion coefficient and effective density gradient in the reservoir. Notably, the solvent is not directly injected into the matrix but rather diffuses through a counter diffusive process, with oil being produced into the wellbore as the solvent diffuses into the matrix [
15]. Overall, these studies and field trials demonstrate the ongoing efforts to apply huff-n-puff techniques with various gases to maximize oil recovery from unconventional reservoirs. It was substantiated that number of cycles, gas type, and gas injection rate are the fundamental parameters to maximize incremental oil recovery. Co-injection of produced gas and water-surfactant mixture is an innovative huff-n-puff approach. A pilot project was conducted with main objectives to re-pressure the reservoir above the MMP, prove the concept of using water co-injection to build hydrostatic pressure to inject gas at low surface pressures and to improve gas conformance, and use a surfactant to enhance oil recovery through rock wettability alteration [
13].
Field trials indicate that traditional gas injection in shale wells has low sweeping efficiency [
16]. Emerging technologies play a paramount role in the oil and gas industry [
17,
18]. Among these advancements, smart or intelligent well technology has emerged as a promising solution to enhance field development outcomes. This technology has been specifically developed to facilitate improvements in the overall field development process. Most of the time, smart completion is associated with high CAPEX. On the contrary, it allows for accelerated cash flow, reducing CAPEX and OPEX in many ways. For instance, availability and accessibility of real-time data monitoring achieved via the pressure and temperature permanent downhole gauges is crucial to ensure that the changes in well and reservoir, during flowing or shut-in condition, can be captured for various analysis. It can allow engineers to evaluate the well lifting performance and propose solutions such as improving artificial lift efficiency to gain more barrels [
19]. Smart completion was successfully installed in a water injector well. The primary objectives were centered around enhancing reservoir management, reducing complexity in well construction, and achieving cost optimization [
20]. In the past decade, numerous pilot projects have been implemented in the Bakken region to evaluate various EOR technics and strategies. The reported results of these projects were analyzed in [
21]. Overall, the findings indicated early breakthrough and low sweeping efficiency. One notable pilot project involved gas flooding, although it was discontinued after just 55 days. However, this pilot project demonstrated the feasibility of using rich natural gas as the injection fluid, which can be more readily available compared to CO
2 in unconventional oil plays. Additionally, the cost of natural gas in the Bakken is currently lower than that of CO
2. Another advantage of using natural gas is its ability to address the issue of flaring, which remains a concern in certain parts of the Bakken region.
In another study [
22], authors addressed the technical challenges and limited success of huff-and-puff and continuous injection techniques in tight oil formations for fundamental reasons. Huff-and-puff methods encounter difficulty due to the need for substantial fluid transfer into and out of the tight oil formation during each injection-soaking-production cycle, which becomes challenging because of the low permeability of the formation. Similarly, continuous injection using fractured horizontal wells for injection and production faces the issue of short circuits caused by fractures that communicate directly from injector to producer. Aiming to tackle these challenges, this study proposes the utilization of a single well with a dual-conduit completion. This completion design enables continuous injection and production by spatially alternating injection and production fracture sections, which are isolated from each other by packers. However, such a technique requires a sophisticated completion with multiple remotely activated valves that enable asynchronous injection and production from the spatially alternating fracture sections within a single well.
This paper proposes the implementation of smart completion in horizontal wells drilled in the Bakken to segregate the gas injection along the lateral section. The objectives are to improve the gas injection efficiency, reduce the produced GOR and increase oil recovery. Thorough reservoir simulation is undertaken to identify the most favorable gas injection scenario. This involves evaluating CAPEX, OPEX, and potential revenue from oil recovery. By considering these factors, an assessment is made to evaluate the most promising approach for gas injection.
3. Reservoir Model Construction and Injectivity Constraints
In this simulation study, Petrel and Eclipse 2024.2 software were used. The Equation of State and refinement grids were selected to simulate the compositional interaction of the reservoir fluid with the injected gas. Reservoir fluid composition and gas injection composition were taken from [
24].
In this study, it was assumed that each well would have ten hydraulic fracturing (HF) stages, with a spacing of 1000 feet between each stage. The relative permeability curves used in the analysis were adapted from [
25]. The initial water saturation was assumed to be equal to the residual water saturation, which was set at 0.2. The pore compressibility of a consolidated limestone reservoir was estimated using the Newman equations. Stress-dependent permeability was calculated using the equation proposed in [
26], specifically Equation (1). The values of Ko and γ are consecutively, 0.0083 md and 3 × 10⁻
4, respectively, based on the findings in [
27].
K denotes permeability under net confining pressure Peff. Ko is permeability under atmospheric pressure (14.5 psi). γ is the pressure sensitivity coefficient.
Initial reservoir pressure and average petrophysical characteristics are summarized in
Table 1. Laboratory experiments demonstrate that produced gas acts as a highly effective solvent, particularly for Middle Bakken samples [
28]. Rich gas mixtures consisting of 70% methane, 20% ethane, and 10% propane from the Bakken formation can reach minimum miscibility pressure (MMP) at relatively low pressures, approximately 2450 psi. Using PVTP 13.0 software, the MMP for the produced gas was estimated to be 2335 psi.
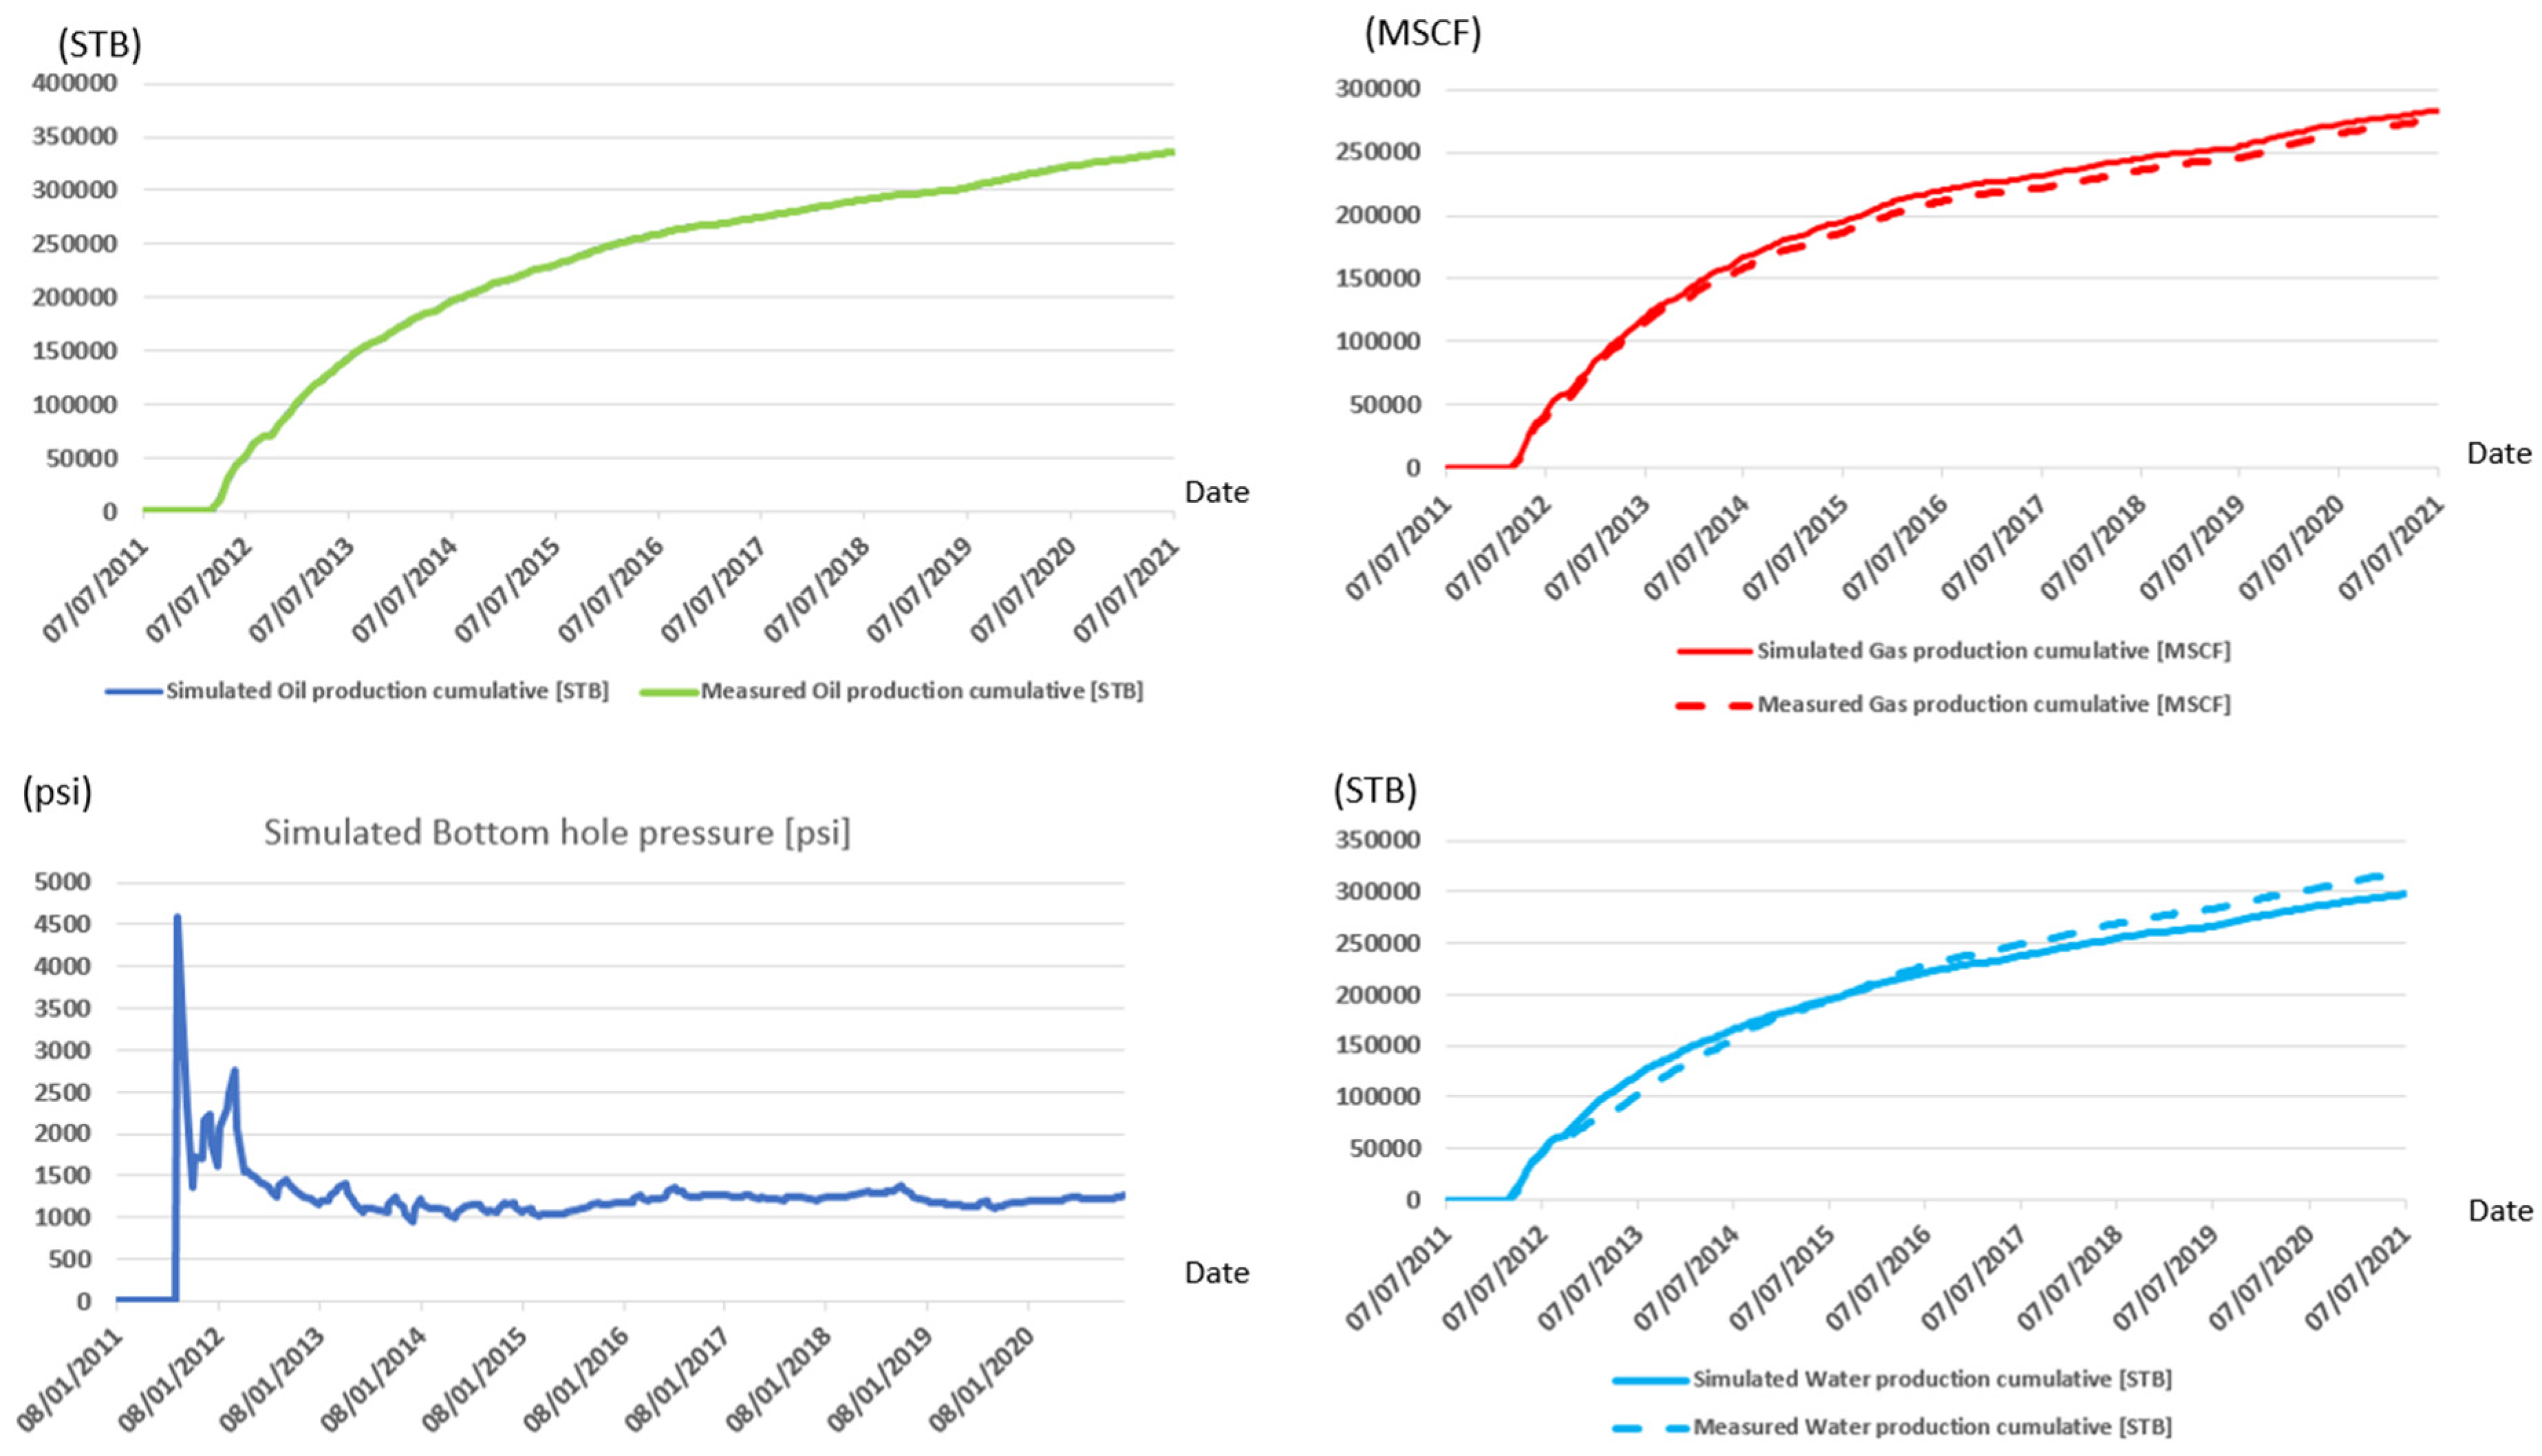
History matching results showed a strong agreement between the simulated and observed data.
Figure 3 presents the cumulative oil, water, and gas production, as well as the bottom hole pressure for Orville 2H. During the natural depletion phase, all wells initially exhibited high oil production rates, followed by a sharp decline a few months after production commenced. This trend is characteristic of horizontal, multistage hydraulically fractured wells drilled in tight formations.
Ultra tight formation such as the case of the Bakken is characterized with very low permeability, which makes the injectivity of the formation challenging. Several gas injection cases were conducted to guide the conceptualization of the EOR schemes.
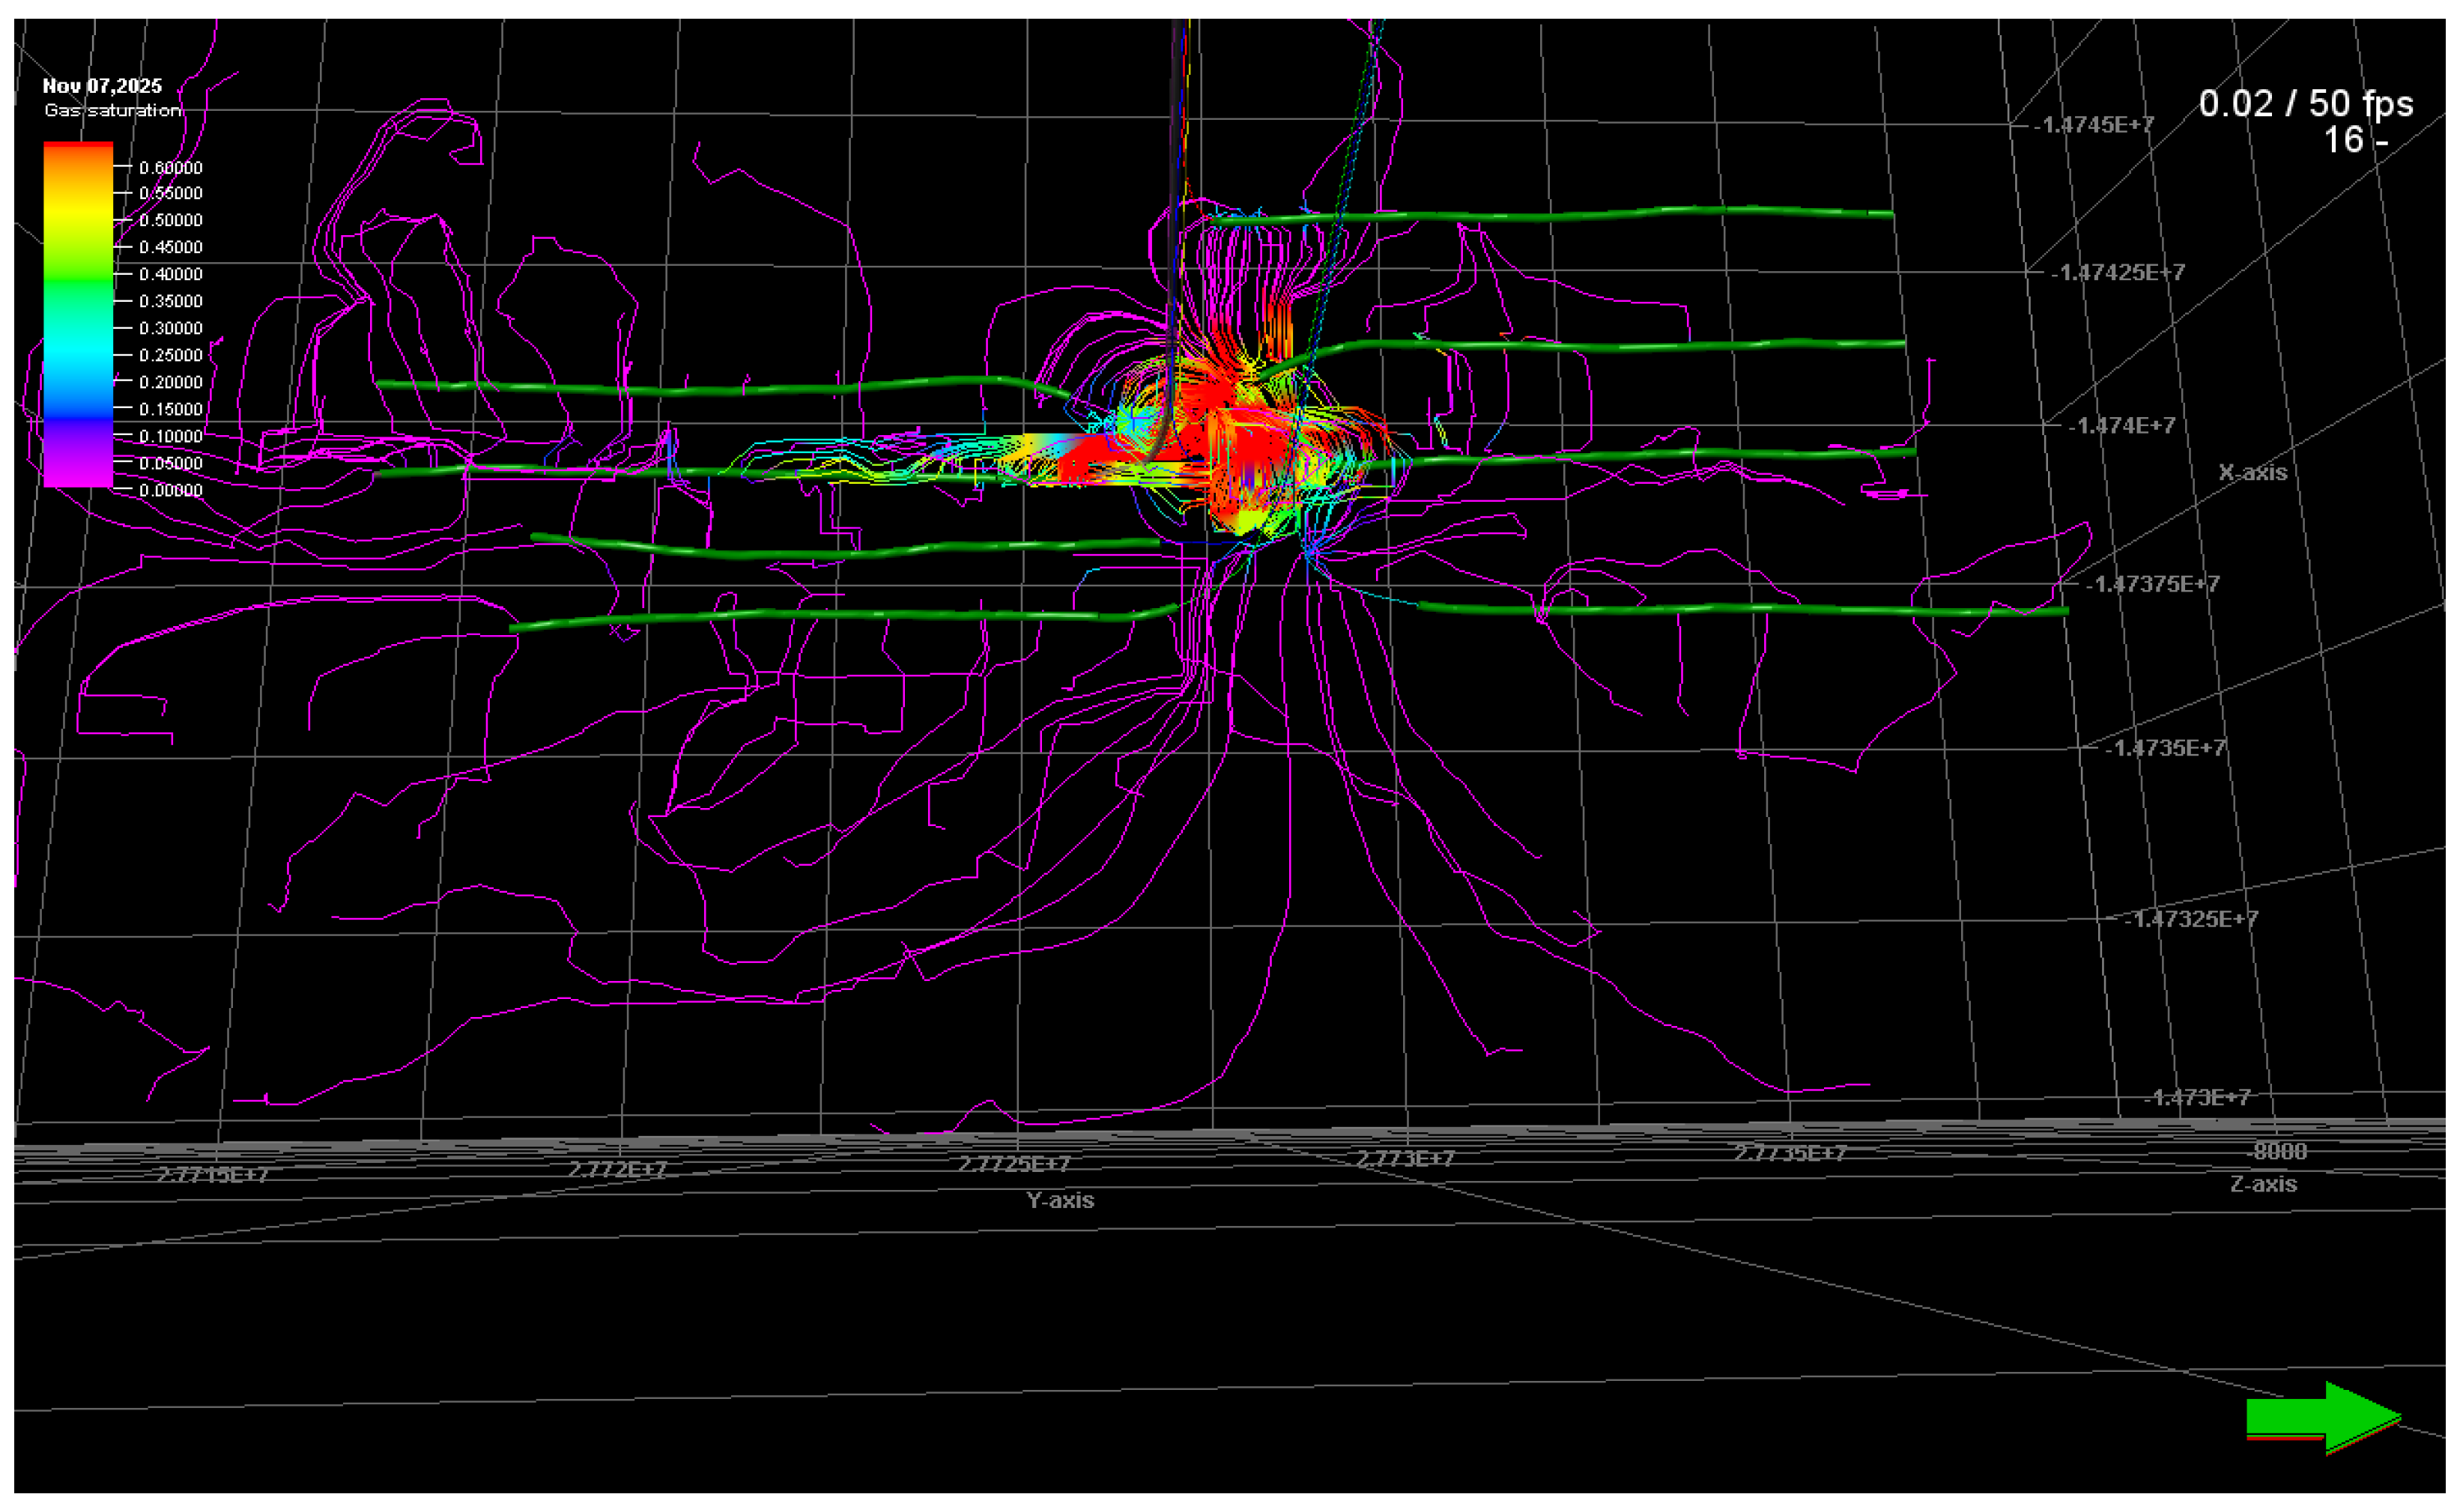
Figure 4 illustrates streamline results of continues gas injection of 10 MMcfd in Borsheim Trust 2H through normal completion. As can be seen, the injected gas has flooded the center of the multi-pad where the deferential pressure is the highest. As a consequence, lower swiping efficiency and rapid gas breakthrough to the offset wells. The main objective of this study is to increase the gas injection efficiency by deploying smart completion to control the injection intervals.
Below is a summary of the results obtained for varying the length and location of the injection interval:
Injection in the last 10% of the lateral (1000 ft near the toe): max gas injection was 150 Mcfd. BHP reached 12,000 psi.
Injection in the last 20% of the lateral (2000 ft near the toe): max gas injection was 600 Mcfd. BHP reached 12,000 psi.
Injection in the last 30% of the lateral (3000 ft near the toe): max gas injection was 2.5 MMcfd. BHP reached 12,000 psi
Injecting in the middle 10% of the lateral: max gas injection was 1 MMcfd. BHP reached 12,000 psi.
Injecting in the middle 20% of the lateral: max gas injection was 2.2 MMcfd. BHP reached 12,000 psi.
Injecting in the first 20% of the lateral (near the heel): max gas injection was 10 MMcfd. BHP reached 8000 psi.
To summarize,
Injecting the gas in the toe section of the lateral can be technically challenging. Based on the simulation results, injecting the gas in the last 30% of lateral will not increase the production, and it can be considered as waste of energy. Therefore, in all upcoming injection cases, we excluded the last 30% of the horizontal section.
At least one-third of the lateral section must be kept open to be able to inject the amount of gas, 3 MMcfd or more. Therefore, in all upcoming injection cases, the lateral was segregated to no more than three sections.
The heel section is responsible for almost 80% of the injected gas through normal completion.
4. Numerical Simulation Results
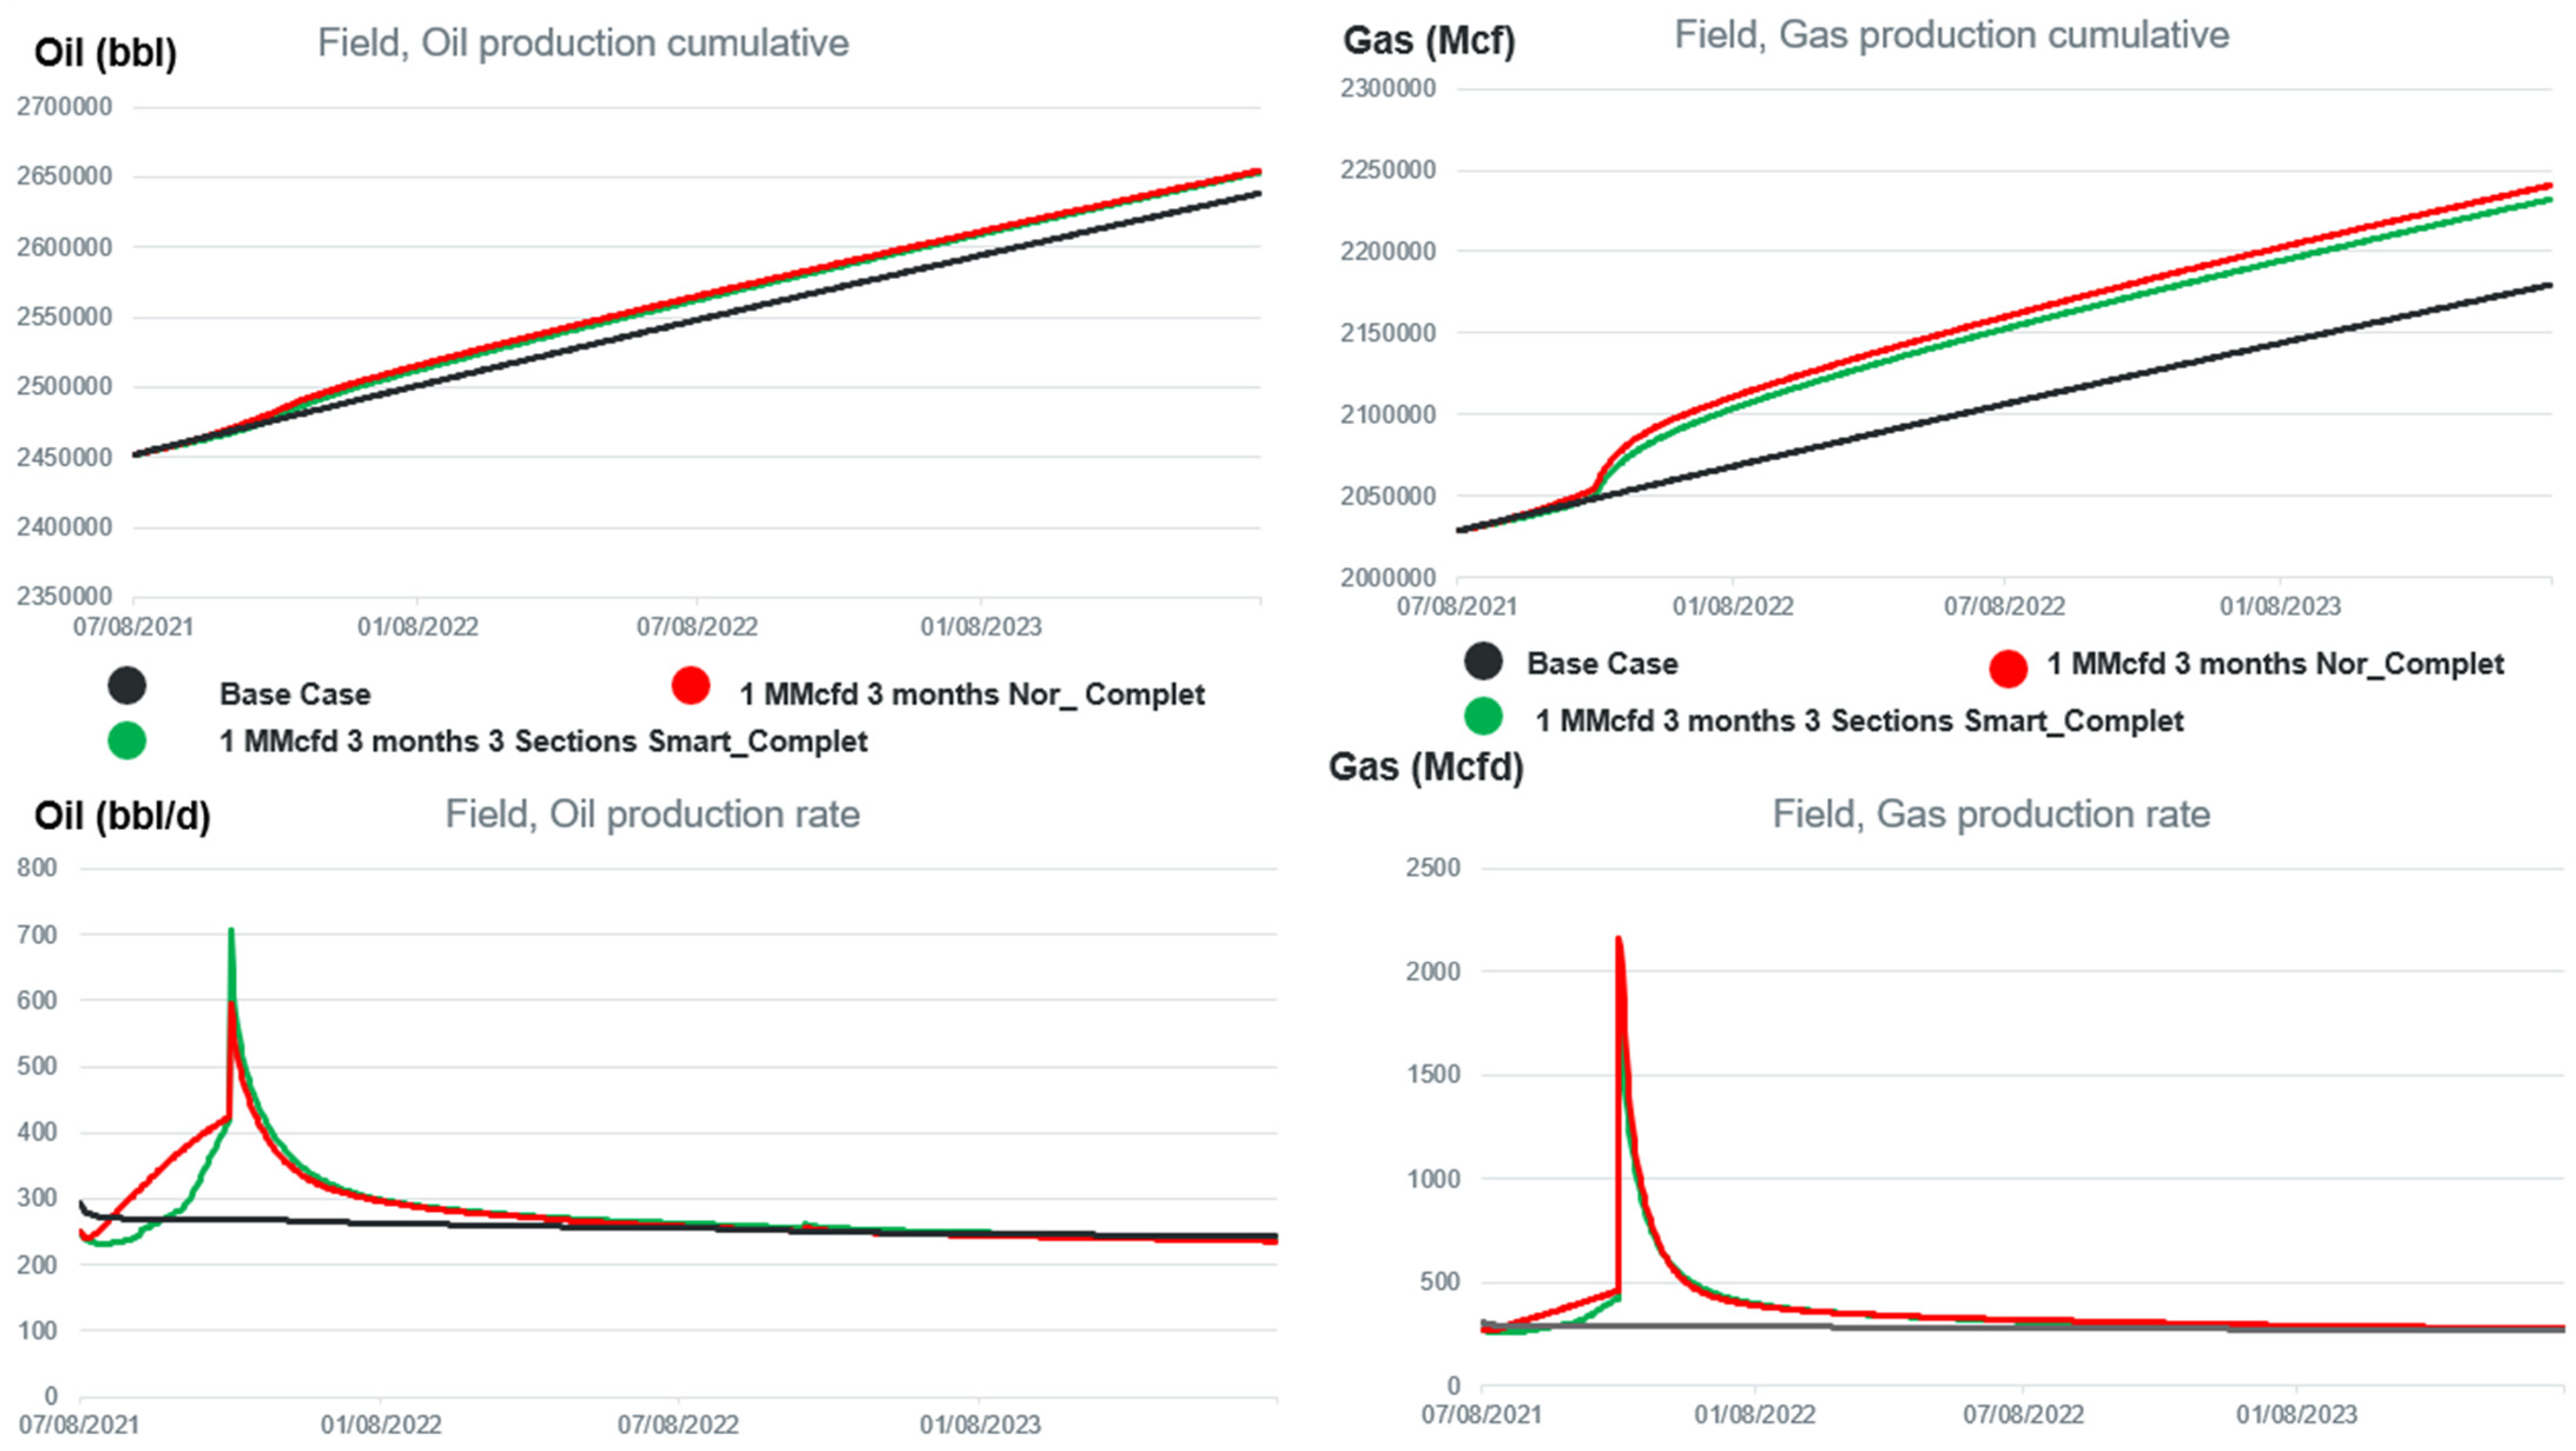
The first set of gas injection schemes was designed to inject 1 MMcfd over a three-month period. Two cases were considered (
Figure 5), black is the case with no gas injection and red is the injection through normal completion. Green is the injection through smart completion in which the lateral was segregated into three sections, starting the injection in the toe section, then the middle section and finally the heel section. As can be seen, both injection cases gave approximately the same incremental oil and slightly less gas in the case of injection through smart completion. Higher oil and gas rates were obtained as soon as the injector was switched back to production.
Table 2 presents the simulation results, showcasing various parameters and their respective values. One of the parameters used to evaluate the effectiveness of the injected gas is the EOR (enhanced oil recovery) efficiency. This efficiency is calculated by determining the incremental oil achieved for each Mcf (thousand cubic feet) of gas injected. Another parameter considered is the gas–oil ratio (GOR), and this reflects the additional capacity needed at the wellsite to accommodate the increased gas production rate during the injection phase, thus preventing flaring. GOR is calculated at the conclusion of the injection phase. Based on the simulation results, it was observed that gas injection at a rate of 1 MMcfd (million cubic feet per day) through normal completion yielded the highest EOR efficiency, with a value of 0.18 bbl/Mcfd (barrel per thousand cubic feet). Additionally, up to 60% of the injected gas was successfully recovered during the process.
Second case, a continuous injection of 2.8 MMcfd for three months. Two schemes were considered (
Figure 6), injection through normal completion and injection through smart completion in which the lateral was segregated into three sections. As can be seen, both cases gave approximately the same incremental production. Relatively higher produced gas during the injection phase was observed in the case of normal completion. Higher oil and gas rates were obtained as soon as the injector was switched back to production.
The simulation results are shown in
Table 3. Both approaches yielded the same gas injection efficiency and the same incremental oil and gas recovered. There was slightly higher GOR in the case of injection through normal completion. Up to 72% of the injected gas was recovered. Overall, there was a better injection efficiency and gas recovery compared to the previous EOR schemes.
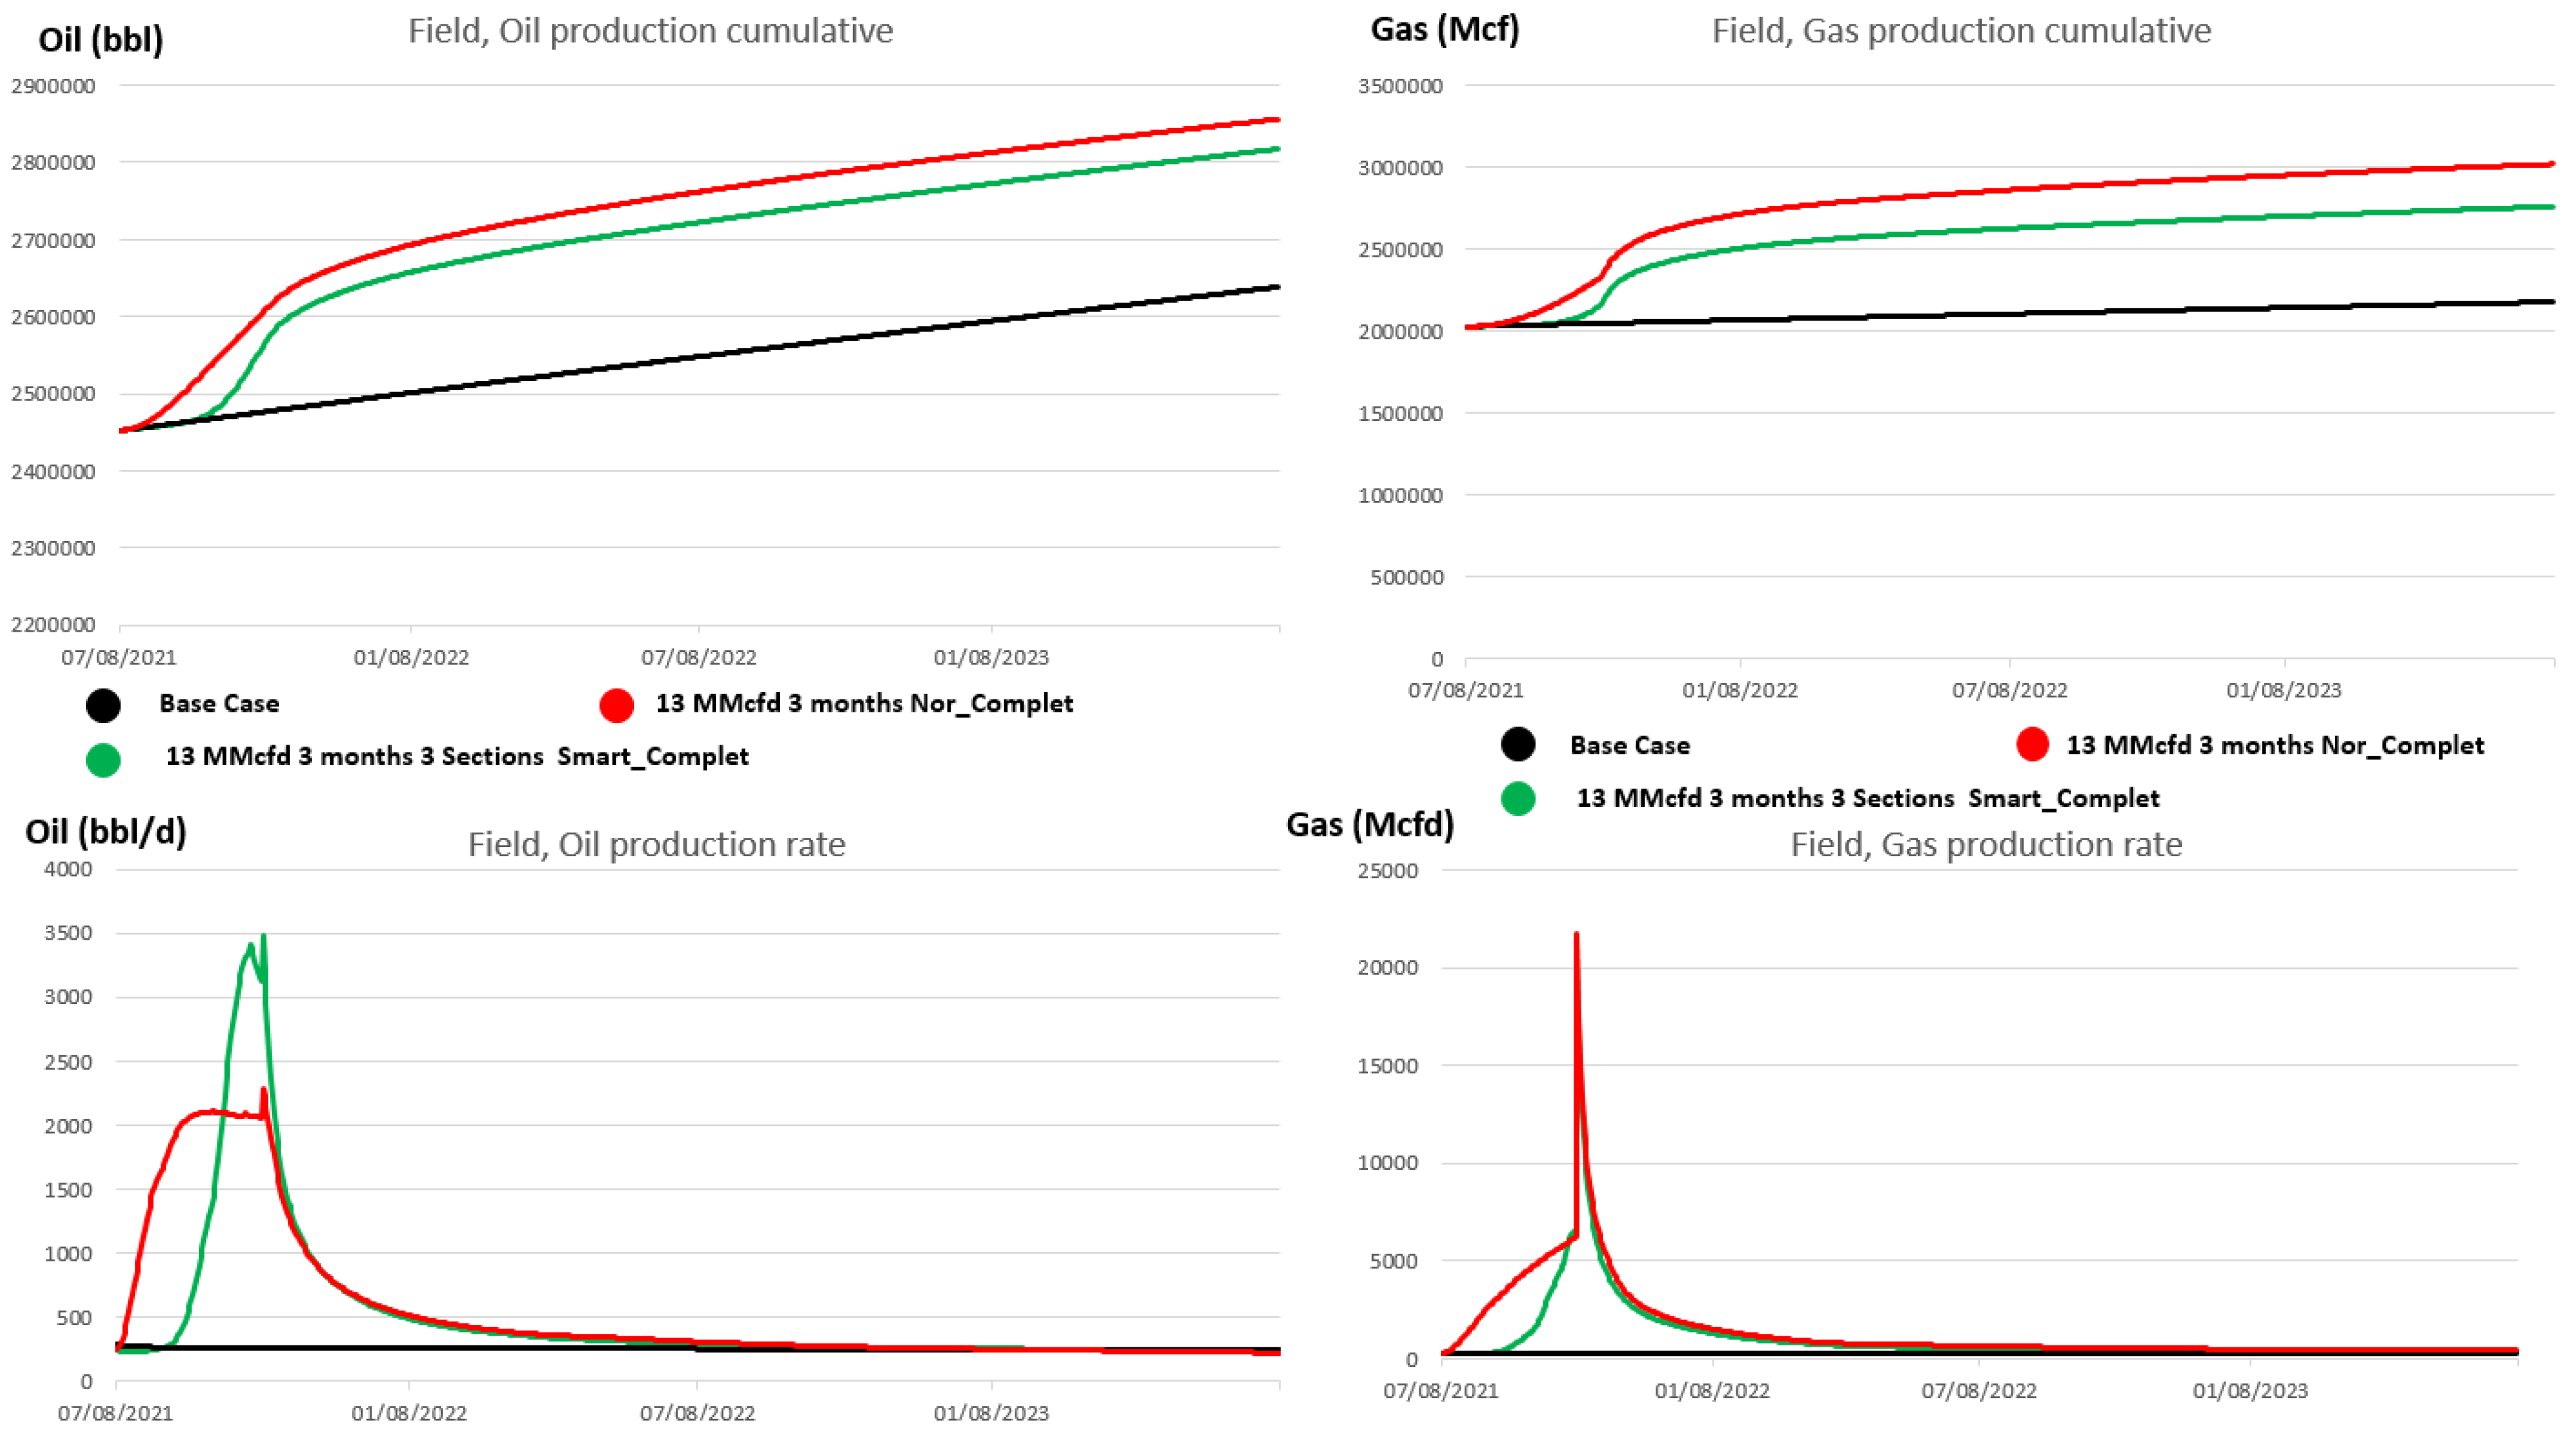
In this case, a dedicated injection of 13 MMcfd for three months was conducted. Again, injection was through normal completion and injection through smart completion in which the lateral was segregated into three sections. As shown in
Figure 7, injection through normal completion yielded better incremental oil and higher gas production rates during the injection phase. Higher oil and gas rates were obtained as soon as the injector was switched back to production in both cases.
The simulation results are provided in
Table 4. Gas injection through intelligent completion demonstrated the highest injection efficiency, resulting in greater incremental oil recovery. On the other hand, the injection through normal completion gave better gas recovery, up to 72% of the injected gas was recovered and higher GOR.
To summarize, using smart completion to inject the gas for a short period of time will not generate a decent increase in production. Based on the simulation results, 3 MMcfd or more is the optimum gas injection rate.
Figure 8 illustrates the bottom hole pressure simulated for 2.8 MMcfd and 13 MMcfd cases, respectively. As can be seen, BHP reached the maximum 7100 psi after 10 days of gas injection for 13 MMcfd injection case, while the maximum BHP obtained during gas injection of 2.8 MMcfd was 4500 psi.
In this set of EOR schemes, gas injection of 1 MMcfd for one year was carried out (
Figure 9). The injection through smart completion in which the lateral was segregated into three sections yielded a better incremental oil and clearly produced less gas. The oil rate reached the peak (700 bbl/d) after 10 months, which suggests the possibility of extending the injection phase to increase oil recovery.
Higher oil and gas rates were obtained as soon as the injector was switched back to production in both cases.
The simulation results are depicted in
Table 5. Injection through intelligent completion yielded the highest gas injection efficiency (0.25 bbl/Mcf) and higher incremental oil with comparatively lower GOR. On the other hand, injection through normal completion gave better gas recovery, up to 70% of the injected gas was recovered.
Gas injection of 2.8 MMcfd for one year was simulated. Three cases were considered (
Figure 10)—the black line represents the base case (no gas injection), injection through normal completion, injection through smart completion in which the lateral was segregated into two sections, and injection through smart completion in which the lateral was segregated into three sections, starting the injection in the toe section, then middle section and finally the heel section. The results demonstrate that the injection through smart completion in which the lateral was segregated into three sections yielded the highest incremental oil with clearly produced less gas followed by injection through smart completion where the lateral was segregated into two sections. The oil rate reached the peak (1400 bbl/d) after 10 months, which suggests the possibility of extending the injection phase to increase oil recovery. A higher gas rate was obtained as soon as the injector was switched back to production in all three cases.
The simulation results are illustrated in
Table 6. Injection through intelligent completion in which the lateral was segregated into three sections yielded the highest gas injection efficiency (0.25 bbl/Mcf), higher incremental oil with comparatively lower GOR. On the other hand, injection through normal completion gave better gas recovery, up to 74% of the injected gas was recovered.
Gas injection of 13 MMcfd for one year was carried out. Also three cases were considered as well (
Figure 11). The injection through smart completion in which the lateral was segregated into three sections yielded the highest incremental oil with clearly produced less gas followed by injection through smart completion where the lateral was segregated into two sections. The oil rate reached the peak (2800 bbl/d) after 7 months. A higher gas rate was obtained as soon as the injector was switched back to production in all three cases.
The simulation results are presented in
Table 7. Overall, lower gas injection efficiency and higher GOR were obtained. Injection through intelligent completion in which the lateral was segregated into three sections yielded the highest gas injection efficiency (0.16 bbl/Mcf), higher incremental oil with comparatively lower GOR.
To summarize, an injection rate of 2.8 MMcfd for one year yielded the highest gas injection efficiency with relatively manageable produced gas rate. However, the injection period can be optimized since the peak was reached after 10 months.
In this case, gas injection of 2.8 MMcfd for three-year period was conducted, and three cases were considered (
Figure 12). Injection through normal completion, injection through smart completion in which the lateral was segregated into three sections, and injection through smart completion in which the gas was injected through the middle section only. As can be seen, the injection through smart completion in which the lateral was segregated into three sections yielded the highest incremental oil. Relatively stable oil and gas rates were obtained in the case of injection through the middle section.
The simulation results are shown in
Table 8. Injecting the gas for a long period of time will reduce the overall gas injection efficiency. Nevertheless, injecting the gas using smart completion and dividing the lateral into three sections yielded the highest incremental oil and highest injection efficiency. Forcing injection through the middle section has its benefits when injecting incremental oil and for moderate gas production rates, which makes the approach ideal if priority is given to less gas production.
Figure 13 Illustrates the streamline results of gas injection through the middle section of the lateral. As shown, forcing the injection through the middle section of the lateral will increase the swiping efficiency. Consequently, more oil is to be produced and potentially slows down the gas breakthrough.
Implementing gas injection in the Bakken will require obtaining a Class II permit. Operating companies must demonstrate that their wells comply with both federal and state regulations, including implementing effective measures to protect underground sources of drinking water. According to our simulations, lease-to-lease communication is highly likely. As a result, unless the adjacent leases are owned by the same company, the state will not approve gas injection due to mineral ownership rights.
5. Economics
Examining reservoir performance and assessing the related infrastructure costs is crucial to determining the economic feasibility of a project. In addition to these factors, there are several other costs that must be considered in the overall cost calculation. These include expenses related to compression units, lease fees, and miscellaneous costs associated with contracts, insurance, and monitoring.
Table 9 provides a depiction of the costs associated with purchasing compression units and the surface network. In an effort to minimize capital expenditure, it has been decided to rent the compressor skid instead of purchasing it, considering the relatively short injection period of the project. This decision is aimed at optimizing cost management and ensuring efficiency in the project’s financial planning. An early production facility is required to assist the expected increase in oil and gas rates during the injection phase.
This study utilized Internal Rate of Return (IRR), Levelized Cost of Energy (LCOE), and net present value (NPV) as key economic indicators. Two injection schemes were considered, injection of 2.8 MMcfd through smart completion for one year and 3-year periods. Sensitivity analyses on oil and gas prices were performed. In the first scenario, oil and gas prices were set at USD 80 per barrel and USD 8 per Mcf, respectively. In the second scenario, lower prices were evaluated, with oil at USD 50 per barrel and gas at USD 4 per Mcf.
Table 10 and
Table 11 illustrate, respectively, the cost and revenue for each case. OPEX calculated includes the cost of purchasing the gas.
An NPV of up to USD 23.5 million can be achieved with an IRR of 285% under a scenario involving 2.8 MMcfd gas injection over a three-year period. Even in a lower oil price environment of USD 50 per barrel, the project is projected to yield a profit with an NPV of USD 13 million.


