Abstract
Recently, due to the rapid increase in the demand for artificial graphite, there has been a strong need to improve the productivity of artificial graphite. In this study, we propose a new efficient process by eliminating the carbonation stage from the existing process. The conventional graphite manufacturing process usually involves a series of stages: the pulverization of needle-type coke, the granulation of pitch and coke premix, carbonation, graphitization, and surface treatment to compensate voids formed within particles. The process seems time-consuming and costly. Therefore, in our proposed shortened process, we have eliminated the carbonization stage. Instead of petroleum-derived pitch, coal tar pitch was employed. Coal tar pitch has a lower softening point than binder pitch. Apart from the cost-effectiveness of the process, it has enhanced the properties of artificial graphite by a uniform coating using a lower amount of hard carbon. In addition, the whole manufacturing time and cost was reduced by 12 h and 20% due to the skipped manufacturing step, respectively. It was observed that the artificial graphite produced by the newly proposed shortened process had improved physical properties related to the density and graphitization degree, and also showed an improvement in electrochemical performance. Raman 3D mapping and the electrochemical evaluation of artificial graphite were mainly used to compare the physical properties. This shortened process not only reduces the manufacturing cost, but also contributes to the improved performance of lithium-ion battery anode material.
1. Introduction
The recent increase in demand for electric vehicles and energy storage devices is driving the need to optimize secondary battery production processes and reduce their cost. Lithium-ion batteries (LIBs) are widely used due to their high energy density and long cycle life, and are based on the principle of storing and releasing lithium ions in the anode and cathode by intercalation and de-intercalation [,,,,]. The well-refined integration of anode and cathode has a significant impact on the overall performance of LIBs.
Unlike various candidates for cathode materials, the anode active material that has been traditionally used in most cases for LIBs is graphite [,,,,,]. Nevertheless, the increasing need for higher energy density, faster charging, and better charge–discharge efficiency has led researchers to investigate alternative anode materials, such as silicon [,,], tin [,,], and various metal oxides [,,,,,]. While these materials retain a greater lithium storage capacity, there are still hurdles to be overcome, such as volume expansion, a reduced rate of performance stability, and high cost. At this point, it looks reasonable to investigate additives in order to improve LIB performance based on natural graphite (NG) or artificial graphite (AG) [,,,]. Here, we would like to focus on graphite manufacturing processes to improve LIB performance, as well as their cost-effectiveness.
AG is mainly produced from petroleum or coal-derived coke [,,]. The general manufacturing procedure of AG is interpreted as follows: pulverization (coarse and fine grinding)—granulation (premix with petroleum pitch)—the first carbonization of primary particles—graphitization—pitch coating—second carbonization. Here, the primary particles are formed by a granulation process, by adding some binder pitch to pulverized coke powder. First, carbonization is employed to remove the excess volatile component. Then, graphitization follows. It is well-known that voids are easily generated within particle structures during the carbonization and graphitization stages. To compensate for these voids, the coke particles are coated with binder pitch again. Consecutively, binder pitch coated coke particles are carbonized for the second time to produce AG anode material. Meanwhile, it is known that a higher spherical degree of granules suppresses side reactions during LIB application [,,,]. In terms of carbon yield, while the procedure occurs, the carbon yield can be easily reduced. For instance, the coarse and fine grinding steps yield about 70–80%, and granulation yields about 80–90%. When we consider the steps mentioned above, we can expect about 56–72% carbon yield. Therefore, the amount of carbon waste could be 28–44%, which is difficult to recycle. If we can save the carbon yield from the proposed AG manufacturing, the process would be cost-effective.
In this study, we propose an efficient process for AG production. The processes are as follows: pulverization—granulation—graphitization—pitch coating—carbonization. Compared with commercial processes, the carbonization stage is eliminated. Due to our consideration of the spherical degrees of graphite particles and the void compensation within particles, coal-derived pitch was used in this work. A wet coating by coal tar was employed to ensure a uniform pitch coating []. In addition, we confirmed that the shortened process was realized by replacing the binder pitch with coal tar pitch, due to its lower softening point and ability to coat graphite particles. We evaluated the physical properties of graphite anode materials produced by the streamlined process, and tested the LIB performance, suggesting the feasibility of the streamlined process through a comparative analysis with graphite produced by the conventional process.
2. Materials and Methods
2.1. Sample Preparation
As the starting material, coal derived needle coke (POSCO MC MATERIALS. Co. Ltd., Republic of Korea) was adopted. The basic information of binder pitch [] and coal tar pitch used in this research is summarized in Table 1. The entire processes of the commercial and shortened process of AG manufacturing are visualized in Figure 1.

Table 1.
Characteristics of binder pitch and coal tar pitch.
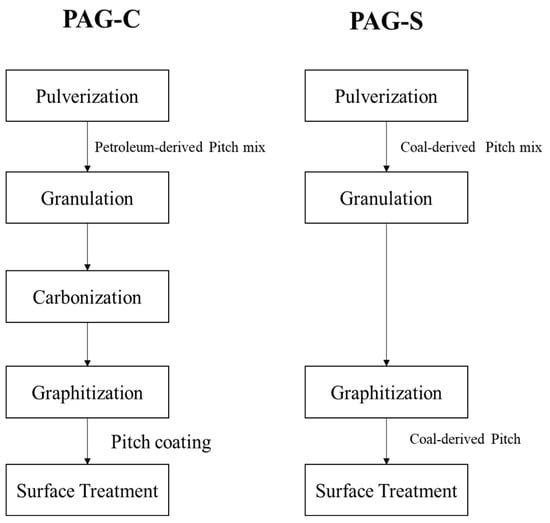
Figure 1.
Flow chart comparison of AG manufacturing by conventional and shortened process.
Firstly, coke powder is pulverized using a jaw crusher to give an average particle size distribution under 3 mm. The coke particles are then introduced finely pulverized using an air classifier mill (hereafter referred to as ACM) to have a particle size (D50 volumetric ratio) of 9 to 15 μm. The coke powder pulverized by ACM still possesses a rough surface that could later adversely affect the formation of a SEI (solid electrolyte interface), providing unnecessary active sites derived from rough morphologies. Thus, coke powder is mixed with petroleum-derived pitch powder in pre-mixing using a V-mixer (30 rpm for at least 30 min). The granulation comes as the next step to smooth these edges to obtain a primary particle. The pre-mixed powder then goes to the next step, which is the secondary particle granulation process via kneading. The vertical kneader requires 11 h and 30 min, that includes reaching the temperature up to 700 °C for 5 h and 30 min, and then kneading at the same temperature for 3 h. Upon the completion of kneading, natural cooling down to room temperature requires around 3 h. The kneaded feed is baked at 1200 °C, and then introduced to the final step of graphitization process at 3000 °C. The graphitized sample goes through surface coating with the binder or coal tar pitch and is then baked at 1200 °C to obtain the finalized product. Here, the shortened process that we proposed uses coal-derived pitch, which has a lower softening point, so the granulation process is shorter and does not require the formation of secondary particles, and the intermediate carbonization process can be skipped.
2.2. Material Characterization
A scanning electron microscope (JSM 7600F, JEOL) equipped with double Cs-correctors was used for the topological characterization of graphite particles. A particle size analyzer (Cilas 1090, Bruben) was used to find the particle size distributions and spans. The span was calculated using the formula (D0.9–D0.1)/D0.5. To obtain the surface properties, a surface analyzer (3 Flex, Micromeritics) was used to characterize the specific surface area, which was calculated by the BET method. A tap density measurement was performed on 20 g of each sample, with a tapping direction of up and down for 3000 counts. Raman spectroscopy (Ram II-Senterra, Bruker) was performed based on 980 to 1980 cm−1 of Raman shift range to confirm the ID band (1320 to 1350 cm−1) and IG band area (1620 cm−1).
Raman 3D mapping is a three-dimensional observation method that expresses the ratio of ID/IG values as the intensity with respect to the sample observation plane. Therefore, in this study, Raman 3D mapping was performed as a method for evaluating surface graphitization. Here, it was performed on a 150 μm × 75 μm area based on ID/IG ratio. The graphitization degree of each graphitized sample from the commercial or shortened process by X-ray diffraction measurement (RINT Ultima+ series, Rigaku), at a scan rate of 0.5°/min (Cu-Kα) in 24–30° range, was based on the Gakushin method, using standard silicon powder as a reference material.
2.3. Electrochemical Performance
2.3.1. Powder Conductivity Measurement
The bulk density and powder conductivity was measured by a powder electrical characteristics evaluation system (HPRM-FA2, Hantech) with a 200 to 1200 kgf loading range.
2.3.2. Cell Preparation and Evaluation
The anode material was produced with the carboxyl methyl cellulose and styrene butadiene rubber as the binder and the conductive material (Super-P), that were uniformly mixed in distilled water to turn into slurry, so that the weight ratio thereof became 97:2:1 (described in the order of anode active material/binder/conductive material). The slurry was coated with a copper (Cu) current collector, compressed by a roll press, and dried under vacuum conditions for 12 h at 100 °C. During this step, the electrode density was set to 1.6 g/cc. 1 M solution of LiPF6 in a mixture of ethylene carbonate (EC), and dimethyl carbonate (DMC) with 1:1 ratio by volume was used as an electrolyte solution. A CR 2032 coin type cell was produced with lithium foil as a counter electrode, according to a common half-cell assembly method. The coin cell test was driven under the condition of 0.2 C, 5 mV, 0.005 C cut-off charging and 1.5 V cut-off discharging, and the rate performance and retention rate are measured in 0.2, 1, 2, 3 and 5 C rate condition.
3. Results and Discussion
3.1. Physical Parameter Comparisons of the PAG-C and PAG-S Process
The physical properties, such as the mean particle size; span of particle distribution; specific surface area, d002 calculated from XRD; and tap density, were summarized in Table 2. Particle size control is one of the important factors in AG evaluation that should be checked for anode material application. The mean particle size of PAG-S was 13.8 μm, which was slightly lower than that of PAG-C, which was 15.6 μm. This would be favorable for conductivity improvement due to the reduction of inter-particle voids during electrode application. In addition, for the span, a lower number indicates a narrower and more uniform particle size distribution, which is important for the merchantability and reliability of particle size, and we found that PAG-S had a more uniform particle size distribution, with a value of 1.10 for PAG-C and 0.91 for PAG-S. The specific surface area, d002, and tap density were all found to be similar between the conventional and shortened processes. Of all the factors, AG from the shortened process had similar physical properties, but from the mean particle size and span results, it is believed that it may be more suitable as an anode material for LIB.

Table 2.
Physical parameters of AG from the commercial and shortened processes.
SEM images of AG derived from the commercial and shortened processes are shown in Figure 2. Since the shape of the AG particles after granulation is an important factor in the AG manufacturing process and electrode fabrication on LIB, we observed the granulation shape by using conventional and shortened processes. The SEM image in Figure 2 shows a comparison of the shape of the rounded graphite. From the observation of the particle morphology after granulation by the conventional process, it is clear that some cracked surfaces are visible on the sides of the particles. Furthermore, when the particles that appeared to have been granulated were observed under magnification, the layered surface was also revealed. On the other hand, the particles that were granulated by the shortened process almost did not reveal the layered surface. When comparing the particles after granulation, it was found that the artificial graphite produced by the shortened process is more granulated than in the conventional process and can be applied directly to commercial grade products. The reason for the better granulation of the artificial graphite by the shortened process seems to be due to the better impregnation of the coal tar pitch to the conventional binder pitch. From the particle observation result, we expect that the conventional process would require two or three additional granulation processes for LIB application, but the shortened process would contribute to an AG manufacturing cost reduction and better LIB performance, due to the relatively uniform spherical shape.
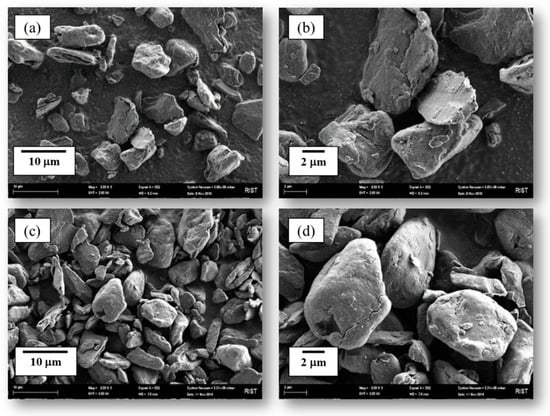
Figure 2.
SEM images of AGs from the commercial process (a,b) and shortened process (c,d).
3.2. Raman Spectroscopy and 3D Mapping Results
In general, the harder the carbon derived from binder pitches in anode materials for LIBs, the fewer lithium-ion storage sites, which occur due to the adverse effects of charge and discharge capacity. This is due to the low degree of graphitization of the hard carbon. Therefore, it is necessary to minimize the hard carbon formed from the binder pitch on the sphericalized AG surface. Since the coal tar pitch used to shorten the process has a lower softening point and a lower fixed carbon content than the conventional binder pitch, it was expected that there would be a difference in the generation of hard carbon after carbonization. Therefore, the AG from the shortened process proposed in this study was analyzed for a hard carbon coating, as a difference in hard carbon content was expected compared to the AG from the commercial process. To compare the powder PAG-C and PAG-S or the electrode surface of PAG-C and PAG-S, each ID/IG mean ratio is shown in Figure 3.
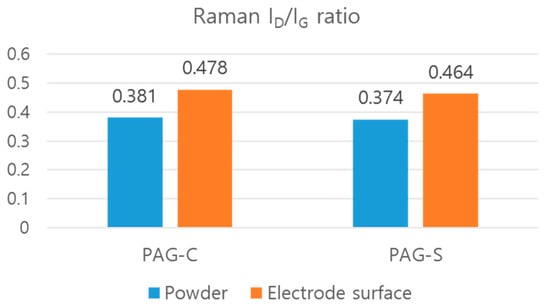
Figure 3.
Powder and electrode surface mean ID/IG ratio of PAG-C and PAG-S.
By comparing the ID/IG values, it was found that the graphitization degree was lower for PAG-S compared to PAG-C for both powder and electrode surfaces, i.e., higher for PAG-C. However, the ID/IG value results only provide the averaged information on the surface of each sample, and it is not possible to quantitatively analyze and identify the distribution of hard carbon formed by binder pitches or coal tar pitches. Therefore, in this study, the distribution of ID/IG value by Raman spectroscopy was analyzed to map the distribution of ID/IG value in three dimensions [,,,]. Figure 4 shows the Raman mapping images of PAG-C and PAG-S and each distribution of ID/IG values. The color bar on the right side of the mapping image shows the height of the ID/IG distribution. The closer to blue, the lower the ID/IG, which means the closer to hard carbon having a low graphitization degree. On the other hand, from green to red, the higher the ID/IG, the higher the graphitization degree. By comparing the mapping images, we found that the AG with the shortened process has more green and red areas compared to the existing process. Also, the ID/IG distribution peak of PAG-S is sharp, indicating that a small amount of hard carbon is uniformly distributed. On the other hand, in the case of PAG-C, a relatively large amount of hard carbon was distributed over a wide range. Therefore, it is believed that the sphericalized AGs produced by the shortened process can be sphericalized with minimal hard carbon formation, contributing to the improvement of capacity and lifetime when utilized as an LIB anode material. To verify the differences when introduced into actual electrodes, Figure 5 shows the distribution of ID/IG values and the results observed by Raman mapping of the electrode surface after processing PAG-C and PAG-S into LIB electrodes. Compared to Figure 3, the ID/IG peak distribution is broadened due to the influence of the electrode binder and conductor material, but PAG-S shows a narrower distribution compared to PAG-C. From these results, it was confirmed that the difference in ID/IG distribution was visible even when applied to actual LIB electrodes, and the expected difference in LIB performance was obtained.
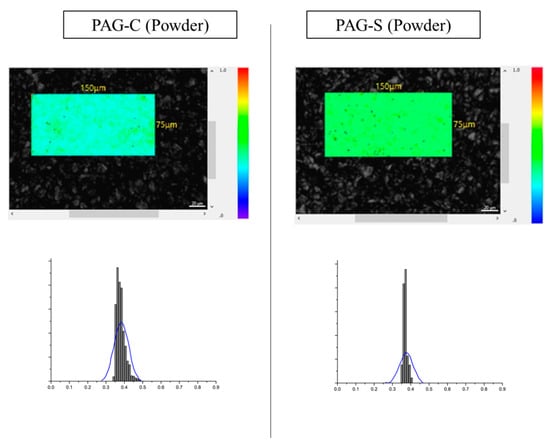
Figure 4.
Raman 3D mapping image and ID/IG distributions of powder PAG-C and PAG-S.
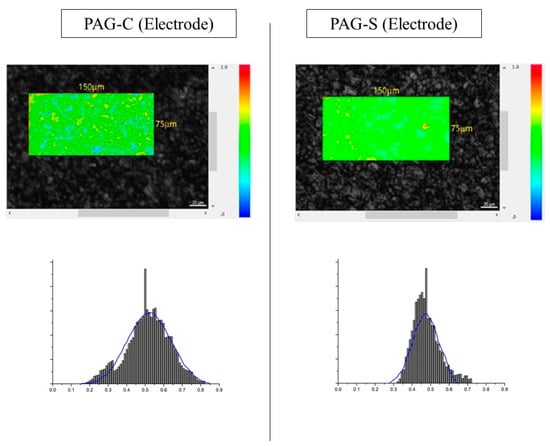
Figure 5.
Raman 3D mapping image and ID/IG distributions of electrode surface of PAG-C and PAG-S.
3.3. Electrochemical Testing Result
The bulk density and powder conductivity results are summarized in Figure 5. We observed an increase in bulk density with load from 200 to 1200 kgf. The density at 200 kgf was 1.21 g/cc for PAG-C and 1.23 g/cc for PAG-S, which was not significantly different. After that, the density of PAG-C and PAG-S gradually increased with the increase in load, and it was found that the density value of PAG-C and PAG-S was 1.72 g/cc, even at the maximum load of 1200 kgf. Therefore, it was confirmed that the bulk density of AG, produced by both the conventional process and shortened process, does not show a significant difference depending on the load. However, when looking at the increase in powder conductivity with the increase in bulk density, the conductivity at the first 1.3 g/cc showed a slight difference between 20.1 S/cm and 24.6 S/cm, and at the maximum density of 1.72 g/cc, the conductivity of PAG-C and PAG-S was 104.1 S/cm and 120.5 S/cm, respectively. This is considered as a result of the small deviation from the amount of coating of hard carbon formed on the AG surface. Since the anode electrode of the LIB product is processed at about 1.6 g/cc, the conductivity at 1.6 g/cc (the red dotted line in Figure 6) is 79.3 S/cm for PAG-C and 89.5 S/cm for PAG-S, and it is also believed that the battery performance of PAG-S is superior when applied into the electrode.

Figure 6.
Bulk density and powder conductivity of graphite samples from commercial and shortened process.
The rate performance results are visualized in Figure 7. In addition, we would like to attach long-term rate performance and cycle life result on Supplemental information. After assembling CR 2032 type half-cells by processing PAG-C and PAG-S as anode electrodes, the rate performance results are shown in Figure 7. The C-rate is the discharge capacity and rate retention percentage at 0.2, 1, 2, 3, and 5 C after charging at 0.2 C, respectively. From the discharge capacity results, PAG-C is shown as having 352.4 mAh/g of discharge capacity. However, PAG-S showed 357.8 mAh/g of discharge capacity. The PAG-S shows a high discharge capacity at 0.2 C, and even goes as high as 5 C. This is believed to be due to the granulation having minimal hard carbon, which ensures that there are sufficient effective Li-ion storage sites on the electrode. In addition, the rate retention results at each C-rate after 0.2 C charging showed little difference between the capacity of PAG-C and PAG-S, indicating that PAG-S maintains its high discharge capacity at a higher C-rate compared to PAG-C. Hard carbon is known to have a high initial capacity, but at a high C-rate, this is mainly irreversible capacity. On the other hand, reversible capacity has been reported for graphite with high graphitization degree. From these results and the references, it is concluded that the increased discharge capacity of PAG-S has a reversible discharge capacity, due to the uniformly sphericalized surface using a smaller amount of coal tar pitch-derived hard carbon compared to PAG-C. It is well known that hard carbon has good initial discharge capacity, but, at a high C-rate, hard carbon exhibits irreversible discharge capacity and low rate retention, due to the low graphitization degree [,,,]. From these results and the references, it is concluded that the PAG-S has an increased reversible discharge capacity that originates from being uniformly sphericalized, and using a smaller amount of coal tar pitch-derived hard carbon compared to PAG-C.
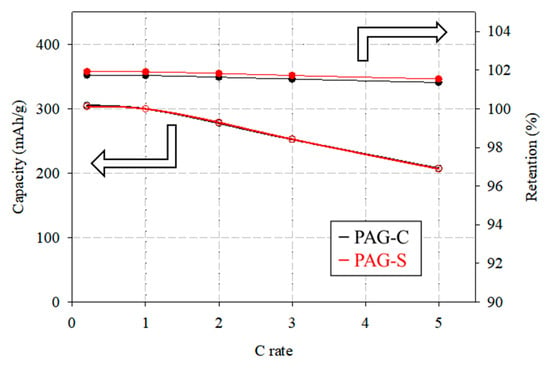
Figure 7.
Rate performance and rate retention results of PAG-C and PAG-S at various C-rates (empty circle lines: capacity, filled circle lines: rate retention).
4. Conclusions
In this study, we developed a shortened process of the artificial graphite manufacturing process for use in LIBs. While most of the same level of physical properties were shown between the two different AG manufacturing methods, we found that the AGs from shortened process had an advantage in particle size control. From a morphological comparison, it was found that the surface of the particles prepared by the shortened process, compared to the conventional process, was relatively well sphericalized, with no obvious layered surface. Although the comparison of the average ID/IG ratio obtained from Raman spectroscopy did not reveal any significant difference, the difference in hard carbon formation and the distribution of AG by the conventional process with binder pitch and the shortened process with coal tar pitch was clearly identified from the Raman 3D mapping results and ID/IG distributions. The AG of the shortened process was uniformly coated with a smaller amount of hard carbon, and the same trend was confirmed not only in the powder but also on the electrode surface. The same level of bulk density resulted in a higher powder conductivity, which is the effect of the minimized and uniformly coated hard carbon on the AG particle’s surface. Through a comparison of the rate performance, it was found that the AG manufactured by the shortened process showed the same rate retention as the AG from the conventional process, but it was a better anode material for LIB due to its higher capacity. By comparing the AG produced by the conventional process and the shortened process based on the same raw material, we reported the production of artificial graphite with similar or superior properties. Consequently, this research can be used to skip some of the steps of the AG manufacturing process, and this is expected to help reduce the production cost of AG.
Supplementary Materials
The following supporting information can be downloaded at: https://www.mdpi.com/article/10.3390/pr12122709/s1, Figure S1: Rate performance results of PAG-C (black dotted line) and PAG-S (red dotted line) at 0.1, 1, 2, 3, 5, and 0.1 C; Figure S2: Cycle life results of PAG-C (black dotted line) and PAG-S (red dotted line) at 0.1 C charge and discharge conditions.
Author Contributions
Conceptualization, G.-H.L. and S.-M.P.; methodology, G.-H.L. and H.Y.; software, G.-H.L., H.Y. and Y.-J.K.; validation, G.-H.L.; formal analysis, G.-H.L. and S.-M.P.; investigation, G.-H.L., Y.-J.K. and J.-C.A.; resources, J.-C.A., S.-H.Y. and J.-I.P.; data curation, H.Y. and J.B.L.; writing—original draft preparation, G.-H.L. and H.Y.; writing—review and editing, H.Y., Y.-J.K., K.O. and J.B.L.; visualization, G.-H.L. and J.B.L.; supervision, S.-H.Y. and J.-I.P.; project administration, S.-H.Y. and J.-I.P. All authors have read and agreed to the published version of the manuscript.
Funding
National Research Foundation of Korea (NRF) funded by the Ministry of Education (MOE) (2021RIS-004), and also Materials/Parts Technology Development Program (20020300) funded by the Ministry of Trade, Industry & Energy (MOTIE).
Data Availability Statement
The original contributions presented in the study are included in the article/Supplementary Material, further inquiries can be directed to the corresponding authors.
Acknowledgments
This research was supported by “Regional Innovation Strategy (RIS)” through the National Research Foundation of Korea(NRF) funded by the Ministry of Education (MOE, Korea) (2021RIS-004), and also this work was supported by the Materials/Parts Technology Development Program (20020300, Development of Waste Carbon Resource-Based Anode Material Manufactur-ing Technology for Secondary Battery) funded by the Ministry of Trade, Industry & Energy (MOTIE, KOREA).
Conflicts of Interest
The authors declare no conflicts of interest.
References
- Scrosati, B.; Garche, J. Lithium batteries: Status, prospects and future. J. Power Sources 2010, 195, 2419–2430. [Google Scholar] [CrossRef]
- Dunn, B.; Kamath, H.; Tarascon, J.M. Electrical energy storage for the grid: A battery of choices. Science 2011, 334, 928–935. [Google Scholar] [CrossRef] [PubMed]
- Nishi, Y. Lithium ion secondary batteries; past 10 years and the future. J. Power Sources 2001, 100, 101–106. [Google Scholar] [CrossRef]
- Tarascon, J.M.; Armand, M. Issues and challenges facing rechargeable lithium batteries. Nature 2001, 414, 359–367. [Google Scholar] [CrossRef] [PubMed]
- Andre, D.; Hain, H.; Lamp, P.; Maglia, F.; Stiaszny, B. Future high-energy density anode materials from an automotive ap-plication perspective. J. Mater. Chem. A 2017, 5, 17174–17198. [Google Scholar] [CrossRef]
- Zanini, M.; Basu, S.; Fischer, J.E. Alternate synthesis and reflectivity spectrum of stage 1 lithium-graphite intercalation compound. Carbon 1978, 16, 211–212. [Google Scholar] [CrossRef]
- Markevich, E.; Levi, M.D.; Aurbach, D. Synthesis and electrical resistivity of lithium-pyrographite intercalation compounds (stages I, II and III). Mater. Res. Bull. 1979, 14, 857–864. [Google Scholar]
- Markevich, E.; Levi, M.D.; Aurbach, D. Comparison between potentiostatic and galvanostatic intermittent titration techniques for determination of chemical diffusion coefficients in ion-insertion electrodes. J. Electroanal. Chem. 2005, 580, 231–237. [Google Scholar] [CrossRef]
- Tsuyoshi, N.; Katsunori, Y. Surface Fluorination and Oxidation of Carbon Materials for Negative Electrode of Lithium Ion Secondary Battery. Tanso 1996, 174, 195–200. [Google Scholar]
- Nitin, A.K.; Joachim, M. Lithium Storage in Carbon Nanostructures. Adv. Mater. 2009, 21, 2664–2680. [Google Scholar]
- Qi, Y.; Guo, H.; Hector, J.L.G.; Timmons, A. Threefold Increase in the Young’s Modulus of Graphite Negative Electrode during Lithium Intercalation. J. Electrochem. Soc. 2010, 157, A558. [Google Scholar] [CrossRef]
- Hatchard, T.D. In situ XRD and electrochemical study of the reaction of lithium with amorphous silicon. J. Electroanal. Chem. 2004, 151, A838–A842. [Google Scholar] [CrossRef]
- Ding, N.; Xu, J.; Yao, Y.X.; Wegner, G.; Fang, X.; Chen, C.H.; Lieberwirth, I. Determination of the diffusion coefficient of lithium ions in nano-Si. Solid State Ion. 2009, 180, 222–2259. [Google Scholar] [CrossRef]
- Xie, J.; Imanishi, N.; Zhang, T.; Hirano, A.; Takeda, Y.; Yamamoto, O. Li-ion diffusion in amorphous Si films prepared by RF magnetron sputtering: A comparison of using liquid and polymer electrolytes. Mater. Chem. Phys. 2010, 120, 421–425. [Google Scholar] [CrossRef]
- Courtney, I.; Tse, J. Ab initio calculation of the lithium-tin voltage profile. Phys. Rev. B Condens. Matter 1998, 58, 15583–15588. [Google Scholar] [CrossRef]
- Tirado, J.L. Inorganic materials for the negative electrode of lithium-ion batteries: State-of-the-art and future prospects. Mater. Sci. Eng. R Rep. 2003, 40, 103–136. [Google Scholar] [CrossRef]
- Xie, J.; Imanishi, N.; Hirano, A.; Takeda, Y.; Yamamoto, O.; Zhao, X.B.; Cao, G.S. Li-ion diffusion behavior in Sn, SnO and SnO2 thin films studied by galvanostatic intermittent titration technique. Solid State Ion. 2010, 181, 1611–1615. [Google Scholar] [CrossRef]
- Scharner, S.; Weppner, W.; Schmid-Beurmann, P. Evidence of two-phase formation upon lithium insertion into the Li1.33Ti1.67O4 spinel. J. Electrochem. Soc. 1999, 146, 857–861. [Google Scholar] [CrossRef]
- Wagemaker, M.; Simon, D.R.; Kelder, E.M.; Schoonman, J.; Ringpfeil, C.; Haake, U.; Lützenkirchen-Hecht, D.; Frahm, R.; Mulder, F.M. A kinetic two-phase and equilibrium solid solution in spinel Li4+xTi5O12. Adv. Mater. 2006, 18, 3169–3173. [Google Scholar] [CrossRef]
- Takami, N.; Hoshina, K.; Inagaki, H. Lithium diffusion in Li4/3Ti5/3O4 particles during insertion and extraction. J. Electrochem. Soc. 2011, 158, A725–A730. [Google Scholar] [CrossRef]
- Wunde, F.; Berkemeier, F.; Schmitz, G. Lithium diffusion in sputter-deposited Li4Ti5O12 thin films. J. Power Sources 2012, 215, 109–115. [Google Scholar] [CrossRef]
- Zhang, X.; Zeng, X.; Yang, M.; Qi, Y. Investigation of a branchlike MoO3/polypyrrole hybrid with enhanced electrochemical performance used as an electrode in supercapacitors. ACS Appl. Mater. Interfaces 2014, 6, 1125–1130. [Google Scholar] [CrossRef] [PubMed]
- Li, S.; Xu, Q.; Uchaker, E.; Cao, X.; Cao, G. Comparison of amorphous, pseudohexagonal and orthorhombic Nb2O5 for high-rate lithium ion insertion. CrystEngComm 2016, 18, 2532–2540. [Google Scholar] [CrossRef]
- Park, T.-H.; Yeo, J.-S.; Seo, M.-H.; Miyawaki, J.; Mochida, I.; Yoon, S.-H. Enhancing the rate performance of graphite anodes through addition of natural graphite/carbon nanofibers in lithium-ion batteries. Electrochim. Acta 2013, 93, 236–240. [Google Scholar] [CrossRef]
- Ma, C.; Zhao, Y.; Li, J.; Song, Y.; Shi, J.; Guo, Q.; Liu, L. Synthesis and electrochemical properties of artificial graphite as an anode for high-performance lithium-ion batteries. Carbon 2013, 64, 553–556. [Google Scholar] [CrossRef]
- Lim, S.-Y. Amorphous-silicon nanoshell on artificial graphite composite as the anode for lithium-ion battery. Solid State Sci. 2019, 93, 24–30. [Google Scholar] [CrossRef]
- Li, H.; Li, W. Improving cycle life and rate capability of artificial graphite anode for lithium-ion batteries by agglomeration. Mater. Lett. 2022, 318, 132227. [Google Scholar] [CrossRef]
- Yoon, S.; Kim, H.; Oh, S.M. Surface modification of graphite by coke coating for reduction of initial irreversible capacity in lithium secondary batteries. J. Power Sources 2001, 94, 68–73. [Google Scholar] [CrossRef]
- Fujii, K.; Yasuda, E.; Tanabe, Y. Dynamic mechanical properties of polycrystalline graphites and a 2D-C/C composite by plate impact. Int. J. Impact Eng. 2001, 25, 473–491. [Google Scholar] [CrossRef]
- Wang, L.; Du, C.; Li, Z.; Han, Y.; Feng, N.; Yang, J. Catalytic graphitization of coke and electrochemical performances of coke-based graphite. J. Alloys Compd. 2023, 960, 170949. [Google Scholar] [CrossRef]
- Seino, K.; Golman, B.; Shinohara, K.; Ohzeki, K. Variation of packing structure of cast film with preparation conditions and particle properties. Tanso 2005, 2005, 2–7. [Google Scholar] [CrossRef][Green Version]
- Liu, H.; Gu, S.; Cao, H.; Li, X.; Li, Y. A dense packing structure constructed by flake and spherical graphite: Simultaneously enhanced in-plane and through-plane thermal conductivity of polypropylene/graphite composites. Compos. Commun. 2020, 19, 25–29. [Google Scholar] [CrossRef]
- Ulusoy, U.; Burat, F.; Bayar, G.; Mojtahedi, B.; Güven, G. Modeling the change of the sphericity feature of graphite particles ground in a ball and vibrating disc mill with grinding time. J. Energy Storage 2024, 97, 112814. [Google Scholar] [CrossRef]
- Lee, G.-H.; Yi, H.; Cho, H.-R.; Kim, Y.-J.; Park, S.-M.; Yoon, S.-J.; Seo, D.-J.; Oh, K.; Yeon, J.-M.; Choi Yoon, S.-H.; et al. Design of Continuous Kneading System for Active Anode Material Fabrication Using Retrofitted Assembly of Co-Rotating Screw Extruder. Processes 2023, 11, 2660. [Google Scholar] [CrossRef]
- Han, Y.J.; Kim, J.; Yeo, J.S.; An, J.C.; Hong, I.P.; Nakabayashi, K.; Miyawaki, J.; Jung, J.D.; Yoon, S.H. Coating of graphite anode with coal tar pitch as an effective precursor for enhancing the rate performance in Li-ion batteries: Effects of composition and softening points of coal tar pitch. Carbon 2015, 94, 432–438. [Google Scholar] [CrossRef]
- Dovbeshko, G.; Cherepanov, V.; Boiko, V.; Perederiy, A.; Olenchuk, M.; Negriyko, A.; Posudievsky, O.; Moiseyenko, V.; Romanyuk, V. Raman modes and mapping of graphene nanoparticles on Si and photonic crystal substrates. Opt. Mater. X 2022, 15, 100163. [Google Scholar] [CrossRef]
- Zhang, G.; Wang, X.; Wang, Y.; Cui, H.; Zhao, W.; Qiu, L. Miniaturized high-resolution dual 2D MEMS mirror scanning confocal Raman microscopy for topographic and Raman mapping. Measurement 2024, 224, 113807. [Google Scholar] [CrossRef]
- Koutentaki, G.; Krýsa, P.; Trunov, D.; Pekárek, T.; Pišlová, M.; Šoóš, M. 3D Raman mapping as an analytical tool for investigating the coatings of coated drug particles. J. Pharm. Anal. 2023, 13, 276–286. [Google Scholar] [CrossRef]
- He, Q.; Jiang, X.; Xu, J.; Wang, C.; Jiang, M.; Wang, G.; Jiang, L.; Xu, K.; Wang, Y.; Su, S.; et al. Heterogeneous chemical structures of single pulverized coal particles and their evolution during pyrolysis: Insight from micro-Raman mapping technique. Powder Technol. 2023, 420, 118385. [Google Scholar] [CrossRef]
- Han, Y.-J.; Chung, D.; Nakabayashi, K.; Chung, J.-D.; Miyawaki, J.; Yoon, S.-H. Effect of heat pre-treatment conditions on the electrochemical properties of mangrove wood-derived hard carbon as an effective anode material for lithium-ion batteries. Electrochim. Acta 2016, 213, 432–438. [Google Scholar] [CrossRef]
- Ralph, N.N.; Ma, W.; Tsujimoto, S.; Inoue, Y.; Yokoyama, Y.; Kondo, Y.; Miyazaki, K.; Miyahara, Y.; Fukutsuka, T.; Lin, S.-K.; et al. Electrochemical properties of surface-modified hard carbon electrodes for lithium-ion batteries. Electrochim. Acta 2021, 379, 138175. [Google Scholar]
- Li, L.; Dan Zhang, D.; Deng, J.; Gou, Y.; Fang, J.; Cui, H.; Zhao, Y.; Cao, M. Carbon-based materials for fast charging lithium-ion batteries. Carbon 2021, 183, 721–734. [Google Scholar] [CrossRef]
Disclaimer/Publisher’s Note: The statements, opinions and data contained in all publications are solely those of the individual author(s) and contributor(s) and not of MDPI and/or the editor(s). MDPI and/or the editor(s) disclaim responsibility for any injury to people or property resulting from any ideas, methods, instructions or products referred to in the content. |
© 2024 by the authors. Licensee MDPI, Basel, Switzerland. This article is an open access article distributed under the terms and conditions of the Creative Commons Attribution (CC BY) license (https://creativecommons.org/licenses/by/4.0/).