Article

Carbon-Free H2 Production from Ammonia Decomposition over 3D-Printed Ni-Alloy Structures Activated with a Ru/Al2O3 Catalyst

1
CNR-ITAE “Nicola Giordano”, Via Salita S. Lucia Sopra Contesse 5, 98126 Messina, Italy
2
ENGIE Laborelec, Rodestraat 125, 1630 Linkebeek, Belgium
3
ENGIE Lab CRIGEN, 4 Rue Joséphine Baker, 93240 Stains, France
4
Sustainable Process Engineering, Chemical Engineering and Chemistry, Eindhoven University of Technology, Den Dolech 2, 5612 AZ Eindhoven, The Netherlands
*
Author to whom correspondence should be addressed.
Processes 2024, 12(12), 2663; https://doi.org/10.3390/pr12122663
Submission received: 26 September 2024 / Revised: 4 November 2024 / Accepted: 9 November 2024 / Published: 26 November 2024

Abstract

:
Hydrogen, with its high energy density and zero greenhouse gas emissions, is an exceptional energy vector, pivotal for a sustainable energy future. Ammonia, serving as a practical and cost-effective hydrogen carrier, offers a secure method for hydrogen storage and transport. The decomposition of ammonia into hydrogen is a crucial process for producing green hydrogen, enabling its use in applications ranging from clean energy generation to fueling hydrogen-powered vehicles, thereby advancing the transition to a carbon-free energy economy. This study investigates the catalytic performance of various 3D-printed porous supports based on periodic open cellular structures (POCS) and triply periodic minimal surface (TPMS) architecture manufactured from IN625 nickel alloy powder using the laser powder bed fusion (LPBF) technique. The POCS and TPMS, featuring geometries including BCC, Kelvin, and Gyroid, were analyzed for cell size, strut/sheet diameter, porosity, and specific surface area. Pressure drop analyses demonstrated correlations between structural parameters and fluid dynamics, with BCC structures exhibiting lower pressure drops due to their higher porosity and the open channel network. The dip/spin coating method was successfully applied to activate the supports with a commercial Ru/Al2O3 catalyst, achieving uniform coverage crucial for catalytic performance. Among the tested geometries, the Gyroid structure showed superior catalytic activity towards ammonia decomposition, attributed to its efficient mass transfer pathways. This study highlights the importance of structural design in optimizing catalytic processes and suggests the Gyroid structure as a promising candidate for improving reactor efficiency and compactness in hydrogen production systems.

1. Introduction

Hydrogen is a promising alternative to fossil fuels, crucial for advancing the global green energy economy [1]. However, the hydrogen economy faces challenges, particularly in storing hydrogen safely and economically at high densities without relying on high pressures. Several hydrogen storage strategies have been explored to improve volumetric density, including liquid carriers like methanol, formic acid, and ammonia [2]. Among these, ammonia stands out due to its high energy density, low production cost, and ease of liquefaction at room temperature [3]. Ammonia has been considered for both short- and long-term H2 storage, particularly for use in the transportation sector [4,5]. Liquid ammonia can store hydrogen in volumes much higher (121 kg-H2/m3) than liquid hydrogen (70.8 kg-H2/m3), which is about 1.7 times as high. Moreover, liquid ammonia can be stored at relatively low pressures (0.99 MPa at a temperature of 25 °C), which is significantly lower than that of compressed hydrogen. In this context, renewable ammonia production has recently gained attraction due to its potential role as a decarbonized hydrogen carrier and as a fuel in the hydrogen economy. Despite its potential, the use of ammonia as a hydrogen source has been limited by the absence of an efficient method for its decomposition into hydrogen and nitrogen, which is vital for the on-site generation of hydrogen, especially for mobile applications. Catalytic cracking or decomposition of ammonia (2NH3 ←→ 3H2 + N2, ΔH = 46 kJ mol−1) is the reverse reaction of the Haber–Bosch synthesis of ammonia. According to Le Chatelier’s principle, the reaction is favored at low pressures, and as it is mildly endothermic, it is favored by high temperatures. The equilibrium conversion of ammonia reaches values above 99% at 400 °C at ambient pressure [6]. Today, ammonia cracker units are commercially used in the metallurgy industry for processes like welding, brazing, and nitriding [7]. In these units, ammonia is preheated and passed through a reactor containing a catalyst, operating at high temperatures of 850–1000 °C to achieve full conversion. These small crackers produce 1–1500 kg of hydrogen per day with energy efficiencies ranging from 30% to 60%. The endothermic nature of the cracking reaction results in a reactor design similar to steam methane reforming applications to enable efficient delivery of heat into the catalyst bed. Indeed, multi-tubular reactors packed with catalysts are used [8]. For small-scale applications, the reactors are heated with electric furnaces; instead, for larger scale utilization (e.g., heavy water production, 1000 ton NH3 day−1) the reactor setup is equipped with external burners where ammonia or natural gas and part of the produced hydrogen are used as fuels [9]. Thermal reactors often face similar challenges. Energy demand is closely tied to process efficiency, which is primarily affected by heat flow and temperature gradients. Ensuring uniform temperature distribution and preventing local hotspots from uneven heating are key objectives for all thermal reactors. Currently, packed-bed reactors struggle with poor convective heat transfer between catalyst pellets and experience significant pressure drops. Moreover, the resulting units have limited management of convective heat fluxes inside and around the cracking tube. These factors reduce reactor productivity and shorten the catalyst’s lifetime, especially for distributed applications. Another critical challenge in NH3 decomposition is catalyst development. A wide range of monometallic catalytic systems have been tested for hydrogen production via ammonia decomposition. The catalytic activity is highly dependent on the choice of metal component, the catalytic support, and the potential use of promoters, as well as the NH3 decomposition conditions. Taking this into account, the general activity trend of monometallic systems supported on activated alumina is Ru > Ni > Rh > Co > Ir > Fe > > Pt > Cr > Pd > Cu ≥ Te > Se > Pb [10]. Different combinations of metals, such as Co–Mo, Ni–Mo, Fe–Mo, Ni–Co, Co–Mo–Fe–Ni–Cu, Mg–Fe, Fe–Co, Ni–Fe, Mg–Co–Fe, Ni–Pt, Ni–Pd, Ir–Ni, Cu–Zn, and bimetallic compositions with Ru, have also been studied [10]. Alternative catalysts in the literature, such as amide/imide-based catalysts, have shown promising activities and are still under development [11]. Many mechanisms have been proposed for NH3 decomposition. Nevertheless, irrespective of the specific catalysts, there are two possible rate-limiting steps: (1) cleavage of the first N-H bond resulting in the formation of NH2 (ad) and H (ad), or (2) the recombination of N (ad) resulting in the desorption of N2. The binding energy of the N (ad) atom on the active metal surface is a good descriptor for NH3 decomposition. This binding energy must be strong enough for dehydrogenation of the NHx species to occur but sufficiently weak so that the recombinative N2 desorbs from the surface to complete the catalytic cycle [12]. The Ru-based materials are reported as the most effective catalysts for low-temperature NH3 decomposition based on their electronic promotion possessing an optimum N2 binding energy [13]. The basic steps for the generation of H2 from NH3 decomposition are as follows [8]:
(1)
Ammonia adsorption:
NH3 (g) + * ⇔ NH3* (ads)
(2)
1st N-H cleavage:
NH3 (ads) + * → NH2* (ads) + H* (ads)
(3)
2nd N-H cleavage:
NH2 (ads) + * → NH* (ads) + H* (ads)
(4)
3rd N-H cleavage:
NH* (ads) + * → N* (ads) + H* (ads)
(5)
H2 recombination:
2H* (ads) → H2 (g) + 2*
(6)
N2 recombination:
2N* (ads) → N2 (g) + 2*
where * is the active surface site.
Ruthenium catalysts exhibit high activity below 500 °C, especially when supported on carbon (CNTs, CNFs, and graphene) or metal oxides (Al2O3, MgO, SiO2) [14]. However, their high cost, due to the high Ru content (2–8 wt%), are disadvantages for future large-scale applications. In addition, Ru is included in the EU’s list of Critical Raw Materials (CRMs). Nowadays, the catalyst used commercially for the decomposition of ammonia at high temperatures is nickel supported on alumina, due to its mechanical properties and heat resistance [15]. Also, lanthanum oxide, silica, magnesium oxide, ceria, titania, and zirconia have all demonstrated high activity at temperatures above 600 °C. Operational conditions are typically up to 900 °C where near-equilibrium conversion can be achieved. Nickel catalysts are relatively inexpensive compared to precious metal catalysts, and their advantage is further enhanced by their ability to achieve near-equilibrium conversion at much higher space velocities than lower temperature catalysts. This makes nickel catalysts both suitable and cost-effective for large-scale applications where a substantial amount of catalyst is needed. However, ruthenium-based catalysts may be a good choice for small-scale applications for the distributed production of green hydrogen from ammonia decomposition. Indeed, the economics of low-temperature applications involve balancing the savings from operating at lower temperatures with the higher costs of PGM-based catalysts [7]. While ruthenium is effective at low temperatures, even minimal loadings can significantly increase costs, with prices in August 2024 around USD $400 per troy ounce [16]. Thus, there is a pressing need to develop new compact reactor architectures that optimize material usage and enhance the efficiency of expensive ruthenium-based catalysts. By reducing the amount of construction material and catalyst required, these advanced designs could significantly lower costs while maintaining high productivity. Membrane reactors offer a promising solution by allowing selective separation and reaction processes within a single unit at lower temperatures with respect to conventional reactors. This integration can improve catalyst utilization, reduce the overall catalyst load, and increase the efficiency of low-temperature hydrogen production, making them an ideal choice for future applications. In recent studies [17,18] Gallucci et al. experimentally demonstrated the catalytic decomposition of ammonia to recover pure H2 in a tubular packed bed membrane reactor (PBMR) over a Ru-based catalyst (2 wt% Ru/Al2O3 in pelletized form, 3 mm) and double-skin Pd-based membranes and low-cost carbon molecular sieve membrane (CMSM). In the case of the Pd-based membrane, for temperatures from and above 425 °C, full NH3 conversion was achieved, and more than 86% of H2 fed to the system as ammonia was recovered with a purity of 99.998% at 4 bar. In the case of CMSM operating at 5 bar and temperatures ranging from 450 to 500 °C, NH3 conversion rates exceeding 90% were achieved, with conversion approaching thermodynamic equilibrium at temperatures above 475 °C. Simultaneously, the carbon membrane facilitated the recovery of hydrogen from ammonia, yielding recoveries of 8.2–9.8%. The recovery process can be improved through the optimization of the installed membrane area as compared to the amount of catalyst used and the residence time of ammonia in the reactor. This is a viable path due to the cost of carbon membranes that are in fact less expensive compared to Pd-based membranes. On the catalyst side, as discussed above, conventional packed-bed reactors face limitations in heat and mass transfer, which are crucial for efficient catalyst utilization and hydrogen diffusion. In this regard, structured catalysts can play a relevant role to enhance ammonia decomposition. Structured catalysts for process intensification are receiving a large interest from the chemical engineering community and are also becoming a topic of great attention in industrial research. There has been a gradual increase in the use of open-cell foams, monoliths, and periodic structures as catalyst supports for processes where high gas throughput and low-pressure drop, as well as high heat and mass transfer, are required [19,20,21]. Moreover, structured catalysts enable the use of less catalyst due to their high specific surface area, which maximizes the exposure of active sites [22]. This efficient utilization of the catalyst not only enhances reaction rates but also significantly reduces the amount of catalyst required. As a result, the overall costs of catalyst materials, especially expensive ones like ruthenium-based ones, can be substantially lowered, making the cost of a reactor unit more economical without compromising performance. A new generation of cellular structures, known as metallic periodic open cellular structures (POCS), has recently gained attention in the scientific community. Produced through additive manufacturing (AM), also known as 3D printing, this technique has been around for over 30 years but has only recently been explored for designing and producing innovative structured catalysts [23]. The POCS are characterized by a single unit cell, such as cubic, tetrakaidecahedral, or diamond, repeated in all spatial directions, creating a highly regular structure that combines the benefits of open-cell foams and honeycomb monoliths, such as high radial mass flow, high radial heat exchange, very good tortuosity of the gas flow, low resulting pressure drop, and tunable geometrical macroporosity [24]. Indeed, the design flexibility of AM allows for optimizing network geometry (pores, cells, and strut sizes), specific surface area, porosity, flow resistance, mass transfer, and heat transfer when they are made of highly conductive materials [25]. Additionally, these technologies are sustainable for industrial use, reducing material waste, human involvement, and energy consumption while enabling more complex geometries than traditional manufacturing methods [26]. In general, the washcoating technique is widely used for the functionalization of structured supports for application in thermochemical processes. It offers key advantages: it reduces the amount of catalyst needed, particularly important for costly critical raw materials (CRMs) like platinum group metals (PGMs), lowering overall device costs. Additionally, it enhances the exposed catalytic surface, improving reactant access and boosting mass and heat transfer efficiency. This leads to higher specific activity per mass of catalyst compared to conventional packed bed systems. Among the different procedures, a combined dip-spin coating method was evaluated successfully as a possible alternative deposition technique for complex geometries (Foams) to the commonly used dip coating process [27]. In addition, the dip-spin coating method was also used for the activation of POCS [28]. This study investigated various porous open-cell structures manufactured from IN625 nickel alloy powder using the laser powder bed fusion (LPBF) technique. Analysis encompassed characteristics such as cell size, strut/sheet size, porosity, solid volume, and specific surface area across different POCS geometries, including BCC and Kelvin. The triply periodic minimal surface (TPMS) architecture named Gyroid has also been investigated and compared to the POCS. The dip/spin coating method was employed to uniformly activate all the metallic supports. Catalytic activity towards ammonia decomposition was comprehensively investigated, varying weight space velocity (WSVs: 26,154–52,564 cm3 gcat−1 h−1, gas hourly space velocity, GHSV: 5172–10,446 h−1) and temperature (400–600 °C) with the aim to identify correlations between structural parameters and catalytic performances. Although there are several correlations derived for traditional cellular structures, to the best of our knowledge there is no publication that makes use of the flexible design opportunities of POCS and TPMS geometries for the enhancement of the ammonia decomposition process.

2. Materials and Methods

2.1. Materials

POCS and TPMS Structures and Used Catalyst

The POCS and TPMS were manufactured using the laser powder bed fusion (LPBF) technique based on CAD files, resulting in cylindrical structures with an envelope of 10 mm diameter and 15 mm height (Figure 1, Figure 2 and Figure 3). The POCS structures are made of two unit-cell types: BCC and Kelvin, repeated in the x, y, and z directions to reach the envelope dimensions given hereabove; instead, the TPMS structures are made of a single cell named Gyroid. Ni-alloy (Ni625) was selected as powder material for the printing process, and a SLM280 HL metal printer was used to produce the POCS and the TPMS samples.
Table 1 provides a summary of the design parameters, namely materials, strut/sheet size, cell length, porosity, and internal surface area derived from the CAD with the values experimentally obtained. It can be noted that the measured dimensions are in good agreement with the theoretical (i.e., CAD) dimensions. The catalyst used for the coating process is a commercial 5 wt% Ru/Al2O3 from Engelhard.

2.2. Activation of the Structured Supports

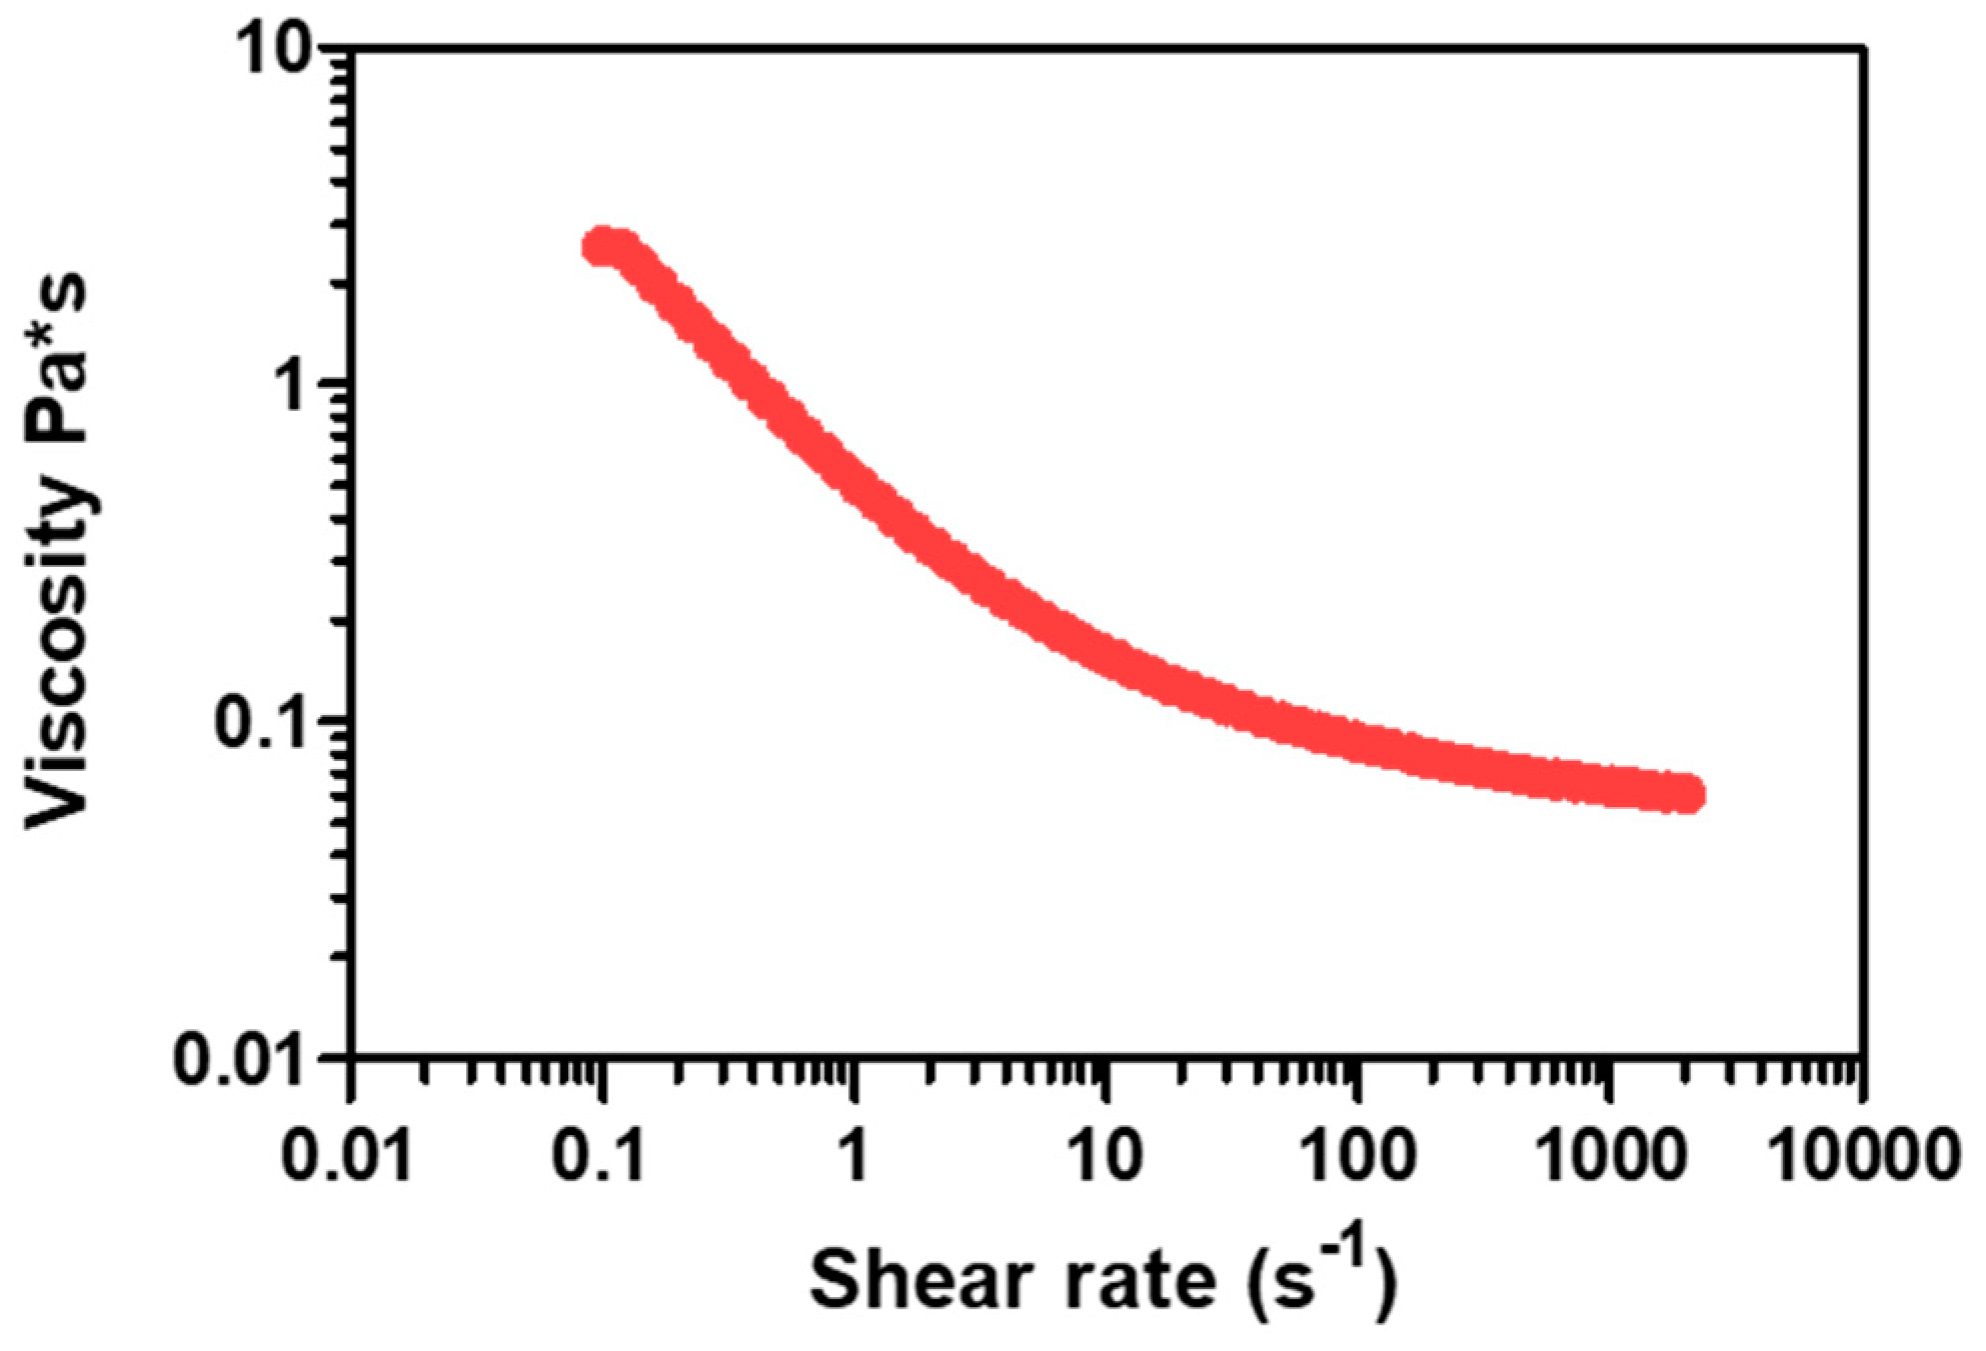
2.2.1. Slurry Preparation and Composition

The composition of the slurry prepared is reported in Table 2. Powder dispersions were obtained according to a procedure reported elsewhere [29].
The dispersion medium was produced by dissolving polyvinyl alcohol (PVA, 87–89% hydrolyzed from Sigma–Aldrich, St. Louis, MO, USA) in distilled water and then by adding glycerol (GLY, 99.5% bi-distilled, Analar Normapur®, Radnor, PA, USA) under magnetic stirring at 85 °C. GLY was used as dispersant, PVA as rheology modifier, and distilled water as solvent/diluent. Catalyst powder (5 wt% Ru/Al2O3, Engelhard, Iselin, NJ, USA) was thus added to the dispersion medium, and the resulting slurry was ball-milled using agate spheres (1 cm diameter and mass ratio with respect to powder equal to 7) as grinding bodies for 24 h at 300 rpm in an agate jar (vol. = 50 cm3). Prior to addition to the dispersion mixture, the powder was ball milled for 3 h at 300 rpm in the same jar used to prepare the dispersion. At the end of the milling process, a sonication treatment was performed for 30 min on the slurry to reduce foaming. Glycerol/powder ratio of 1.9 and water/powder ratio of 1.5, respectively, and 2 wt% of PVA related to the water–glycerol mixture was used. The flow curve reported in Figure 4 indicates that the prepared slurry exhibits shear-thinning behavior, which is advantageous for coating processes. This rheological property allows the slurry to maintain a thick, stable consistency while becoming more fluid under shear during application. This behavior ensures uniform coating coverage since the slurry can flow easily into small pores and around complex geometries.

2.2.2. Support Pretreatment and Slurry Deposition

Before the deposition process, the as-built samples were cleaned in a mixture of acetone/water (50% vol.) in an ultrasound bath for 30 min, immersed in a 2M NaOH solution for 1 min, washed in water, and then dried at 120 °C for 1 h. After the cleaning phase, the structures were calcined at 900 °C for 6 h in calm air in a furnace to generate a thin layer of oxides [30], which can improve the powder adhesion strength. Slurry deposition was performed by coupling a dip coating and a spin coating procedure. In a typical procedure, the structured sample was dipped by hand in the liquid medium. Special care must be taken to ensure that the network is completely saturated and wetted with slurry. This procedure is completed after a short immersion time of about 10 s. Then, a commercial spin-coater (SPIN 150 SPS Europe, Putten, The Netherlands) was used to remove the excess liquid that was entrapped in the support network. Rotation time (20 s), rotation speed (1000 s−1), and acceleration (1000 rpm/s2) were precisely controlled. After each step, samples were flash dried in air for 6 min at 350 °C in a furnace. Multiple dipping and spinning (about four steps) were performed to obtain a coating load of about (≈0.2 g/cm3). The final structured catalysts were obtained by calcining at 450 °C for 6 h (5 °C min−1 heating rate). The coating quality is considered perfect when the structured network is completely coated and open cells at the same time show no prevalent clogging phenomena. Gravimetric analysis was performed after each flash drying step and after the final calcination process to control weight evolution and assess washcoat load. The final washcoat load was determined by weight as the difference between the as-built and the coated samples. In Figure 5, Figure 6 and Figure 7, repesentative images of washcoated samples are reported. The images confirm that the dip-spin coating method facilitated a uniform catalyst distribution across different geometries, ensuring even coverage regardless of the structural design. This allows to minimize discrepancies in active site distribution, enabling a focused evaluation of how geometric factors, such as cell design and strut thickness, influence performance. Moreover, the spinning step and, in particular, the spin speed could be controlled to prevent any type of clogging. An increase in the spinning speed has the potential to remove excess slurry more effectively, generating thinner catalyst layers and limiting occlusion within the pores.

2.3. Test Setup

The catalytic behavior of the sample for ammonia decomposition was studied at atmospheric pressure by using a fixed-bed quartz reactor (Øint. = 1 cm, length of catalytic bed = 1.5 cm) in the temperature range 400–600 °C at different weight space velocity (WSVs: 26,154–52,564 cm3 gcat−1 h−1, gas hourly space velocity, GHSV: 5172–10,446 h−1). The flow was composed of 46% ammonia and the rest helium (used as internal standard). The catalysts are reduced in situ with a 50% v/v flow of H2/N2 at the flow rate of 15 mL min−1 at 300 °C for 2 h. After that, the catalyst was cooled down to 300 °C under N2 flow (15 mL min−1). Next, catalytic tests were carried out by setting the ammonia flow rate between 102 and 205 mL min−1, varying the temperature from 400 to 600 °C at intervals of 25 to 25 °C. The outgas stream was analyzed online by using a GC-MS (GC 7890A and MS 5975C, Agilent, Santa Clara, CA, USA) composed of three parallel columns (Hayesep Q, HP PLOT Q, and Molesive 45/60, Santa Clara, CA, USA) connected to a thermal conductivity detector (TCD) using Ar as carrier gas. The hydrogen formation rate (mmol h−1 gcat−1) was calculated from the H2 content in the reaction products, while ammonia conversion was calculated using the following equation:
Χ N H 3 ( % ) = F N H 3 i n     F N H 3 o u t F N H 3 i n 100
where FNH3in and FNH3out indicate the inlet and outlet NH3 molar flow rates (mmol gas⋅min−1), respectively. Note that, once the reaction stabilized at the required temperature, five consecutive measurements were taken, with the average value presented in this work. To assess the stability of the catalysts, certain temperature points (400 and 550 °C) were repeated at the end of the temperature evaluation (each structured catalyst was tested for approximately 40 h, with daily start-up and shut-down cycles). All the catalysts prepared showed good stability under these conditions, maintaining constant activity throughout the repeated tests. It should be mentioned that ammonia conversion in the temperature range 400–600 °C in the blank reactor was negligible under the selected operation conditions.

2.4. Characterizations

The MultiVolume Pycnometer 1305 (Micromeritics, Norcross, GA, USA) was used to obtain true volume and relative densities/porosities of the structured samples. The analyst enters the mass of the material, and then the chamber containing the sample is first pressurized with helium. Subsequent expansion of this gas into a precisely measured volume results in a pressure drop. The sample volume, density, and porosity are then easily calculated from the two pressure readings as displayed on the digital indicator. Density can then be calculated with an assured accuracy of ±0.1 to 0.2%, and volume can be calculated with a guaranteed accuracy of ±0.2% (±0.010 cm3).
The coating procedure was evaluated in terms of homogeneity of the coating, amount of catalyst deposited, and adhesion force. A Keyence VHX-7000 (KEYENCE ITALIA S.p.A., Milano, Italy) digital optical microscope characterized by a fully integrated head that uses stage shift technology and 4K mode for high-resolution imaging was also used for morphological measurements. Detailed images of the POCS were taken with VHX-E20 (high-resolution, low magnification objective lens 20–100×) and VHX-E100 lenses (high-resolution, medium magnification objective lens 100–500×). Measurements were made at various points on the struts and windows to identify any discrepancies from the CAD model.
The adherence of the coating layer was evaluated in terms of weight loss after ultrasonic treatment in a petroleum ether bath for 30 min. The coated POCSs were treated for 30 min at 45 kHz and 130 W using the USC 900D (Basildon Essex, UK) ultrasonic bath and dried for 1 h at 120 °C. The weight loss percentage was referred to the catalytic layer deposited.
The rheology of the slurry was characterized using a rotational rheometer (Modular Compact Rheometer MCR 92, Anton Paar GmbH, Graz, Austria). Measurements were made at 25 °C by using a double-gap measuring system. Slurry viscosity was measured in the 0.1–3000 s−1 shear rate range.
The pressure drop was measured with a micromanometer (DeltaOhm HD 2114.2, Delta Strumenti s.r.l., Gemonio, Varese, Italy) with an instrumental resolution of 0.005 mbar and an accuracy of +/− 0.3% of full scale attached to a tube housing the structured samples. The pressure ports are located 6 cm from both the inlet and outlet of the sample (external diameter = 1 cm, length = 1.5 cm) positioned in the middle of the reactor tube. N2 was introduced at room temperature, and its rate was determined by a different digital flowmeter (Defender 530+, volumetric accuracy = 0.75%, standardized accuracy: 1%, MesaLabs, Lakewood, CO, USA), with velocities ranging from 0 to10 m/s. To mitigate the potential impact of the reactor setup, blank tests (without the structured support) were carried out for each flow rate and sample used. These blank tests allow you to isolate and subtract any interference arising from pressure loss attributable to the reactor setup and the positioning of pressure ports to ensure that the measured pressure drop accurately reflects the characteristics of the samples under investigation, regardless of any external influences.

3. Results and Discussion

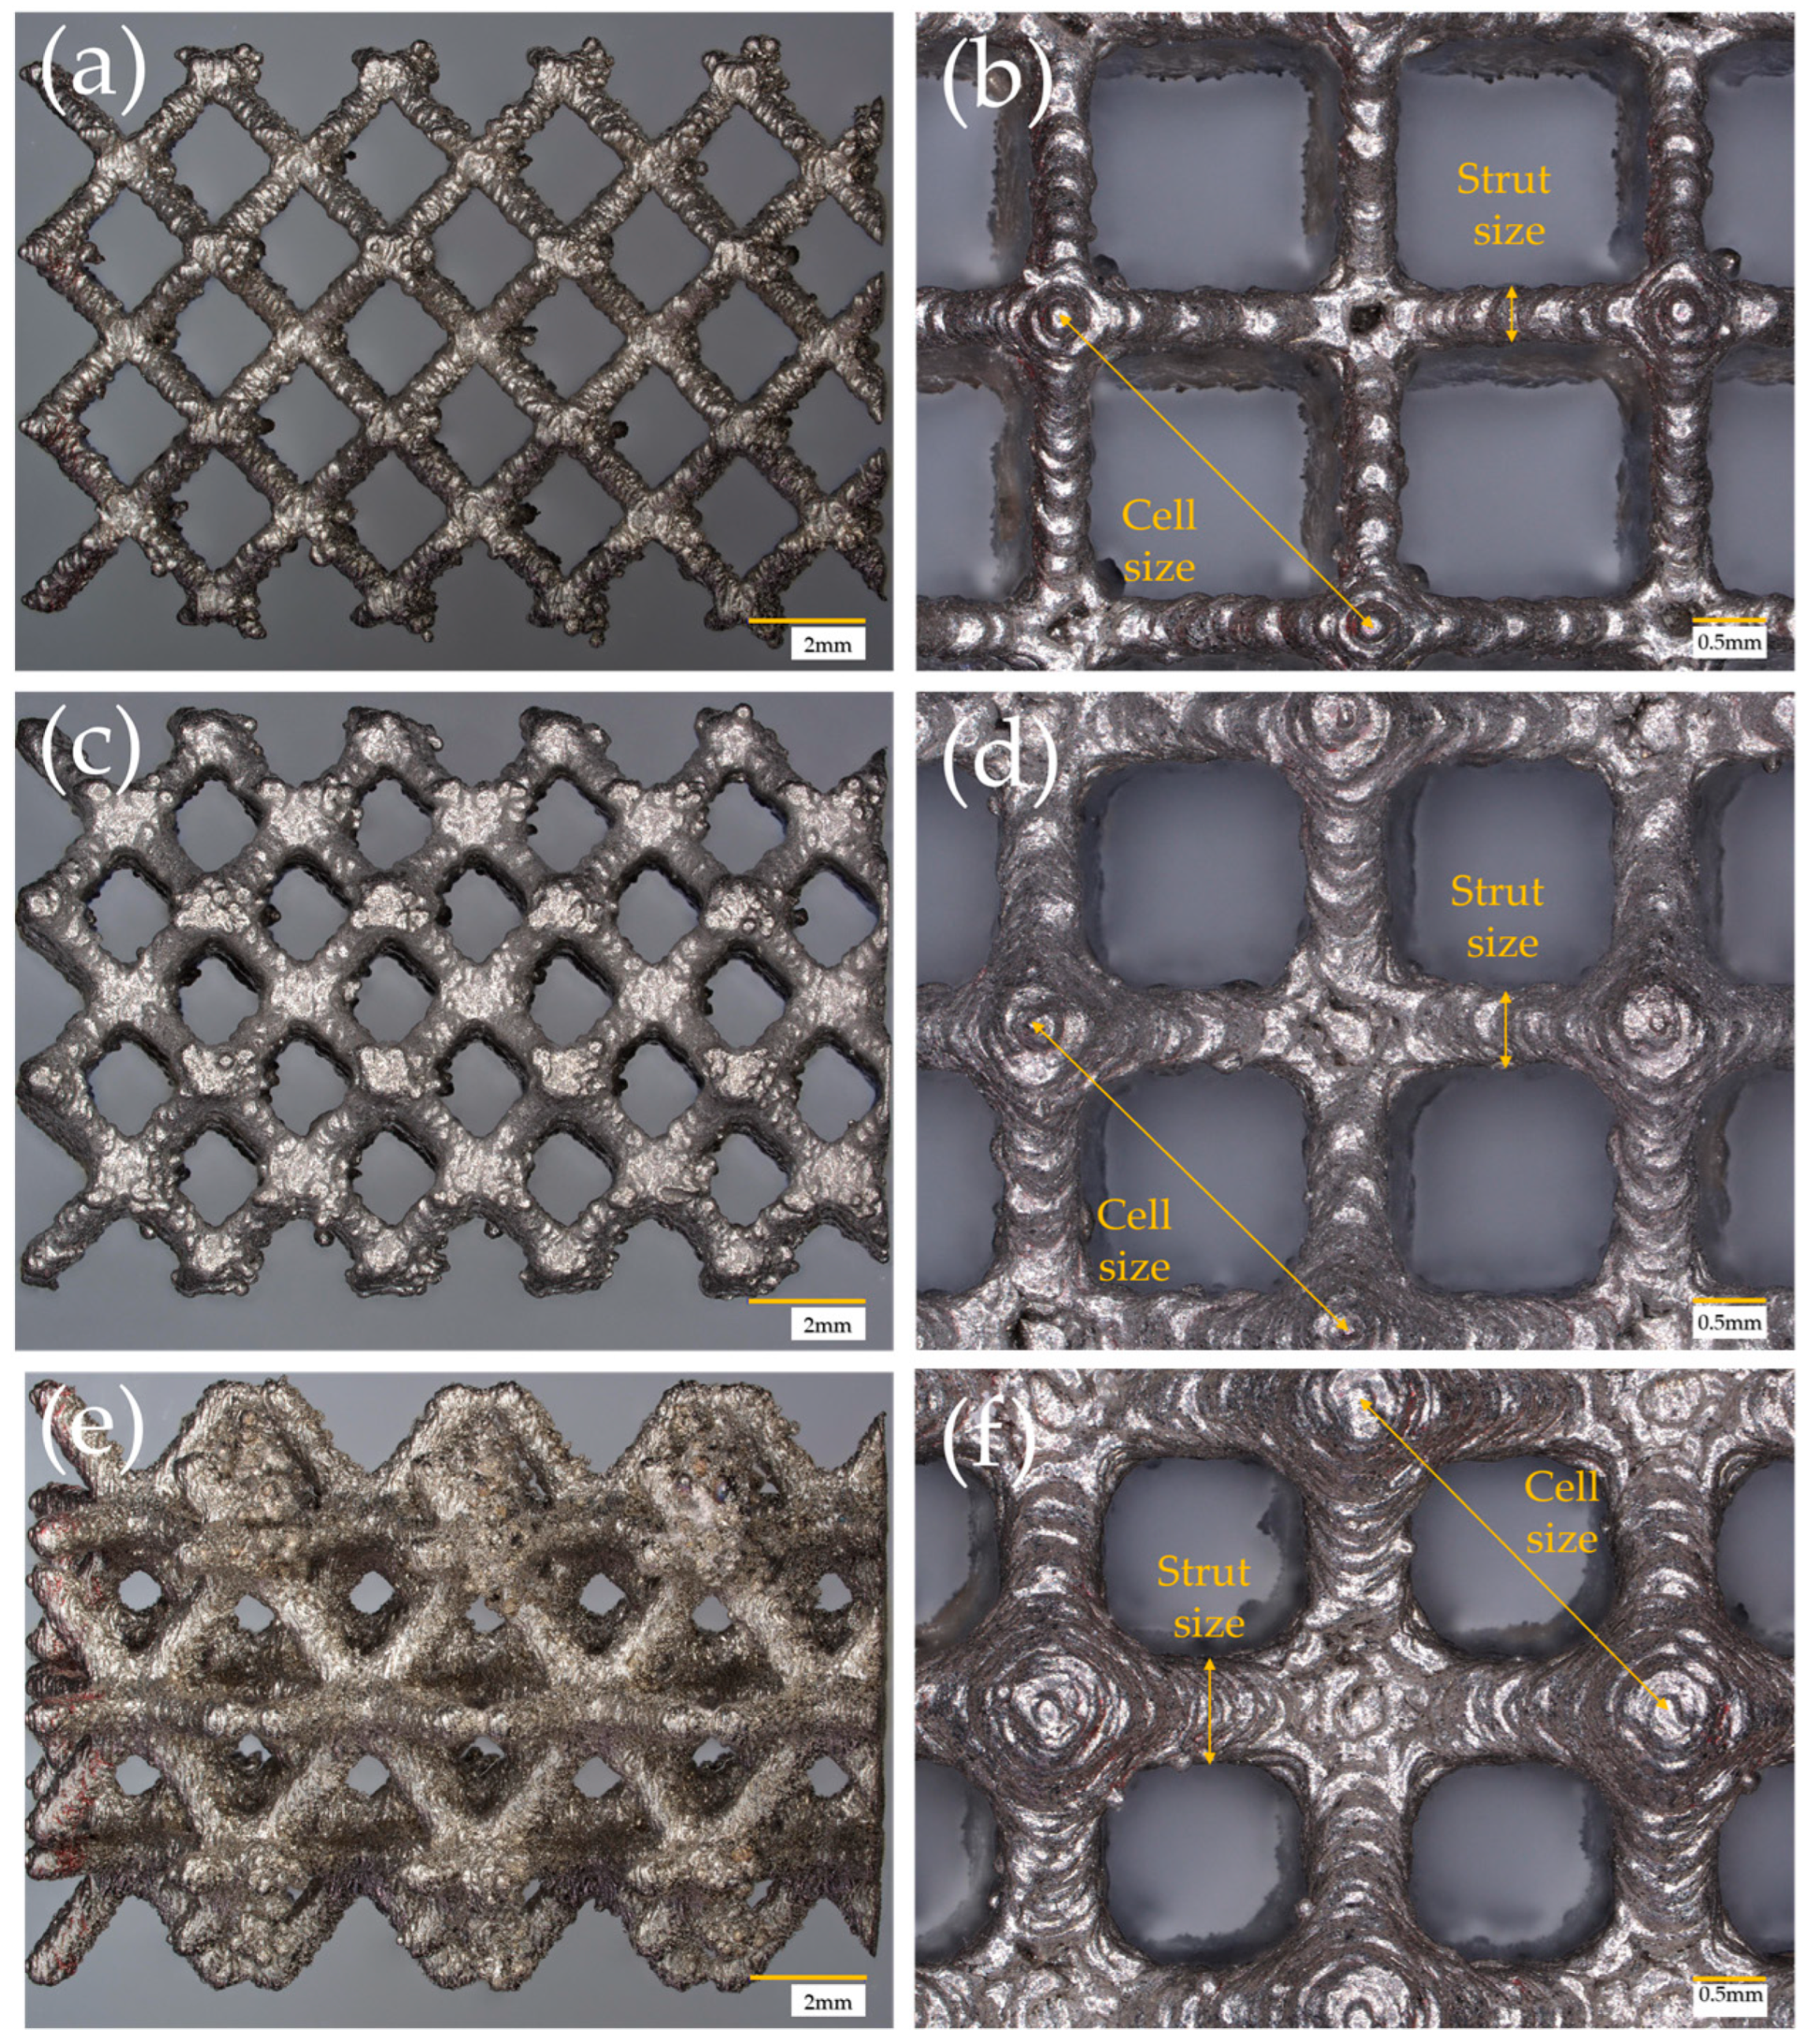
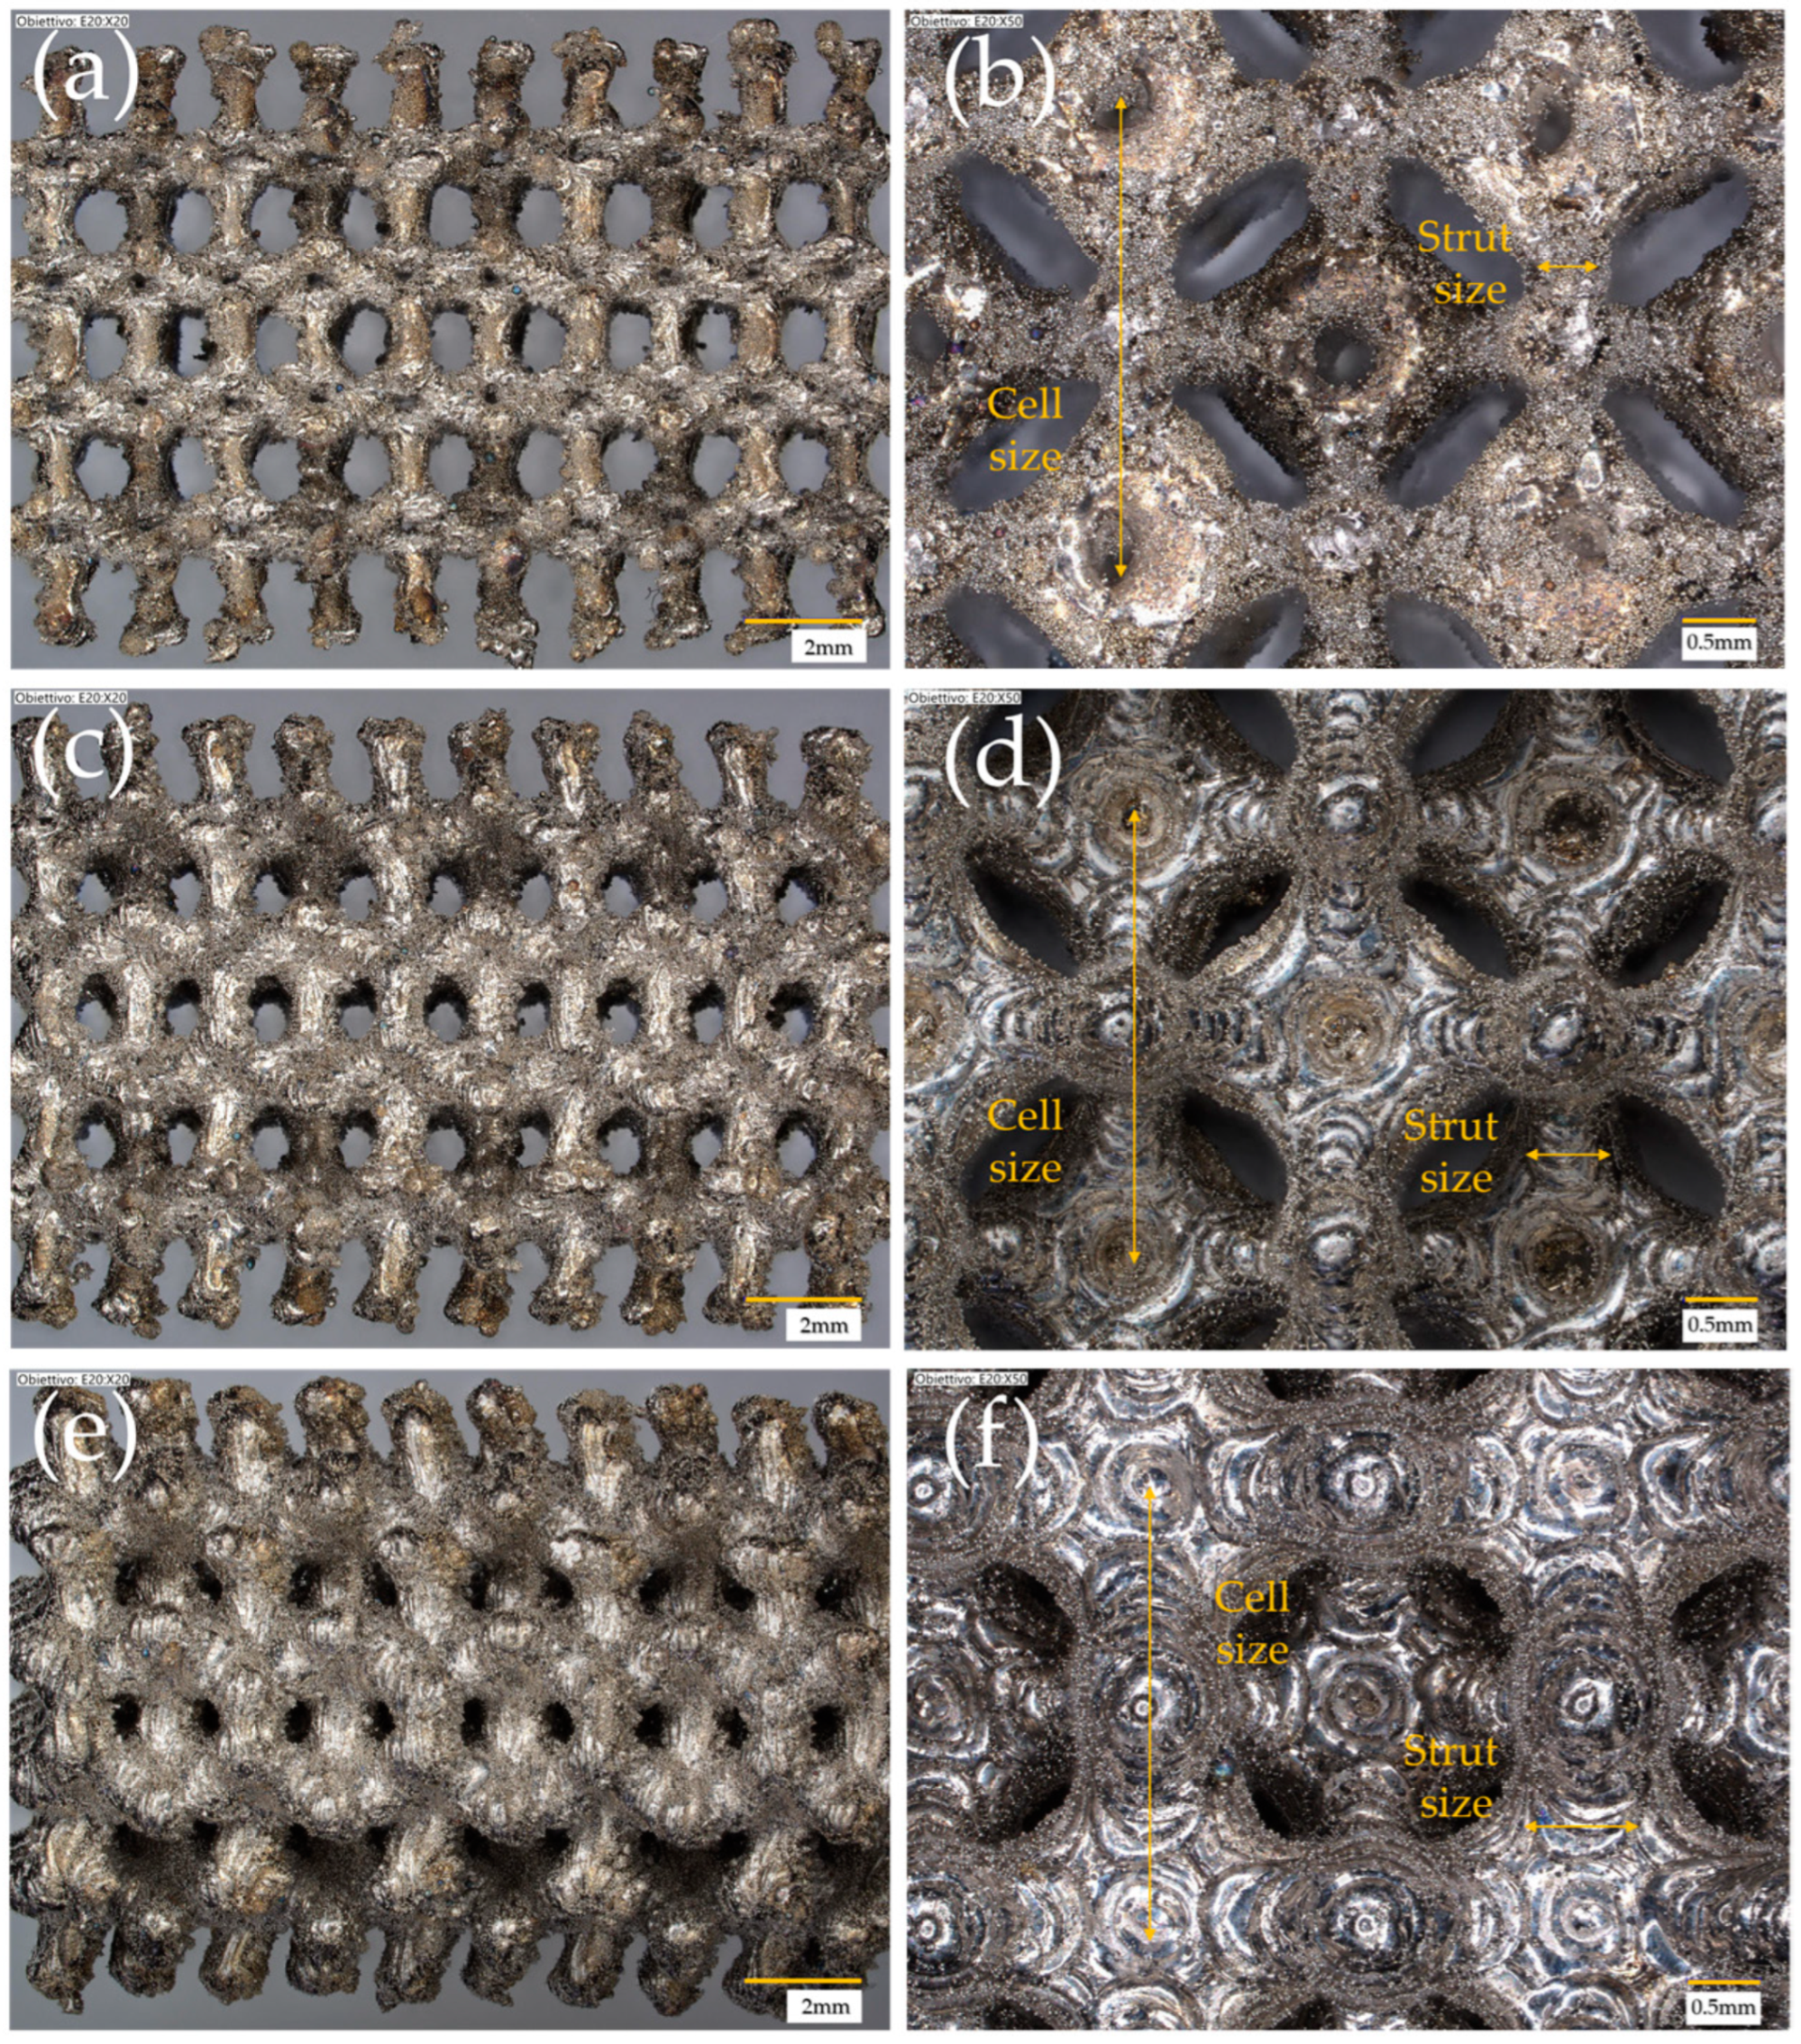
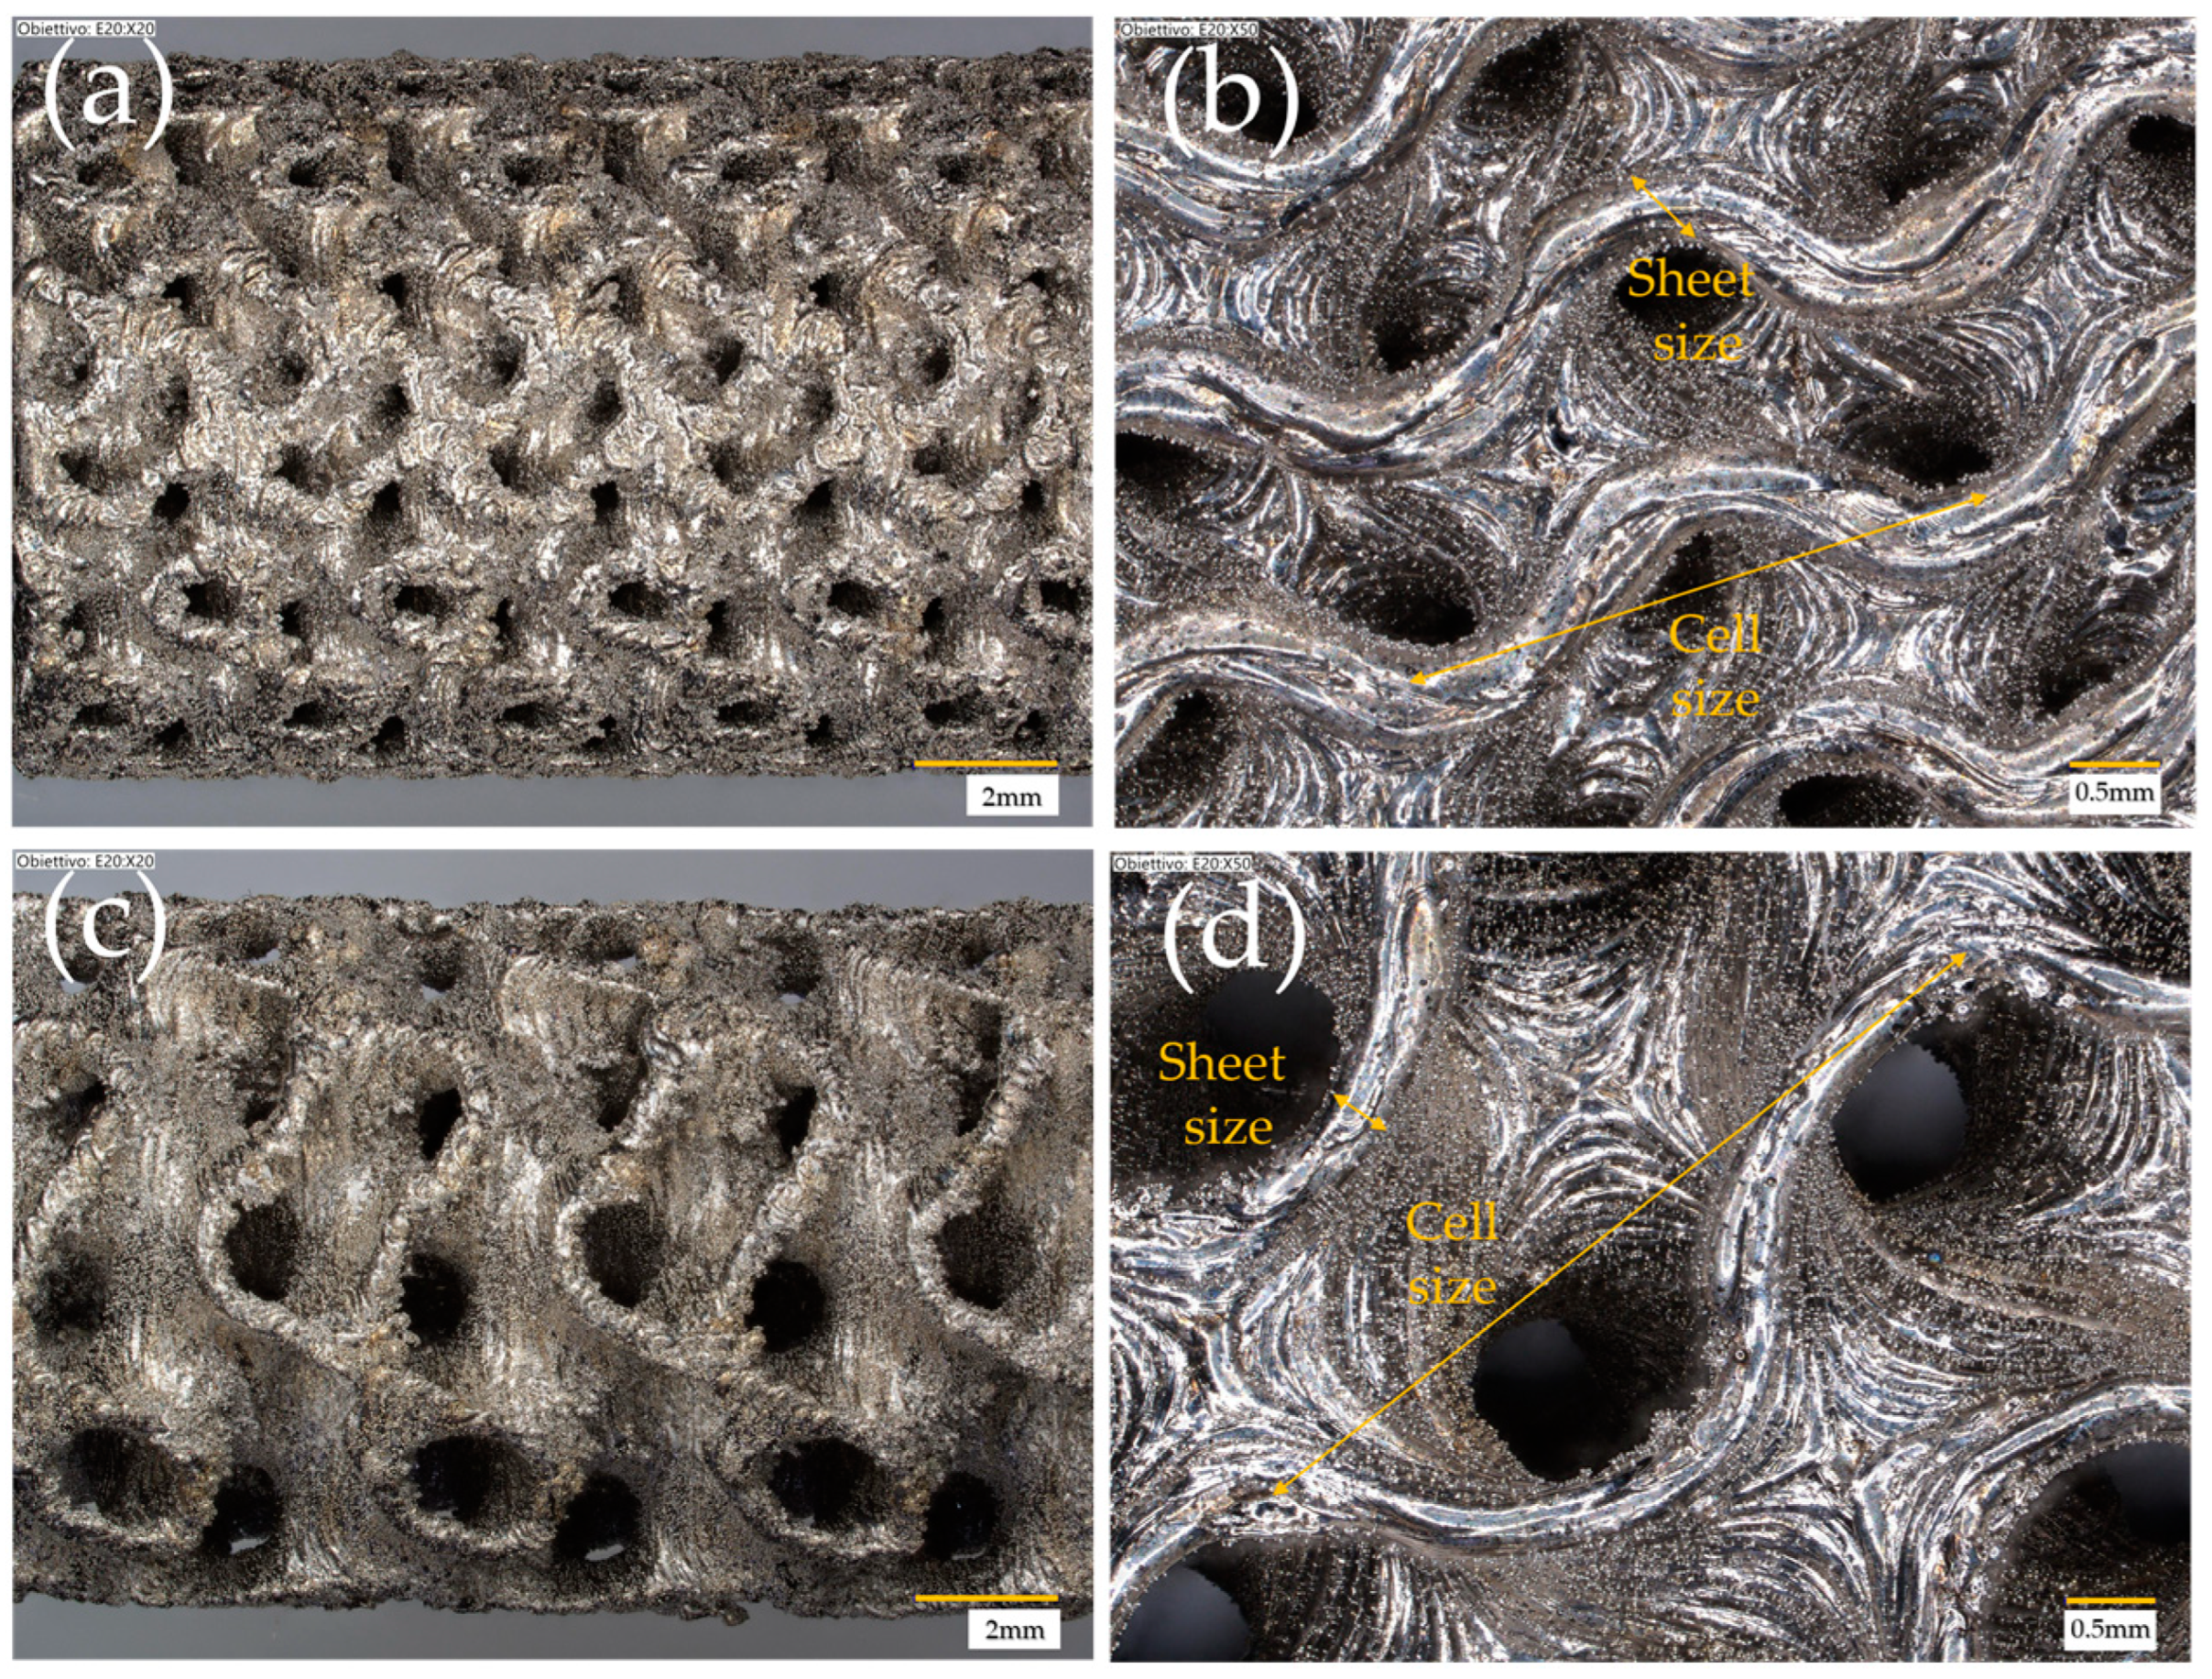
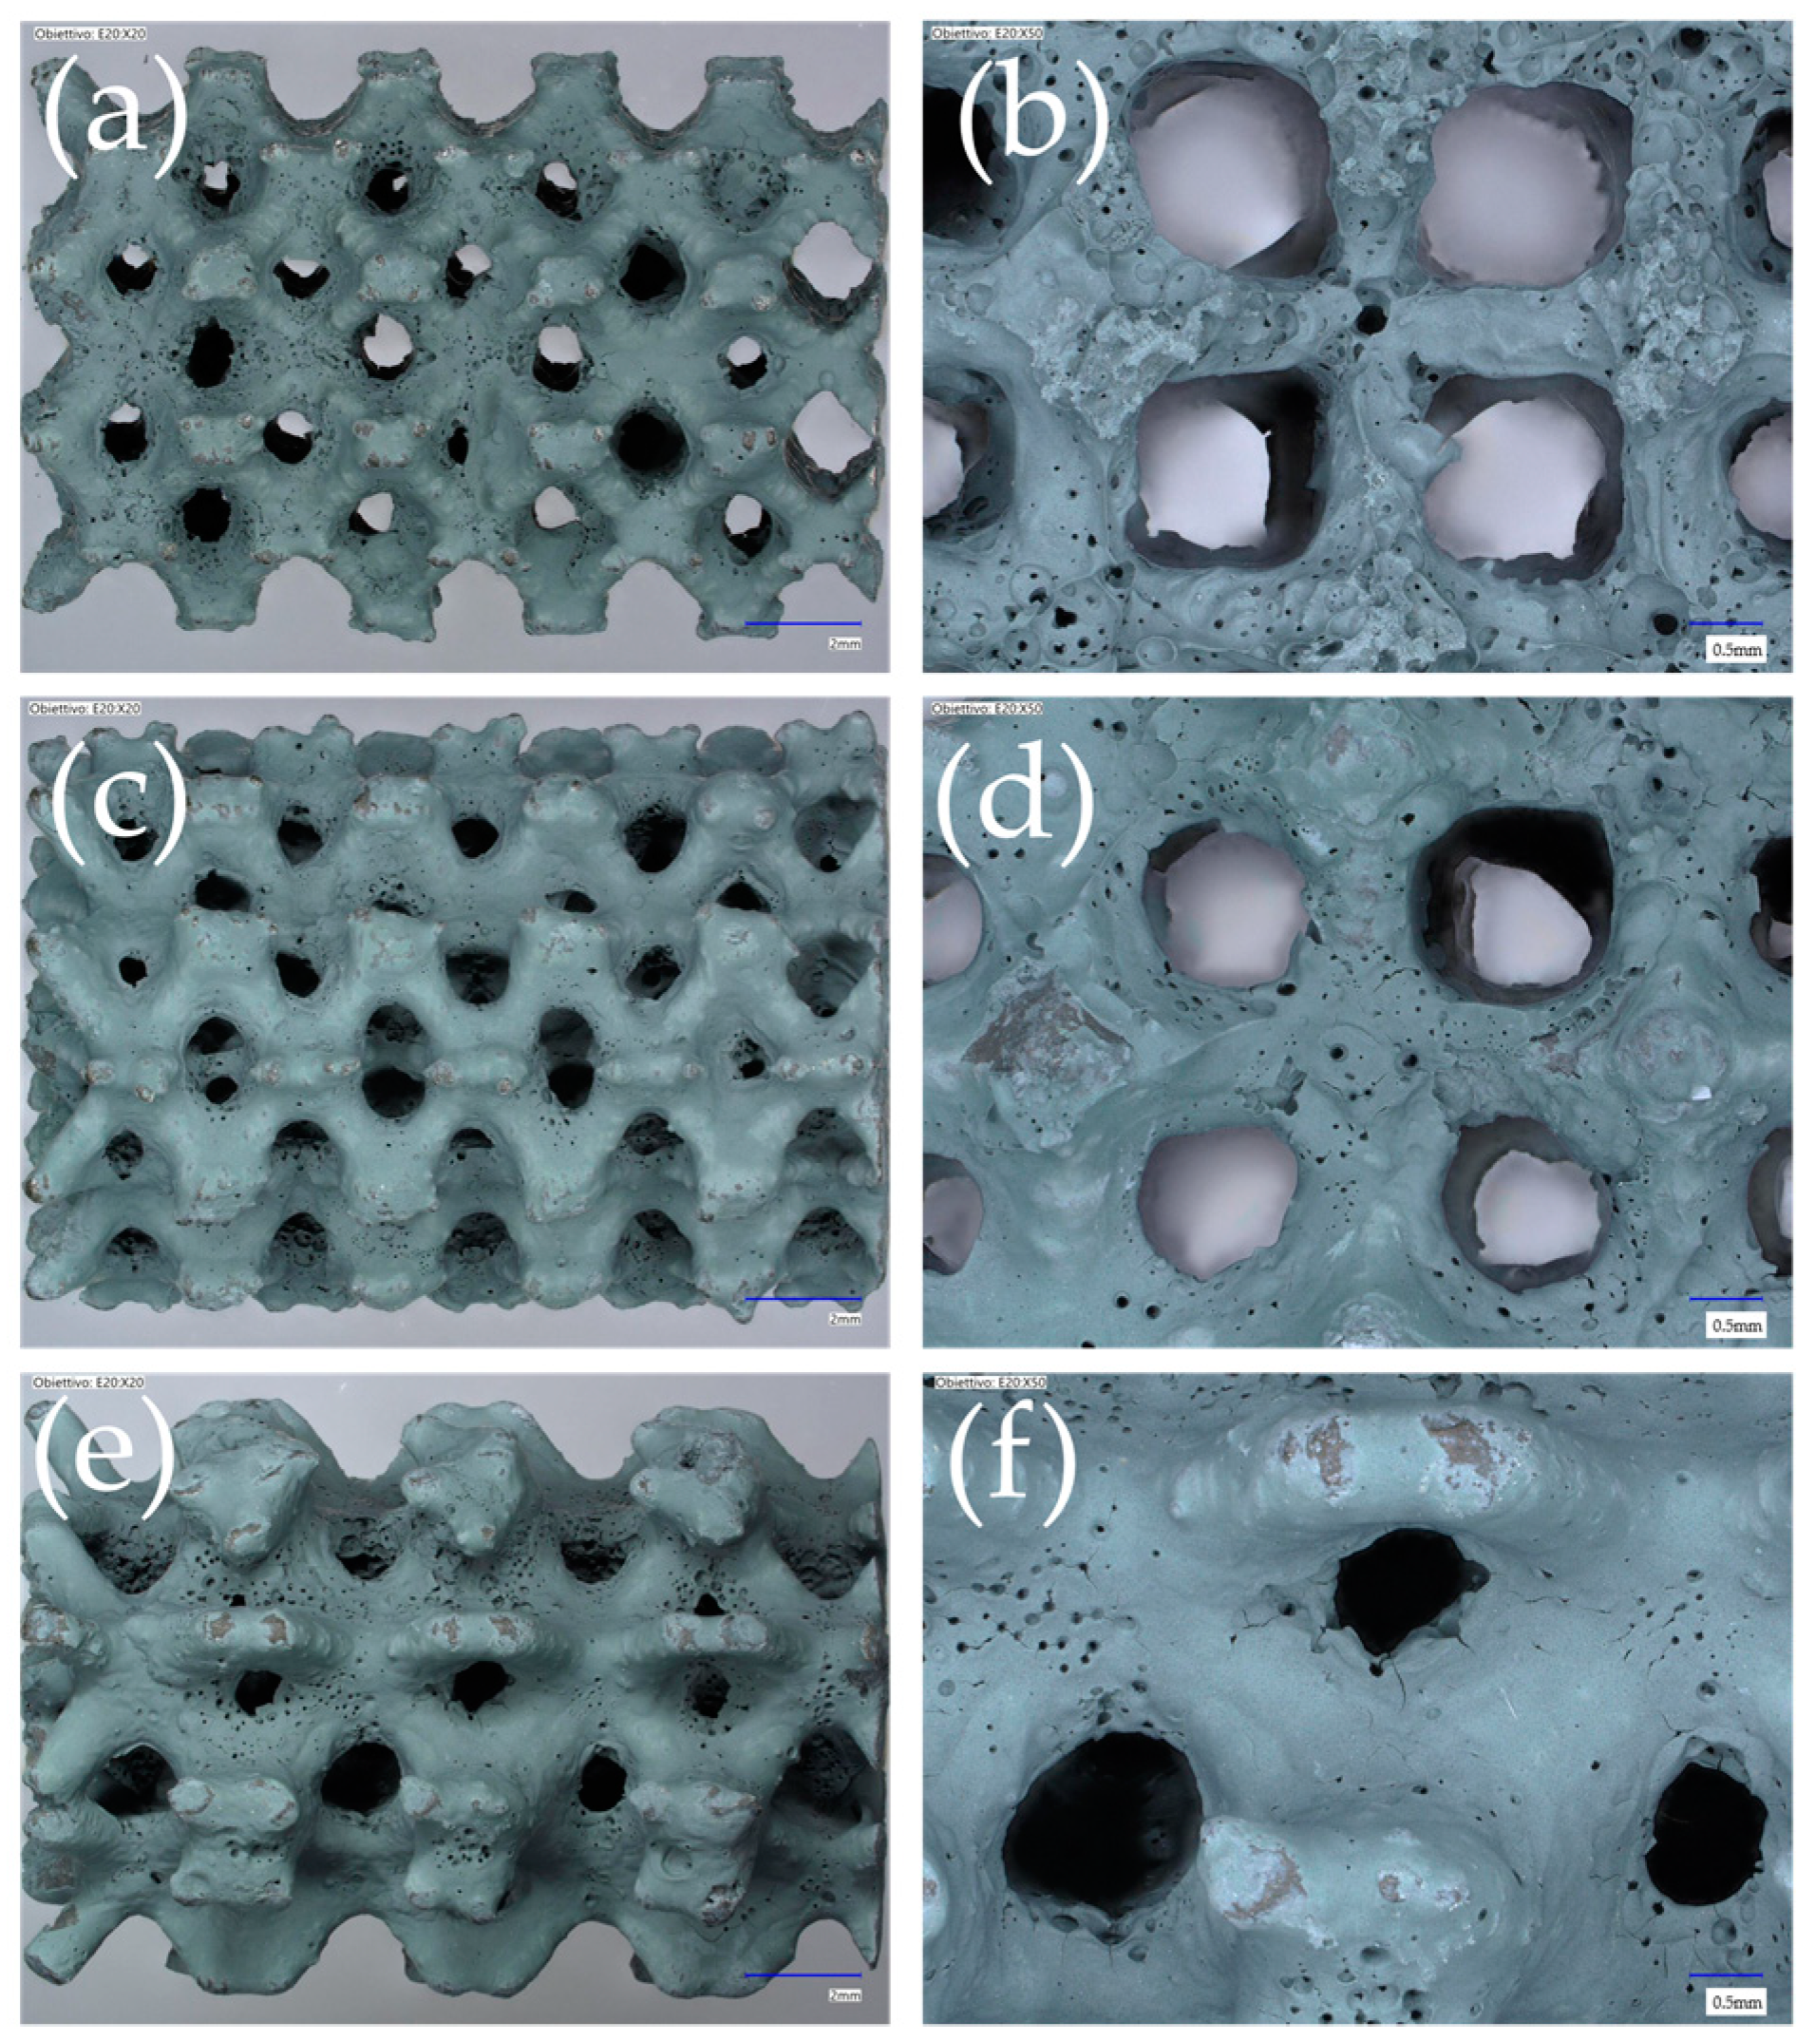
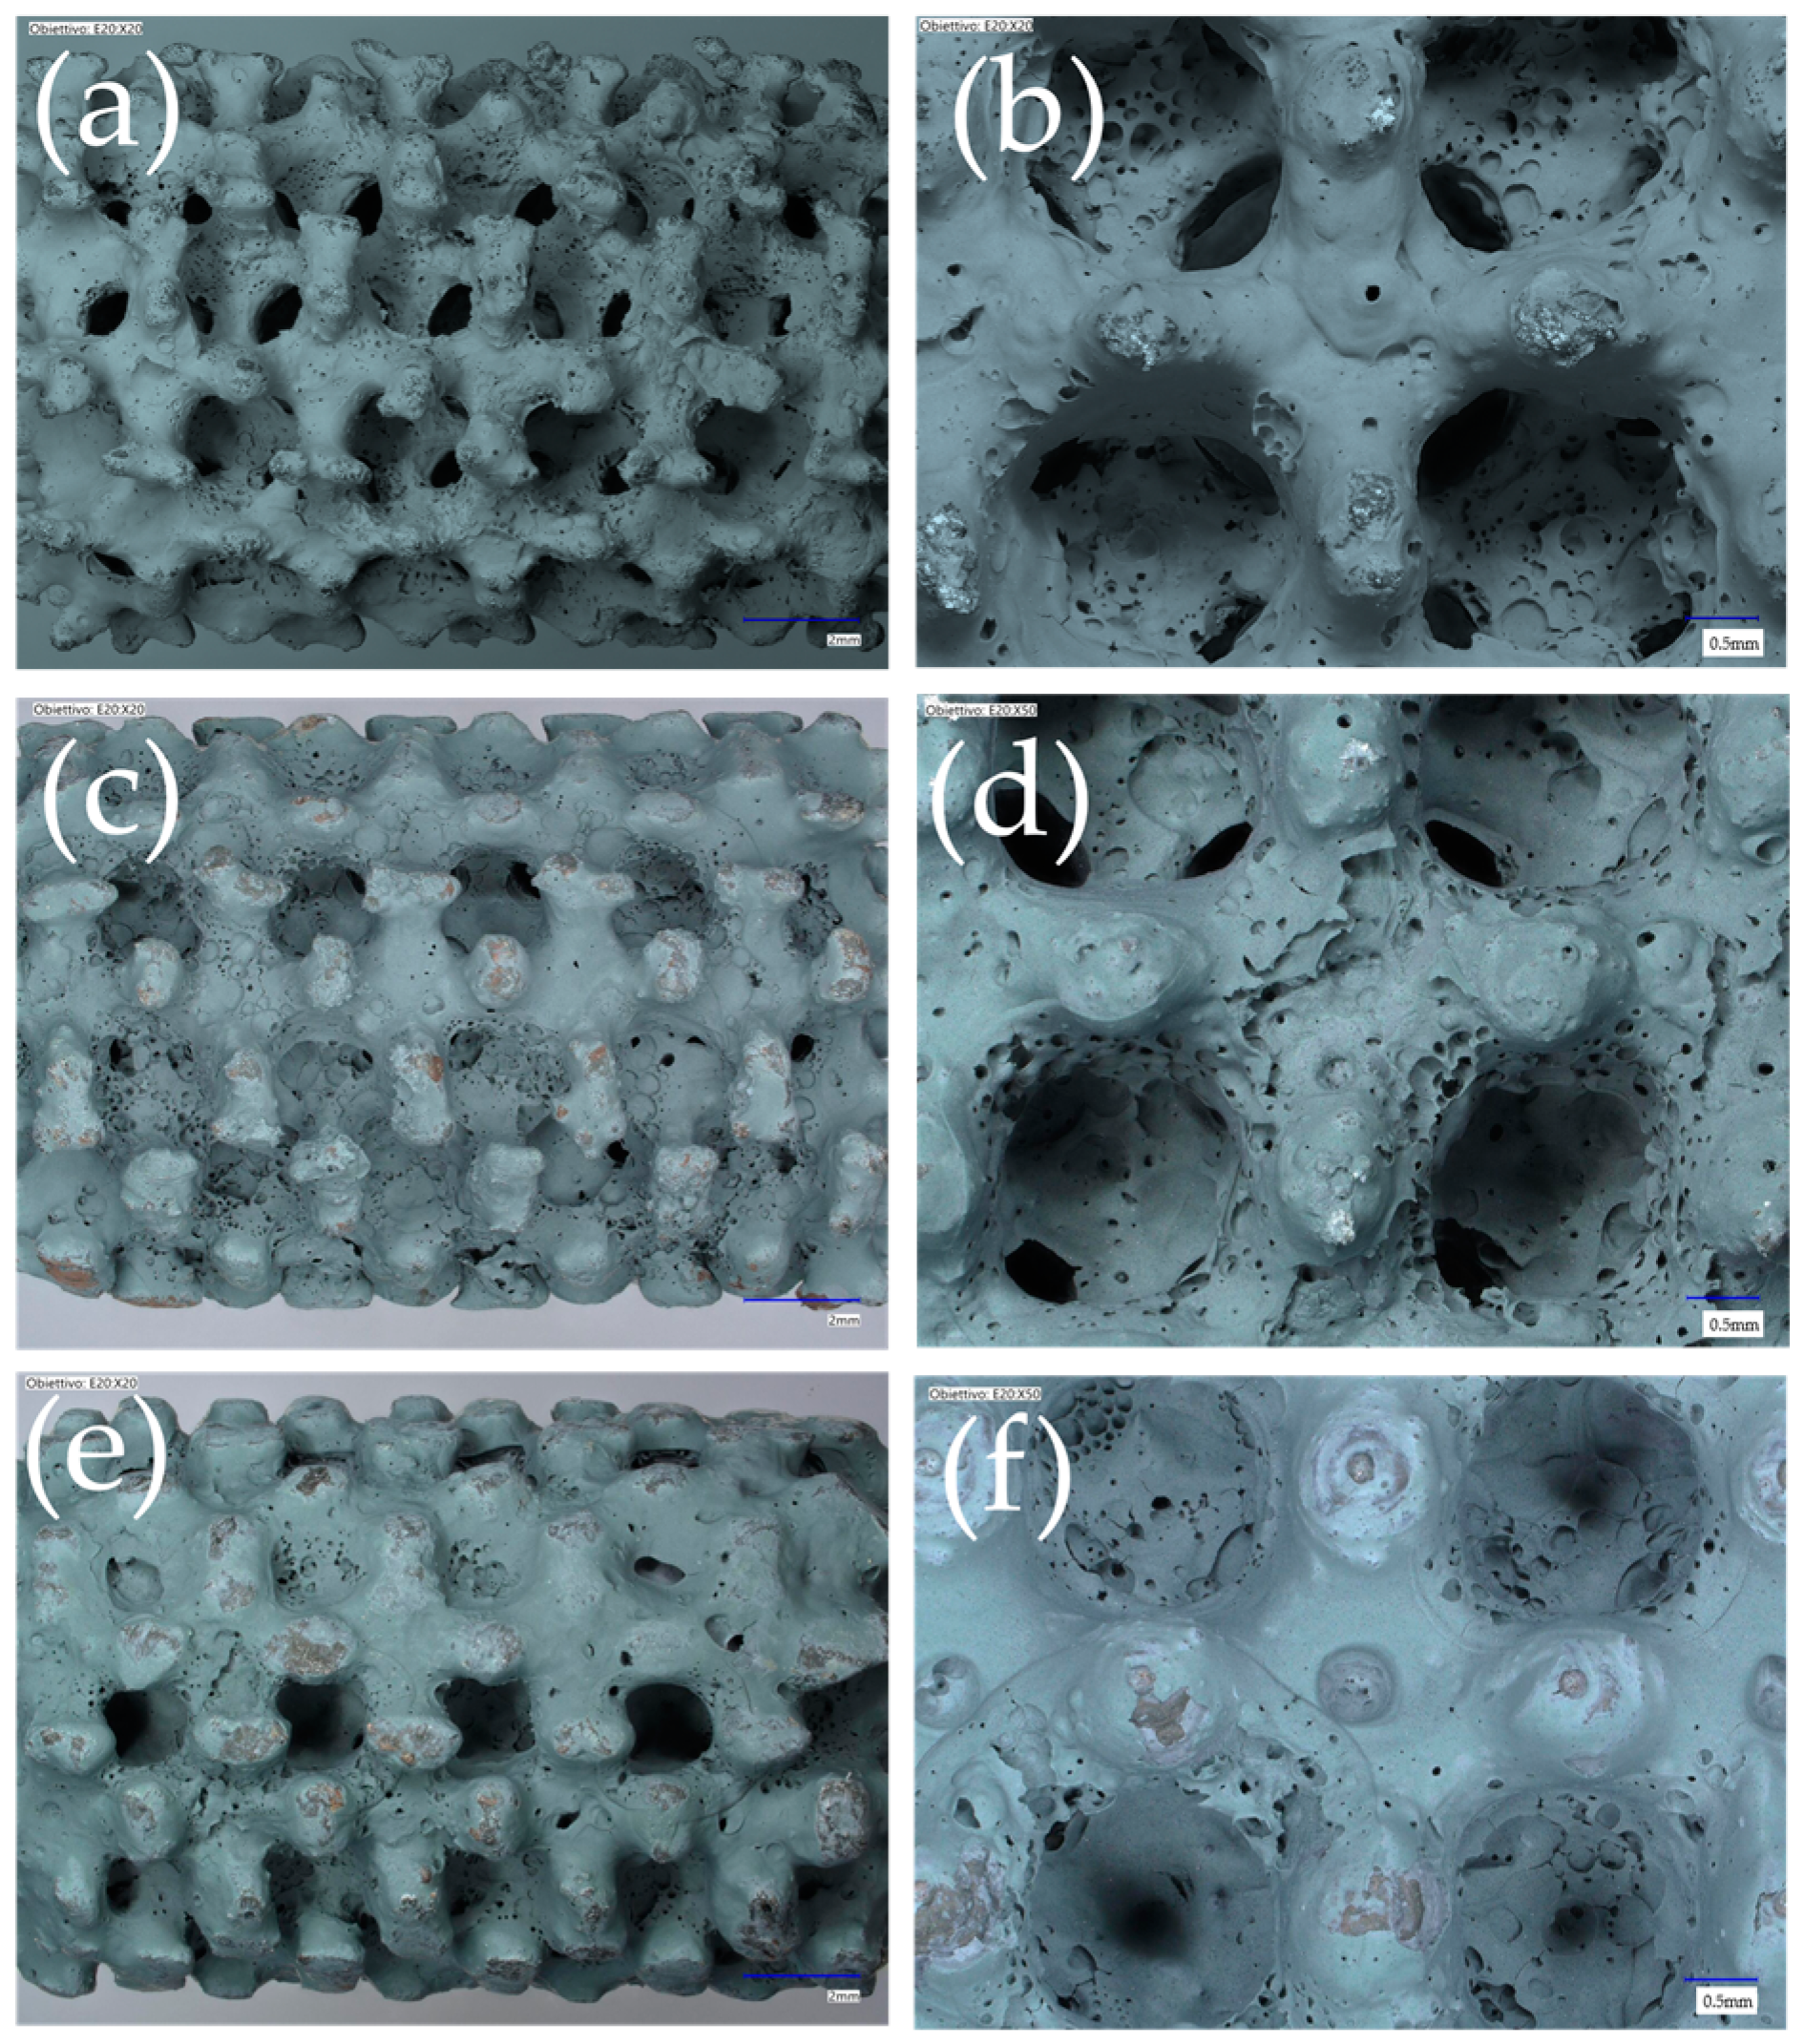
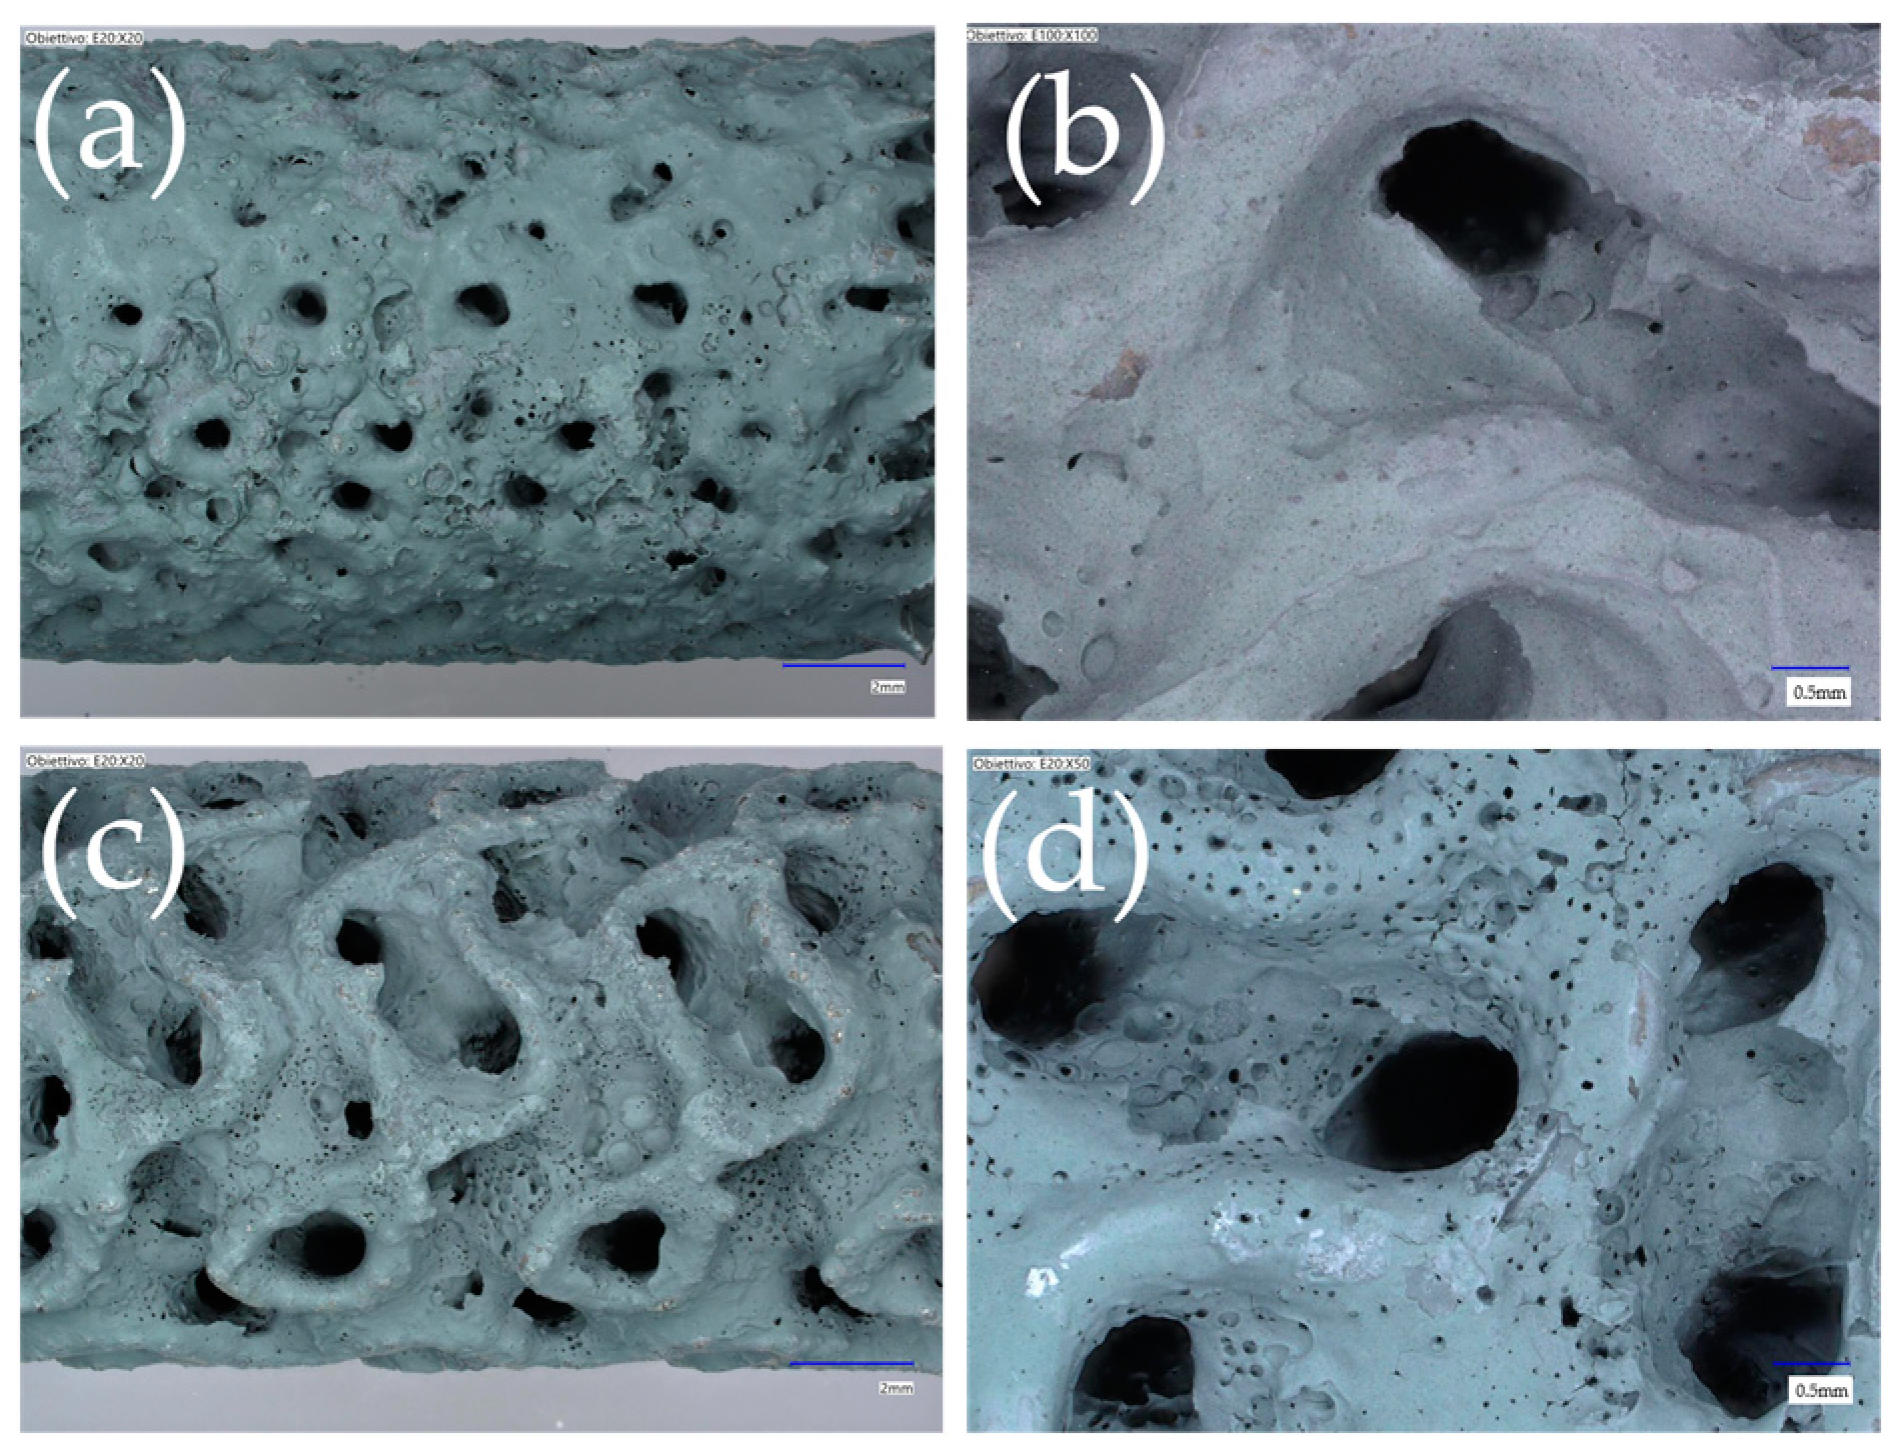
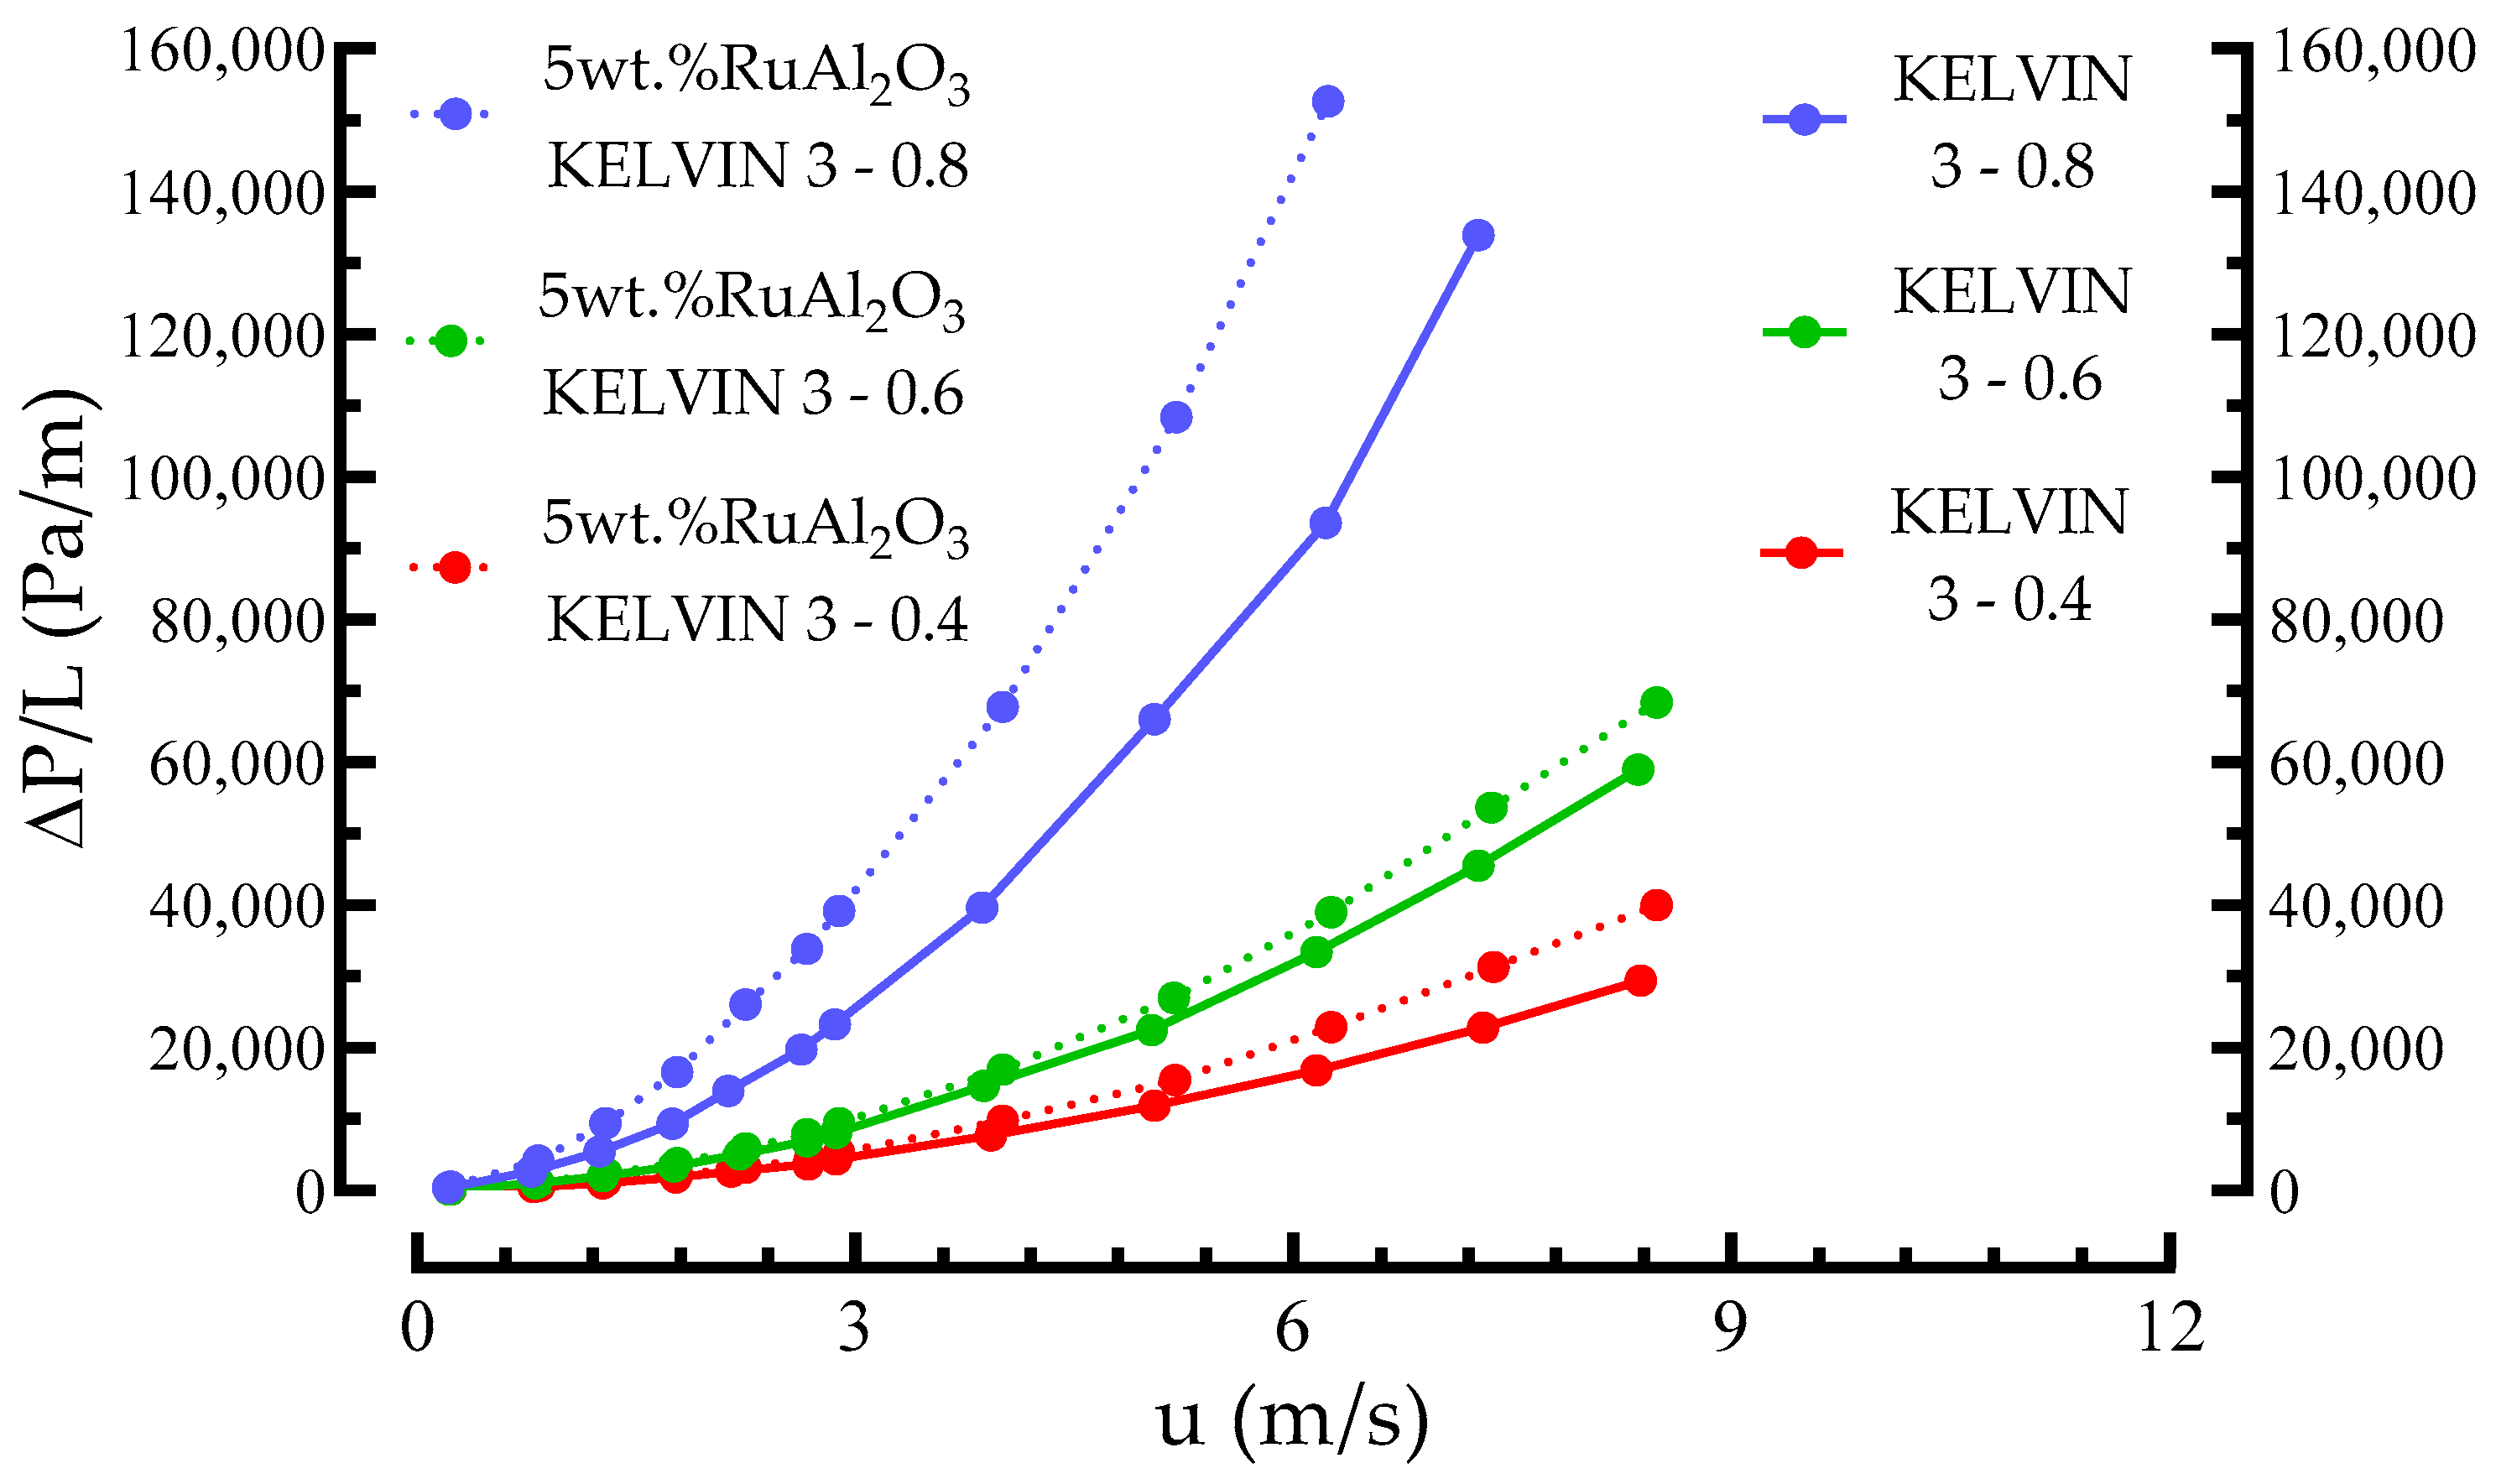
3.1. Morphology, Pressure Drop, and Mechanical Stability

As reported in Table 1, the BCC, Kelvin, and Gyroid supports were manufactured with the same cell sizes and strut diameters (except for the Gyroid with a cell and sheet size equal to 5 mm and 0.34 mm, respectively); however, the different geometry leads to differences in the resulting properties. Keeping the cell size and the strut diameters constant, the BCC samples show a lower solid volume with respect to the Kelvin samples. In contrast, the Gyroid samples showed the higher solid volume between the selected structures. This behavior influences the surface/solid volume ratio and, in turn, affects the porosity and pressure drop of bare and coated POCS. Indeed, comparing the properties of the samples reported in Table 1, the highest surface/solid volume ratio associated with the highest porosity is shown by the BCC 04 and Kelvin 04 samples. The other reported structures show values that are comparable in some cases. In particular, the Gyroid 0.34 structure is characterized by a surface/solid volume ratio equal to 59.22 cm2/cm3 associated with a calculated porosity of 72.40%; those values are comparable with the BCC 0.6 and Kelvin 0.6. In addition, the modification of cell size and strut diameter during the design phase of a structure with a selected geometry offers precise control over several crucial parameters, particularly solid volume, surface/solid volume ratio, and porosity, which play pivotal roles for the coating. As an example for all the supports reported in Table 1, some general correlations can be carried out, especially for BCC and Kelvin samples. Keeping the cell size constant at 3 mm, increasing the strut size results in a decrease in porosity and surface/solid volume ratio, and instead the solid volume increases. Higher porosities result in less material in the structure’s solid phase. The surface/solid volume ratio refers to the surface area per unit mass of a material. A higher surface/solid volume ratio generally provides more surface area for the coating to interact with, which, potentially, can enhance coating coverage and uniformity. Moreover, the decrease in porosity suggests less room for the coating to penetrate, which could lead to challenges in achieving uniform coating coverage. Overall, a washcoated homogeneity was observed for all the samples prepared, associated with the absence of relevant uncoated areas. The observed homogeneity of the coating across all samples is closely related to the spinning step at 1000 s−1. At this speed, the slurry experiences a reduction in viscosity due to shear-thinning behavior (Figure 4), allowing it to spread more uniformly over the surface of the structures. This decrease in viscosity ensures that the slurry penetrates even the smallest pores and covers the entire surface area effectively, minimizing the risk of uncoated areas. The centrifugal force generated during the spin coating process further aids in achieving a homogeneous coating by evenly distributing the slurry across the sample surface, leading to the high-quality, uniform coatings observed in this study. However, a partial occlusion phenomenon that results in a reduction of the pore sizes is present for the supports with the lowest surface/solid volume ratio and the higher strut size (Figure 5e,f, Figure 6e,f and Figure 7a,b). These properties are also critical for the pressure drop of bare and coated samples. Indeed, the highest pressure drop is shown by the sample with the lowest surface/solid volume ratio, lowest porosities, and highest solid volume (Figure 8, Figure 9 and Figure 10).
Several general correlations can be derived from the pressure drop results, which apply to any type of structure. From first and general observation the pressure drops decrease with an increase in porosity; this behavior aligns with typical trends in porous media flow. Other correlations can be made considering the cell size, the strut/sheet diameter, and the solid volume reported. Keeping the cell size constant, the pressure drop across the structure increases as the strut diameter increases. This is because the larger strut diameters offer less space for fluid flow, increasing the resistance to flow and resulting in a higher pressure drop. Regarding the Gyroid samples, as reported in Figure 10, some considerations can be made on the influence of the cell size. A smaller cell size means that the available pathways for fluid flow are more restricted and confined. This increased confinement results in higher resistance to fluid flow, leading to a higher pressure drop across the structure. In other words, the correlation highlights that decreasing the cell size results in a more intricate and restricted network of passages for the fluid, causing increased resistance and, consequently, a higher pressure drop. Based on the obtained results, comparing the different geometries studied (BCC, Kelvin, and GYROID), the Gyroid-based supports showed a higher pressure drop with respect to the other structures. Compared to the POCS, the Gyroid samples are characterized by a higher solid volume and tend to have lower porosity, features that negatively affect the pressure drop. Moreover, the Gyroid has a continuous, triply periodic minimal surface (TPMS) structure with intricate, curved surfaces that create a more tortuous flow path. This complex geometry increases resistance to fluid flow, causing a higher pressure drop as fluids must navigate through the numerous twists and turns of the surface. In contrast, the BCC samples showed the lowest pressure drop compared to the other geometries studied. This result is related to the more open geometry of the BCCs and to the related higher porosities, as reported in Table 1. In addition, the comparison between bare and coated samples allows to isolate the coating effect on flow resistance. The Figure 8, Figure 9 and Figure 10 highlight that the increase in pressure drop is more pronounced for samples with a lower surface/solid volume ratio and larger strut sizes in which a partial occlusion of the pores was observed. The partial occlusion results in a slight reduction in the pore size of the supports, which further restricts gas flow through the structure. This narrowing effect contributes to the increased pressure drop observed. This trend indicates that these geometries, with reduced accessible pore space, experience higher flow resistance due to partial occlusion, which directly impacts gas diffusion. The mechanical stability of the different coated samples seems not particularly affected by the above-mentioned properties; indeed, the weight loss of the coated layer (evaluated through an accelerated stress test in an ultrasound bath) is between 1% and 2% with respect to the amount of catalyst loaded.

3.2. Catalytic Activity

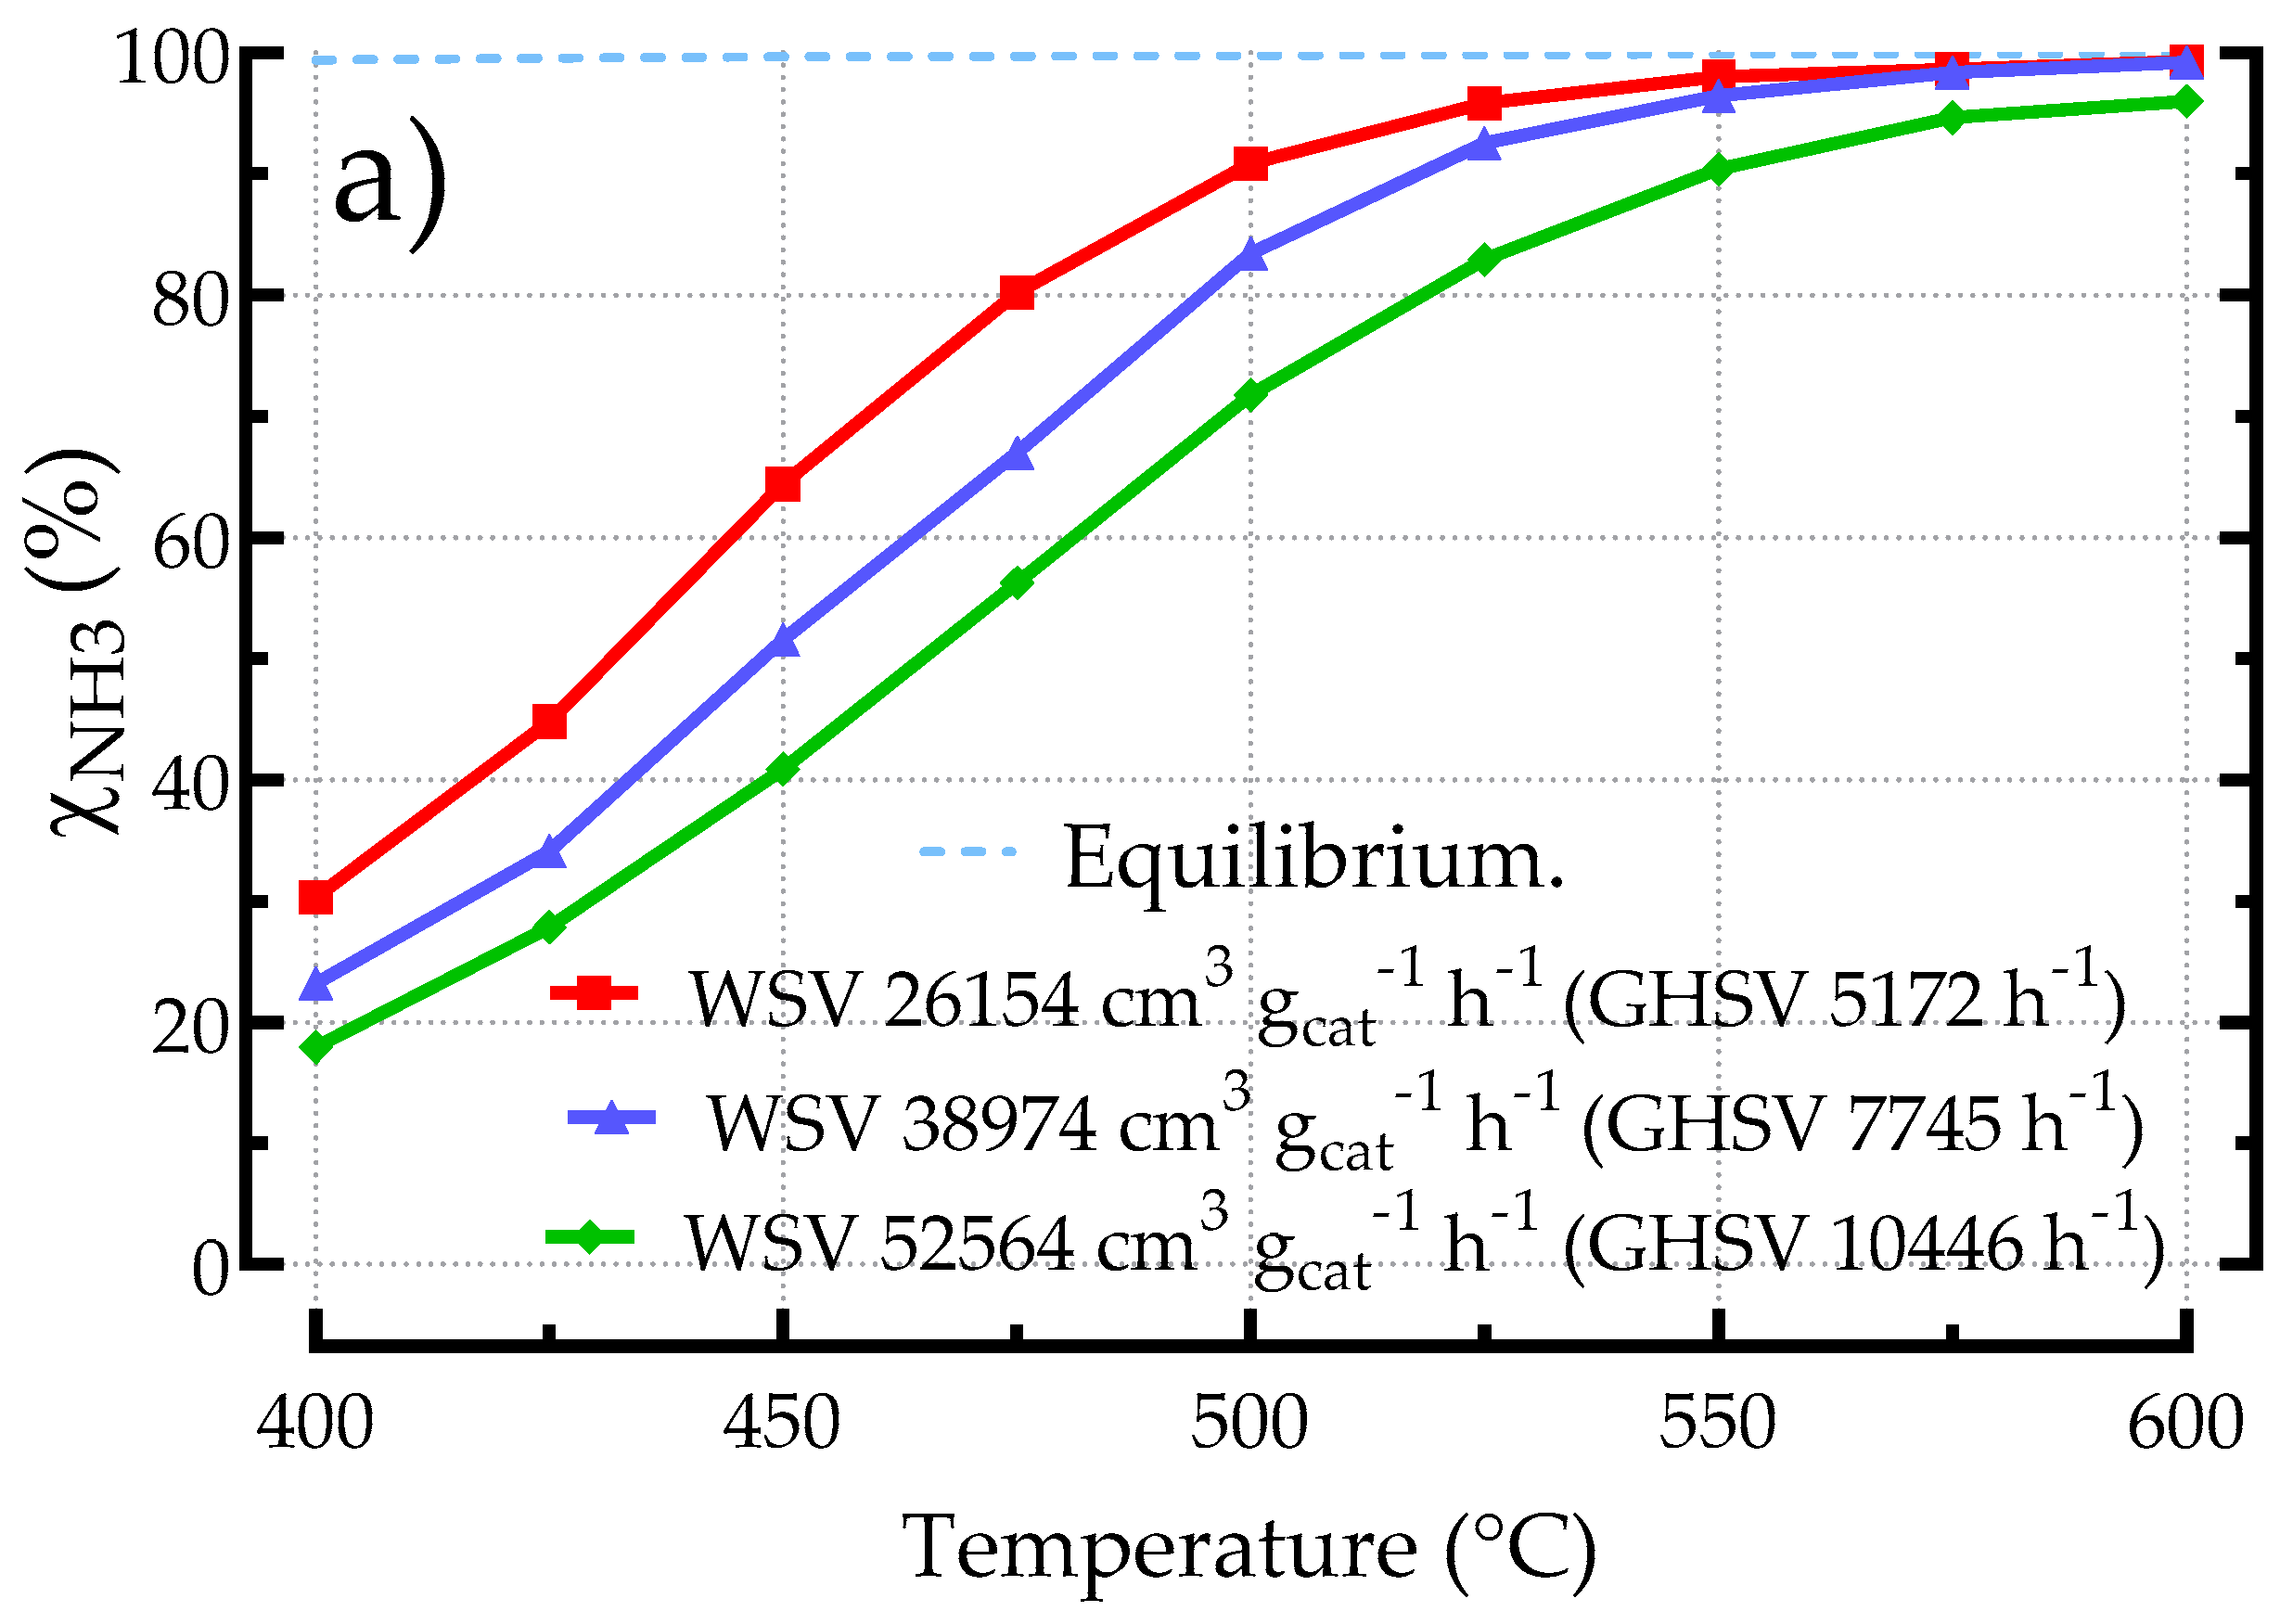
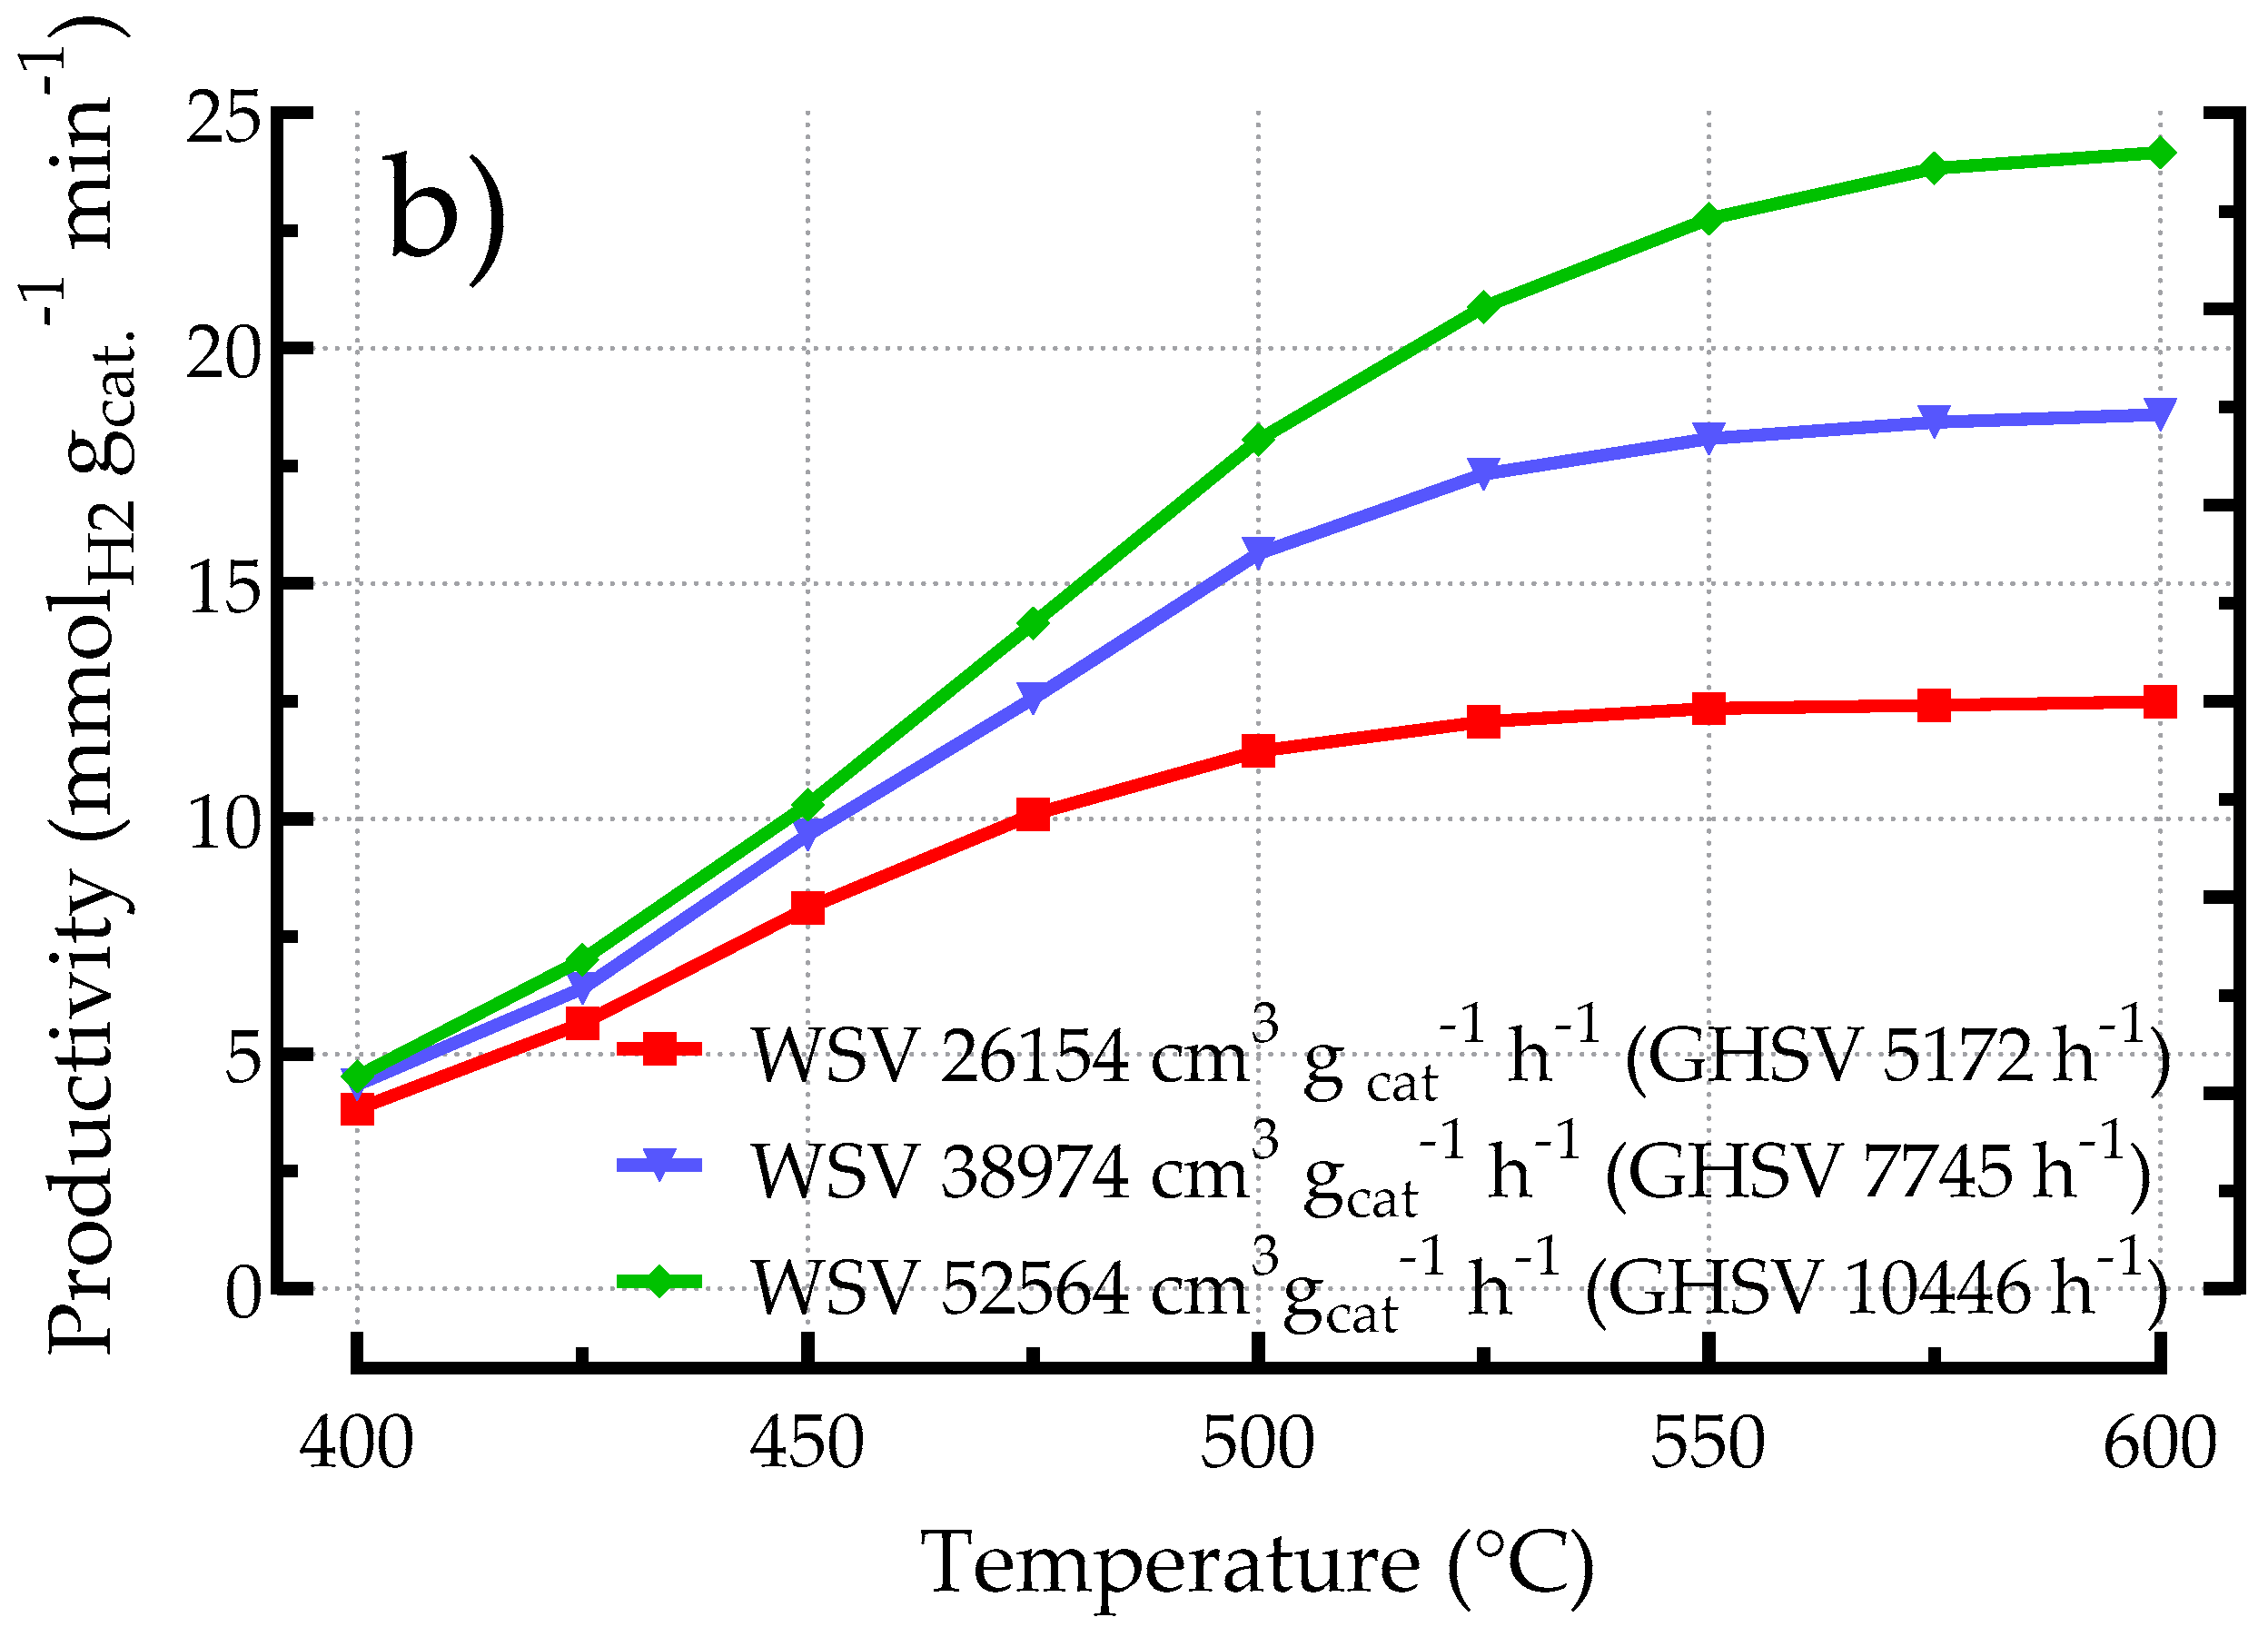
3.2.1. Influence of Space Velocity on the Performances of Kelvin-Based POCS

The influence of reagents’ flow rate (102, 152, 205 cm3 min−1) on the ammonia decomposition has been studied with the Kelvin-based POCS with cell size 3 mm and strut diameter 0.6 mm activated by the 5 wt% Ru/Al2O3. The results are reported in Figure 11a,b.
The better performances in terms of ammonia conversion were carried out at the lowest WSV (26,154 cm3gcat−1 h−1) investigated; in these conditions, the ammonia is almost totally converted, reaching 99.27% at 600 °C. However, the highest productivity (24.17 mmol H2⋅gcat−1 min−1) was obtained with a WSV equal to 52,564 cm3gcat−1 h−1 (GHSV = 10,446 h−1) at 600 °C with a conversion equal to 96.02%. At low temperatures (400–425 °C), the negative effect of the short contact time is balanced by the increase in productivity due to the high flow rate of the reagents. As a result, the rates of hydrogen formation are similar for all the WSV investigated, ranging from a minimum of 3.82 mmol H2⋅gcat−1 min−1 registered at the lowest WSV (at 400 °C) to a maximum of 7 mmol H2⋅gcat−1 min−1 obtained at 425 °C with the highest WSV. The effect of temperature and WSV starts to become more relevant in terms of conversion and productivity in the range between 475 °C and 500 °C. Indeed, the ammonia conversion increased from 56.28% (T = 475 °C, WSV = 52,564 cm3gcat−1 h−1) to 90.88% (T = 500 °C, WSV = 26,154 cm3gcat−1 h−1); in contrast, the associated H2 rate increased from a minimum of 10.10 mmol H2⋅gcat−1⋅min−1 obtained at the lowest WSV (at 475 °C) to 18.06 mmol H2⋅gcat−1⋅min−1 registered at 500 °C and at the highest WSV investigated.

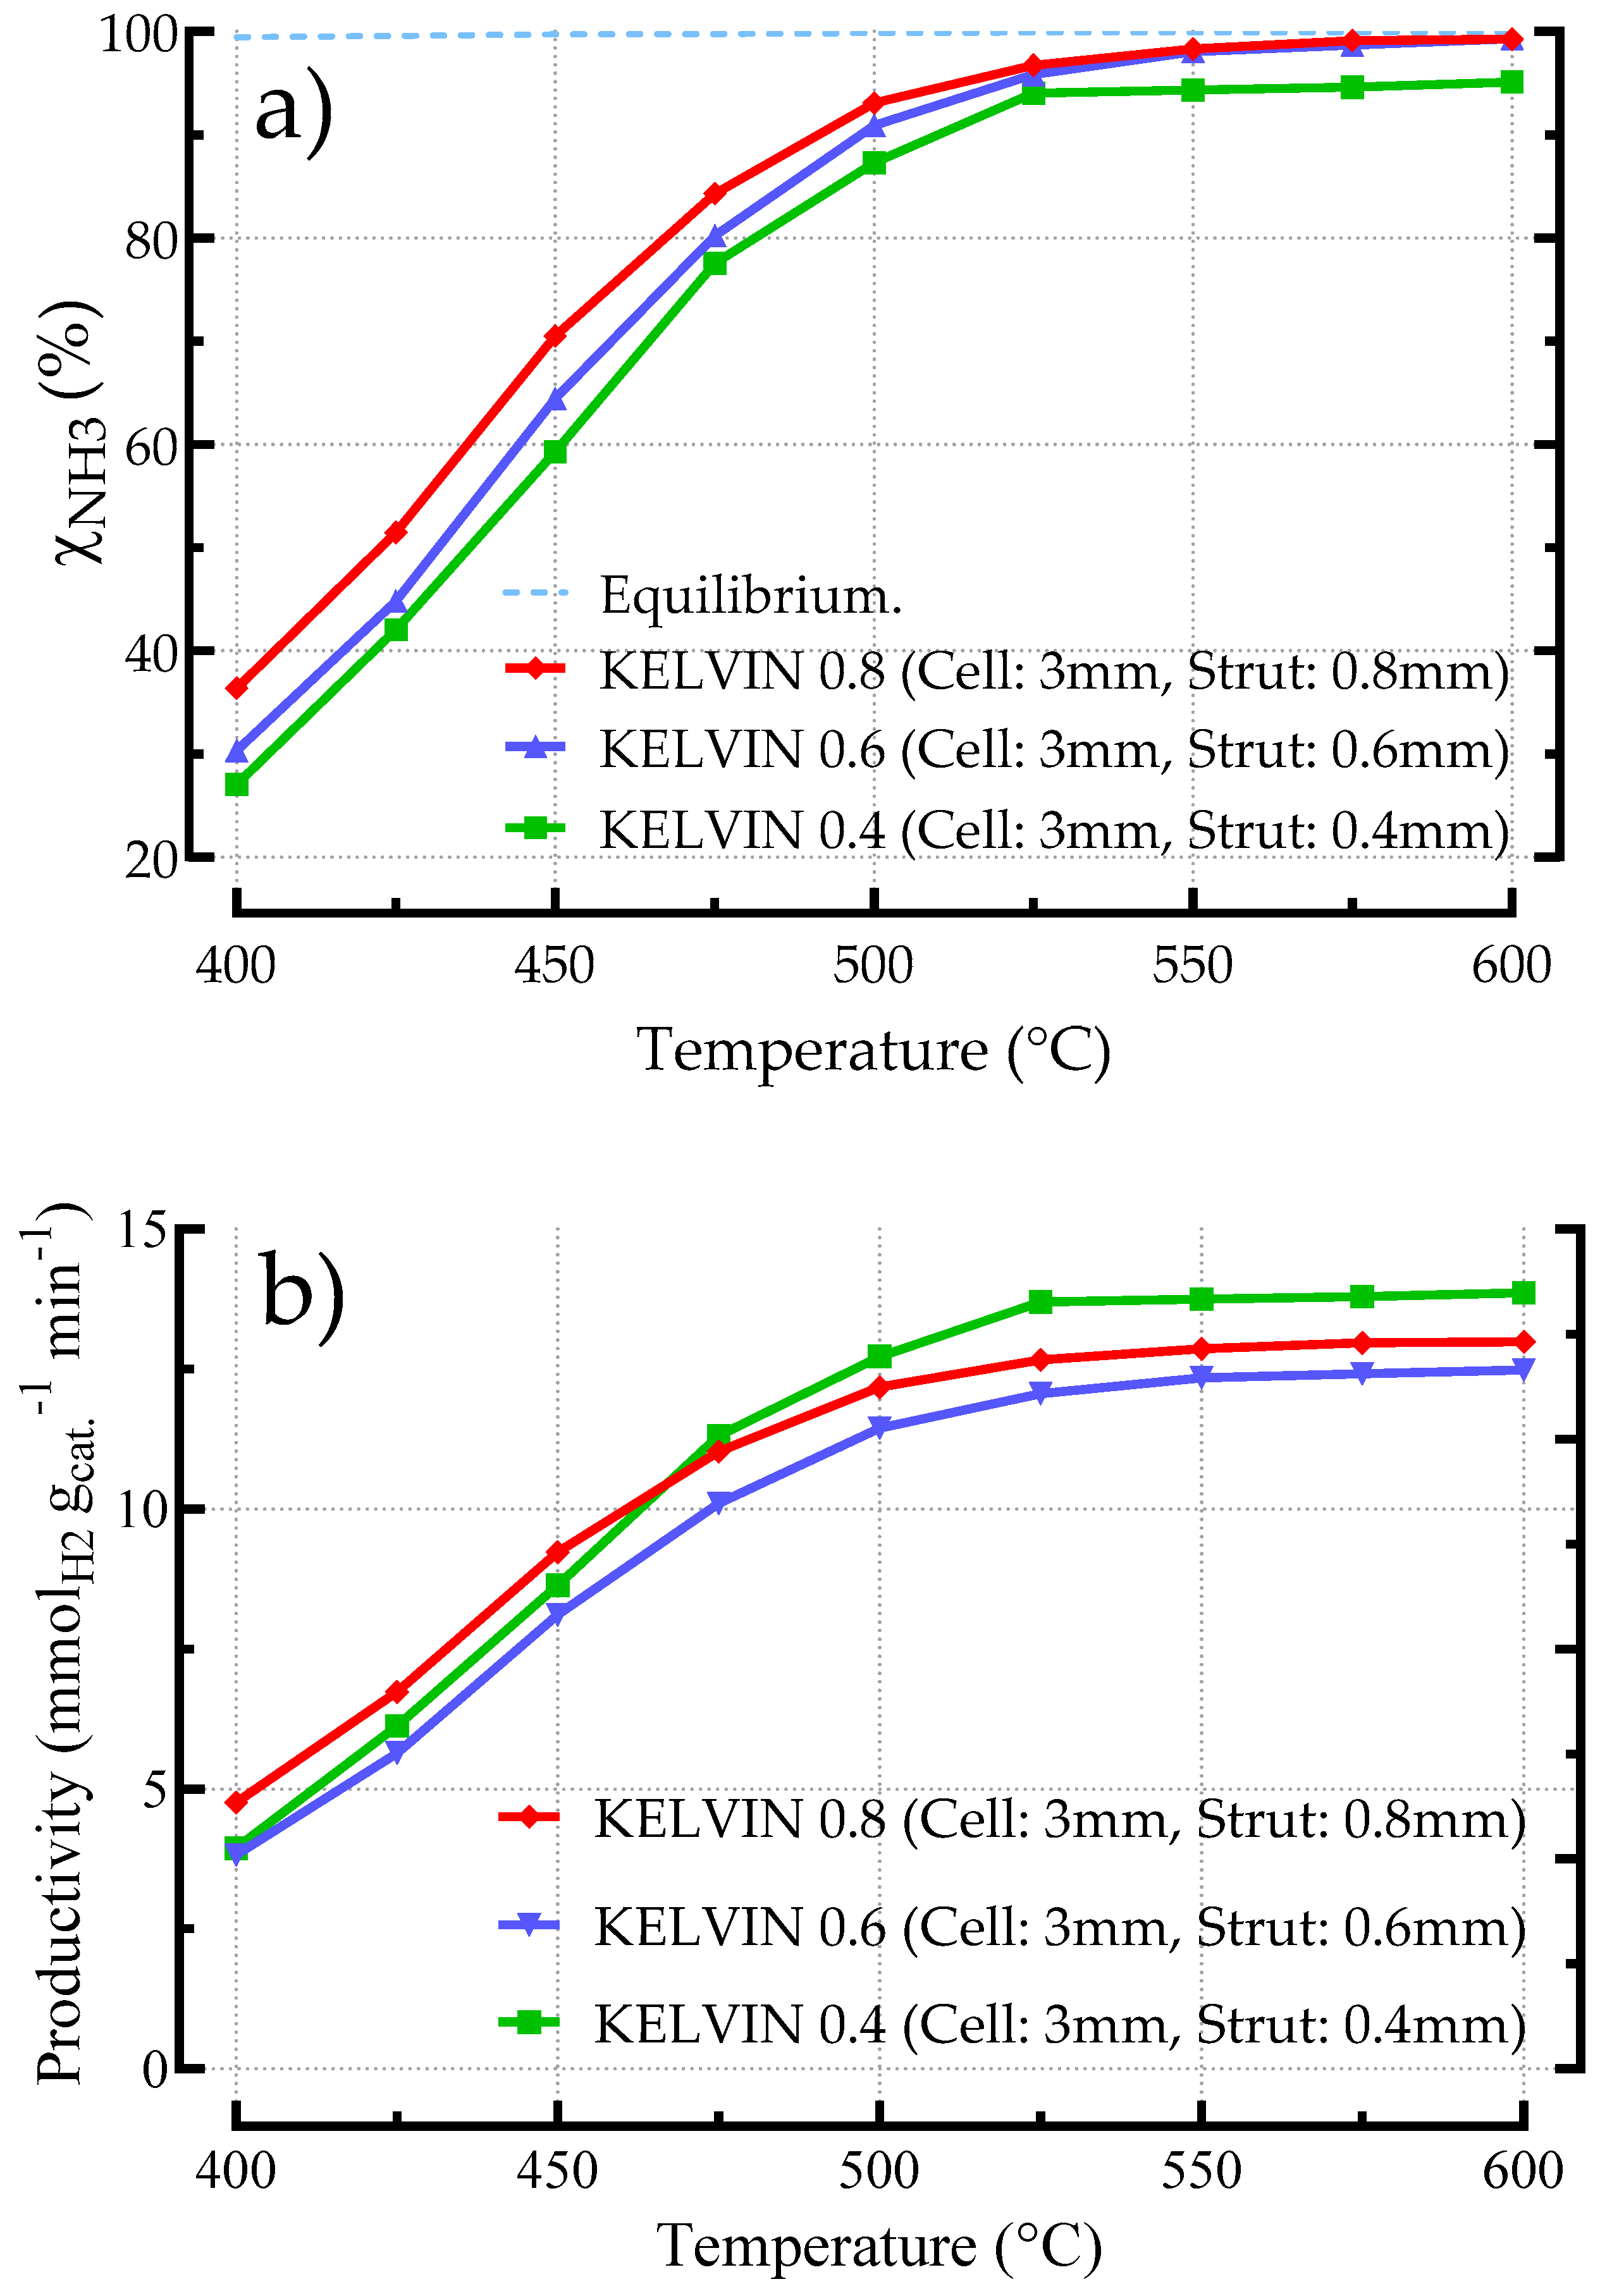
3.2.2. Influence of Geometric Features on the Performances of Kelvin-Based Catalyst

In Figure 12, the performances of Kelvin POCSs manufactured with the same cell size (3 mm) and different strut diameters (0.4, 0.6, and 0.8 mm) are reported and compared. Comparing the results, it seems that the geometry slightly influences catalytic activity. In particular, the best performances in the temperature range between 400 and 500 °C, in terms of ammonia conversion were obtained by the POCS with the larger strut size (0.8 mm). For the Kelvin 0.8 sample, the ammonia conversion increased from 36.39% to 99.25%, increasing the temperature from 400 to 600 °C. The lowest activity between the Kelvin-based catalysts studied was obtained with the Kelvin 0.4 sample; the NH3 conversion varied from 27.05% (400 °C) to 95.08% (600 °C). Medium values were shown by the Kelvin 0.6. At high temperatures (550–600 °C), the difference between the different structured catalysts is reduced. We must specify that the sample with the lower strut diameter (0.4 mm, green line in Figure 12) also has a lower catalyst loading than the others. This behavior suggests that at lower temperatures, the catalytic activity is more sensitive to the amount of catalyst loaded, as the reaction kinetics are slower and rely more heavily on the available active sites. On the other hand, the low amount of catalyst for the Kelvin 0.4 contributes to calculating a slightly higher productivity with respect to the one calculated for the other samples. Indeed, as reported in Figure 12b, the Kelvin 0.4 sample showed the highest H2 rates (12.72–13.86 mmol H2⋅gcat−1⋅min−1) in the temperature range (500–600 °C) in which the catalyst is more active. In the same temperature range, the Kelvin 0.8 sample has shown a H2 rate that increases from 12.18 mmol H2⋅gcat−1⋅min−1 to 12.99 mmol H2⋅gcat−1⋅min−1. A correlation between these results and the properties (SSA, porosity, etc.) of the Kelvin POCSs yields insight into the underlying relationships. As reported in Table 1, increasing the strut size results in a decrease in porosity and SSA, instead of the solid volume increase. This could influence the deposition of the coated layer. The POCS catalysts with a lower SSA and lower porosity provide less space for the slurry to penetrate and less metallic surface to interact with, resulting in an increase in the thickness of the catalytic layer and eventually in a partial pores occlusion or pores size reduction.
Regarding the pore’s occlusion, the images registered (Figure 6) with the digital optical microscope show a reduction of the pore size and not a complete clogging phenomenon, especially for the samples with large strut size (Kelvin 0.8). A theoretical calculation of the layer thickness can be made based on some models reported in the literature [29,31] together with experimental results and geometric properties of the POCS. A quick method for estimating the layer thickness is the differential weighing of the POCS samples both before and after layer deposition/calcination. By using the following equation, the resulting coating mass (mcatalyst) can be converted to a corresponding catalytic layer thickness.
C a t a l y s t   T h i c k n e s s = m c a t a l y s t S S A P O C S × V P O C S × d l a y e r
where mcatalyst = mass of the coated (calcined) catalytic layer (g), specific surface area (SSA POCS) = surface/volume ratio of the POCS (cm2/cm3), VPOCS = geometric volume of the POCS (cm3), and dlayer = density of the coated catalytic layer (g/cm3), the same as for the slurried catalyst (1.4 g/cm3), calculated by pycnometric measurement, the value obtained is similar to other alumina-based slurries reported in the literature [32]. The equation assumes the layer thickness to be homogenously distributed at the entire substrate. The results show that the theoretical thickness of the deposited layer on the Kelvin POCS with strut diameters of 0.4 mm, 0.6 mm, and 0.8 mm is approximately 13.77 μm, 27.02 μm, and 41.74 μm, respectively. This behavior can help to explain the Kelvin catalysts results, which were all characterized by a complex pore network. While the sample with a large strut diameter (0.8 mm) may see some pore size reduction due to the thicker layer, the overall increase in available catalytic surface area can compensate by providing multiple pathways for reactants to diffuse and reach active sites. This increased availability of catalytic sites can enhance the overall catalytic activity, especially at lower temperatures where the interaction between the reactants and catalyst is crucial. The catalyst layer thickness can be considered as the diffusion length controlling the utilization; if the catalytic layer is too thick, it can impede the diffusion of reactants to the active sites, leading to poor utilization of the catalyst. Conversely, an optimal thickness can ensure that the diffusion length is sufficiently short for efficient reactant transport while providing ample active sites for the reaction to occur. This, together with the optimal amount of the catalytic material loaded, maximizes catalyst utilization in the Kelvin 0.8 sample.

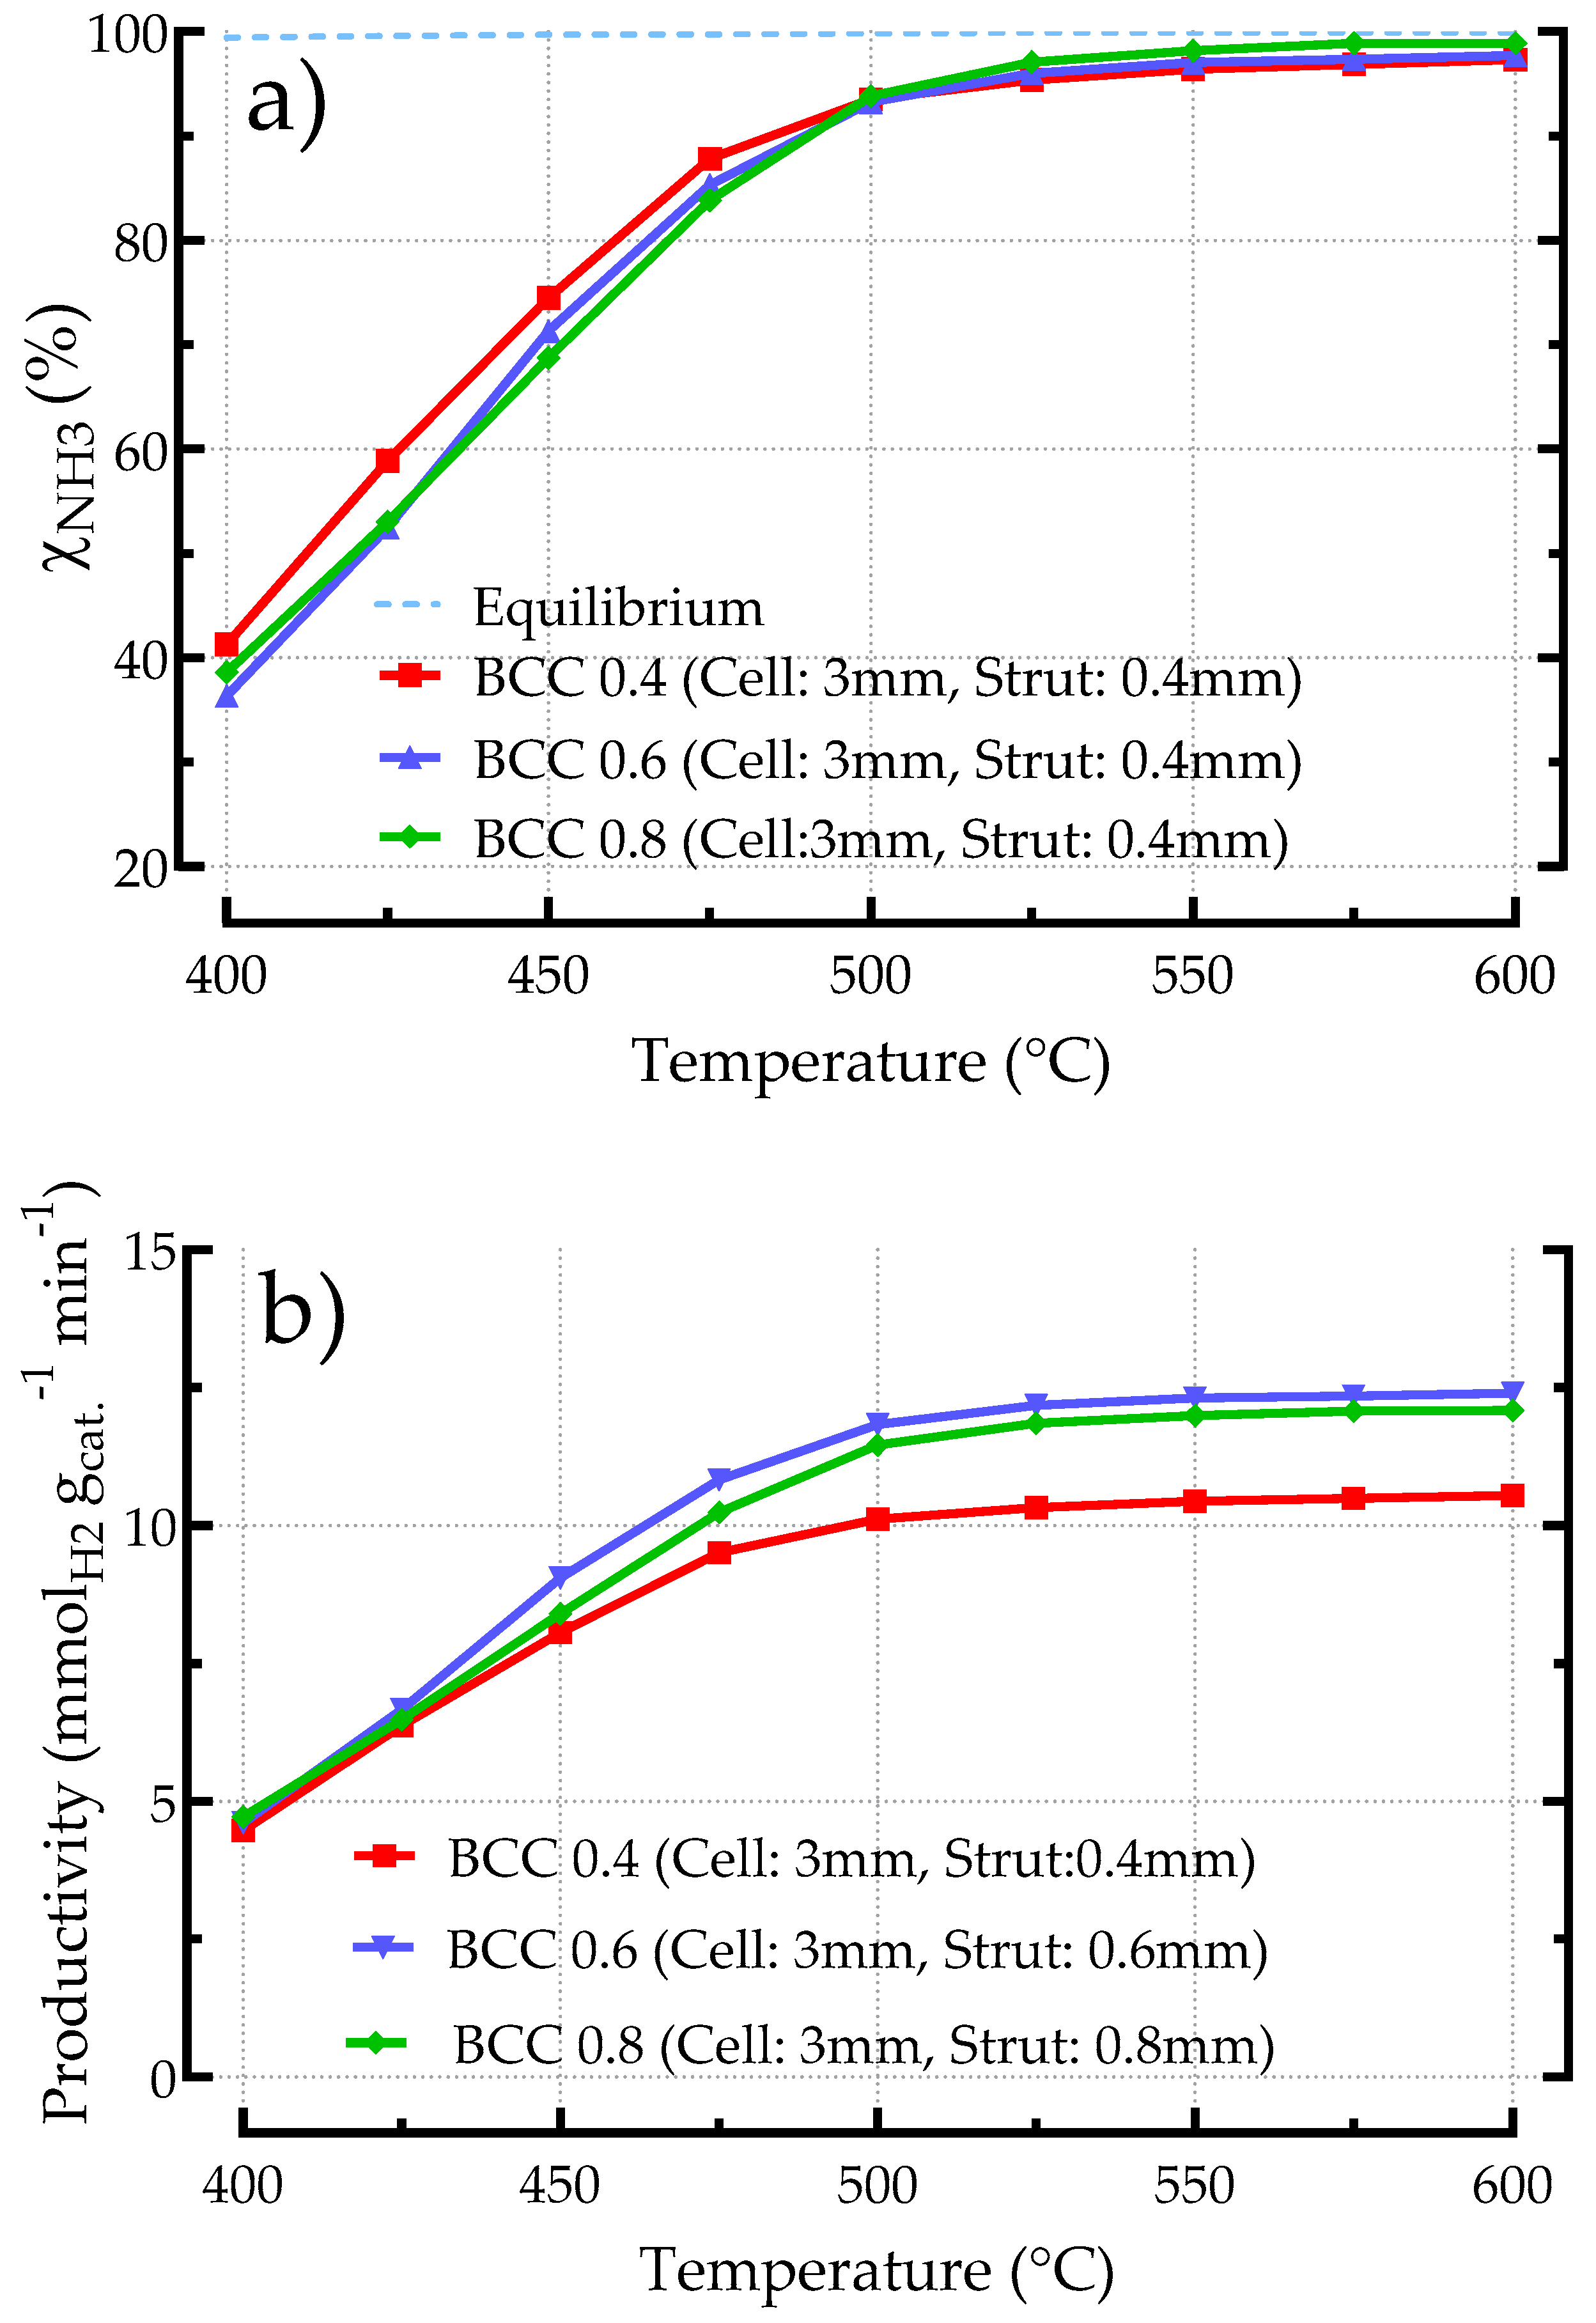
3.2.3. Influence of Geometric Features on the Performances of BCC-Based Catalysts

As reported in Figure 13 and in accordance with the findings for catalysts based on Kelvin structures, the geometry appears to exert an influence on the performance of the catalytic system at temperatures below 500 °C for the BCC samples. Indeed, no significant predominance of one structure over the other was observed at high temperatures (500–600 °C). As an example, at 500 °C, all the investigated samples have shown similar ammonia conversion values that range from a minimum of 93.50% for the BCC 0.4 sample to a maximum of 93.81% for the BCC 0.8 sample. Similarly, at 600 °C, the minimum value of conversion was shown by the BCC 0.4 sample (97.32%); again, the maximum values were shown by the BCC 0.8 one (98.91%). In this temperature range, the BCC 0.4 sample exhibits lower catalytic activity despite having a slightly higher catalyst loading compared to the other samples. In contrast, for the BCC catalytic system, the higher catalyst loading likely contributes to increased ammonia conversion, particularly in the lower temperature range (400–475 °C), where the catalyst is generally less active. The BCC 0.4 sample, indeed, has shown the highest ammonia conversion from a minimum of 41.28% registered at 400 °C to a maximum value of 87.82% obtained at 475 °C. Instead, the other two samples have shown similar results.
The higher catalyst loading in the BCC 0.4 sample provides more active sites, which becomes particularly advantageous in this lower temperature range, leading to the observed increase in ammonia conversion. However, as the temperature increases to the 500–600 °C range, the reaction rate becomes less dependent on the catalyst loading due to the higher kinetic energy available, resulting in similar conversion rates across all samples, regardless of the slight variations in catalyst amount. This indicates that at higher temperatures, the catalyst’s inherent activity is sufficient to drive the reaction towards near-complete conversion, diminishing the impact of catalyst loading. Again, as in the case of Kelvin structures, the amount of catalyst loaded influences productivity calculation. The BCC 0.6 and BCC 0.8 catalysts exhibited comparable productivity values, with a range of 4.61 (400 °C) to 12.40 mmol H2⋅gcat−1⋅min−1 (600 °C) for the BCC 0.6 and of 4.72 (400 °C) to 12.09 mmol H2⋅gcat−1⋅min−1 (600 °C) for the BCC 0.8. In contrast, the BCC 0.4 sample demonstrated lower H2 rates values, with a range of 4.47 (400 °C) to 10.54 mmol H2⋅gcat−1⋅min−1 (600 °C). In general, comparing the performances of the BCC system with the Kelvin system, it seems that BCC works slightly better in a temperature range between 400 and 500 °C. Conversely, at temperatures exceeding 500 °C, the Kelvin system exhibited enhanced performance, albeit to a limited extent. The geometrical differences between BCC and Kelvin can be used to explain the different results obtained. BCC structures feature regular straight channels, while Kelvin structures have a more intricate geometry. The geometric differences between BCC and Kelvin structures can influence their catalytic performance due to variations in their specific surface area, porosity, as reported in Table 1, and flow dynamics too. BCC structures, with their regular straight channels, likely facilitate more uniform gas flow and better accessibility of reactants to the catalyst surface, which is advantageous at lower temperatures (400–500 °C) where reaction kinetics are more sensitive to mass transfer. On the other hand, the intricate geometry of the Kelvin structures might promote more effective mixing and contact time at higher temperatures (above 500 °C), leading to enhanced catalytic activity. This increased complexity could also result in higher resistance to flow and potential pressure drops (Figure 8 and Figure 9), which might be beneficial at elevated temperatures where diffusion and heat transfer become more critical for maintaining catalytic efficiency. Moreover, the theoretical thickness of the deposited layer on the BCC POCS with strut diameters of 0.4 mm, 0.6 mm, and 0.8 mm are approximately 17.24 μm, 23.92 μm, and 37.46 μm, respectively, that are near the values obtained for the Kelvin structures but with a different geometry. As for the Kelvin structures, the catalytic layer thickness in BCC samples has a direct correlation with the specific surface area (SSA) of the bare supports. As strut diameter increases, the SSA decreases, which is due to the increase in solid content within the structure, as seen in Table 1. This behavior affects the coating process by resulting in varying catalyst layer thicknesses: with larger struts, the coating layer tends to be thicker. Conversely, the structure with smaller strut diameters maintains higher surface-to-volume ratios, allowing for thinner distributed coatings. Thus, the SSA, which in this case represents the available surface area for catalyst deposition per unit volume, is crucial for determining how effectively the catalyst can be distributed and how much surface area is available for reactions to occur. Specifically, the BCC 0.4 structure, at lower temperatures (400–475 °C), showed the highest conversion rates, possibly due to the enhanced mass transfer efficiency enabled by the higher SSA (Table 1). Probably, for the BBC 0.4 structure, a balance between catalyst loading and mass transfer efficiency across the channels and the catalytic layer contributes to enhancing the conversion efficiency at the lowest temperatures studied. This balance suggests that both the number of active catalysts and the transfer processes are well optimized, leading to efficient performance. Moreover, in structures with more open geometries, such as BCC, gas diffusion is facilitated, leading to lower pressure drops (Figure 8) and stable flow rates, which can enhance performance in conditions where rapid gas exchange is critical. In this case, the superior performance registered for the BCC 0.4 sample at lower temperatures could also be associated with its thinner catalytic layer, which facilitates more efficient reactant diffusion to active sites. The reduced thickness minimizes diffusion limitations, allowing reactants to reach the catalyst surface more easily, which is particularly advantageous at lower temperatures where reaction kinetics are slower. These findings are also valid for the Kelvin POCS and in general for the structured catalytic systems. As an example, the Kelvin 0.8 sample has shown the best performance at low temperatures (Figure 12) between the other Kelvin catalysts investigated. Despite its differing geometry and catalytic layer thicknesses with respect to the BCC 0.4 sample, it manages to achieve optimal performance in these conditions. Probably, in the case of the Kelvin 0.8 structure, which has a more complex pore network than the BCC one, a different balance between the amount of catalyst and the thickness of the catalytic layer helps ensure sufficient catalytic activity by providing ample surface area for reactions to occur. In addition, the more intricate geometries of Kelvin create tortuous paths that, while increasing surface area, can hinder gas diffusion due to higher resistance to flow (Figure 9). This can lead to improved performance in reactions that, such as ammonia synthesis (Figure 11), benefit from extended contact times, as reactants are held longer within the active regions of the catalyst. Consequently, performance is influenced by a balance of surface area availability and gas diffusion efficiency, each impacted by the specific geometry of the structure. Probably in this case, the thicker layer on Kelvin 0.8 increases the likelihood that reactants will remain within the active regions longer, despite lower SSA, thus compensating for potential limitations in surface area. This design allows for a balance where the thicker layer, together with the tortuous geometry, supports sustained reactant diffusion and enhances catalytic performance in processes sensitive to contact time. Thus, for the different geometries studied, a thinner catalyst layer that provides greater surface area does not necessarily improve performance, as effectiveness is also influenced by reactant diffusion through the support’s geometry, which plays a crucial role in determining overall performance. This concept could be extended to Gyroid structures.

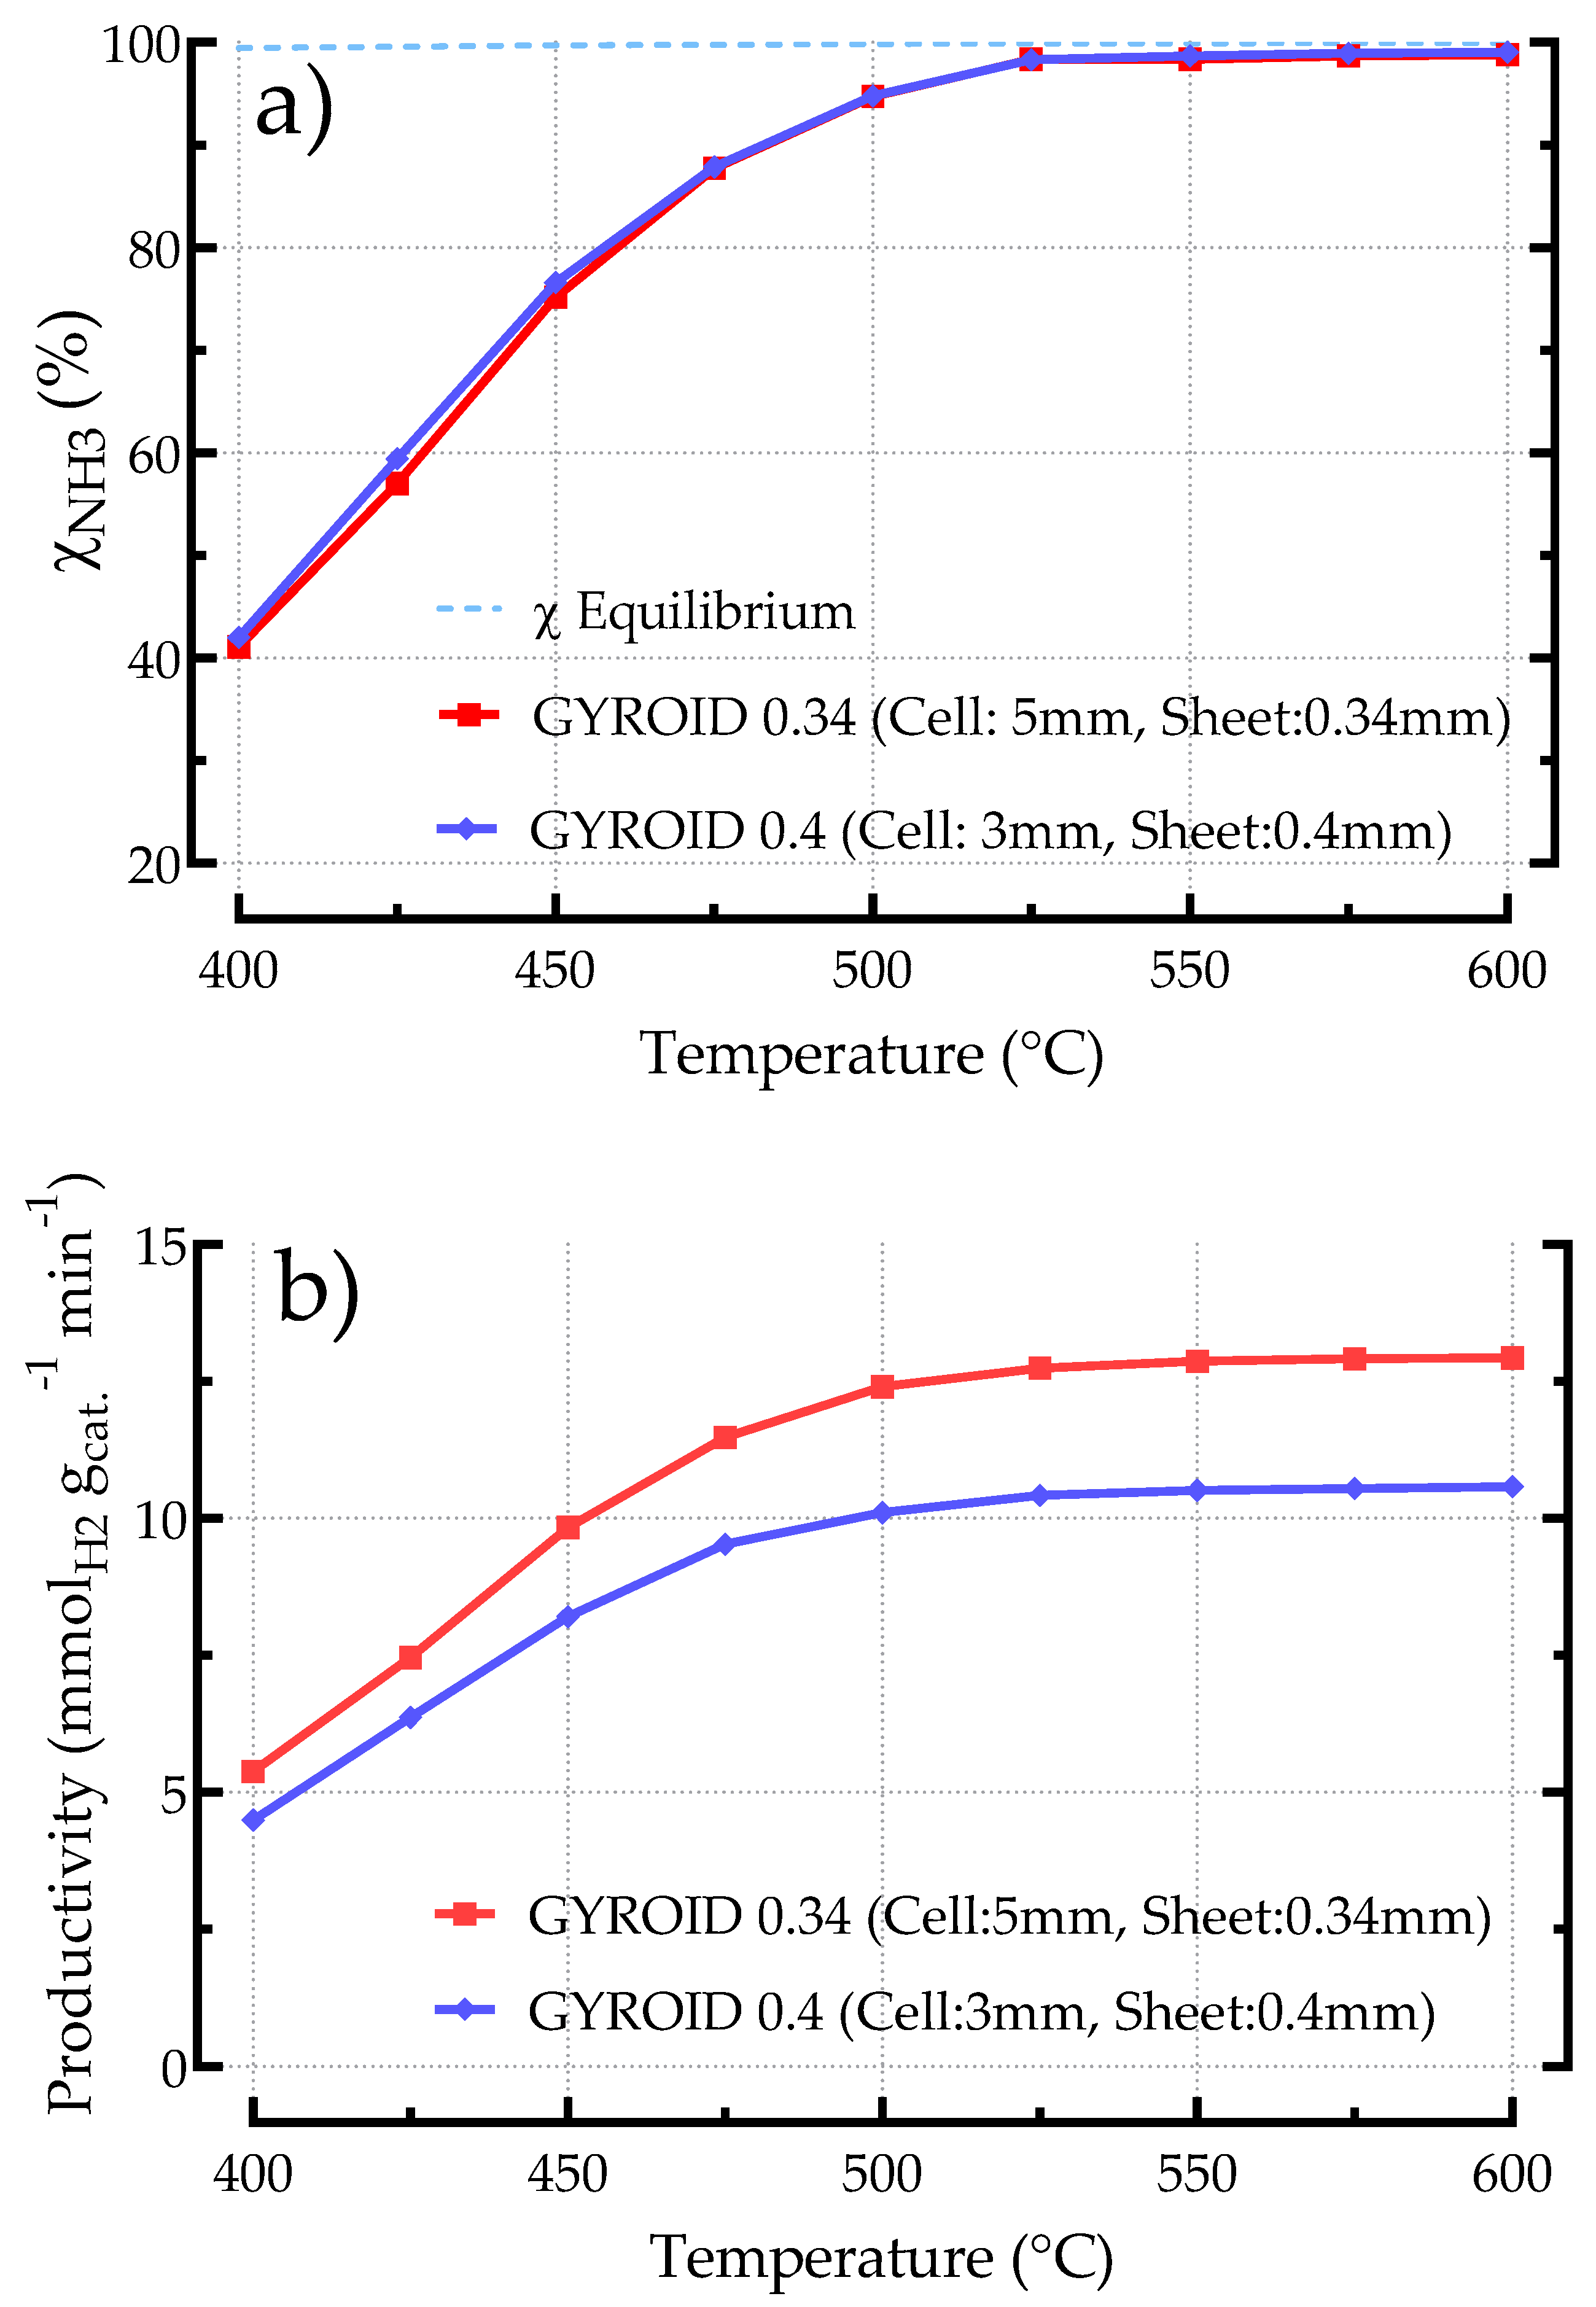
3.2.4. Influence of Geometric Features on the Performances of Gyroid Based Catalysts

The Gyroid samples are characterized by triply periodic minimal surface (TPMS) topologies that result in a complex, labyrinthine tridimensional structure. The Gyroid bare supports show a good amount of exposed surface area per unit volume comparable or superior to some samples based on Kelvin and BCC structures (Table 1). In addition, the TPMS structures possess a highly interconnected network of tortuous channels that offers efficient mass transfer and diffusion pathways. As reported in Figure 14, the Gyroid catalysts have shown similar performances in terms of ammonia conversion. Nevertheless, the Gyroid structure with a smaller cell size (Gyroid 0.4) exhibited slightly higher NH3 conversion rates across the temperature range tested that increased from 41.99% (400 °C) to 99.05% (600 °C) compared to the Gyroid catalyst with a larger cell size (Gyroid 0.34) that showed conversion values between 41.08% (400 °C) and 98.80% (600 °C). In addition, both the Gyroid-based catalysts showed better ammonia conversion at low temperatures (400–475 °C) compared to the other investigated geometries, again with similar values to those of the Gyroid 0.34 ranging from 41.85% to 87.72% and for the Gyroid 0.4 ranging from 41.99% to 87.87%, respectively.
However, it should be noted that the Gyroid 0.34 has a lower catalyst load (0.225, 0.19 g/cm3) than the Gyroid 0.4 (0.255, 0.21 g/cm3), where the weight discrepancy is 0.03 g. Indeed, in terms of productivity, the Gyroid 0.34 showed the highest H2 rate all over the investigated temperature range, from 5.38 mmol H2⋅gcat−1⋅min−1 (400 °C) to 12.93 mmol H2⋅gcat−1⋅min−1 (600 °C). In this regard, the Gyroid 0.34 sample seems to be performing better because it requires less catalyst with respect to the Gyroid 0.4 to obtain similar ammonia conversion values. As reported in Table 1, the Gyroid 0.4 structure with a cell size of 3 mm has a slightly lower surface/volume ratio (48.34 cm2/cm3) compared to the Gyroid 0.34 with a cell size of 5 mm (59.22 cm2/cm3); despite the higher amount of catalyst in the Gyroid 0.4 structure, the two samples exhibit similar theoretical thicknesses (Table 1). From the perspective of different geometries, the Gyroid 0.34 has a more open cell structure (5 mm cell size compared to 3 mm in Gyroid 0.4), which may facilitate better gas flow and reduce pressure drop, allowing the catalyst to perform effectively even with less material. This trend confirms that, as with the other investigated geometries (BCC and Kelvin), a different balance between the amount of catalyst loaded, the thickness of the catalytic layer, and the geometrical features could be crucial for ensuring sufficient catalytic activity. This balance between catalyst loading and geometric efficiency suggests that while Gyroid 0.34 has a lower catalyst content, it can still achieve satisfactory performance, especially in systems where catalyst efficiency and gas flow dynamics play a significant role.

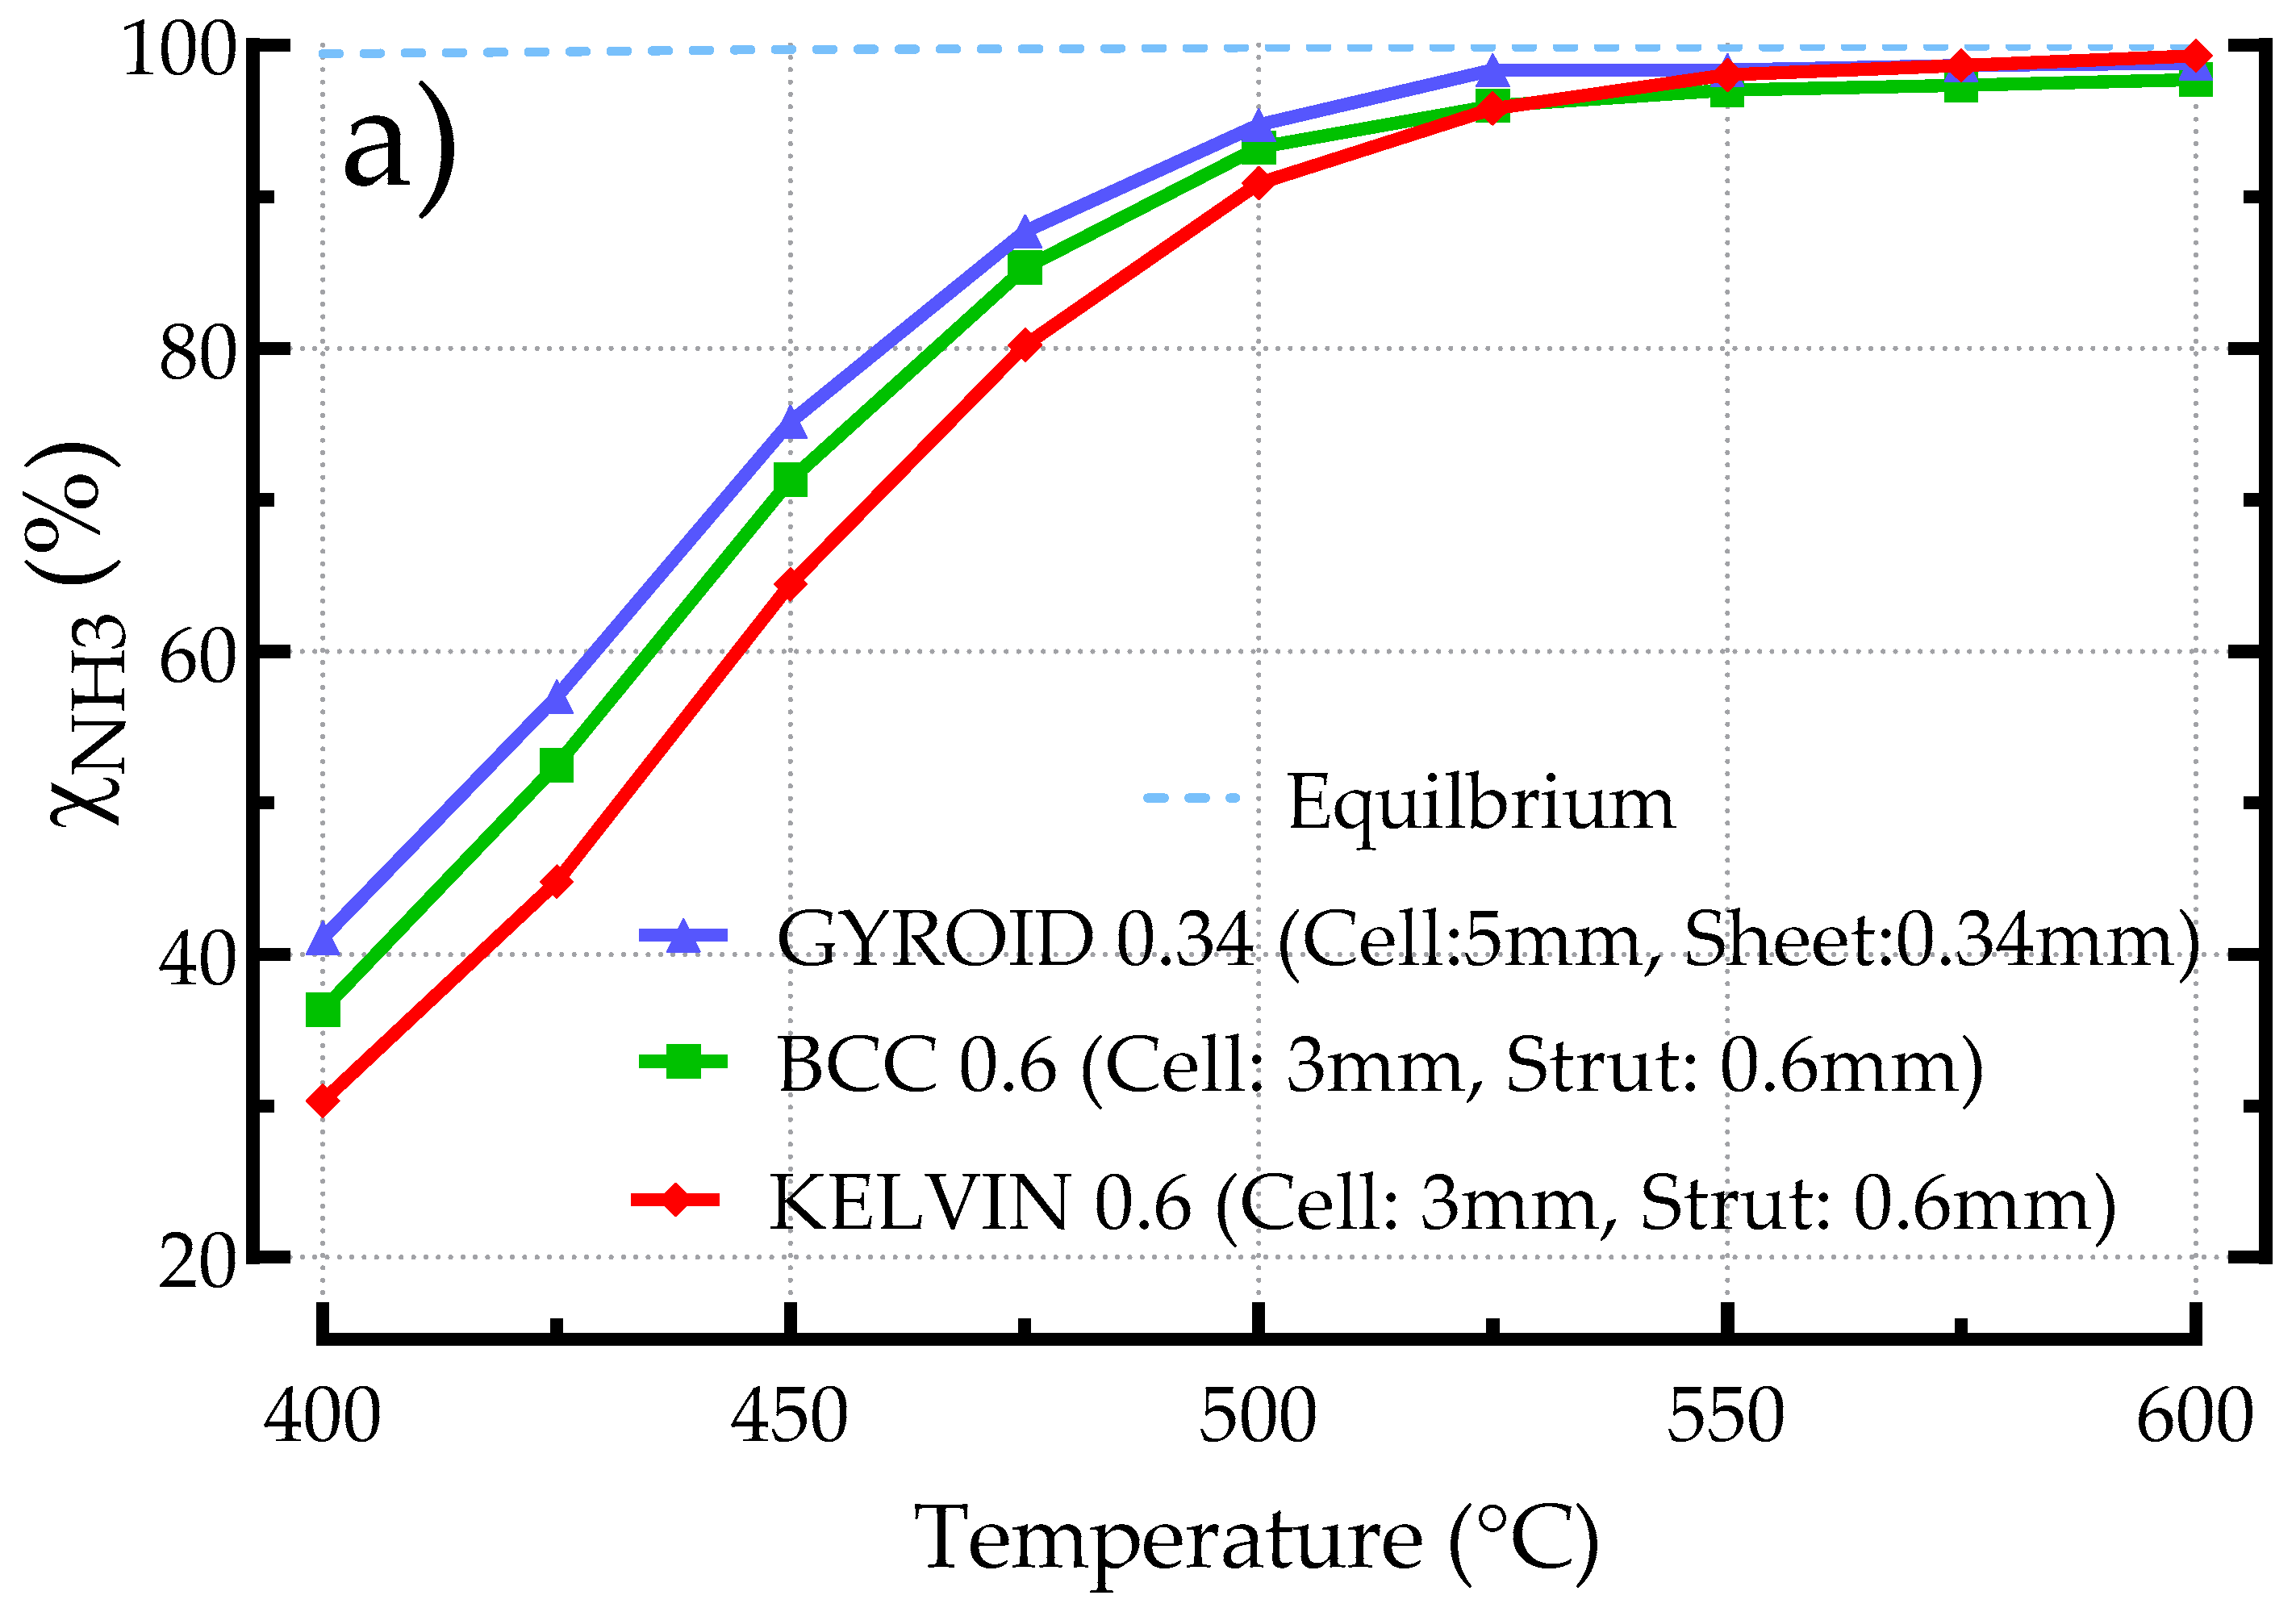
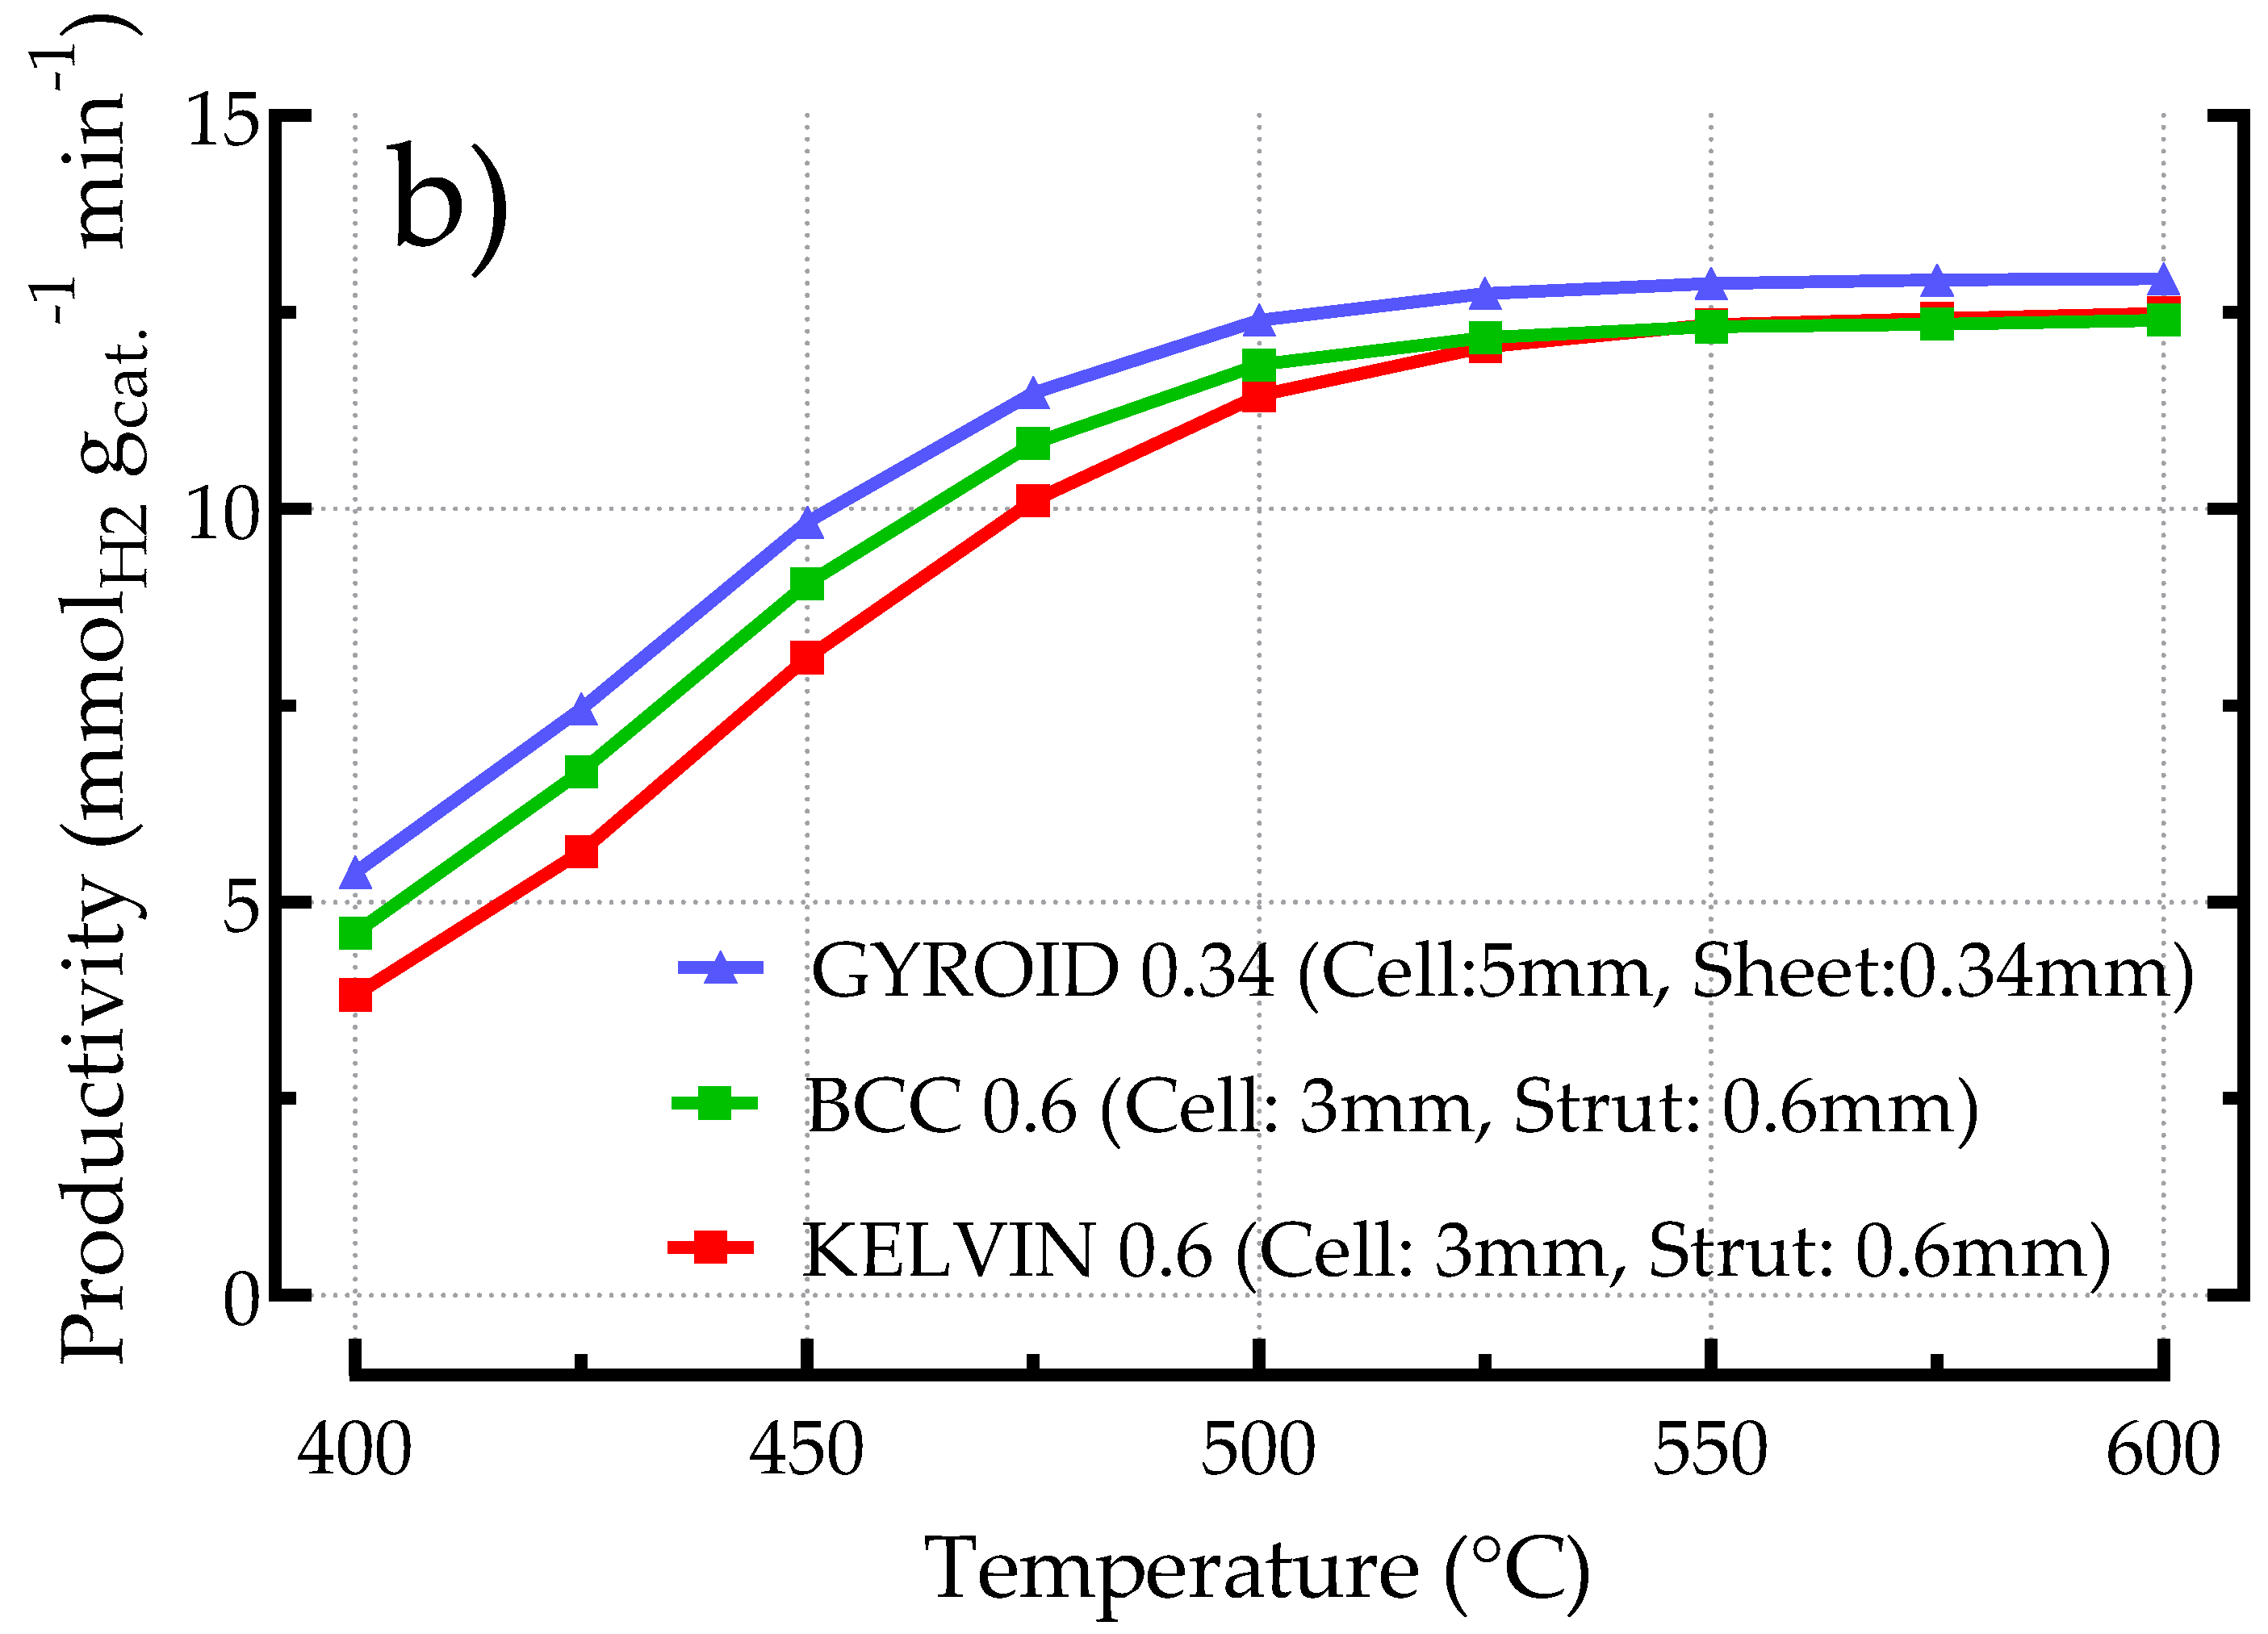
3.2.5. Comparing Different Structured Catalysts (BCC, Kelvin, Gyroid)

A comparison between the three studied structures (Kelvin, BCC, and Gyroid) is not straightforward due to their differing geometries and how they interact with the flow of reaction gases. Each structure presents unique characteristics that influence its performance in catalytic processes. The Kelvin structure features interconnected struts arranged in a periodic lattice, providing ample surface area for catalytic activity and efficient gas diffusion. In contrast, the BCC structure exhibits regular, straight channels that ensure consistent fluid flow and distribution of reactants across the catalyst bed. On the other hand, the Gyroid structure is characterized by a complex, labyrinthine, and tortuous network of channels, offering efficient mass transfer pathways. These structural differences result in varied gas–solid interactions, affecting factors such as surface area, porosity, pressure drop, and mass transport, which ultimately impact catalytic performance. The catalyst tests were selected in such a way that the catalyst loadings of the samples were as close to equal as possible, thus minimizing the effect of loading on catalytic performance. The comparison is reported in Figure 15.
The results have shown that the Gyroid sample works better than the other geometries investigated; in the temperature range between 400 and 500 °C, instead of at temperatures exceeding 500 °C, no marked prevalence of one of the structures was noted. In particular, the difference in performance becomes more noticeable as the temperature decreases. As examples, at relatively low temperature (450 °C), the ammonia conversion for the Gyroid catalyst is equal to 75% associated with a productivity of 9.83 mmol H2⋅gcat−1⋅min−1. At the same temperature, the BCC and Kelvin samples show a conversion of 71.3% and 64.4% associated with a productivity of 9.05 mmol H2⋅gcat−1⋅min−1 and 8.11 mmol H2⋅gcat−1⋅min−1, respectively. The geometrical differences between the Gyroid, BCC, and Kelvin structures explain the distinct catalytic results observed. While the catalyst loading and resulting thicknesses are relatively similar across all structures (Gyroid: 26.11 µm, Kelvin: 27.02 µm, BCC: 23.92 µm), indicating a similar concentration of catalytic material per unit area, the Gyroid’s labyrinthine network of channels is likely the key factor for its superior low-temperature performance. This complex geometry enhances mass transport, ensuring that reactants efficiently reach the active catalytic sites. The increased surface area and intricate channel pathways optimize reactant diffusion, leading to higher reaction rates and improved performance at lower temperatures, where mass transfer becomes critical. This contrasts with the more straightforward channel geometries in BCC and Kelvin structures, which, probably, do not offer the same degree of efficiency in reactant transport as the Gyroid. This again confirms that, especially in a temperature range in which kinetic is not favorable, that geometrical features and the balance between catalyst loading and geometric efficiency can be determinants to improve the overall performance of a catalytic structured system. Thus, in a Gyroid reactor, the reactants are more likely to come into contact with the catalyst material, leading to a more efficient catalytic reaction. While, in general, the Gyroid system may appear less porous due to its intricate design, it compensates by providing an abundance of active sites. The convoluted channels increase the surface area available for reactions. In addition, the Gyroid’s winding channels allow reactants to take diverse paths. This dynamic transport ensures that molecules encounter active sites efficiently. This behavior is in agreement with a CFD study [33] that identified the Gyroid geometry able to split the incoming flow into separate streams that flow within the swirling channels of the structure; as such, the activated walls can experience more interaction with the incoming gaseous reagent. Similarly, another study [34] confirms that the flow within a Gyroid TPMS exhibits a highly convoluted structure. Each Gyroid unit cell contributes to four through-flow passages, leading to four intricately intertwined and coiled 3D helical flow structures, fostering enhanced fluid mixing. Moreover, the complex nature of Gyroid, forces the flow to change trajectory as it flows past the structure, inducing vortices that enhance turbulence and ultimately enhance heat transfer. This latter effect, in the case of an endothermic process, such as ammonia decomposition, can contribute to improving the catalytic performance. In this regard, our previous study has confirmed that the Gyroid configuration seems to offer superior momentum and heat transfer characteristics relative to the BCC and Kelvin configurations [35]. Moreover, in this study we also examined the impact of flow velocities between 1 and 10 m/s, with Reynolds numbers from 30 to 400 (based on strut thickness) for the three cell types, focusing on thermohydraulic performance. Through the relative analogy between heat and mass transport, these observations could also offer insights into mass transfer behavior. At the lowest velocity (~Stokes flow regime), differences among structures were minimal. In this regime, the inertial terms in the Navier–Stokes equations are negligible compared to diffusion terms. Here, transport phenomena, including mass transfer, are primarily governed by wall friction, which is proportional to the available surface area of the periodic open cellular structures (POCS). Therefore, under similar porosity and, particularly, similar specific surface area, the impact of cell type differences is small. At higher velocities, in the so-called Forchheimer regime, the inertial forces related to the local acceleration of the fluid particles start contributing to the transport phenomena. This inertial contribution to the overall pressure drop in porous media is typically expressed by a u2 term by almost all authors. From a heat transfer perspective, the Kelvin cell emerged as the optimal choice. However, when balancing heat transfer with pressure drop considerations, the gyroid cell proved to be the best overall cell type, with the Kelvin cell ranking last, closely followed by the BCC cell. Detailed flow visualization provided insights into this behavior: the Kelvin cell exhibited a jet-like fluid flow pattern (with a preferential flow path), the BCC cell maintained relatively straight streamlines, and the gyroid cell presented the most tortuous path. This tortuosity in the gyroid structure could promote greater dispersion of reactants across the POCS matrix, helping to mitigate the formation of preferential flow paths. Therefore, under higher flowrate, the gyroid structure appears advantageous for improving reactant distribution and alleviating external mass transfer limitations. Finally, regarding the performance of the Gyroid catalyst at higher temperatures and in general of all structured systems under investigation, the data suggest that as the temperature approaches 600 °C, ammonia conversion approaches equilibrium value, demonstrating that the catalytic systems are no longer limited by the kinetics but instead by thermodynamic constraints. Another way for evaluating the overall performance of different POCS designs in terms of their space utilization for catalytic activity could be to measure the efficiency of hydrogen production per unit volume of the structured catalyst (HPUV). It gives an indication of how effectively the catalyst within the structure is converting reactants into hydrogen, considering the overall volume of the structure. This metric evaluates the reactor’s productivity per unit volume or footprint area. A higher space–time yield indicates higher productivity relative to the reactor size.
As reported in Table 3, the Gyroid structure exhibits better performance in terms of HPUV compared to the Kelvin and BCC structures. Despite having a lower surface/volume ratio compared to the other structures, the Gyroid still maintains a high HPUV. This suggests efficient utilization of space within the structurer, maximizing the available surface area for catalysis. Again, the unique geometry of the Gyroid structure promotes enhanced fluid flow and distribution of reactants, optimizing contact between the catalyst and reactants. This design feature further enhances productivity and contributes to the higher HPUV observed. The BCC and Kelvin structures for the condition studied show similar HPUV values. This can be attributed to their similar periodic lattice arrangements with interconnected struts. While their channel geometries differ, they both provide similar surface area for catalytic activity, leading to similar HPUV values. However, BCC demonstrates slightly better productivity, possibly due to its specific channel geometry and flow characteristics. In summary, while all three structures demonstrate suitability for ammonia decomposition, the Gyroid structure stands out as the most efficient in terms of space–time yield, offering the potential for realizing reactors with reduced volume requirements while maintaining high productivity. The different catalytic systems can also be compared in relation to their weight; in this case, a specific productivity metric (hydrogen productivity per unit of weight, HPUW), which calculates the amount of hydrogen produced per unit weight of the reactor, can be used. In this case, the weight of the reactor refers to the total mass of the structured support. This formula provides a measure of the reactor’s efficiency in terms of hydrogen production relative to its weight. A higher value indicates better productivity per unit weight. Also in this case, Gyroid exhibits the highest productivity per unit weight, followed by BCC and then Kelvin. This means that for the same weight of the reactor material, the Gyroid structure can produce more hydrogen, making it highly efficient in terms of weight utilization. Consequently, when designing a reactor, utilizing the Gyroid structure would result in a lighter reactor with a lower volume while maintaining high hydrogen production rates. This weight reduction can be beneficial for various applications, particularly where weight constraints are critical, such as in space-constrained setups for distributed applications. Additionally, the lower volume requirement can contribute to space-saving benefits, facilitating easier integration into existing systems or reducing the footprint of the overall hydrogen production setup.

4. Conclusions

This study investigated the characteristics and performance of various porous periodic open cell structures (POCS) and a triply periodic minimal surface (TPMS) architecture manufactured from IN625 nickel alloy powder using the laser powder bed fusion (LPBF) technique. The analyses included BCC, Kelvin, and Gyroid geometries, examining parameters such as cell size, strut/sheet size, solid volume, porosity, and specific surface area.
Observations revealed slight differences between measured and designed values, particularly in solid volume and density, indicating potential influences from material properties, manufacturing processes, or variations in production conditions. The discrepancies in porosity were attributed to complexities in real-world manufacturing compared to idealized design conditions, influenced by non-flat surfaces resulting from powder usage during fabrication.
Pressure drop analyses across different geometries indicated correlations between pressure drop, porosity, cell size, strut size, and solid volume. Generally, increasing porosity led to decreased pressure drops, while larger strut diameters and smaller cell sizes resulted in higher pressure drops. Additionally, higher solid volumes increased obstruction to fluid flow, elevating pressure drops. Comparing the different geometries investigated, Gyroid-based structures exhibited higher pressure drops due to higher solid volumes and complex structure networks. The BCC geometries show the lowest pressure drop between the different POCS studied. The dip/spin coating method was used to activate the structures. The method consistently achieved uniform coating coverage across various support geometries despite differences in surface/volume ratio, porosity, and solid volume among these structures. This uniform coverage is essential for ensuring the catalytic effectiveness of the coated supports. Regarding the catalytic activity, this study comprehensively investigated the performance toward ammonia decomposition of POCS and TPMS structures. The analysis encompassed various geometrical factors such as specific surface area, strut diameter, porosity, thickness of the catalytic layer, and productivity metrics. The comparison revealed distinct characteristics of each structure. The Kelvin structure, characterized by interconnected struts, demonstrated efficient gas diffusion and catalytic activity. Meanwhile, the BCC structure with its regular, straight channels ensured consistent fluid flow and reactant distribution. The Gyroid structure, with its labyrinthine network of channels, provided efficient mass and heat transfer pathways. Amidst these structures, the Gyroid exhibited superior performance with respect to the other POCS catalysts, especially at low temperatures (400–500 °C). Its intricate channel network allowed for efficient reactant transport and ample active sites, resulting in enhanced catalytic activity. Furthermore, the Gyroid structure enabled the design of lighter and more compact reactors, addressing weight and volume constraints in applications like distributing hydrogen production. Leveraging the Gyroid structure could lead to the development of more efficient and space-saving hydrogen production systems. Overall, this comparative analysis highlights the importance of structural design in catalytic processes and underscores the potential of Gyroid structures for advancing reactor efficiency and compactness. But some general findings, related to the different geometries investigated, cannot be excluded from the final conclusions. The unique geometries and catalytic characteristics of each structured system enable an optimal balance between catalyst loading and mass transfer, ensuring that each structure performs effectively under the chosen operating conditions. This balance is crucial for achieving high catalytic efficiency, demonstrating that different strategies can lead to equally effective outcomes when the catalyst’s properties and the system’s design are well-matched.

Author Contributions

Conceptualization, A.V., C.I. and F.G.; methodology, A.V. and C.I.; software, S.R., S.N., D.T., N.M., P.O. and B.H.; validation, A.V., C.I. and D.T.; formal analysis, G.M., M.T., S.R., D.T., N.M. and P.O.; investigation, G.M., M.T., S.N. and B.H.; resources, G.M., M.T., S.N. and B.H.; data curation, A.V., C.I., B.H., S.N., D.T. and S.R.; writing—original draft preparation, A.V.; writing—review and editing, A.V., C.I., F.G., D.T., A.S., B.H., S.N., S.R., N.M. and P.O.; visualization, A.V. and C.I.; supervision, A.V.; project administration, A.V., F.G., A.S., S.N. and B.H.; funding acquisition, A.V., F.G., A.S., B.H. and S.N. All authors have read and agreed to the published version of the manuscript.

Funding

This work has received funding from the European Union’s Horizon 2020 research and innovation program under grant agreement No. 101058565 (AMBHER project). This work was also supported by the Clean Hydrogen Partnership and its members Hydrogen Europe and Hydrogen Europe Research under grant agreement No. 101112118 (ANDREAH project). Views and opinions expressed are, however, those of the authors only and do not necessarily reflect those of the European Union or CHJU.

Data Availability Statement

The original contributions presented in the study are included in the article, further inquiries can be directed to the corresponding author.

Acknowledgments

The authors acknowledge Costantino Claudia for administrative and technical support with the management of the purchase orders for the materials used in this work.

Conflicts of Interest

Authors Benjamin Hary, Steve Nardone were employed by the company ENGIE Laborelec. Authors Simon Richard, Assia Saker, Damien Tasso, Nicolas Meynet, Pierre Olivier were employed by the company ENGIE Lab CRIGEN. The remaining authors declare that the research was conducted in the absence of any commercial or financial relationships that could be construed as a potential conflict of interest. The companies had no role in the design of the study; in the collection, analyses, or interpretation of data; in the writing of the manuscript, or in the decision to publish the results.

References

  1. Kamran, M.; Turzyński, M. Exploring hydrogen energy systems: A comprehensive review of technologies, applications, prevailing trends, and associated challenges. J. Energy Storage 2024, 96, 112601. [Google Scholar] [CrossRef]
  2. Papadias, D.D.; Peng, J.K.; Ahluwalia, R.K. Hydrogen carriers: Production, transmission, decomposition, and storage. Int. J. Hydrogen Energy 2021, 46, 24169–24189. [Google Scholar] [CrossRef]
  3. Salmon, N.; Bañares-Alcántara, R. Green ammonia as a spatial energy vector: A review. Sustain. Energy Fuels 2021, 5, 2814–2839. [Google Scholar] [CrossRef]
  4. Lipman, T.; Shah, N. Ammonia as an Alternative Energy Storage Medium for Hydrogen Fuel Cells: Scientific and Technical Review for Near-Term Stationary Power Demonstration Projects, Final Report|Transportation Sustainability Research Center. 2017. Available online: https://tsrc.berkeley.edu/publications/ammonia-alternative-energy-storage-medium-hydrogen-fuel-cells-scientific-and-technical (accessed on 7 July 2024).
  5. Aziz, M.; TriWijayanta, A.; Nandiyanto, A.B.D. Ammonia as effective hydrogen storage: A review on production, storage and utilization. Energies 2020, 13, 3062. [Google Scholar] [CrossRef]
  6. Li, N.; Zhang, C.; Li, D.; Jiang, W.; Zhou, F. Review of reactor systems for hydrogen production via ammonia decomposition. Chem. Eng. J. 2024, 495, 153125. [Google Scholar] [CrossRef]
  7. Ashcroft, J.; Goddin, H. Centralised and Localised Hydrogen Generation by Ammonia Decomposition: A technical review of the ammonia cracking process. Johns. Matthey Technol. Rev. 2022, 66, 375–385. [Google Scholar] [CrossRef]
  8. Trangwachirachai, K.; Rouwenhorst, K.; Lefferts, L.; Faria Albanese, J.A. Recent progress on ammonia cracking technologies for scalable hydrogen production. Curr. Opin. Green Sustain. Chem. 2024, 49, 100945. [Google Scholar] [CrossRef]
  9. Galley, M.R.; Atomique, E.; Limitea, C.; Operations, C.; Candu, O. Future Trends in Heavy Water Production Tendances Futures la Production D’eau Lourde. In Proceedings of the Fourth Pacific Basin Conference, Vancouver, BC, Canada, 11–15 September 1983; Atomic Energi of Canada Limited: Chalk River, ON, Canada, 1983. CANDU Operations Canada KOJ 1J0 (ISSN 0067-0367). [Google Scholar]
  10. Bell, T.E.; Torrente-Murciano, L. H2 Production via Ammonia Decomposition Using Non-Noble Metal Catalysts: A Review. Top. Catal. 2016, 59, 1438–1457. [Google Scholar] [CrossRef]
  11. WMakepeace, J.; David, W.I. Structural Insights into the Lithium Amide-Imide Solid Solution. J. Phys. Chem. C. 2017, 121, 12010–12017. [Google Scholar] [CrossRef]
  12. Zou, X.; Su, H.-Y.; Sun, X.; Pang, W.; Hao, X.; Xu, Y.; Sun, K. Interplay between surface structure, reaction condition and mechanism for ammonia decomposition on Ru catalyst. Appl. Surf. Sci. 2024, 649, 159175. [Google Scholar] [CrossRef]
  13. Schüth, F.; Palkovits, R.; Schlögl, R.; Su, D.S. Ammonia as a possible element in an energy infrastructure: Catalysts for ammonia decomposition. Energy Environ. Sci. 2012, 5, 6278–6289. [Google Scholar] [CrossRef]
  14. Chen, C.; Wu, K.; Ren, H.; Zhou, C.; Luo, Y.; Lin, L.; Au, C.; Jiang, L. Ru-Based Catalysts for Ammonia Decomposition: A Mini-Review. Energy Fuels 2021, 35, 11693–11706. [Google Scholar] [CrossRef]
  15. Klerke, A.; Christensen, C.H.; Nørskov, J.K.; Vegge, T. Ammonia for hydrogen storage: Challenges and opportunities. J. Mater. Chem. 2008, 18, 2304–2310. [Google Scholar] [CrossRef]
  16. Mathhey, J. PGM Management. 2024. Available online: https://matthey.com/products-and-markets/pgms-and-circularity/pgm-management (accessed on 7 July 2024).
  17. Cechetto, V.; Di Felice, L.; Medrano, J.A.; Makhloufi, C.; Zuniga, J.; Gallucci, F. H2 production via ammonia decomposition in a catalytic membrane reactor. Fuel Process. Technol. 2021, 216, 106772. [Google Scholar] [CrossRef]
  18. Cechetto, V.; Anello, G.; Rahimalimamaghani, A.; Gallucci, F. Carbon Molecular Sieve Membrane Reactors for Ammonia Cracking. Processes 2024, 12, 1168. [Google Scholar] [CrossRef]
  19. Bracconi, M.; Ambrosetti, M.; Maestri, M.; Groppi, G.; Tronconi, E. A fundamental investigation of gas/solid mass transfer in open-cell foams using a combined experimental and CFD approach. Chem. Eng. J. 2018, 352, 558–571. [Google Scholar] [CrossRef]
  20. Vita, A.; Italiano, C.; Pino, L.; Frontera, P.; Ferraro, M.; Antonucci, V. Activity and stability of powder and monolith-coated Ni/GDC catalysts for CO2 methanation. Appl. Catal. B Environ. 2018, 226, 384–395. [Google Scholar] [CrossRef]
  21. Vita, A.; Pino, L.; Cipit, F.; Lagan, M.; Recupero, V. Structured reactors as alternative to pellets catalyst for propane oxidative steam reforming. Int. J. Hydrogen Energy 2010, 35, 9810–9817. [Google Scholar] [CrossRef]
  22. Gancarczyk, A.; Sindera, K.; Iwaniszyn, M.; Piątek, M.; Macek, W.; Jodłowski, P.J.; Wroński, S.; Sitarz, M.; Łojewska, J.; Kołodziej, A. Metal foams as novel catalyst support in environmental processes. Catalysts 2019, 9, 587. [Google Scholar] [CrossRef]
  23. Laguna, O.H.; Lietor, P.F.; Godino, F.J.I.; Corpas-Iglesias, F.A. A review on additive manufacturing and materials for catalytic applications: Milestones, key concepts, advances and perspectives. Mater. Des. 2021, 208, 109927. [Google Scholar] [CrossRef]
  24. Schwieger, W. Hierarchy concepts: Classification and preparation strategies for zeolite containing materials with hierarchical porosity. Chem. Soc. Rev. 2016, 45, 3353–3376. [Google Scholar] [CrossRef] [PubMed]
  25. Busse, C.; Freund, H.; Schwieger, W. Intensification of heat transfer in catalytic reactors by additively manufactured periodic open cellular structures (POCS). Chem. Eng. Process. Process Intensif. 2018, 124, 199–214. [Google Scholar] [CrossRef]
  26. Jandyal, A.; Chaturvedi, I.; Wazir, I.; Raina, A.; Mi, U.H. 3D printing—A review of processes, materials and applications in industry 4.0. Sustain. Oper. Comput. 2022, 3, 33–42. [Google Scholar] [CrossRef]
  27. Balzarotti, R.; Cristiani, C.; Francis, L.F. Combined dip-coating/spin-coating depositions on ceramic honeycomb monoliths for structured catalysts preparation. Catal. Today 2019, 334, 90–95. [Google Scholar] [CrossRef]
  28. Balzarotti, R.; Ambrosetti, M.; Arnesano, M.; Anglani, A.; Groppi, G.; Tronconi, E. Periodic open cellular structures (POCS) as enhanced catalyst supports: Optimization of the coating procedure and analysis of mass transport. Appl. Catal. B Environ. 2021, 283, 119651. [Google Scholar] [CrossRef]
  29. Balzarotti, R.; Ferrante, G.D.; Italiano, C.; Laganà, M.; Francis, L.F.; Vita, A.; Cristiani, C.; Pino, L. RhNi/CeO2 catalytic activation of alumina open cell foams by dip-spin coating for the CO2 methanation of biogas. Surf. Coatings Technol. 2022, 441, 128563. [Google Scholar] [CrossRef]
  30. Chyrkin, A.; Gunduz, K.O.; Fedorova, I.; Sattari, M.; Visibile, A.; Halvarsson, M.; Froitzheim, J.; Stiller, K. High-temperature oxidation behavior of additively manufactured IN625: Effect of microstructure and grain size. Corros. Sci. 2022, 205, 110382. [Google Scholar] [CrossRef]
  31. Boettge, D.; Standke, G.; Fuessel, A.; Adler, J. Functionalization of open-celled foams by homogeneous slurry based coatings. J. Mater. Res. 2013, 28, 2220–2233. [Google Scholar] [CrossRef]
  32. Ibáñez, M.; Ibáñez, M.; Sanz, O.; Sanz, O.; Egaña, A.; Egaña, A.; Reyero, I.; Reyero, I.; Bimbela, F.; Bimbela, F.; et al. Performance comparison between washcoated and packed-bed monolithic reactors for the low-temperature Fischer-Tropsch synthesis. Chem. Eng. J. 2021, 425, 130424. [Google Scholar] [CrossRef]
  33. Al-Ketan, O.; Ali, M.; Khalil, M.; Rowshan, R.; Khan, K.A.; Abu Al-Rub, R.K. Forced Convection Computational Fluid Dynamics Analysis of Architected and Three-Dimensional Printable Heat Sinks Based on Triply Periodic Minimal Surfaces. J. Therm. Sci. Eng. Appl. 2021, 13, 21010. [Google Scholar] [CrossRef]
  34. Ansari, D.; Duwig, C. A gyroid TPMS heat sink for electronic cooling. Energy Convers. Manag. 2024, 319, 118918. [Google Scholar] [CrossRef]
  35. Richard, S.; Tasso, D.; Rajana, M.; Saker, A.; Santos, A.R.; Makhloufi, C.; Meynet, N.; Hary, B.; Nardone, S.; Marino, G.; et al. Comparison of thermo-hydraulic performance among different 3D printed periodic open cellular structures. Chem. Eng. J. 2024, 492, 152005. [Google Scholar] [CrossRef]
Figure 1. Optical images of BCC POCS as built: (a,b) cell size = 3 mm, Strut size = 0.4 mm; (c,d) cell size = 3 mm, strut size = 0.6 mm; (e,f) cell size = 3 mm, strut size = 0.8 mm.
Processes 12 02663 g001
Figure 2. Optical images of Kelvin POCS as built: (a,b) cell size = 3 mm, strut size = 0.4 mm; (c,d) cell size = 3 mm, strut size = 0.6 mm; (e,f) cell size = 3 mm, strut size = 0.8 mm.
Processes 12 02663 g002
Figure 3. Optical images of Gyroid TPMS as built: (a,b) cell size = 3 mm, strut size = 0.4 mm; (c,d) cell size = 5 mm, strut size = 0.34 mm.
Processes 12 02663 g003
Figure 4. Slurry rheological behavior.
Processes 12 02663 g004
Figure 5. Ni-alloy BCC coated (Ø = 1 cm, L. = 1.5 cm, catalyst = 5 wt% Ru/Al2O3); (a,b) cell size = 3 mm, strut size = 0.4 mm, catalyst loading ≈ 0.23 g/cm3; (c,d) cell size = 3 mm, strut size = 0.6 mm, catalyst loading ≈ 0.2 g/cm3; (e,f) cell size = 3 mm, strut size = 0.8 mm, catalyst loading ≈ 0.2 g/cm3.
Processes 12 02663 g005
Figure 6. Ni-alloy Kelvin coated (Ø = 1 cm, L = 1.5 cm, catalyst = 5 wt% Ru/Al2O3); (a,b) cell size = 3 mm, strut size = 0.4 mm, catalyst loading ≈ 0.2 g/cm3; (c,d) cell size = 3 mm, strut size = 0.6 mm, catalyst loading ≈ 0.2 g/cm3; (e,f) cell size = 3 mm, strut size = 0.8 mm, catalyst loading ≈ 0.19 g/cm3.
Processes 12 02663 g006
Figure 7. Ni-alloy Gyroid coated (Ø = 1 cm, L = 1.5 cm, catalyst = 5 wt% Ru/Al2O3); (a,b) cell size = 3 mm, strut size = 0.4 mm, catalyst loading ≈ 0.21 g/cm3; (c,d) cell size = 5 mm, strut size = 0.34 mm, catalyst loading ≈ 0.19 g/cm3.
Processes 12 02663 g007
Figure 8. Comparison between bare and coated (catalyst = 5 wt% Ru/Al2O3) BCC POCS; influence of different strut sizes (0.4, 0.6, 0.8 mm) at fixed cell size (3 mm) on pressure drop.
Processes 12 02663 g008
Figure 9. Comparison between bare and coated (catalyst = 5 wt% Ru/Al2O3) Kelvin POCS; influence of different strut sizes (0.4, 0.6, 0.8 mm) at fixed cell size (3 mm) on pressure drop.
Processes 12 02663 g009
Figure 10. Comparison between bare and coated (catalyst = 5 wt% Ru/Al2O3) Gyroid TPMS; influence of different cell sizes (3 and 5 mm) and strut size (0.34 and 0.4 mm) on pressure drop.
Processes 12 02663 g010
Figure 11. Performances of Ni-alloy Kelvin POCS (Kelvin 0.6: cell size = 3 mm, strut diameter = 0.6 mm) activated by 5 wt% Ru/Al2O3 (catalyst loading = 0.234 g, 0.2 g/cm3), with the influence of WSV. (a) ammonia conversion, (b) hydrogen productivity. Operating conditions: He = 54% vol., NH3 = 46% vol., p = 1 bar, T = 400–600 °C, WSV: 26,154 cm3gcat−1 h−1 (total flow = 102 cm3 min−1), WSV: 38,974 cm3gcat−1 h−1 (total flow = 152 cm3 min−1), WSV: 52,564 cm3gcat−1 h−1 (total flow = 205 cm3 min−1).
Processes 12 02663 g011aProcesses 12 02663 g011b
Figure 12. Performances of Ni-alloy Kelvin POCSs activated by 5 wt% Ru/Al2O3; influence of strut size (0.4, 0.6, 0.8 mm) at constant cell size (3 mm). Kelvin 0.4: (catalyst loading = 0.202 g, 0.17 g/cm3, WSV = 30,149 cm3gcat−1 h−1), Kelvin 0.6: (catalyst loading = 0.234 g, 0.2 g/cm3, WSV = 26,154 cm3 gcat−1 h−1), Kelvin 0.8: (catalyst loading = 0.225 g, 0.19 g/cm3, WSV = 27,067 cm3gcat−1 h−1). (a) ammonia conversion, (b) hydrogen productivity. Operating conditions: He = 54% vol., NH3 = 46% vol., p = 1 bar, T = 400–600 °C, total flow = 102 cm3 min−1, GHSV = 5172 h−1.
Processes 12 02663 g012
Figure 13. Performances of Ni-alloy BCC POCSs activated by 5 wt% Ru/Al2O3; influence of strut size (0.4, 0.6, 0.8 mm) at constant cell size (3 mm). BCC 0.4: (catalyst loading = 0.272 g, 0.23 g/cm3, WSV = 22,390 cm3gcat−1 h−1), BCC 0.6: (catalyst loading = 0.232 g, 0.2 g/cm3, WSV = 26,250 cm3gcat−1 h−1), BCC 0.8: (catalyst loading = 0.241 g, 0.2 g/cm3, WSV = 25,270 cm3gcat−1 h−1). (a) ammonia conversion, (b) hydrogen productivity. Operating conditions: He = 54% vol., NH3 = 46% vol., p = 1 bar, T = 400–600 °C, total flow = 102 cm3 min−1, GHSV = 5172 h−1.
Processes 12 02663 g013
Figure 14. Performances of Ni-alloy Gyroid TPMS structures activated by 5 wt% Ru/Al2O3, influence of Strut size (0.4, 0.34 mm) and cell size (5, 3 mm). Gyroid 0.34: (Cell size = 5, catalyst loading = 0.225 g, 0.19 g/cm3, WSV = 27,067 cm3gcat−1 h−1), Gyroid 0.4: (Cell size = 3, catalyst loading = 0.255 g, 0.21 g/cm3, WSV = 23,882 cm3gcat−1 h−1). (a) ammonia conversion, (b) hydrogen productivity. Operating conditions: He = 54% vol., NH3 = 46% vol., p = 1 bar, T = 400–600 °C, total flow = 102 cm3 min−1, GHSV = 5172 h−1.
Processes 12 02663 g014
Figure 15. Performances of Ni-alloy structures activated by 5 wt% Ru/Al2O3, influence of strut size (0.4, 0.34 mm) and cell size (5, 3 mm). Gyroid 0.34 (cell size = 5, catalyst loading = 0.225 g, 0.19 g/cm3, WSV = 27,067 cm3gcat−1 h−1), BCC 0.6: (catalyst loading = 0.232 g, 0.2 g/cm3, WSV = 26,250 cm3gcat−1 h−1), Kelvin 0.6: (catalyst loading = 0.234 g, 0.2 g/cm3, WSV = 26,154 cm3gcat−1 h−1). (a) ammonia conversion, (b) hydrogen productivity. Operating conditions: He = 54% vol., NH3 = 46% vol., p = 1 bar, T = 400–600 °C, total flow = 102 cm3 min−1, GHSV = 5172 h−1.
Processes 12 02663 g015aProcesses 12 02663 g015b
Table 1. Bare POCS and TPMS features.
Cell
Type
Cell
Size
(mm)
Strut/Sheet
Size
(mm)
Solid Volume
(cm3)
Solid
Density
(g/cm3)
Internal
Surface Area
(cm2)
Porosity
(%)
Surface/Solid Vol.
(SSA-cm2/cm3)
Cat. Layer
Thickness
(µm)
BCC 0.43
(3 *)
0.4
(0.4 *)
0.099
(0.163 **)
11.31
(8.3 **)
9.4792.1
(86.17 ***)
95.66(17.24 ****)
BCC 0.63
(3 *)
0.6
(0.59 *)
0.220
(0.284 **)
8.86
(8.40 **)
12.9483.3
(75.89 ***)
58.82(23.92 ****)
BCC 0.83
(3 *)
0.8
(0.75 *)
0.395
(0.392 **)
4.41
(3.41 **)
15.4171.5
(66.71 ***)
39.01(37.46 ****)
Kelvin 0.43
(3.04 *)
0.4
(0.44 *)
0.126
(0.213 **)
14.21
(8.40 **)
11.2190.4
(81.94 ***)
88.97(13.77 ****)
Kelvin 0.63
(3 *)
0.6
(0.61 *)
0.290
(0.344 **)
10.14
(8.50 **)
15.2378.7
(70.75 ***)
52.52(27.02 ****)
Kelvin 0.83
(3 *)
0.8
(0.81 *)
0.518
(0.569 **)
9.42
(8.53 **)
16.9364.4
(51.64 ***)
32.68(41.74 ****)
Gyroid 0.43
(3.10 *)
0.4
(0.41 *)
0.476
(0.624 **)
11.12
(8.49 **)
23.0159.6
(47.01 ***)
48.34(28.22 ****)
Gyroid 0.345
(5.18 *)
0.34
(0.34 *)
0.245
(0.325 **)
11.26
(8.49 **)
14.5179.2
(72.40 ***)
59.22(26.11 ****)
In brackets measured/calculated values: * measured from optical images; ** calculated from He pycnometer measurement; *** calculated from the geometrical measurement and measured solid volume; **** theoretical catalytic thickness calculated from Equation (2).
Table 2. Slurry composition used in this study for the activation of the structured supports.
SlurryCatalystPowder
Catalyst (%)
Glycerol
(%)
PVA
(%)
Water
(%)
Slurry
Density (g/cm3)
5 g5 wt% Ru/Al2O3
Engelhard
22.442.501.5033.601.4
Table 3. Comparison of geometric parameters of bare Kelvin, BCC, and Gyroid structures and related productivity performances at 450 °C.
Structure
Type
Cell Size
(mm)
Strut/Sheet
Size
(mm)
Solid Volume (cm³)Mass of
Support
(g)
Surface/Volume
Ratio
(cm2/cm3)
HPUV (T 450 °C)
(mmol H2 min−1/
Vol. Support, cm3)
HPUW (T 450 °C)
(mmol H2 min−1/
Weight Support, g)
Kelvin 0.630.60.2902.9352.521.610.65
BCC 0.630.60.2202.3858.821.780.88
Gyroid 0.3450.340.3252.7659.222.130.91
Disclaimer/Publisher’s Note: The statements, opinions and data contained in all publications are solely those of the individual author(s) and contributor(s) and not of MDPI and/or the editor(s). MDPI and/or the editor(s) disclaim responsibility for any injury to people or property resulting from any ideas, methods, instructions or products referred to in the content.

