Article

Lacustrine Shale Oil Occurrence State and Its Controlling Factors: A Case Study from the Jurassic Lianggaoshan Formation in the Sichuan Basin

by
Shaomin Zhang
1,2,*,
Ruiying Guo
1,
Qingsong Tang
3,
Haitao Hong
1,2,
Chunyu Qin
1,
Shuangfang Lu
4,
Pengfei Zhang
4,
Tengqiang Wei
1,
Keyu Pan
3 and
Zizhi Lin
5
1
Exploration and Development Research Institute, Southwest Oil & Gas Field Company, PetroChina, Chengdu 610041, China
2
Shale Gas Evaluation and Exploitation Key Laboratory of Sichuan Province, Chengdu 610213, China
3
Southwest Oil & Gas Field Company, PetroChina, Chengdu 610051, China
4
Sanya Offshore Oil & Gas Research Institute, Northeast Petroleum University, Sanya 572025, China
5
School of Geosciences, China University of Petroleum (East China), Qingdao 266580, China
*
Author to whom correspondence should be addressed.
Processes 2024, 12(12), 2617; https://doi.org/10.3390/pr12122617
Submission received: 27 June 2024 / Revised: 28 August 2024 / Accepted: 21 September 2024 / Published: 21 November 2024
(This article belongs to the Special Issue Exploration, Exploitation and Utilization of Coal and Gas Resources)

Abstract

:
To reveal the shale oil occurrence state and its controlling factors of the Jurassic Lianggaoshan Formation in the Sichuan Basin, experimental analyses, including total organic content, X-ray diffraction, low-temperature nitrogen adsorption-desorption, nuclear magnetic resonance, conventional, and multistage rock-eval, were conducted on the shale samples. The shale oil occurrence state, the amount/proportion of adsorbed/free oil, and their control factors were clarified. Moreover, the classification evaluation standard of shale oil resources was then determined. The results show that the selected shales are characterized by large oil contents. Total oil ranges from 0.08 mg/g to 10.06 mg/g (mean 2.82 mg/g). Adsorbed oil is between 0.03 mg/g and 5.66 mg/g (1.64 mg/g), while free oil spans from 0.05 mg/g to 4.94 mg/g (1.21 mg/g). The higher the total oil content, the higher the free oil content, indicating that the free oil sweet spot corresponds to the shale oil resource sweet spot. Shale oil is mainly adsorbed in organic matter; the larger TOC content results in the higher adsorbed oil content. Residual shale oil primarily occurs in pores less than 100 nm in diameter, and a higher pore volume corresponds to a higher total oil content. The shale oil enrichment resources refer to the shale with the TOC > 1.5%, S1 > 1.5 mg/g, and S1/TOC > 45 mg/g. This study is helpful for the prediction of shale oil resources and optimizing sweet spots in the Jurassic Lianggaoshan Formation of the Sichuan Basin.

1. Introduction

Shale oil refers to mature oil in organic shale layers with no production or below the production limit [1]. Shale oil is characterized by a considerable resource, with technically recoverable resources amounting to about 61.8 billion tons. The USA has the most enormous shale oil resources, followed by Russia and China [2]. Based on horizontal well and hydraulic fracturing technology, the exploration and development of shale oil in the USA have wildly succeeded, and shale oil production is proliferating [3]. Therefore, more and more scholars are paying attention to shale oil. Recently, breakthroughs have been made in exploration and developments of shale oil in China, such as Fengcheng and Luchaogou Formations in Junggar Basin, Yanchang Formation in Ordos Basin, Shahejie Formation in Bohai Bay Basin, Qingshankou Formation in Songliao Basin, Jurassic in Sichuan Basin, Funing Formation in Subei Basin, etc. [4,5,6,7,8,9]. However, compared with shale oil in the USA, lacustrine shale oil in China is characterized by high viscosity and poor fluidity, and lacustrine shales have high contents of clay minerals but lower brittle minerals (such as quartz and feldspar) [10]. This results in the shale oil content and its occurrence state being particularly important for exploring and developing lacustrine shale oil.
Recently, various techniques have been proposed to disclose the content and micro-occurrence of shale oil. The pyrolysis parameter S1 and chloroform-extractable bitumen “A” are generally used to estimate shale oil contents. Recently, the improved Rock-Eval technique (multistage Rock-Eval, mult-R-E) established by Jiang et al. has been used to obtain contents of shale oil in different states, which are called light oil (S1-1), light-medium oil (S1-2), and heavy oil (S2-1) [11]. Both S1-1 and S1-2 are regarded as free oil, while S2-1 is adsorbed oil. The mult-R-E has been commonly used to determine the free and adsorbed oil contents in shales [12,13].
Meanwhile, a multi-step extraction method has been proposed to clarify adsorbed and free oil contents by organic solvents with different polarities [14]. Combined with low-temperature nitrogen adsorption-desorption (LTNA/D) and mercury intrusion capillary pressure (MICP), the micro-occurrence of adsorbed and free oil can be well disclosed [12,15,16]. Moreover, molecular dynamics simulation is regarded as an effective method to reveal the micro-occurrence characteristics of shale oil, and the characteristics of shale oil occurrence in nanopores can be visually displayed [17,18,19]. The nuclear magnetic resonance (NMR) T1-T2 technique can directly reveal shale oil occurrence states, and adsorbed oil, free oil, and bound water can be determined [19,20,21,22].
Lacustrine shales in the Jurassic Lianggaoshan Formation in the Sichuan Basin, characterized by high abundance and mature organic matter, are the vital target intervals for shale oil exploration [23]. This study aims to reveal the states of shale oil occurrence and the controlling factors of the Lianggaoshan Formation. In this paper, the shale samples were collected from Well XQ1 in the Central Sichuan Basin. A series of experiments, such as total organic content (TOC), conventional and multistage Rock-Eval, X-ray diffraction (XRD), LTNA/D, and NMR T2 and T1-T2, were conducted to obtain the contents and occurrence states of shale oil.

2. Samples and Experiments
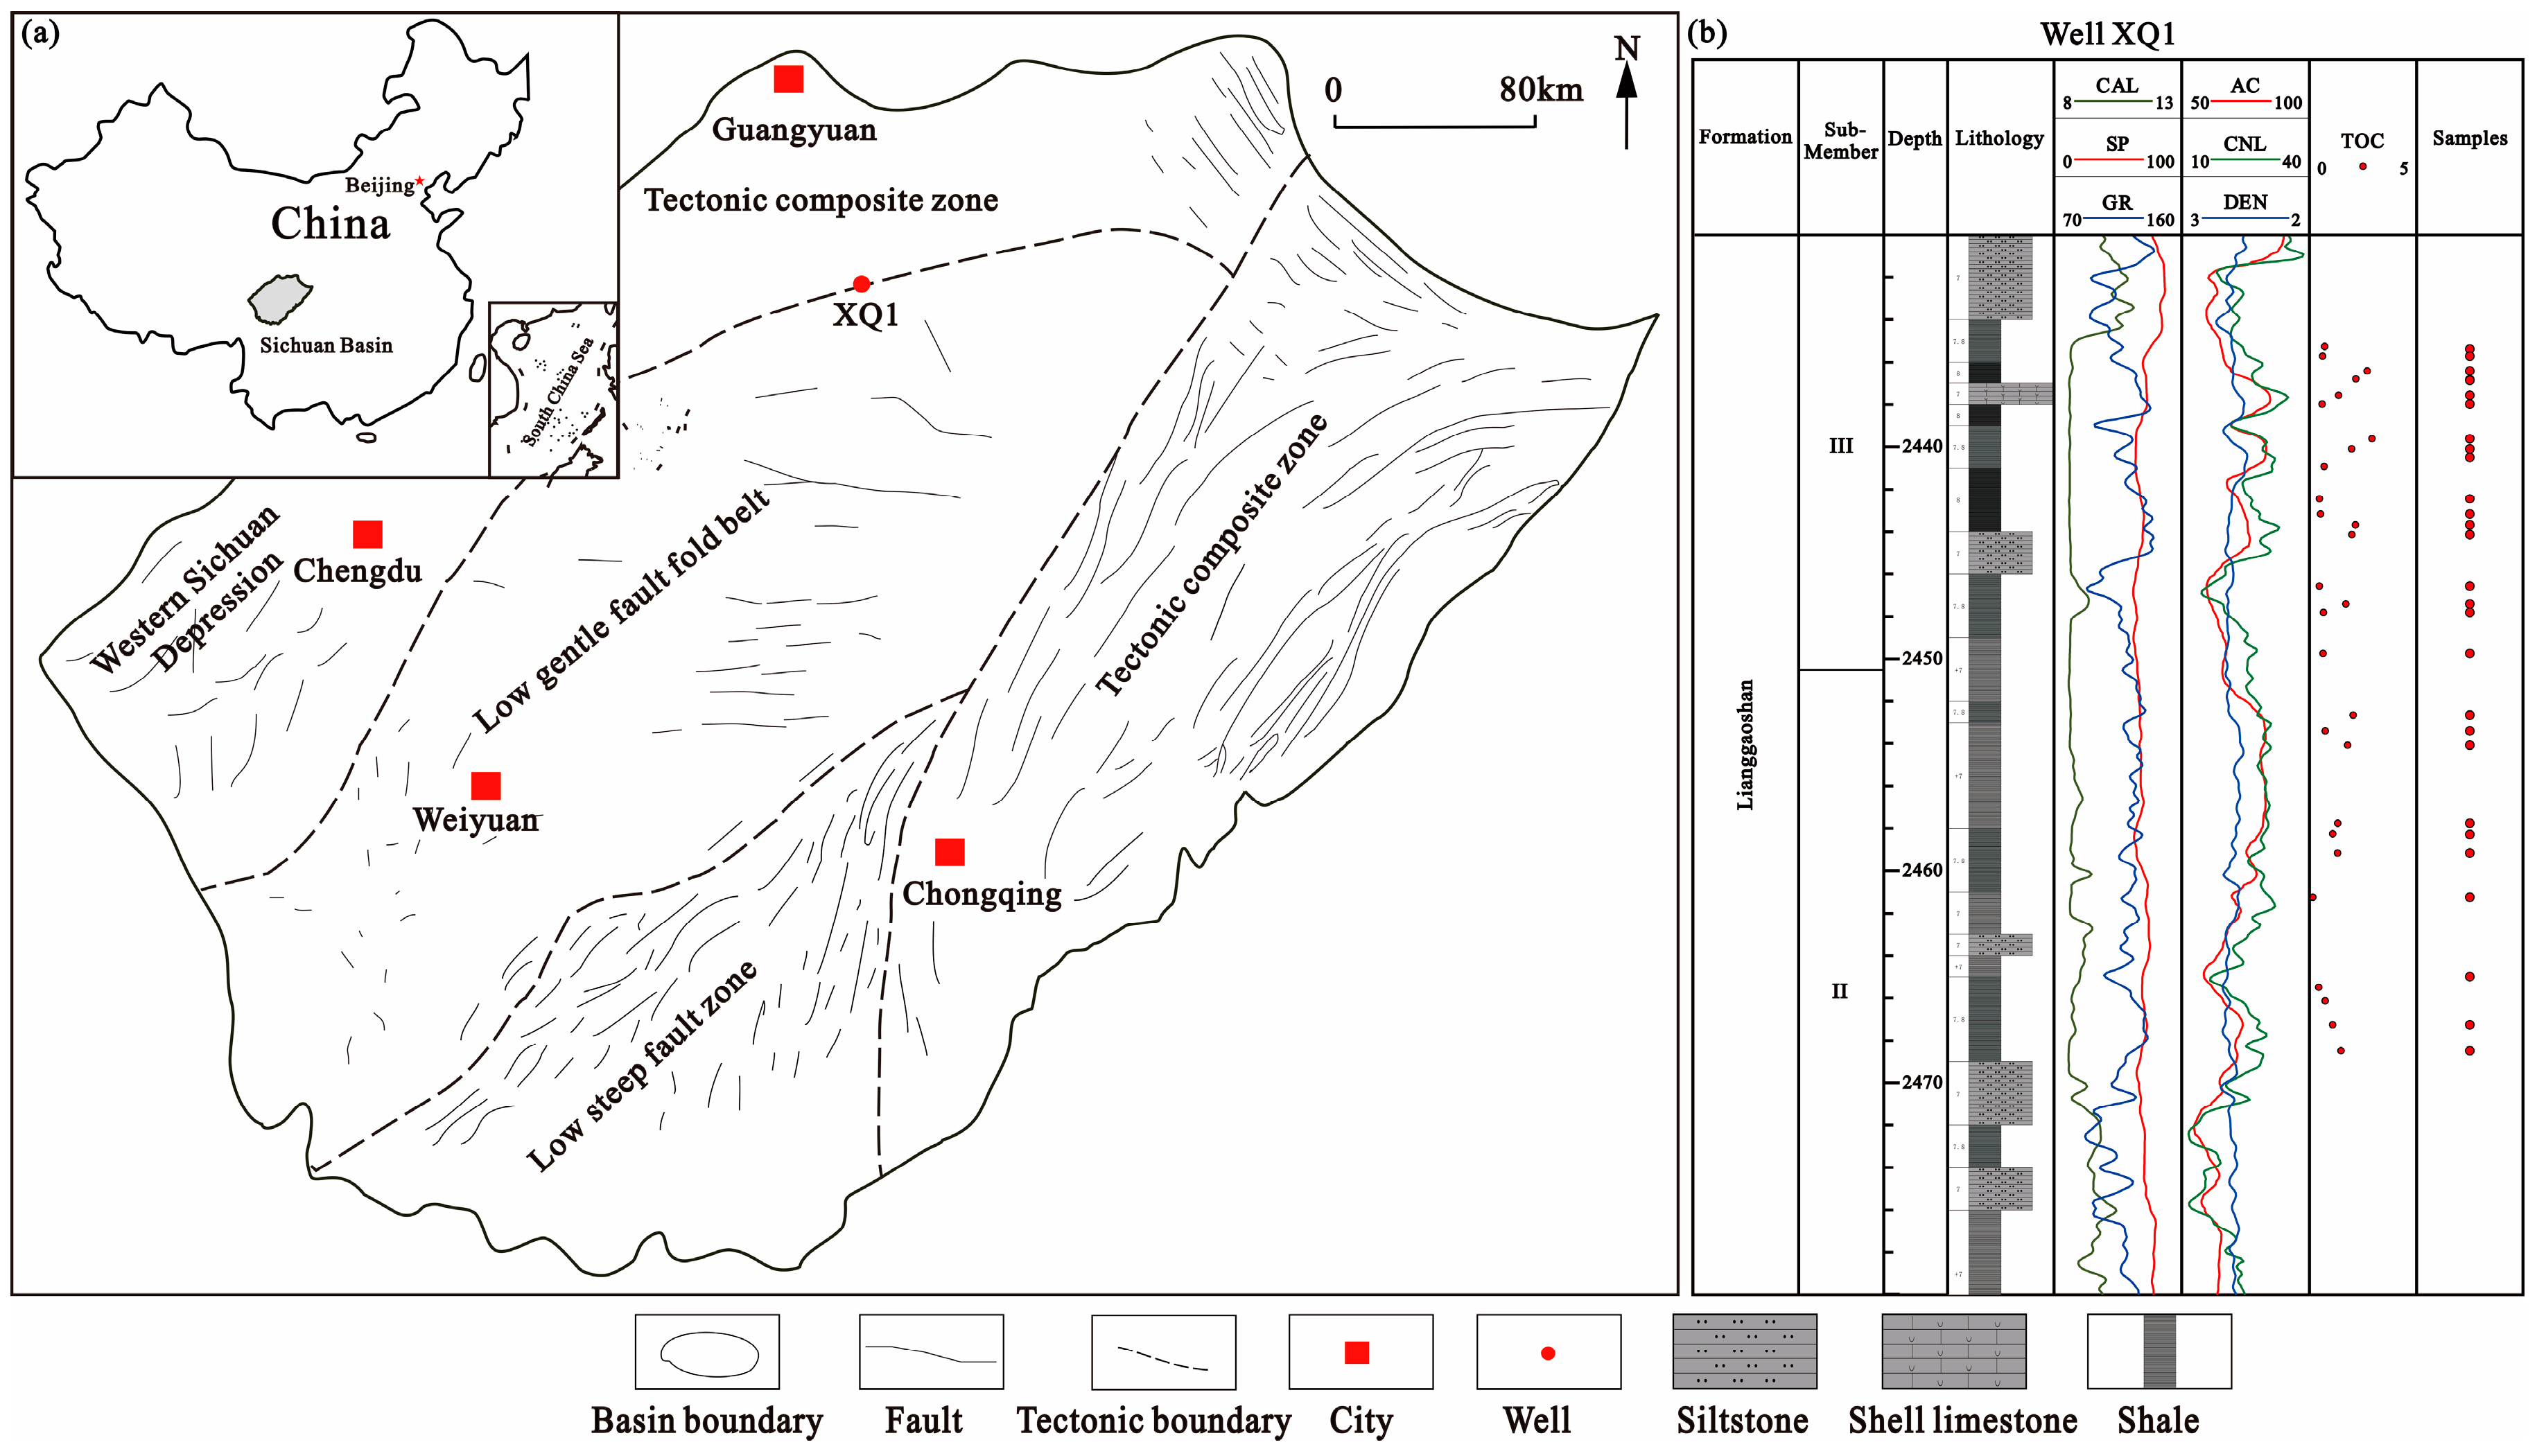
2.1. Samples

The Sichuan Basin is in the northwest of the Yangtze Paraplatform, primarily located in Sichuan Province, with an area of about 260,000 km2 (Figure 1a). The Jurassic is an inherited sedimentary system based on the Triassic lake basin, which develops a set of terrestrial clastic deposits mainly composed of delta inland lakes [24]. From bottom to top, the Jurassic consists of Ziliujing Formation, Lianggaoshan Formation, Shaximiao Formation, Suining Formation, and Penglaizhen Formation [25]. The Lianggaoshan Formation is the fine-grained sediments, which can be divided into three members: the first, second, and lowest Lianggaoshan Members. During the sedimentation period of the low Lianggaoshan Member, three sets of organic-rich shales developed. In this study, a total of 29 shales were sampled from the shale oil exploration well XQ1, and the depth of samples ranges from 2430 m to 2470 m (Figure 1b). This study cut all the samples into plugs using a wire-cutting technique under anhydrous conditions. The core plugs were used to conduct NMR T2 and T1-T2 tests, while cuttings were used for TOC, Rock-Eval, XRD, and LTNA/D measurements.

2.2. Experiments

2.2.1. NMR Experiments

NMR tests were performed on a MesoMR 23-060H-I NMR spectrometer (Niumag, Suzhou, China) with a resonance frequency of 21.36 MHz for 1H at a relatively low magnetic field of 0.52 T. NMR T2 and T1-T2 spectra were obtained by CPMG (Carr-Purcell-Meiboom-Gill) and IR (Inversion Recovery)-CPMG sequences, respectively. The test parameters were set as follows: waiting time TW = 3000 ms, number of scans NS = 64, echo number NECH = 6000, and inverse time number NTI = 31. The echo time (TE) was set at an extremely low time of 0.07 ms, which allows all the pore fluid and part of pseudo-solid protons to be detected [26].

2.2.2. Conventional and Multistage Rock-Eval Tests

Both conventional and multistage Rock-Eval were carried out on the Rock-Eval VI. Prior to the tests, the core cuttings were crushed into powder larger than 100 mesh. During conventional Rock-Eval (C-R-E) measurements, S1 was first obtained at a constant temperature of 300 °C for 3 min, and S2 was then determined when the temperature was raised to 600 °C with a rate of 25 °C/min. S1 is generally regarded as a residual hydrocarbon for shale oil, while S2 is the pyrolysis hydrocarbons from both heavy hydrocarbons and kerogen. Mult-R-E includes four steps [11]. First, the temperature was set at a constant of 200 °C for 1 min to obtain S1-1. The temperature was increased to 350 °C with a rate of 25 °C/min subsequently to detect S1-2. When the temperature continues to rise to 450 °C at the same rate and remains constant for 1 min, the S2-1 can be determined. At last, the temperature continued to increase to 600 °C at the same rate to determine S2-2. Free oil refers to the S1-1 and S1-2, while S2-1 is the adsorbed oil. Total oil is the sum of free and adsorbed oil.

2.2.3. LTNA/D Measurements

Shale samples were first crushed into powder of grain sizes of 40–60 mesh (0.25–0.42 mm). Subsequently, the powder samples were wished oil by a mixed solvent of dichloromethane and acetone (3:1 in volume) at 0.25 MPa and 85 °C for seven days and then dried at 110 °C in a vacuum oven for 24 h. Prior to tests, the particles were dried at 383 K for 12 h in a vacuum oven. In this study, LTNA/D measurements were conducted on a Micromeritics ASAP 2460 specific surface area and porosity analyzer. Nitrogen adsorption-desorption isotherms were detected at the P/P0 between 0.01 and 0.993 at 77 K. Both specific surface area (SSA) and total pore volume (PV) were obtained from the adsorption branch. SSA was determined by the BET method, and the PV is the single pore volume. The BJH model was used to obtain pore size distribution. The pore volumes in different pore sizes, such as micropores (<25 nm), minipores (25–100 nm), and mesopores (100–1000 nm) [27], were determined by BJH pore size distributions.

3. Results

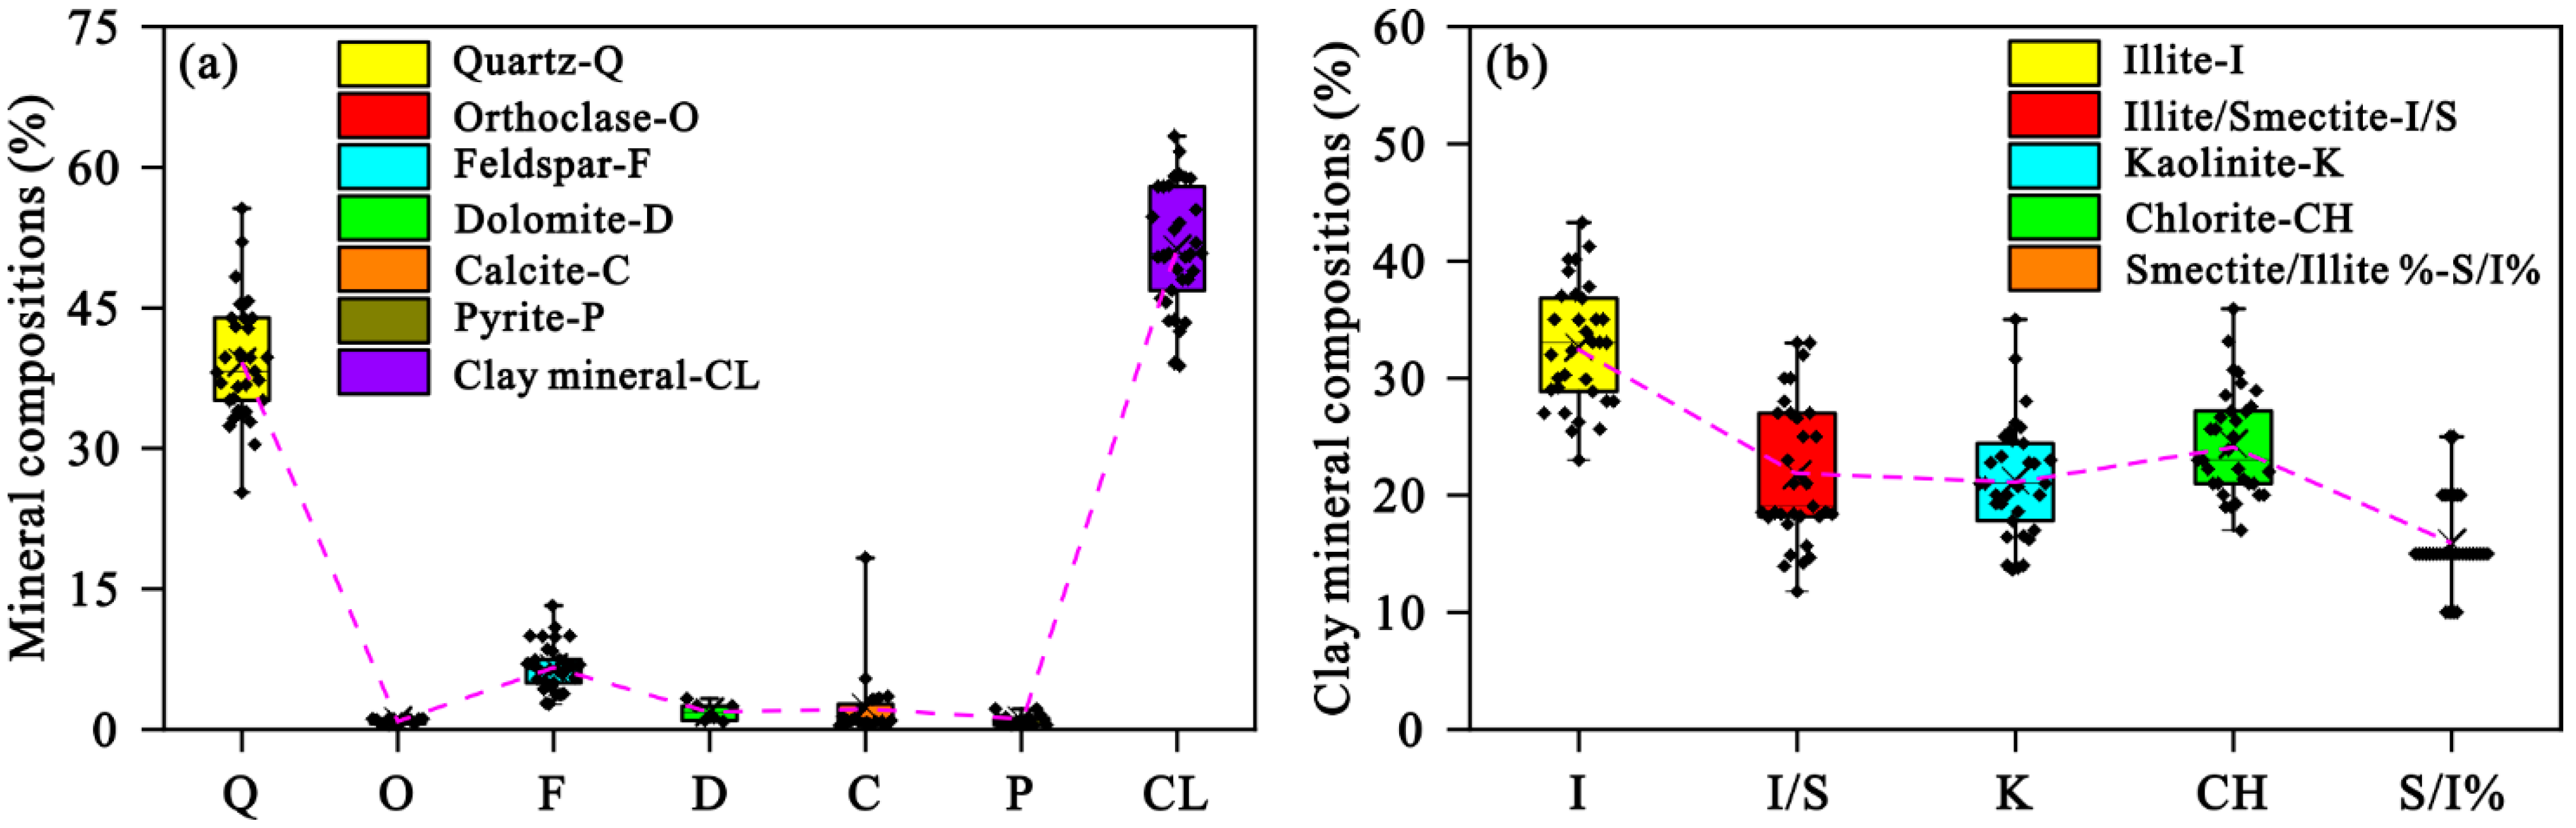
3.1. Characteristics of Studied Shales

The selected shales have high contents of organic matter, and the TOC contents range from 0.16% to 2.92%, with a mean of 1.30% (Table 1). As displayed in Figure 2, the organic matter types in the studied shales are diverse, including Types I, II1, II2, and III. Types I and II1 are the most developed. Meanwhile, Tmax values range from 438 °C to 454 °C, indicating that organic matter is mature.
The studied shales mainly consist of clay minerals and quartz (Figure 3a). The clay minerals are characterized by the largest content, ranging from 38.8% to 63.1%, with an average of 51.2%. Quartz varies from 25.3% to 55.6%, with a mean of 39.2%, followed by feldspar, calcite, orthoclase, and dolomite. There are various types of clay minerals, with illite having the largest contents (mean 33.0%), followed by chlorite (mean 24.2%), kaolinite (mean 21.5%), and illite/smectite (mean 21.3%), which has a low ratio of smectite/illite (mean 16.0%) (Figure 3b). Fracturability is a key indicator for evaluating the recoverability of shale oil, and brittle mineral content is one of the effective parameters for evaluating the fracturability of shale oil reservoirs [28]. The brittle mineral (quartz and feldspar) of the studied shales is between 29.1% and 60.5%, with a mean of 46.2%, implying that the selected shales are prone to fracturing to form cracks for shale oil flow.

3.2. Shale Oil Contents and Occurrence States

3.2.1. Shale Oil Contents

S1 obtained from the C-R-E is one of the most commonly used parameters to evaluate shale oil content, which is an effective indicator for residual hydrocarbon content in shale. The S1 contents of the studied shales are between 0.02 mg/g and 4.29 mg/g, with an average of 0.92 mg/g. This indicates that the shales in the Lianggaoshan Formation have high oil content with the development of high oil-bearing layers. Previous studies have shown that the triple division between TOC and S1 can be identified, such as in the Qingshankou and Nenjiang Formations in the Songliao Basin [13]. As the TOC increases, shale oil can be divided into scattered resources, low-efficient resources, and enriched resources. However, for shales in the Lianggaoshan Formation, S1 increases with the increase in TOC, but the trend of S1 increasing with TOC varies depending on the abundance of organic matter, as shown in Figure 4. In this study, the trend of S1 increasing with TOC content can be divided into three stages. When TOC content is lower than 0.8%, S1 is characterized by extremely low values of less than 0.2 ms/g. If the TOC content increases from 0.8% to 1.6%, S1 increases slowly. However, when TOC is larger than 1.6%, S1 is linearly correlated with TOC, and S1 increases rapidly as TOC increases. According to the triple division between TOC and S1, shale oil resources in the Lianggaoshan Formation can be classified into scattered resources (TOC < 0.8%, S1 < 0.2 mg/g), low-efficient resources (0.8% ≤ TOC < 1.6%, 0.2 mg/g ≤ S1 < 1.5 mg/g), and enriched resources (1.6% ≤ TOC, 1.5 mg/g ≤ S1).

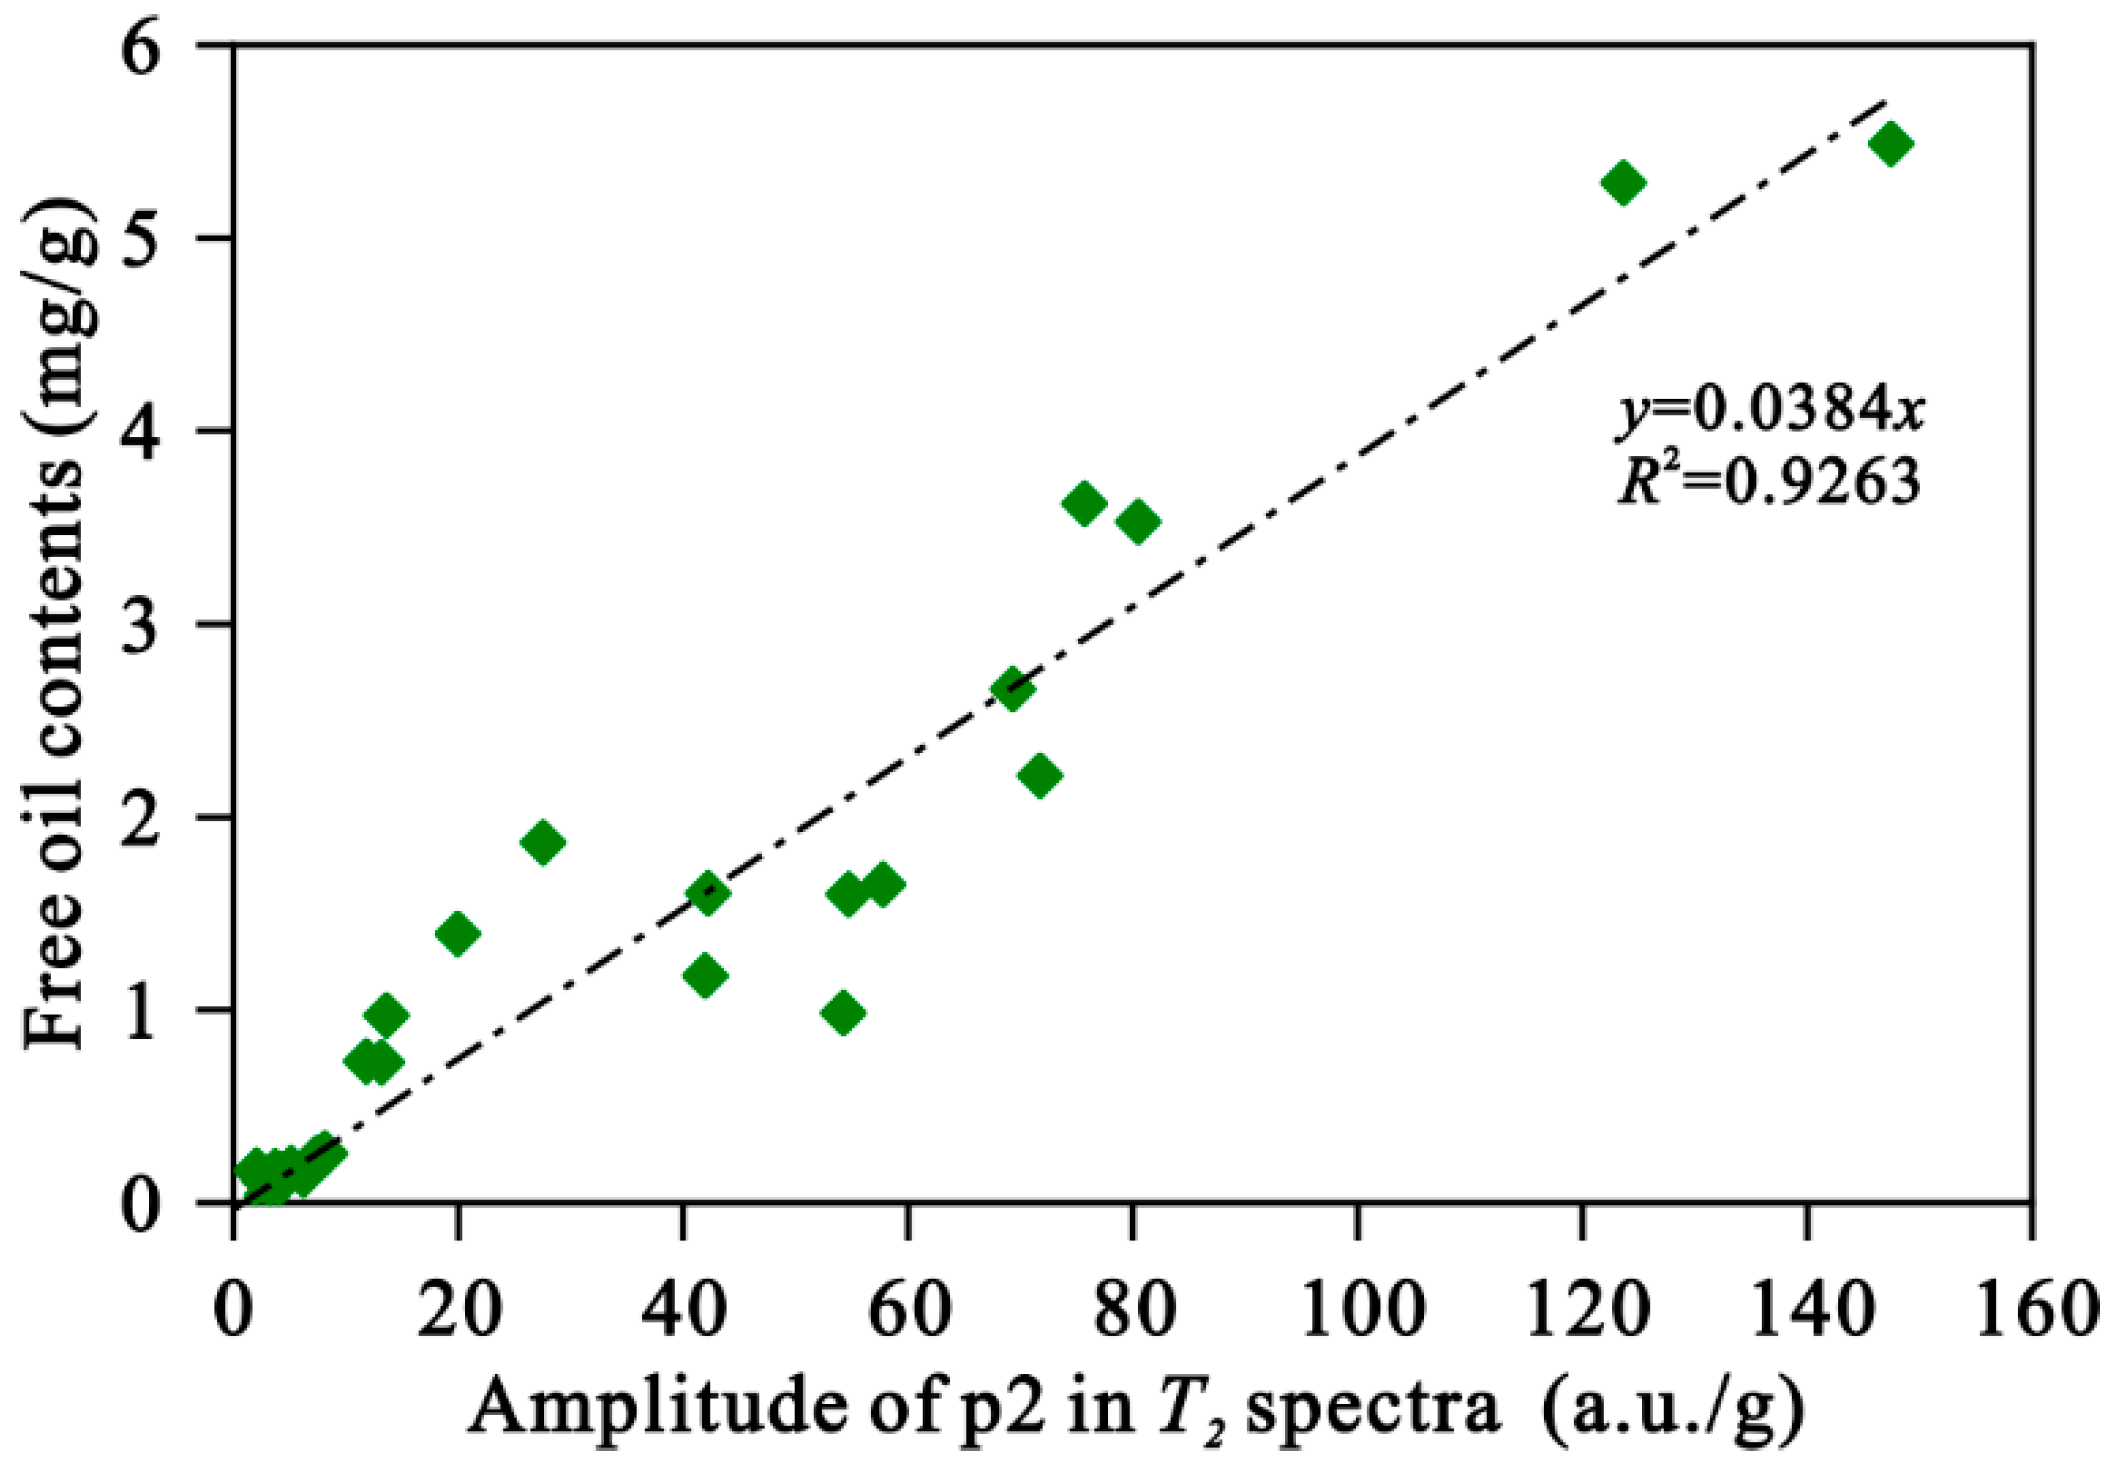
3.2.2. T2 and T1-T2 Spectra of As-Received Shales

The T2 spectra of as-received shales are bimodal, i.e., p1 (T2 < 1 ms) and p2 (T2 > 1 ms). The amplitude of p1 is much larger than that of p2, as shown in Figure 5. The T1-T2 spectra of shales at as-received states are displayed in Figure 6. According to the T1-T2 pattern of the shale oil reservoir in previous studies [20,22], bound water, adsorbed oil, and free oil can be identified based on the values of T2 and T1/T2. The T2 value of bound water is mainly less than 1 ms, with the center at about 0.1 ms, and the ratio of T1/T2 is approximately 5. Bound water is characterized by the elongated T1 distribution but lower T2 values, meaning that bound water has poor flowability.
Adsorbed oil is mainly located at T2 < 1 ms, with a T1/T2 ratio of about 100. On the contrary, for free oil, T1 and T2 are linearly correlated, with T2 larger than 1 ms, located at the line of T1/T2 ~ 20–30. This implies the optimal flowability of free oil. The signal amplitudes of free oil agree well with the contents of S1. Specifically, the signal amplitude of free oil in sample XQ1-13 is the largest, corresponding to the high content of S1 (4.29 ms/g). On the contrary, the signal amplitude of free oil in sample XQ1-21 is low due to the low content of S1 (1.29 mg/g). The T1-T2 spectra of as-received shales indicate that the T2 values of free oil are mainly larger than 1 ms, corresponding to the p2 in T2 spectra at the as-received state (Figure 5). Thus, the p2 peaks mainly reflect the free oil. As demonstrated in Figure 7, an excellent linear correlation can be observed between the amplitudes of p2 peaks and free oil contents, with a high correlation coefficient of 0.9263. The free oil is determined by mult-R-E tests, which will be detailed in Section 3.2.3. These results also imply that shale oil occurrence states can be well identified by T1-T2 spectra.

3.2.3. Shale Oil Contents in Different Occurrence States

Shale oil contents at different occurrence states can be accurately detected by multistage Rock-Eval measurements. The results of the multistage Rock-Eval are listed in Table 2. The light oil (S1-1) of the selected shales ranges from 0.01 mg to 0.38 mg/g, with a mean of 0.10 mg/g. The extremely low S1-1 contents indicate that most light oil escaped during sampling and pretreatment. The contents of S1-2 vary from 0.01 mg to 4.56 mg/g, with an average of 1.08 mg/g, while the contents of S2-1 (adsorbed oil) are large, ranging from 0.03 mg/g to 5.66 mg/g (mean 1.58 mg/g). The total oil content (sum of S1-1, S1-2, and S2-1) is between 0.08 mg/g and 10.60 mg/g, with an average of 2.75 mg/g. Free oil is the sum of S1-1 and S1-2, ranging from 0.08 mg/g to 10.60 mg/g, with a mean of 2.75 mg/g. And the average ratio of free oil is 45.17%, varying from 27.85% to 62.50%.

4. Discussion

Multiple factors, such as organic matter content, maturity, pore structure, mineral compositions, etc., control shale oil content and its occurrence states.

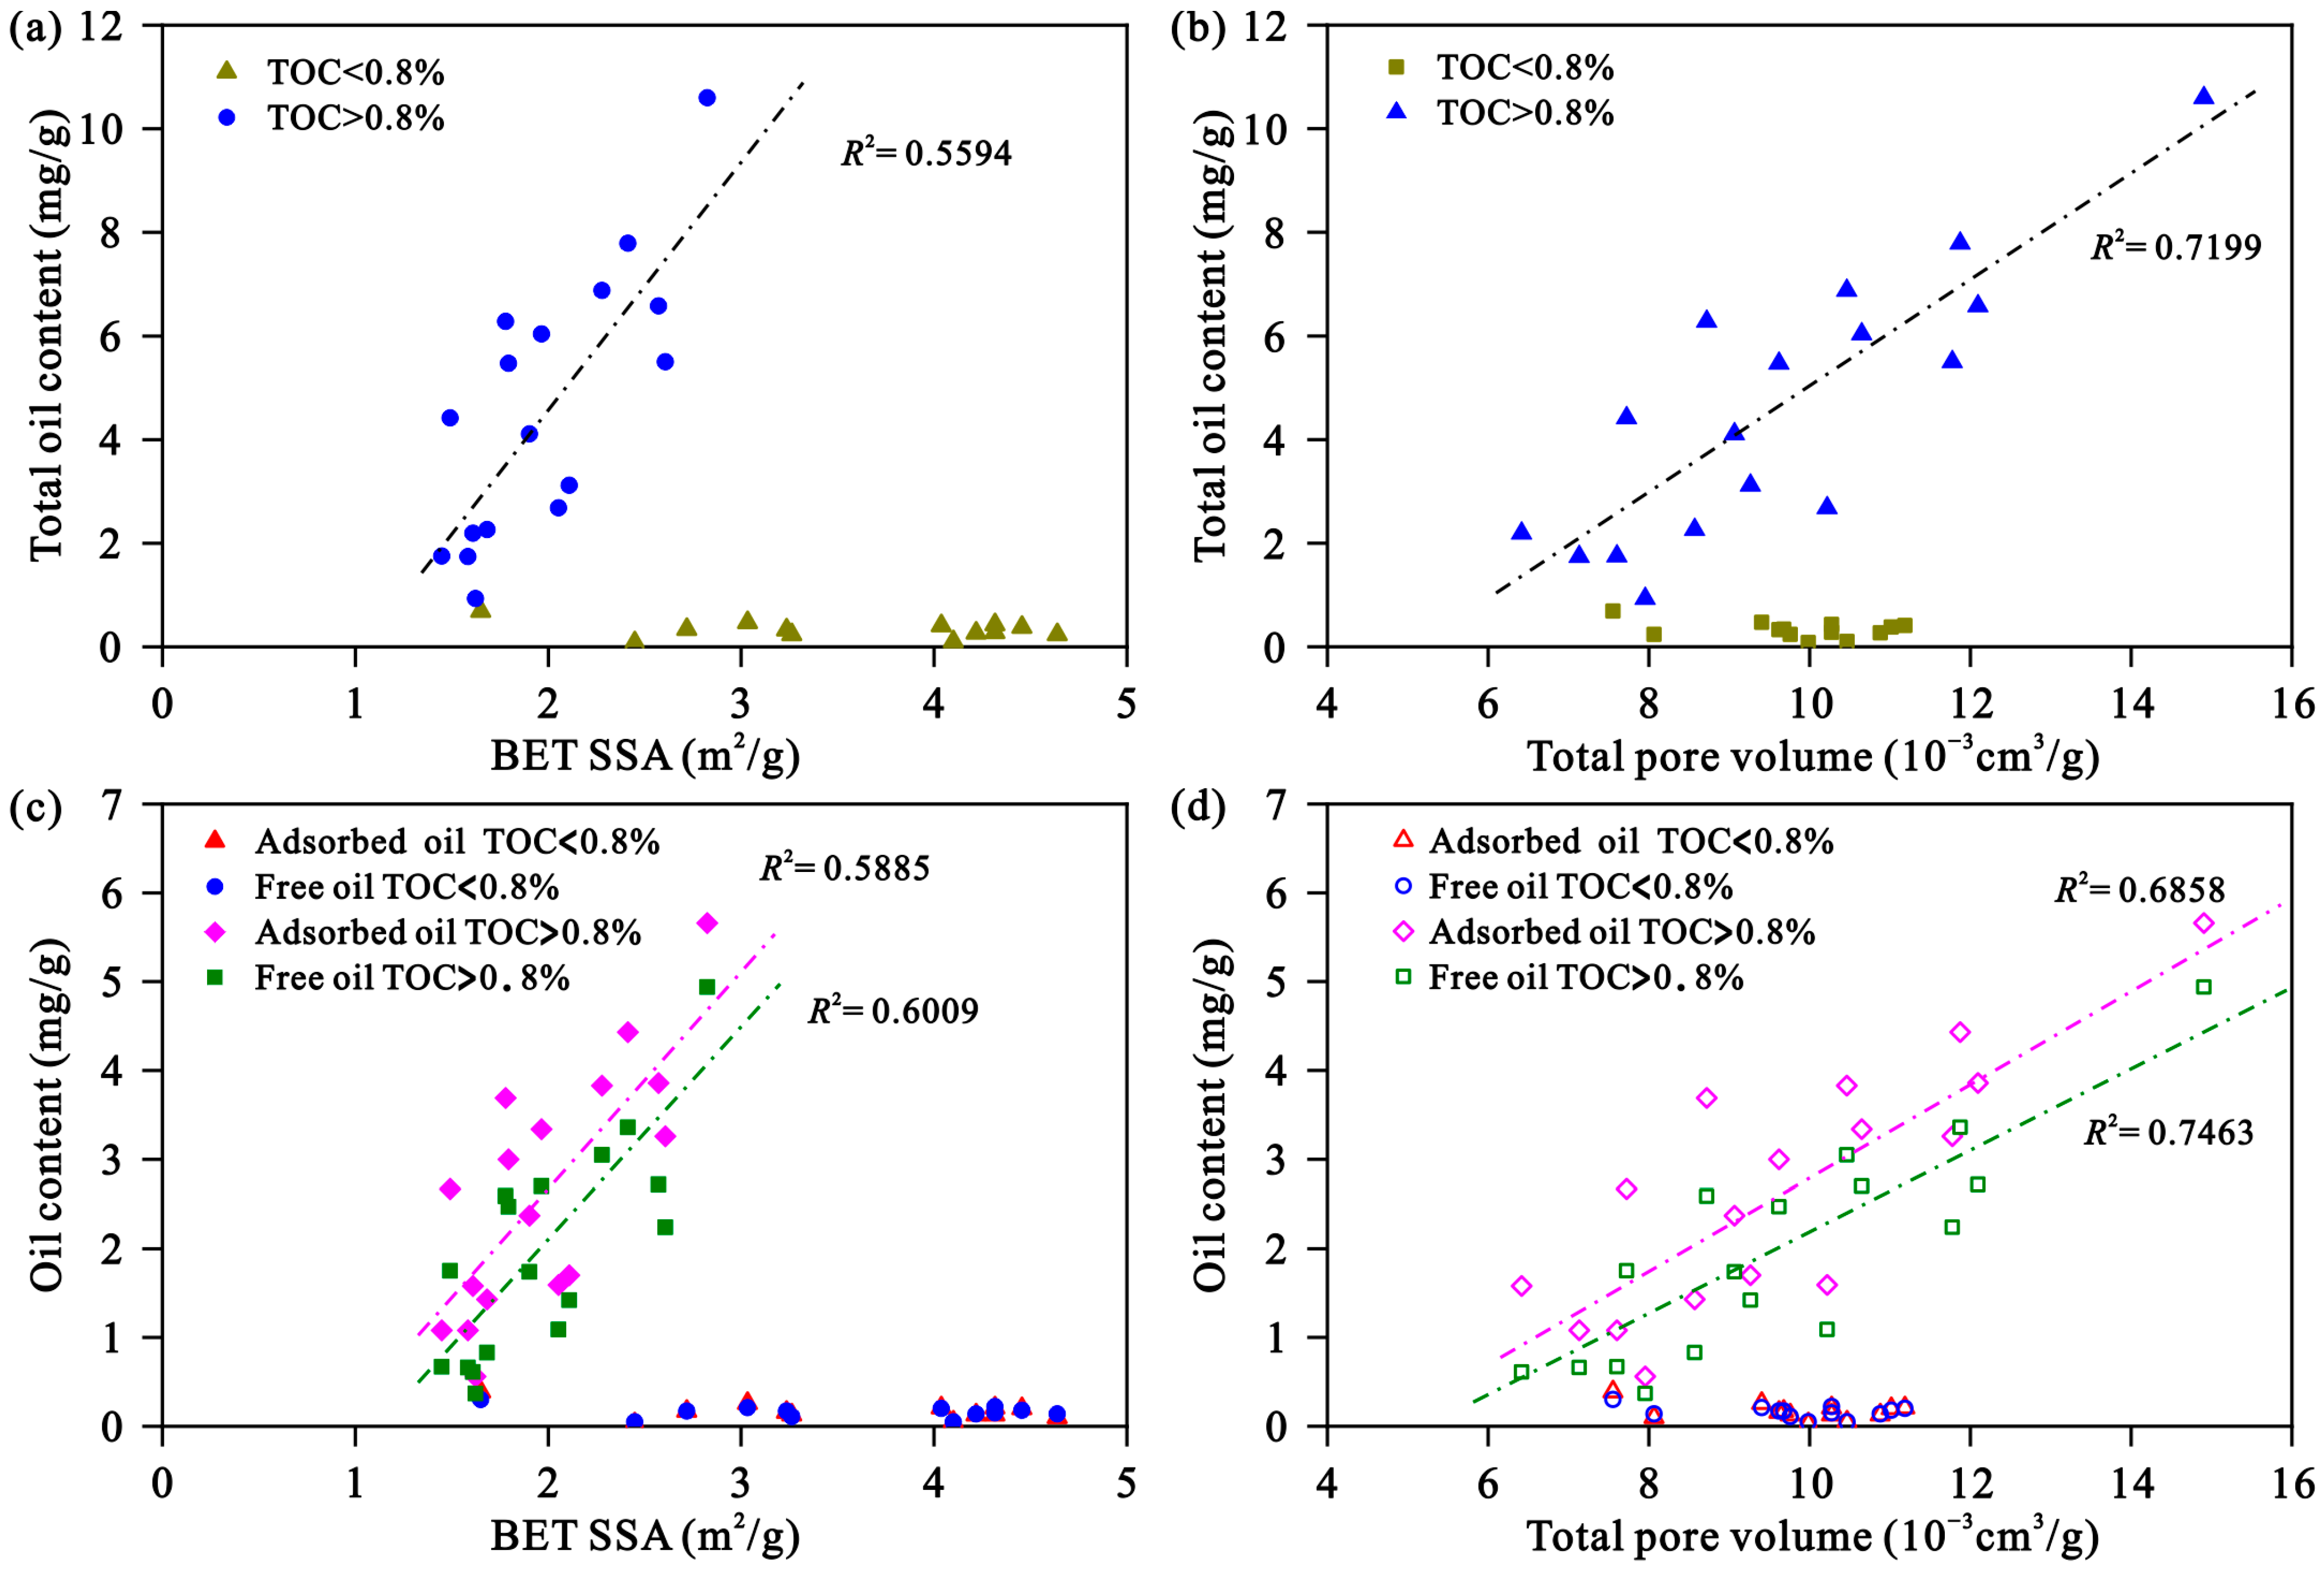
4.1. Organic Matter Content (TOC)

The adsorbed and free oil contents of studied shales in the Lianggaoshan Formation are mainly related to total oil contents. Both adsorbed and free oils linearly correlate well with total oil, as shown in Figure 8a, indicating that the larger total oil content generally corresponds to higher free content. Thus, the shale oil resource sweet spot refers to the free oil sweet spot [13,29]. Moreover, an excellent positive correlation exists between the total oil content and S1 (Figure 8b), indicating that light and heavy hydrocarbon corrections should be done when calculating shale oil resources using S1 [13]. The organic matter is the main adsorbent for oil in shale. Thus, the contents of adsorbed oil increase as the TOC contents increase, as displayed in Figure 8c. A similar phenomenon can be observed between TOC and free oil, as shown in Figure 4 and Figure 8d. As TOC contents increase, the trend of free oil can be divided into three stages. The contents of free oil are extremely low if the TOC contents are less than 0.8%. When the TOC contents are between 0.8% and 1.6%, the free oil contents slowly increase with the increase in TOC. However, when the TOC contents are larger than 1.6%, the free oil contents rapidly increase with the increase in TOC. Thus, when the TOC is greater than 1.6%, the shale has a higher free oil content, making it a favorable interval for shale oil.

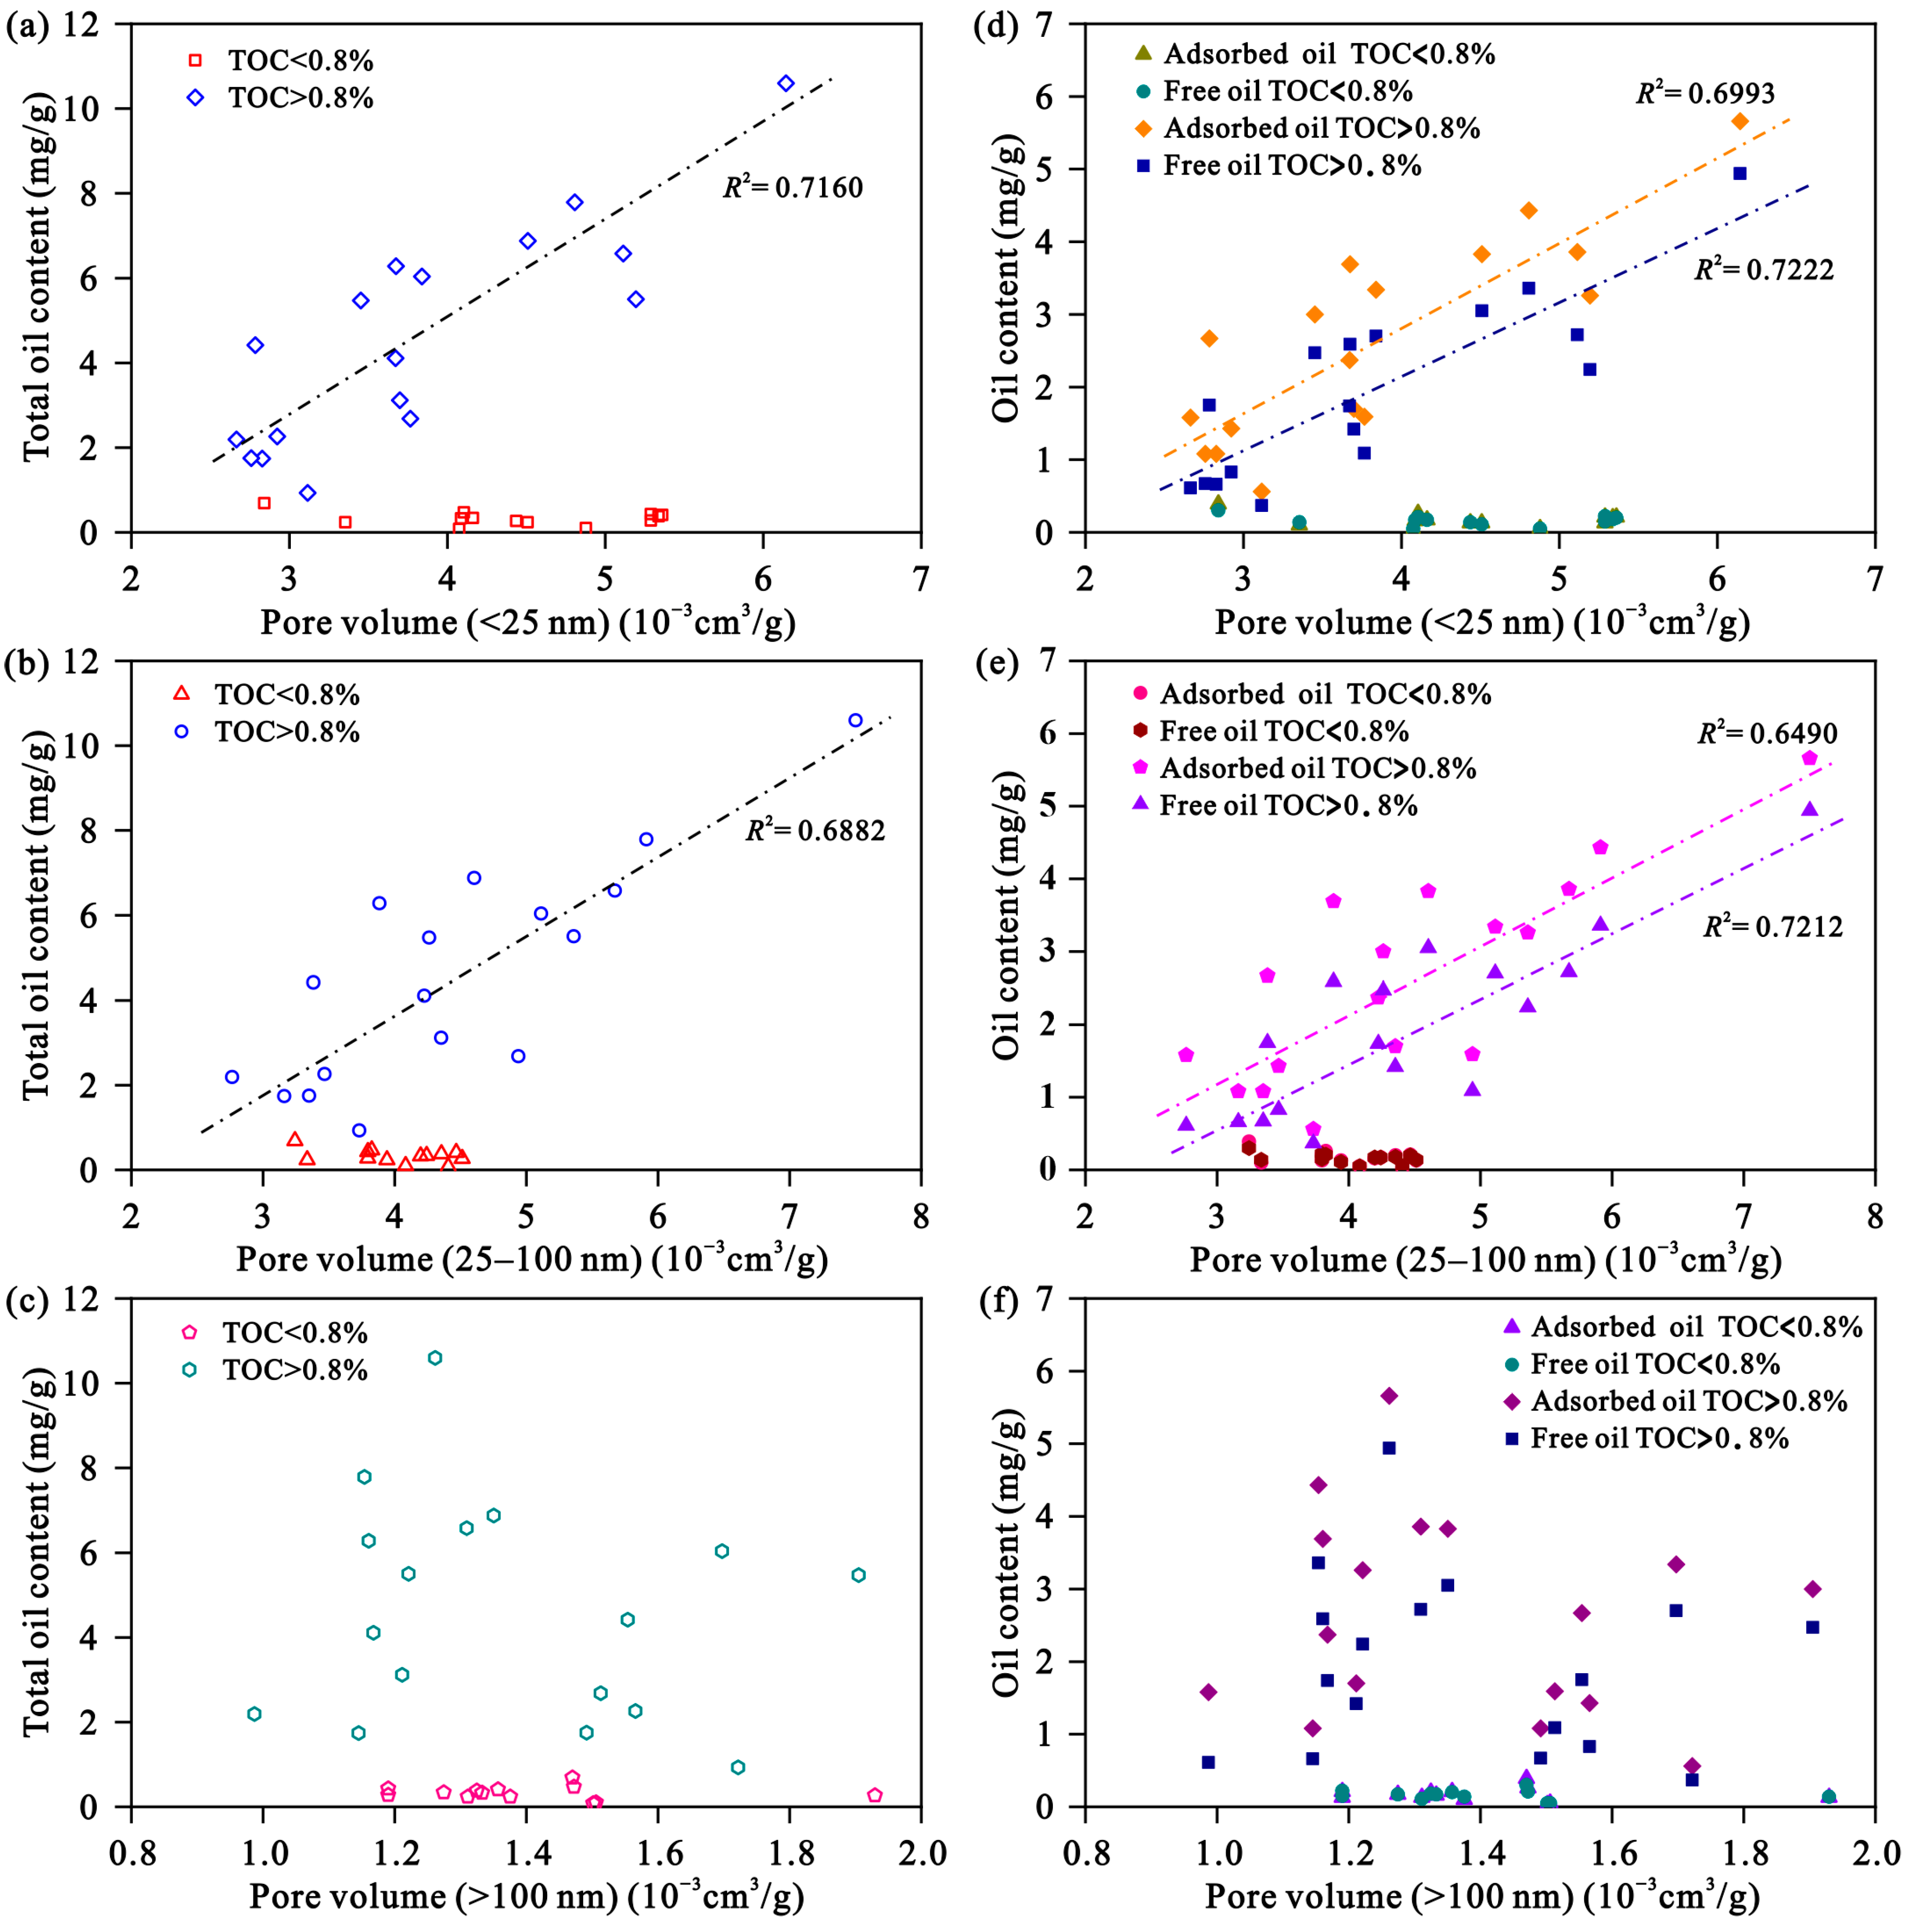
4.2. Micropore Structure

The micropore structure is one of the critical factors restricting the micro-occurrence characteristics of shale oil. To clarify the influence of micropore structure on the shale oil occurrence, in this study, the selected samples are divided into two categories based on the shale oil and TOC contents, such as TOC < 0.8% and TOC > 0.8%, respectively. As shown in Figure 4 and Figure 8d, when the TOC content is less than 0.8%, the shale oil content is extremely low. Thus, this study mainly discussed the influence of micropore structure on the oil occurrence of shale with TOC larger than 0.8%. As demonstrated in Figure 9a,b, the total oil contents of the studied shales increase with the BET SSA and PV increase. The larger BET SSA and pore volume correspond to more pore space for shale oil storage, resulting in a larger content of shale oil. Similar phenomena can also be observed for adsorbed and free oil. Both adsorbed and free oil increase as BET SSA and pore volume increase (Figure 9c,d).
Pores in various scales have different effects on the micro-occurrence of shale oil. Total oil correlates well with micropores and minipores, characterized by significant correlation coefficients of 0.7160 and 0.6882, respectively, as do adsorbed and free oil, as shown in Figure 10a,b,d,e. However, there is no correlation between mesopores and shale oil contents (total, adsorbed, and free oil) (Figure 10c,f). Thus, it can be concluded that the residual oil in the selected shales mainly occurs in the pores less than 100 nm (micropores and minipores). Moreover, it can also be found that the correlation coefficients of free oil and pore volumes in different sizes are the largest, followed by total oil and adsorbed oil (Figure 9 and Figure 10). Therefore, free oil is mainly controlled by pore volume. Free oil mainly occurs in the center of pores, and the more developed shale pores are, the larger the pores and the higher the content of free oil.

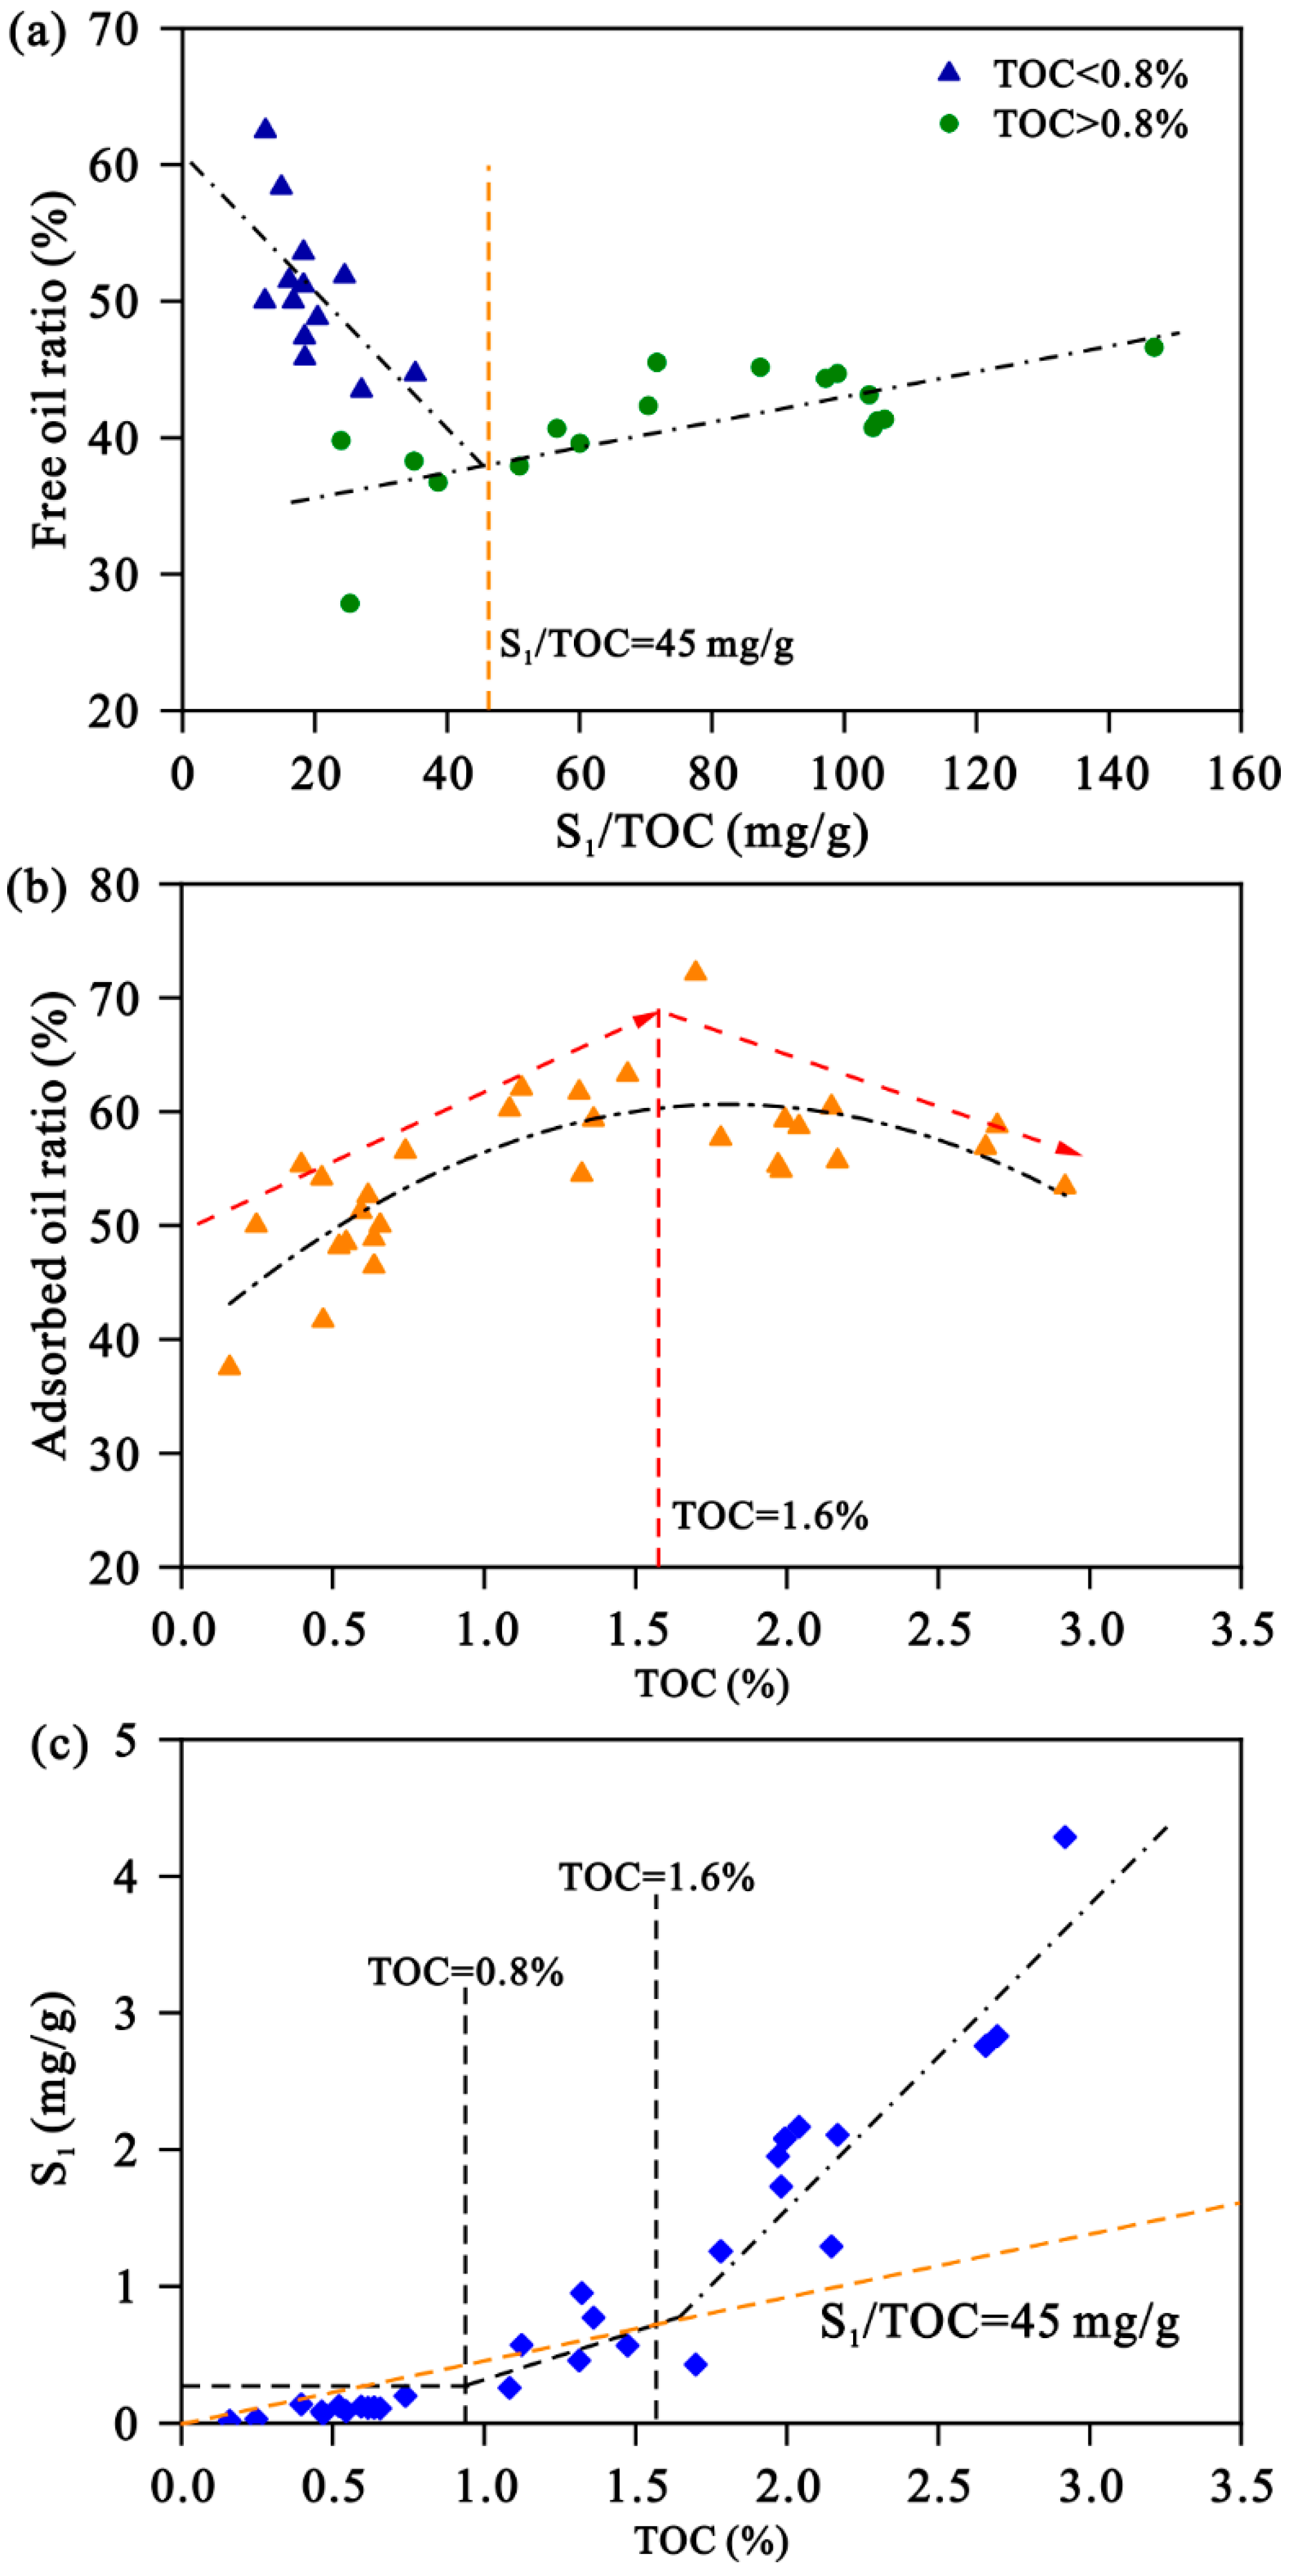
4.3. Classification Criteria of Shale Oil Resources

Two-stage distributions can be identified between free oil ratios and oil saturation index (OSI, S1/TOC), as shown in Figure 11a. Specifically, if TOC is less than 0.8%, as the OSI values increase, the free oil ratios decrease, and the OSI is all less than 45 mg/g. However, when TOC is larger than 0.8%, a positive correlation between the free oil ratio and OSI can be observed. When OSI is more than 45 mg/g, the free oil content and ratio are larger, implying that shale oil has good flowability [30]. As displayed in Figure 11b, the proportion of adsorbed oil increases first and then decreases with the increase in TOC. If TOC is less than 1.6%, a larger TOC content results in a higher proportion of adsorbed oil, while as TOC increases, the adsorbed oil proportion decreases when TOC is more than 1.6%. Thus, the classification criteria of shale oil resources in the Lianggaoshan Formation in the Sichuan Basin can be determined. As shown in Figure 11c, the enriched resource is characterized by a TOC larger than 1.6%, S1 more than 1.5 mg/g, and OSI larger than 45 mg/g, while the low-efficient resource has a TOC content between 0.8% and 1.6%, S1 ranging from 0.2 mg/g to 1.5 mg/g. However, the scattered resource corresponds to TOC less than 0.8, S1 less than 0.2 mg/g, and OSI less than 45 mg/g (Table 3).

5. Conclusions

The studied shales in the Lianggaoshan Formation in the Sichuan Basin have large oil contents. The average total oil content is 2.82 mg/g, ranging from 0.08 mg/g to 10.06 mg/g. Adsorbed oil is between 0.03 mg/g and 5.66 mg/g, with a mean of 1.64 mg/g, while free oil ranges from 0.05 mg/g to 4.94 mg/g, with an average of 1.21 mg/g, characterized by a relatively high proportion of free oil, averaging 45.17%. An excellent positive correlation exists between the free oil and the total oil, and the shale oil resource enrichment area corresponds to the free oil enrichment area.
Organic matter is the main adsorbent for shale oil; the higher the organic matter content, the higher the content of adsorbed oil. Shale oil mainly occurs in pores smaller than 100 nm, and a larger pore volume primarily corresponds to a higher free oil content.
The classification criteria of shale oil resources in the Lianggaoshan Formation in the Sichuan Basin can be determined, i.e., enrich, low-efficient, and scattered resources. The TOC content of the enriched resource is more than 1.6%, correspondingly, S1 is more than 1.5 mg/g, and OSI is higher than 45 mg/g. The low-efficiency resource has a TOC content between 0.8% and 1.6%, and S1 ranges from 0.2 mg/g to 1.5 mg/g. The scattered resource is characterized by TOC less than 0.8, S1 less than 0.2 mg/g, and OSI less than 45 mg/g.

Author Contributions

Methodology, S.Z., H.H. and S.L.; software, C.Q.; investigation, R.G.; data curation, P.Z. and Z.L.; writing—original draft preparation, S.Z.; writing—review and editing, S.Z. and P.Z.; visualization, T.W.; supervision, S.L.; project administration, Q.T. and K.P.; funding acquisition, S.Z. All authors have read and agreed to the published version of the manuscript.

Funding

This research was funded by Major scientific and technological projects of Southwest Oil and Gas Field, PetroChina (No.: 2024D1ZD-02-01).

Data Availability Statement

The data that support the findings of this study are available from the authors upon reasonable request.

Acknowledgments

The authors would like to express their gratitude to the reviewers and editors.

Conflicts of Interest

Authors Shaomin Zhang, Ruiying Guo, Qingsong Tang, Haitao Hong, Chunyu Qin, Tengqiang Wei and Keyu Pan have been involved in the company Southwest Oil & Gas Field Company, PetroChina. The remaining authors declare that the research was conducted in the absence of any commercial or financial relationships that could be construed as a potential conflict of interest.

References

  1. Zou, C.N.; Yang, Z.; Cui, J.W.; Zhu, R.K.; Hou, L.H.; Tao, S.Z.; Yuan, X.J.; Wu, S.T.; Lin, S.H.; Wang, L.; et al. Formation mechanism, geological characteristics and development strategy of nonmarine shale oil in China. Pet. Explor. Dev. 2013, 40, 12–26. [Google Scholar] [CrossRef]
  2. EIA. The Wolfcamp Play has Been Key to Permain Basin Oil and Nature Gas Production Growth; EIA: Washington, DC, USA, 2018.
  3. EIA. Anunal Energy Outlook 2021 (with Projections to 2050) [A/OL]; EIA: Washington, DC, USA, 2021.
  4. Ma, Y.S.; Cai, X.Y.; Zhao, P.R.; Hu, Z.Q.; Liu, H.M.; Gao, B.; Wang, W.Q.; Li, Z.M.; Zhang, Z.L. Geological characteristics and exploration practrices of continental shale oil in China. Acta Geol. Sin. 2022, 96, 151–171. [Google Scholar]
  5. Fu, S.T.; Jin, Z.J.; Fu, J.H.; Li, S.X.; Yang, W.W. Transformation of understanding from tight oil to shale oil in the Member 7 of Yangchang Formation in Ordos Basin and its signification of exploration and development. Acta Pet. Sin. 2021, 42, 561–569. [Google Scholar]
  6. Liu, H.M.; Zhang, S.; Wang, X.J.; Zhang, P.F.; Li, J.L.; Wang, Y.; Wei, X.L.; Yin, Y.; Zhu, D.Y. Types and characteristics of shale lithofacies combinations in continental faulted basins: A case study from Upper Sub-Member of Es4 in Dongying Sag, Jiyang Depression. Earth Sci. 2023, 48, 30–48. [Google Scholar]
  7. Jin, Z.J.; Liang, X.P.; Bai, Z.R. Exploration breakthrough and its significance of Gulong lacustrine shale oil in the Songliao Basin, Northeastern China. Energy Geosci. 2022, 3, 120–125. [Google Scholar] [CrossRef]
  8. Zhang, Y.; Du, Y.; Liu, Y.; Li, W.H.; He, S.; Wang, X.Z.; Pang, Q.; Huang, D. Basic characteristics and exploration direction of lacustrine shale oil and gas in Da’anzhai member of Jurassic in Sichuan Basin. Geol. China 2022, 49, 51–65. [Google Scholar]
  9. Fu, Q.; Liu, Q.D.; Liu, S.L.; Duan, H.L. Shale oil accumulation conditions in the second member of Paleogene Funing Formation, Gaoyou Sag, Subei Basin. Pet. Geol. Exp. 2020, 42, 625–631. [Google Scholar]
  10. Jin, Z.J.; Zhu, R.K.; Liang, X.P.; Shen, Y.Q. Several issues worthy of attention in current lacustrine shale oil exploration and development. Pet. Explor. Dev. 2021, 48, 1276–1287. [Google Scholar] [CrossRef]
  11. Jiang, Q.G.; Li, M.W.; Qian, M.H.; Li, Z.M.; Li, Z.; Huang, Z.K.; Zhang, C.M.; Ma, Y.Y. Quantitative characterization of shale oil in different occurrence states and its application. Pet. Geol. Exp. 2016, 38, 842–849. [Google Scholar]
  12. Zhang, H.; Huang, H.P.; Li, Z.; Liu, M. Comparative study between sequential solvent-extraction and multiple isothermal stages pyrolysis: A case study on Eocene Shahejie Formation shales, Dongying Depression, East China. Fuel 2020, 263, 116591. [Google Scholar] [CrossRef]
  13. Xu, Y.; Lun, Z.M.; Pan, Z.J.; Wang, H.T.; Zhou, X.; Zhao, C.P.; Zhang, D.F. Occurrence space and state of shale oil: A review. J. Pet. Sci. Eng. 2022, 211, 110183. [Google Scholar] [CrossRef]
  14. Qian, M.H.; Jiang, Q.H.; Qian, M.H.; Li, Z.M.; Li, Z.; Huang, Z.K.; Zhang, C.M.; Ma, Y.Y.; Li, M.W. Quantitative characerization of extractable organic matter in lacusatine shale with different occurrences. Pet. Geol. Exp. 2017, 39, 278–286. [Google Scholar]
  15. Bai, L.H.; Liu, B.; Du, Y.J.; Wang, B.Y.; Tian, S.S.; Wang, L.; Xue, Z.Q. Distribution characteristics and oil mobility thresholds in lacustrine shale reservoir: Insights from N2 adsorption experiments on samples prior to and following hydrocarbon extraction. Pet. Sci. 2022, 19, 486–497. [Google Scholar] [CrossRef]
  16. Guo, Q.Y.; Xu, S.; Chen, Z.X.; Wu, Z.B. Novel Method for the Classification of Shale Oil Reservoirs Associated with Mobility: Inspiration from Gas Adsorption and Multiple Isothermal Stage Pyrolysis. Energy Fuels 2023, 37, 9121–9130. [Google Scholar]
  17. Wang, S.; Feng, Q.J.; Javadpour, F.; Xia, T.; Li, Z. Oil adsorption in shale nanopores and its effect on recoverable oil-in-place. Int. J. Coal Geol. 2015, 147–148, 9–24. [Google Scholar] [CrossRef]
  18. Xu, L.; Wang, R.; Zan, L. Shale oil occurrence and slit medium coupling based on a molecular dynamics simulation. J. Pet. Sci. Eng. 2023, 220, 111151. [Google Scholar] [CrossRef]
  19. Wu, Z.B.; Sun, Z.; Shu, K.; Jiang, S.; Gou, Q.Y.; Chen, Z.X. Mechanism of shale oil displacement by CO2 in nanopores: A molecular dynamics simulation study. Adv. Geo-Energy Res. 2024, 11, 141–151. [Google Scholar] [CrossRef]
  20. Fleury, M.; Romero-Sarmiento, M. Characterization of shales using T1–T2 NMR maps. J. Pet. Sci. Eng. 2016, 137, 55–62. [Google Scholar] [CrossRef]
  21. Liu, B.; Bai, L.H.; Chi, Y.A.; Jia, R.; Fu, X.F.; Yang, L. Geochemical characterization and quantitative evaluation of shale oil reservoir by two-dimensional nuclear magnetic resonance and quantitative grain fluorescence on extract: A case study from the Qingshankou Formation in Southern Songliao Basin, northeast China. Mar. Pet. Geol. 2019, 109, 561–573. [Google Scholar]
  22. Liu, B.; Jiang, X.W.; Bai, L.H.; Lu, R.S. Investigation of oil and water migrations in lacustrine oil shales using 20 MHz 2D NMR relaxometry techniques. Pet. Sci. 2022, 19, 1007–1018. [Google Scholar] [CrossRef]
  23. He, W.Y.; He, H.Q.; Wang, Y.H.; Cui, B.W.; Meng, Q.A.; Guo, X.J.; Bai, X.F.; Wang, Y.Z. Major breakthrough and significance of shale oil of the Jurassic Lianggaoshan Formation in Well Ping’an 1in northeasten Sichuan Basin. China Pet. Explor. 2022, 27, 40–49. [Google Scholar]
  24. Yang, Y.M.; Huang, D.; Yang, G.; Li, Y.C.; Dai, H.M.; Bai, R. Geological conditions to form lacustrine facies shale oil and gas of Jurassic Daanzhai Member in Sichuan Basin and exploration directions. Nat. Gas Explor. Dev. 2019, 42, 1–12. [Google Scholar]
  25. Zou, C.N.; Yang, Z.; Sun, S.S.; Zhao, Q.; Bai, W.H.; Liu, H.L.; Pan, S.Q.; Wu, S.T.; Yuan, Y.L. “Exploring Petroleum inside source kithen”: Shale oil and gas Sichuan Basin. Sci. China-Earth Sci. 2020, 50, 903–920. [Google Scholar]
  26. Tian, H.; He, K.; Huangfu, Y.H.; Liao, F.R.; Wang, X.M.; Zhang, S.C. Oil content and mobility in a shale reservoir in Songliao Basin, Northeast China: Insights from combined solvent extraction and NMR methods. Fuel 2024, 357, 129678. [Google Scholar] [CrossRef]
  27. Zhang, P.F.; Lu, S.F.; Li, J.Q.; Xue, H.T.; Li, W.H.; Zhang, P. Characterization of shale pore system: A case study of Paleogene Xin’gouzui Formation in the Jianghan basin, China. Mar. Pet. Geol. 2017, 79, 321–334. [Google Scholar] [CrossRef]
  28. Yasin, Q.; Sohail, G.M.; Liu, K.Y.; Du, Q.Z.; Boateng, C.D. Study on brittleness templates for shale gas reservoirs-A case study of Longmaxi shale in Sichuan Basin, southern China. Pet. Sci. 2021, 18, 1370–1389. [Google Scholar] [CrossRef]
  29. Zhang, J.Y.; Zhu, R.K.; Wu, S.T.; Jiang, X.H.; Liu, C.; Cai, Y.; Zhang, S.R.; Zhang, T.S. Microscopic oil occurrence in high-maturity lacustrine shales: Qingshankou Formation, Gulong Sag, Songliao Basin. Pet. Sci. 2023, 20, 2226–2246. [Google Scholar] [CrossRef]
  30. Lin, Z.Z.; Li, J.Q.; Wang, M.; Zhang, P.F.; Lu, S.F.; Zhi, Q.; Wang, J.J.; Huang, H.S. Organic fluid migration in low permeability reservoirs restricted by pore structure parameters. J. Pet. Sci. Eng. 2022, 218, 111028. [Google Scholar] [CrossRef]
Figure 1. Geological setting of the Sichuan Basin (a) and sample locations in Well XQ1 (b).
Processes 12 02617 g001
Figure 2. Organic matter types of selected shales.
Processes 12 02617 g002
Figure 3. Whole rock (a) and clay (b) mineral compositions of studied shales. (The purple line is the trend line of average values).
Processes 12 02617 g003
Figure 4. Relationship between TOC and S1 of studied shales.
Processes 12 02617 g004
Figure 5. T2 spectra of shales at as-receive state.
Processes 12 02617 g005
Figure 6. T1-T2 spectra of shales at as-receive state. (white dashed circle: bound water area, red dashed circle: adsorbed oil area, green dashed circle: free oil area).
Processes 12 02617 g006
Figure 7. Relationship between free oil contents and amplitudes of p2 in T2 spectra.
Processes 12 02617 g007
Figure 8. Relationships between total oil contents with mult-R-E parameters (a) and S1 (b), and the relationships of TOC with adsorbed oil (c), and free oil (d).
Processes 12 02617 g008
Figure 9. Relationships between shale oil contents and pore structure parameters: total oil contents with BET SSA (a), total pore volume (b), adsorbed and free oil contents with BET SSA (c), and total pore volume (d).
Processes 12 02617 g009
Figure 10. Relationships between pore volumes of different scale pores and shale oil contents: micropores (<25 nm) with total oil (a), adsorbed and free oil (b), minipores (25–100 nm) with total oil (c), adsorbed and free oil (d), and mesopores (>100 nm) with total oil (e), and adsorbed and free oil (f).
Processes 12 02617 g010
Figure 11. Relationships between free (a) adsorbed oil ratios (b), S1 contents, (c) with TOC.
Processes 12 02617 g011
Table 1. Organic geochemical characteristics of studied shales.
SampleDepth/mS1/mg/gS2/mg/gTmax/°CHITOC/%
XQ1-42435.380.090.3644966.800.54
XQ1-52435.710.110.4645075.070.62
XQ1-62436.412.8311.38446422.382.69
XQ1-82436.842.119.19447424.122.17
XQ1-72436.872.7612.81444482.212.66
XQ1-92437.570.774.55444334.311.36
XQ1-112437.980.120.4145069.450.59
XQ1-132439.624.2915.51444531.462.92
XQ1-142440.101.957.98446405.081.97
XQ1-152440.500.140.58450145.510.40
XQ1-192442.450.070.2045442.410.47
XQ1-202443.170.130.3345363.850.52
XQ1-212443.681.298.39448390.782.15
XQ1-222444.131.737.89447398.281.98
XQ1-252446.570.090.2945061.830.46
XQ1-262447.400.434.46438262.511.70
XQ1-272447.800.110.6044791.410.66
XQ1-292449.740.120.3544854.330.64
XQ1-322452.652.0810.81448542.191.99
XQ1-32S2452.652.1711.82447579.402.04
XQ1-332453.390.201.19446160.880.74
XQ1-352454.081.256.74444378.591.78
XQ1-392457.760.953.67447277.371.32
XQ1-402458.280.572.71448241.481.12
XQ1-422459.150.463.39447257.991.31
XQ1-452461.240.020.0444725.060.16
XQ1-492464.980.030.1144743.840.25
XQ1-512467.260.261.82443167.901.08
XQ1-522468.500.574.17444282.901.47
Table 2. Shale oil contents obtained from multistage Rock-Eval.
SampleDepth/mS1-1/mg/gS1-2/mg/gS2-1/mg/gS2-2/mg/gFree Oil/mg/gTotal Oil/mg/g
XQ1-42435.380.030.140.160.330.170.33
XQ1-52435.710.030.150.200.440.180.38
XQ1-62436.410.112.483.695.992.596.28
XQ1-82436.840.172.883.834.413.056.88
XQ1-72436.870.193.174.435.873.367.79
XQ1-92437.570.091.001.592.731.092.68
XQ1-112437.980.030.170.210.390.200.41
XQ1-132439.620.384.565.667.684.9410.6
XQ1-142440.10.212.493.343.892.706.04
XQ1-152440.50.040.170.260.500.210.47
XQ1-192442.450.030.110.100.180.140.24
XQ1-202443.170.020.120.130.230.140.27
XQ1-212443.680.141.612.675.181.754.42
XQ1-222444.130.202.273.004.172.475.47
XQ1-252446.570.020.090.130.280.110.24
XQ1-262447.40.080.531.582.780.612.19
XQ1-272447.80.030.140.170.420.170.34
XQ1-292449.740.030.120.130.270.150.28
XQ1-322452.650.182.123.775.422.306.07
XQ1-32S2452.650.252.473.866.122.726.58
XQ1-332453.390.030.270.390.710.300.69
XQ1-352454.080.141.602.373.861.744.11
XQ1-392457.760.121.301.702.201.423.12
XQ1-402458.280.050.611.081.660.661.74
XQ1-422459.150.060.611.082.120.671.75
XQ1-452461.240.010.040.030.040.050.08
XQ1-492464.980.010.040.050.090.050.10
XQ1-512467.260.040.330.561.150.370.93
XQ1-522468.50.080.751.432.660.832.26
Table 3. Classification criteria of shale oil resources in the Lianggaoshan Formation in the Sichuan Basin.
Shale Oil ResourceTOC/%S1/mg/gS1/TOC/mg/g TOC
Enriched resource≥1.6≥1.5≥45
Low-efficient
resource
0.8–1.60.2–1.5/
Scattered resource<0.8<0.2<45
Disclaimer/Publisher’s Note: The statements, opinions and data contained in all publications are solely those of the individual author(s) and contributor(s) and not of MDPI and/or the editor(s). MDPI and/or the editor(s) disclaim responsibility for any injury to people or property resulting from any ideas, methods, instructions or products referred to in the content.

