Article

Mathematical Modeling and Experimental Validation for a 50 kW Alkaline Water Electrolyzer

1
State Grid Zhejiang Electric Power Co., Ltd., Research Institute, Hangzhou 310011, China
2
Hydrogen Energy Institute, Zhejiang University, Hangzhou 310013, China
3
Institute of Advanced Equipment, College of Energy Engineering, Zhejiang University, Hangzhou 310013, China
4
Hangzhou Meiyida Qingneng Technology Co., Ltd., Hangzhou 311100, China
*
Authors to whom correspondence should be addressed.
These authors contributed equally to this work.
Processes 2024, 12(12), 2616; https://doi.org/10.3390/pr12122616
Submission received: 25 October 2024 / Revised: 15 November 2024 / Accepted: 19 November 2024 / Published: 21 November 2024

Abstract

:
Due to its high maturity and low cost, alkaline water electrolysis (AWE) technology has been widely integrated with large-scale renewable energy systems (RESs) for green hydrogen (H2) production. Here, to evaluate the operational performance of a 50 kW AWE electrolyzer under different operation conditions, we developed an empirical modeling and experimental validation approach. The model particularly focuses on the polarization curve and the hydrogen to oxygen ratio (HTO). The relevant parameters of the empirical model were obtained by fitting the experimental data with MATLAB. The validity and accuracy of the established model and parameters were verified by comparing the fitted values with experimental values, and a good correlation was found. Since the experiments were performed in the sub-cell of 5 MW scale AWE electrolyzers, this model can also predict the performance of industrial MW-scale AWE electrolyzers and serve as a tool for the optimal design and control of industrial AWE electrolyzers. The results demonstrated that the models can achieve an accuracy with an R2 value exceeding 0.95 across a range of operational conditions.

1. Introduction

As the fossil fuel depletion and global warming crisis intensifies, hydrogen (H2) energy emerges as a promising solution to facilitate the transition towards a low-carbon society [1,2,3,4,5]. Additionally, integrating the water electrolyzer system into renewable energy sources (RESs) effectively addresses both the production of green hydrogen and the storage of electrical energy [6,7,8]. Traditional water electrolysis techniques include alkaline water electrolysis (AWE), proton exchange membrane water electrolysis (PEMWE), anion exchange membrane water electrolysis (AEMWE), and solid oxide electrolysis cell (SOEC) [9,10,11,12]. Among them, AWE and PEMWE have the highest technological maturity, so they are widely used in renewable energy bases. Furthermore, compared to PEMWE, there is no need for the utilization of precious metal catalysts in AWE, which significantly lowers the cost of AWE. Coupling AWE electrolyzers with RESs has broad application prospects in distributed energy systems, as it can help balance power supply and demand and improve the overall efficiency of the energy system. Thus, AWE accounts for over 70% of the RESs-H2 systems [1,10,13].
However, this system presents significant challenges in terms of safety and efficiency, primarily due to the highly intermittent electric power supply [6,14]. Under low-load operation, AWE may generate hydrogen-oxygen (O2) explosive mixtures, which threatens its safe operation. Particularly on the anode side, there is a risk of explosion when the hydrogen to oxygen ratio (HTO) exceeds the safety threshold of 2% [15,16]. Moreover, the fluctuating conditions of RESs make it challenging to predict the voltage and current change trends [17,18,19,20,21,22]. These external conditions contribute to the unpredictability of electrolyzer performance, particularly in scenarios characterized by low load and elevated pressure, where the potential mixing of H2 and O2 poses significant safety risks. Consequently, simulation emerges as an invaluable tool, enabling the model and analysis of these complex interactions. Therefore, great effort has been devoted to developing simulation modeling of AWEs to predict their operation under the fluctuation of RESs and optimize the control strategies and operating conditions of the AWE accordingly [23,24,25]. Most literature focuses on the electrochemical model and the HTO model [9,26,27,28].
Regarding establishing AWE’s electrochemical model simulation, the pioneering work about the electrochemical empirical model was proposed by Hug et al. [29] in 1993, representing the U-I polarization curve of a 10 kW electrolyzer with mathematical formulas. Subsequently, Ulleberg et al. [30] considered the impact of temperature on the electrolysis voltage and proposed a new electrochemical model, determining its parameters by fitting 26 kW and 10 kW AWE experimental data. Sanchez et al. [31] expanded Ulleberg’s model by incorporating the influence of pressure on the electrolysis voltage on the basis of experimental data obtained from a 15 kW alkaline test bench. For the establishment of the HTO model, some scholars have attempted to predict gas purity using simple empirical models. Hug et al. [29] were the first to propose an empirical model for HTO, incorporating the effects of temperature and current density. Building on Hug’s model, Sanchez et al. [31] expanded the model by considering the impact of pressure on HTO and introducing a new empirical formula. Additionally, Kirati et al. [28] proposed a novel HTO empirical model, which was validated through simulation using Simulink. However, the investigations mentioned above were primarily conducted using small-scale laboratory AWE electrolyzers. As a result, their experimental data and fitting curves may not accurately reflect the operation of MW-scale AWE electrolyzers in real-world engineering applications. Consequently, there is still a gap in the modeling of industrial MW-scale AWE electrolyzers.
In practice, the primary difference between industrial-scale and laboratory-scale electrolyzers lies in the distributions across the electrode plates, which are largely driven by variations in the electrode structure and surface area. To address this critical factor, this paper aims to evaluate the performance of a 50 kW AWE electrolyzer consisting of three sub-cells connected in series and utilizing electrodes from an industrial-scale AWE electrolyzer. Additionally, an empirical model for industrial-scale AWE electrolyzers is proposed. The model incorporates both electrochemical and HTO components, accounting for the effects of the current density, temperature, and pressure on performance. The model can accurately predict the operating state of industrial MW-scale AWE electrolyzers, providing a model reference for their operation under the fluctuating conditions of RES coupling. Unlike the previous literature, this paper builds a novel and experimentally empirical model development methodology for MW-scale AWE systems.

2. Mathematical Model for a 50 kW AWE System

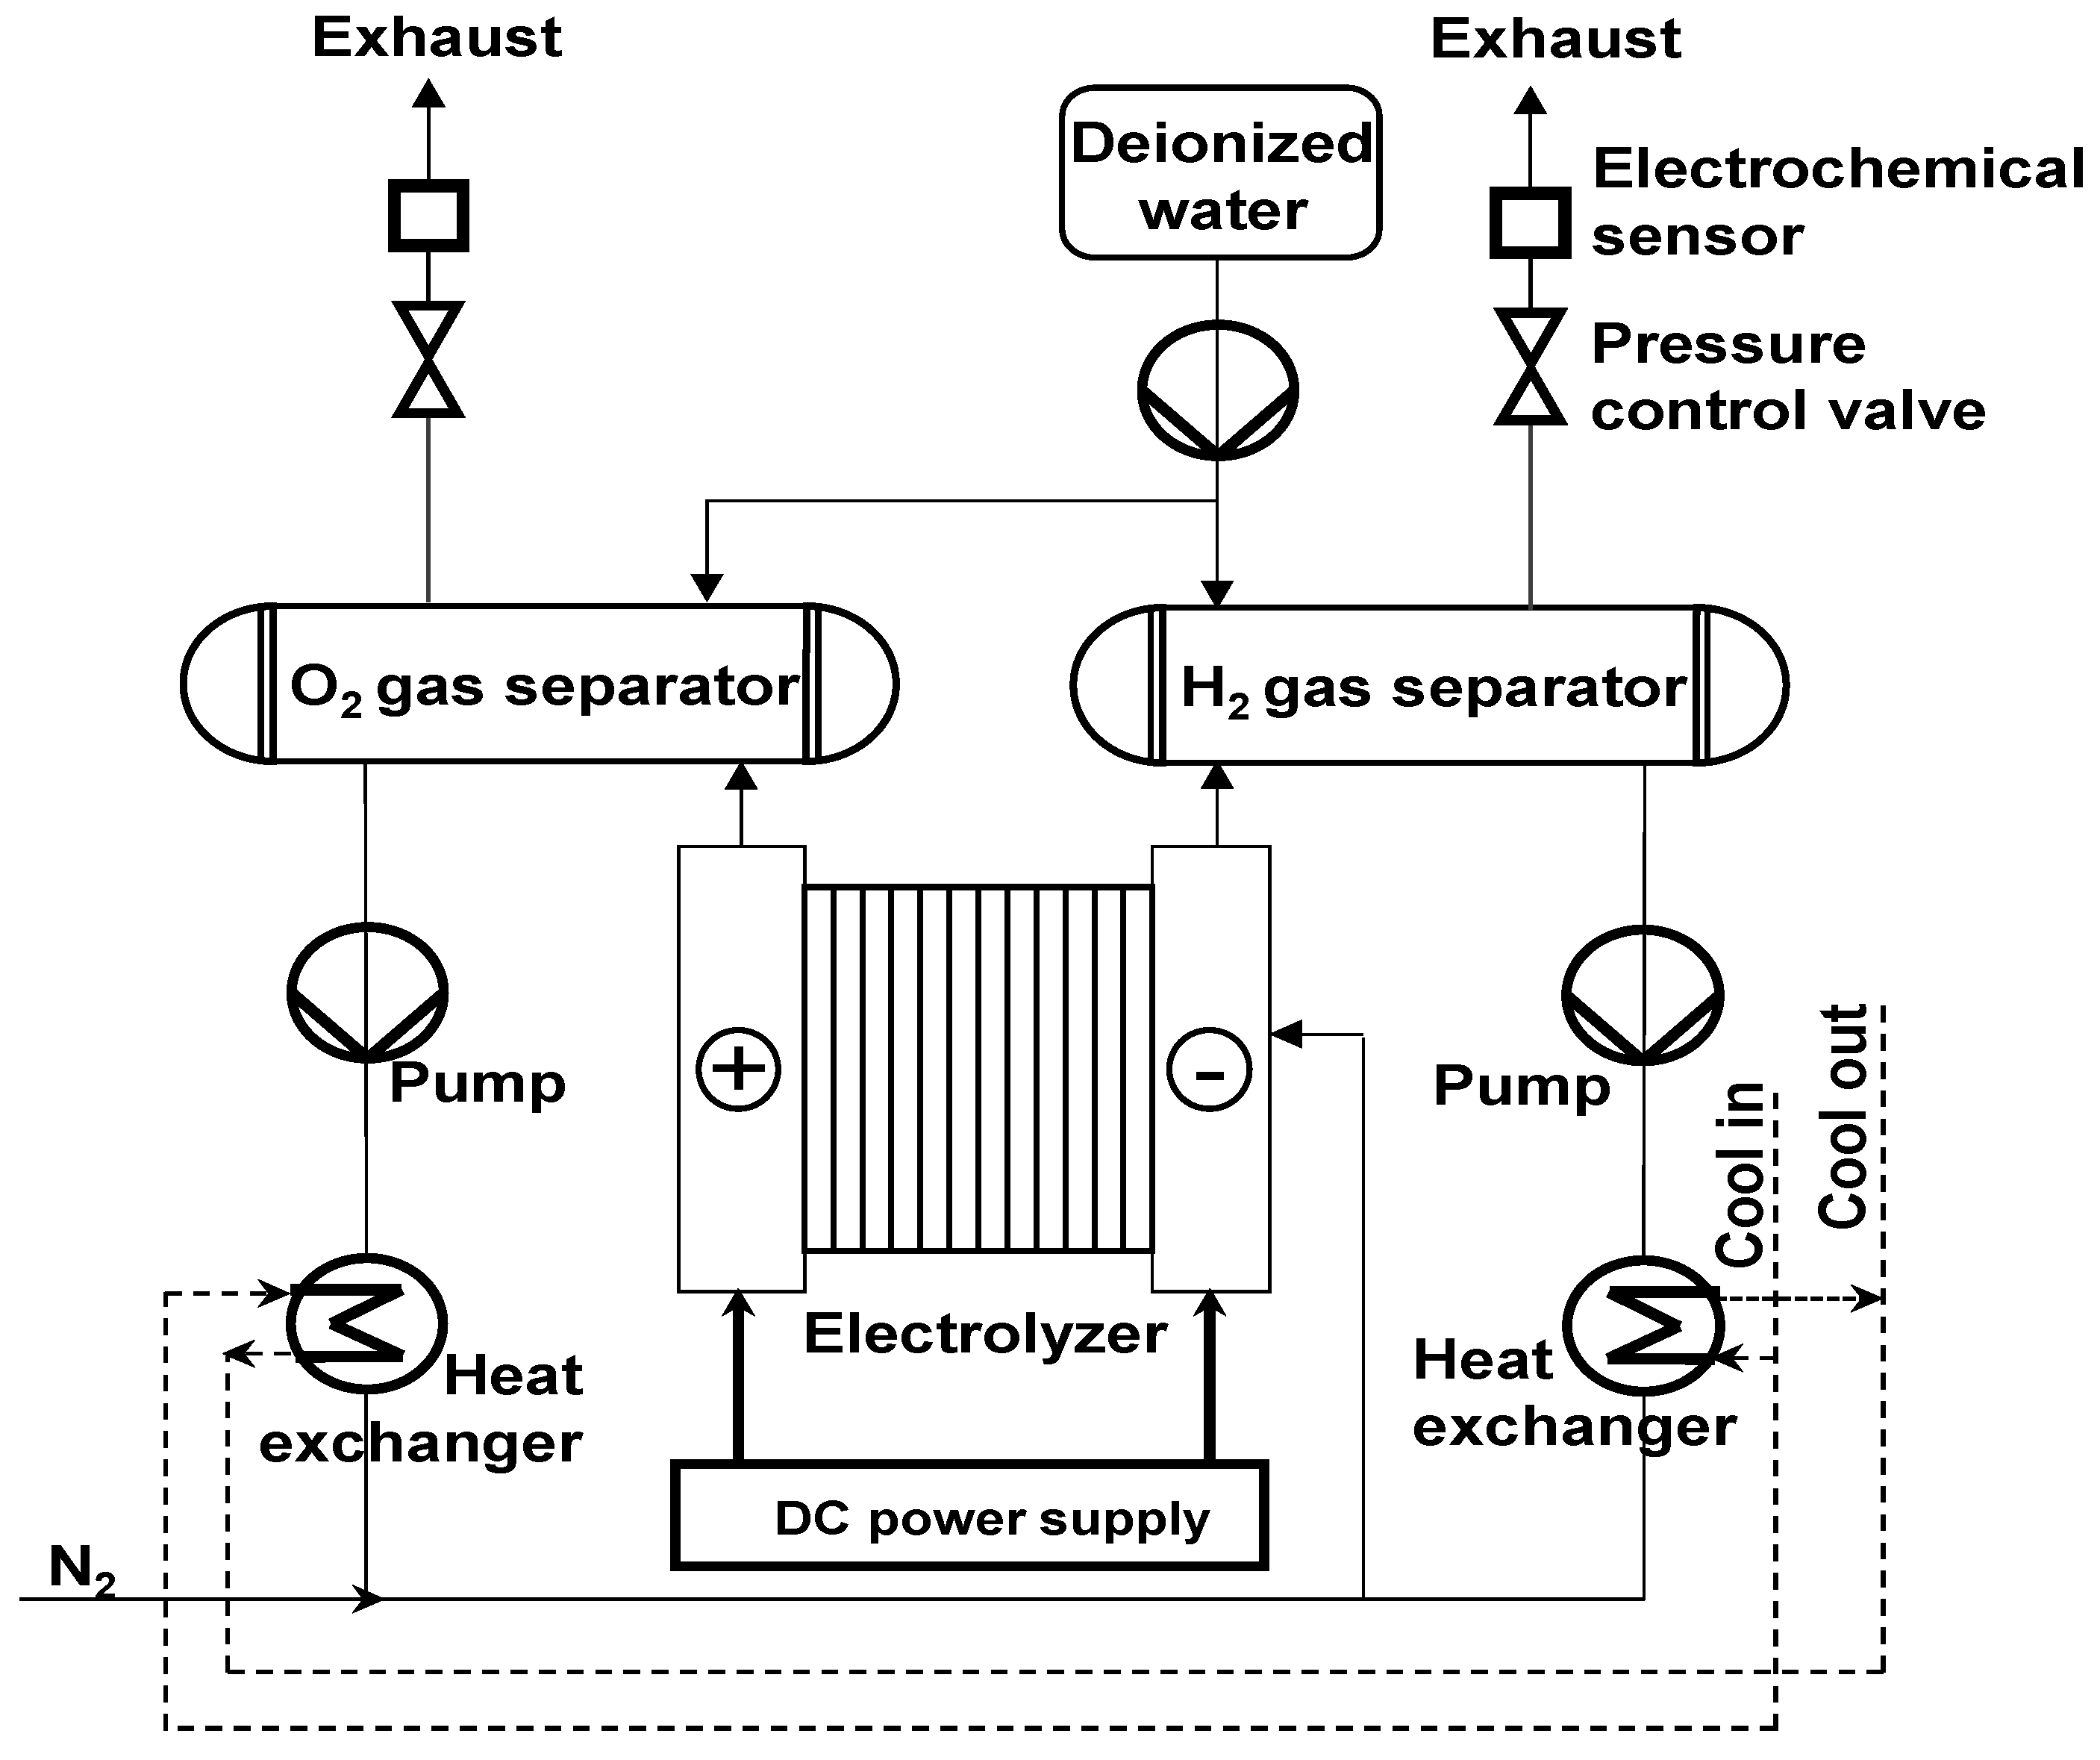
2.1. AWE System Structure

An AWE system primarily consists of an alkaline electrolyzer and an auxiliary balance of plant (BOP) (Figure 1). The electrolytic cell serves as the core component of the H2 production system. The alkaline electrolytic cell mainly comprises components such as the collector plate, cathode, anode, and porous diaphragm. When a direct current is applied between the two electrodes, H2O is reduced at the cathode to generate H2, while OH is oxidized at the anode to produce O2. The electrolyte and produced gases are circulated and discharged through the BOP, respectively.
The BOP includes all the equipment necessary for producing pure H2, such as deionized water supply, heat exchangers, gas separators, circulation pumps, and the cooling loop. The BOP primarily manages the gas-liquid circuit and cooling water circulation. H2 and O2 are separated from the electrolyte in the gas separator. The generated gas is regulated through the back pressure regulator and is vented only after passing through the gas purity sensor. The separated electrolyte is reintroduced into the electrolytic cell via a heat exchanger and circulating pump. The cooling pump circulates cooling water through a heat exchanger in the electrolyte recirculation loop, removing waste heat generated during the electrolysis process and helping to regulate the electrolyzer’s temperature. Finally, deionized water with an electrical conductivity of 5 μS/cm is used to replenish the water lost during the electrolysis process, ensuring that the lye concentration and liquid level remain balanced in the separator.
The establishment of mathematical models has been widely applied in predicting the operational characteristics of electrolyzers and optimizing control strategies. This paper constructs the electrolyzer’s characteristics based on the polarization curve and the gas purity model. Reasonable assumptions were made based on previous studies [32]: (1) the H2 production process was assumed to be completely ideal with a Faraday efficiency of 100%, which indicates that electrical energy is completely converted to H2; (2) electrolyzers connected in series were assumed to have the same operating characteristics to facilitate uniform analysis and prediction of system performance; (3) electrolyzer polarization was mainly considered for activation and ohmic effects, and concentration polarization was ignored to simplify the model; (4) the temperature and pressure fields within the electrolyzers are evenly and consistently distributed.

2.2. Electrochemical Model

The electrolyzer’s electrochemical model encapsulates the thermodynamic and kinetic influences on the electrolytic process, as shown in Figure S3. The Nernst equation is extremely important in the field of electrochemistry. It describes the relationship between the reversible electromotive force of a cell and factors such as temperature, pressure, and the reactants’ concentrations. In this study, from the perspective of thermodynamics, the Nernst equation was used to determine the reversible voltage, taking into account the temperature and partial pressure of the reaction products (Equation (1)).
E rev = E rev 0 + RT 2 F ln ( ( P   P H 2 O ) 1.5 P H 2 O * P H 2 O )
where E rev 0 is the standard reversible potential. R, T, F, and P are the universal gas constant, temperature, Faraday constant, and pressure, respectively. P H 2 O is the pressure of H2 and O2 gases in the existence of water vapor near the electrode. P H 2 O * is the pure water’s vapor pressure. E rev 0 is strongly related to temperature and can be calculated using various empirical methods, such as the following:
E rev 0 ( T ) = 1.50342 9.956 × 10 4 T + 2.5 × 10 7 T 2
Meanwhile, the activation overpotential at the cathode, which is crucial for the H2 and O2 generation reaction, was gauged through the Butler–Volmer equation. The Butler–Volmer equation is a fundamental equation in electrochemical kinetics that describes the dynamic behavior of electrode processes. It characterizes the relationship between the current density of the oxidation-reduction reactions at the electrode surface and the electrode potential. Hence, in the electrolysis process, the activation overpotential at the cathode, which is crucial for the H2 and O2 generation reaction, is gauged through the Butler–Volmer equation, which depends on the activation energy that must be overcome. Furthermore, the ohmic overpotential arises from the voltage drop across the cell, adhering to Ohm’s law.
A widely adopted model, which merges empirical electrochemical data with fundamental thermodynamics, was proposed by Ulleberg in 2003 [30]. This model is commonly used in practice to represent polarization curves through empirical U-i formulations. The underlying equation for the U-i curve is presented as follows:
U cell = U rev + r × i + s × log [ t × i + 1 ]
where U rev is the reversible voltage, which is related to the Gibbs free energy. The r · i is the ohmic overpotential. The coefficients t and r as a function of temperature (T) are described by the following equation:
t = t 1 + t 2 T + t 3 T 2
r = r 1 + r 2 × T
To achieve a more comprehensive model, the equation was adjusted to incorporate pressure (P), which extended its scope beyond mere temperature dependence [31]. This enhancement was realized by introducing an extra parameter, denoted as ‘d’, into the model. This new parameter ‘d’ signifies the linear variation of ohmic overpotential in response to changes in pressure:
d = d 1 + d 2 × P
The electrochemical model used in this system is the empirical model proposed by Sánchez [31]:
U cell = U rev + [ ( r 1 + d 1 ) + r 2 × T + d 2 × P ] × i + s × log [ ( t 1 + t 2 T + t 3 T 2 ) × i + 1 ]
where U rev is the reversible voltage for electrolysis, taken as 1.229 V (1 bar, 25 °C); T is the electrolyzer temperature in °C; P is the pressure within the electrolyzer in bar; and i is the current density in A/m2. The remaining parameters are fitting coefficients. r1, r2, d1, d2, s, t1, t2, and t3 are constants obtained from experimental data. The constant terms r1 and d1 can be grouped into a single term. In addition, the total voltage of the alkaline electrolyzer is equal to the cell voltage multiplied by the number of cells.

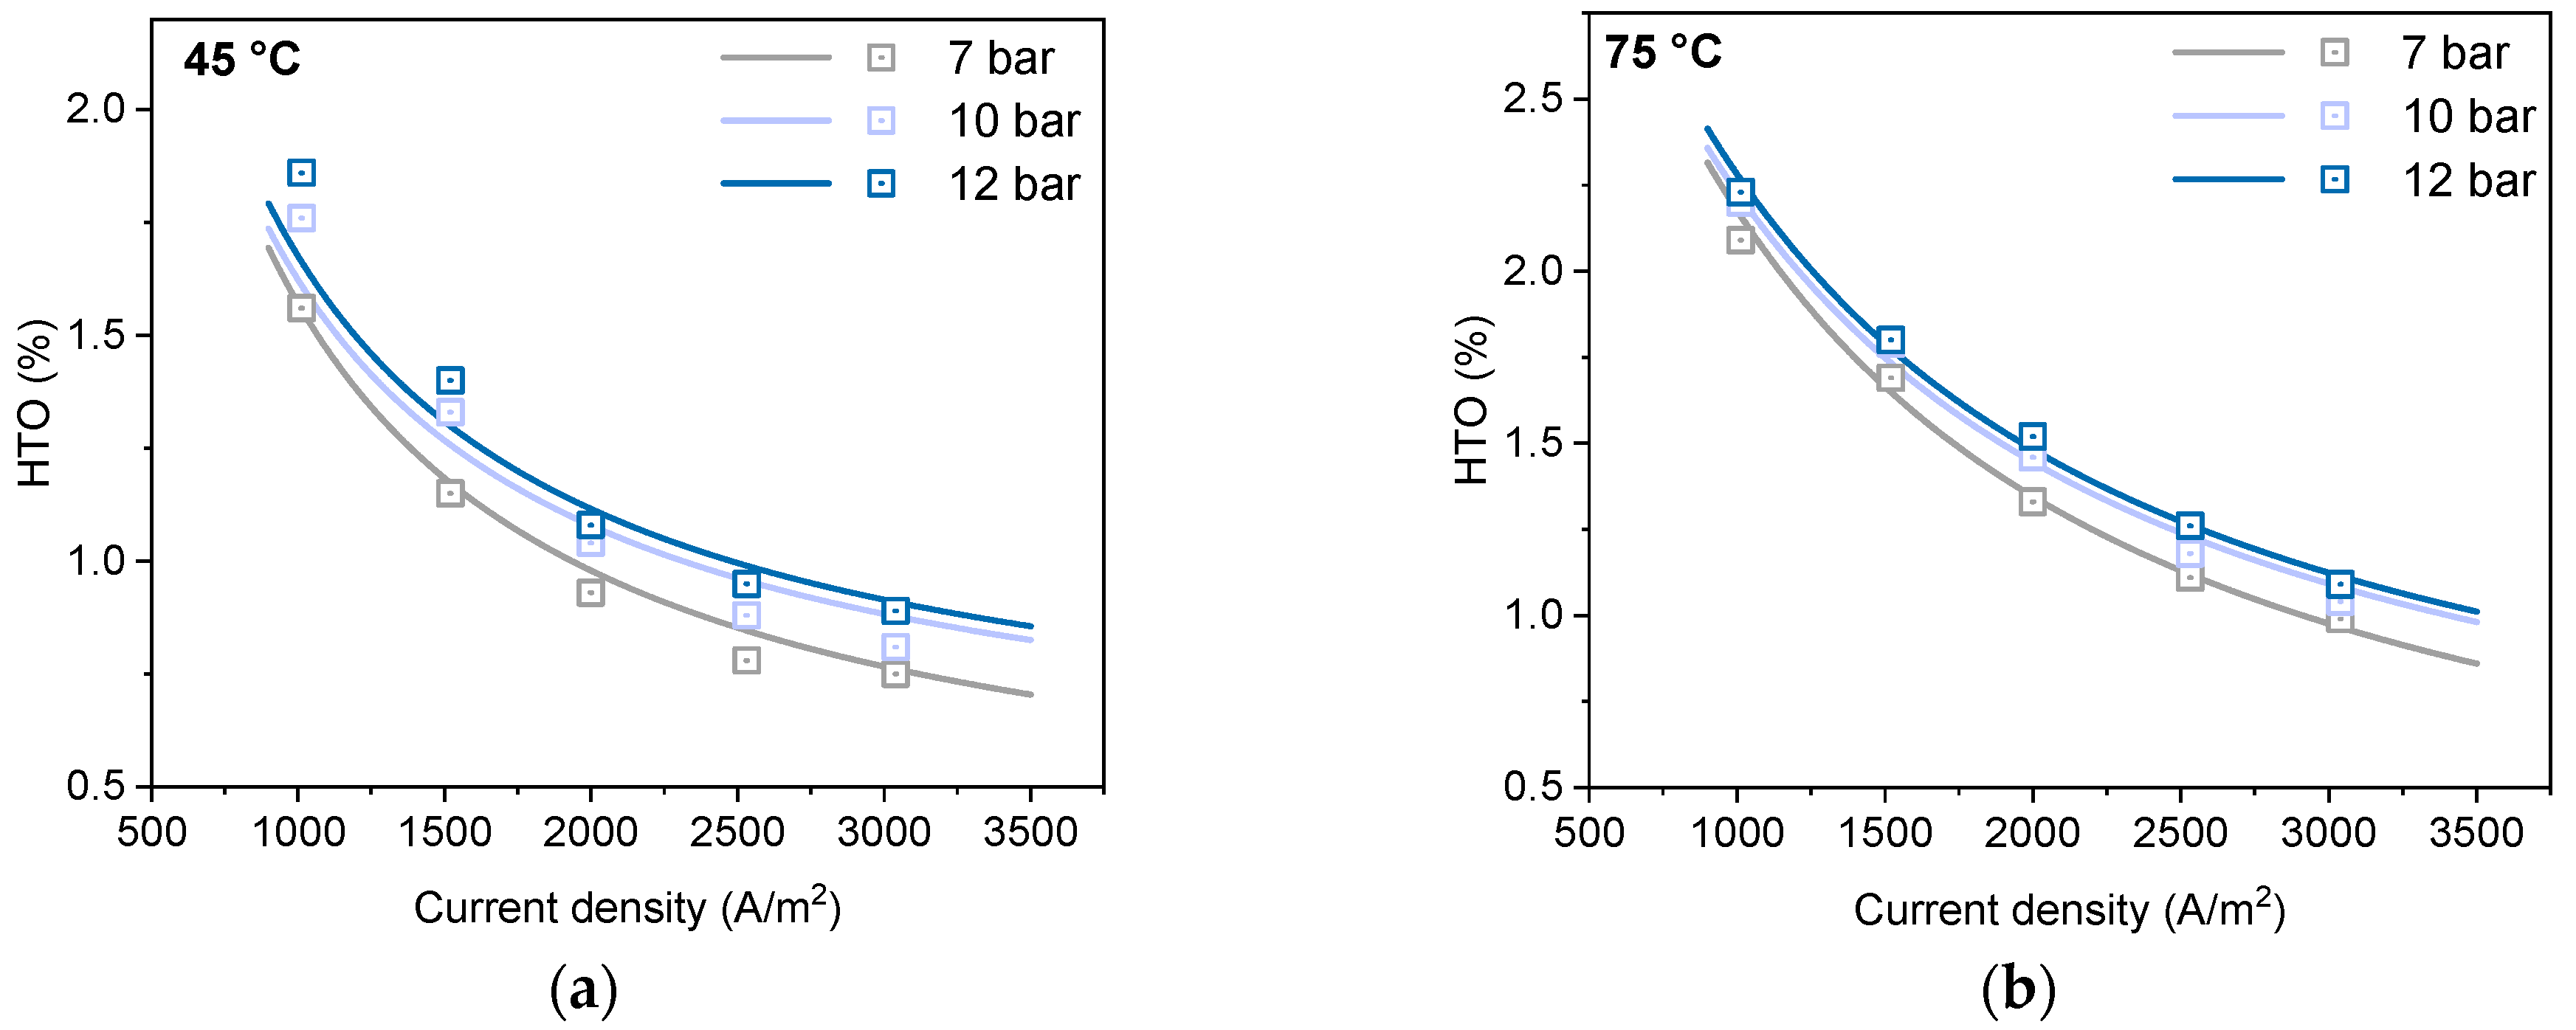
2.3. Gas Purity Model

Renewable energy-driven electrolyzer highlights the importance of gas purity as a critical safety indicator. When the HTO reaches the safety limit (2%), the electrolyzer should be shut down to avoid the formation of a flammable gas mixture. During electrolysis, two primary effects can lead to the contamination of product gases: gas diffusion through cell components and the dissolution of gases in the KOH electrolyte. The former reduces both gas quality and electrolyzer efficiency, as O2 can revert to water at the cathode. The latter saturates the electrolyte stream with gases that the separator cannot completely remove. To maintain gas purity, AWEs cannot be operated at low loads. The impurity level is primarily influenced by operating parameters such as temperature, pressure, membrane characteristics, and process control, with particular emphasis on the differential pressure of the gas separator.
Compared to O2, H2 has twice the molar yield and a larger diffusion coefficient in concentrated KOH solution. The HTO model employs the following empirical formula [31]:
HTO = [ C 1 + C 2 × t + C 3 × T 2 + ( C 4 + C 5 × T + C 6   × T 2 )   × e ( C 7 + C 8 × T + C 9 × T 2 i ) ] + [ E 1 + E 2 × P + E 3 × P 2 + E 4 + E 5 × P + E 6 × P 2 × e E 7 + E 8 × P + E 9   × P 2 i ]
where T is the temperature of the alkaline tank in °C; i is the current density in A/m2; P is the pressure within the alkaline tank in bar; and the remaining parameters are fitting coefficients.

3. Experimental Set-Up

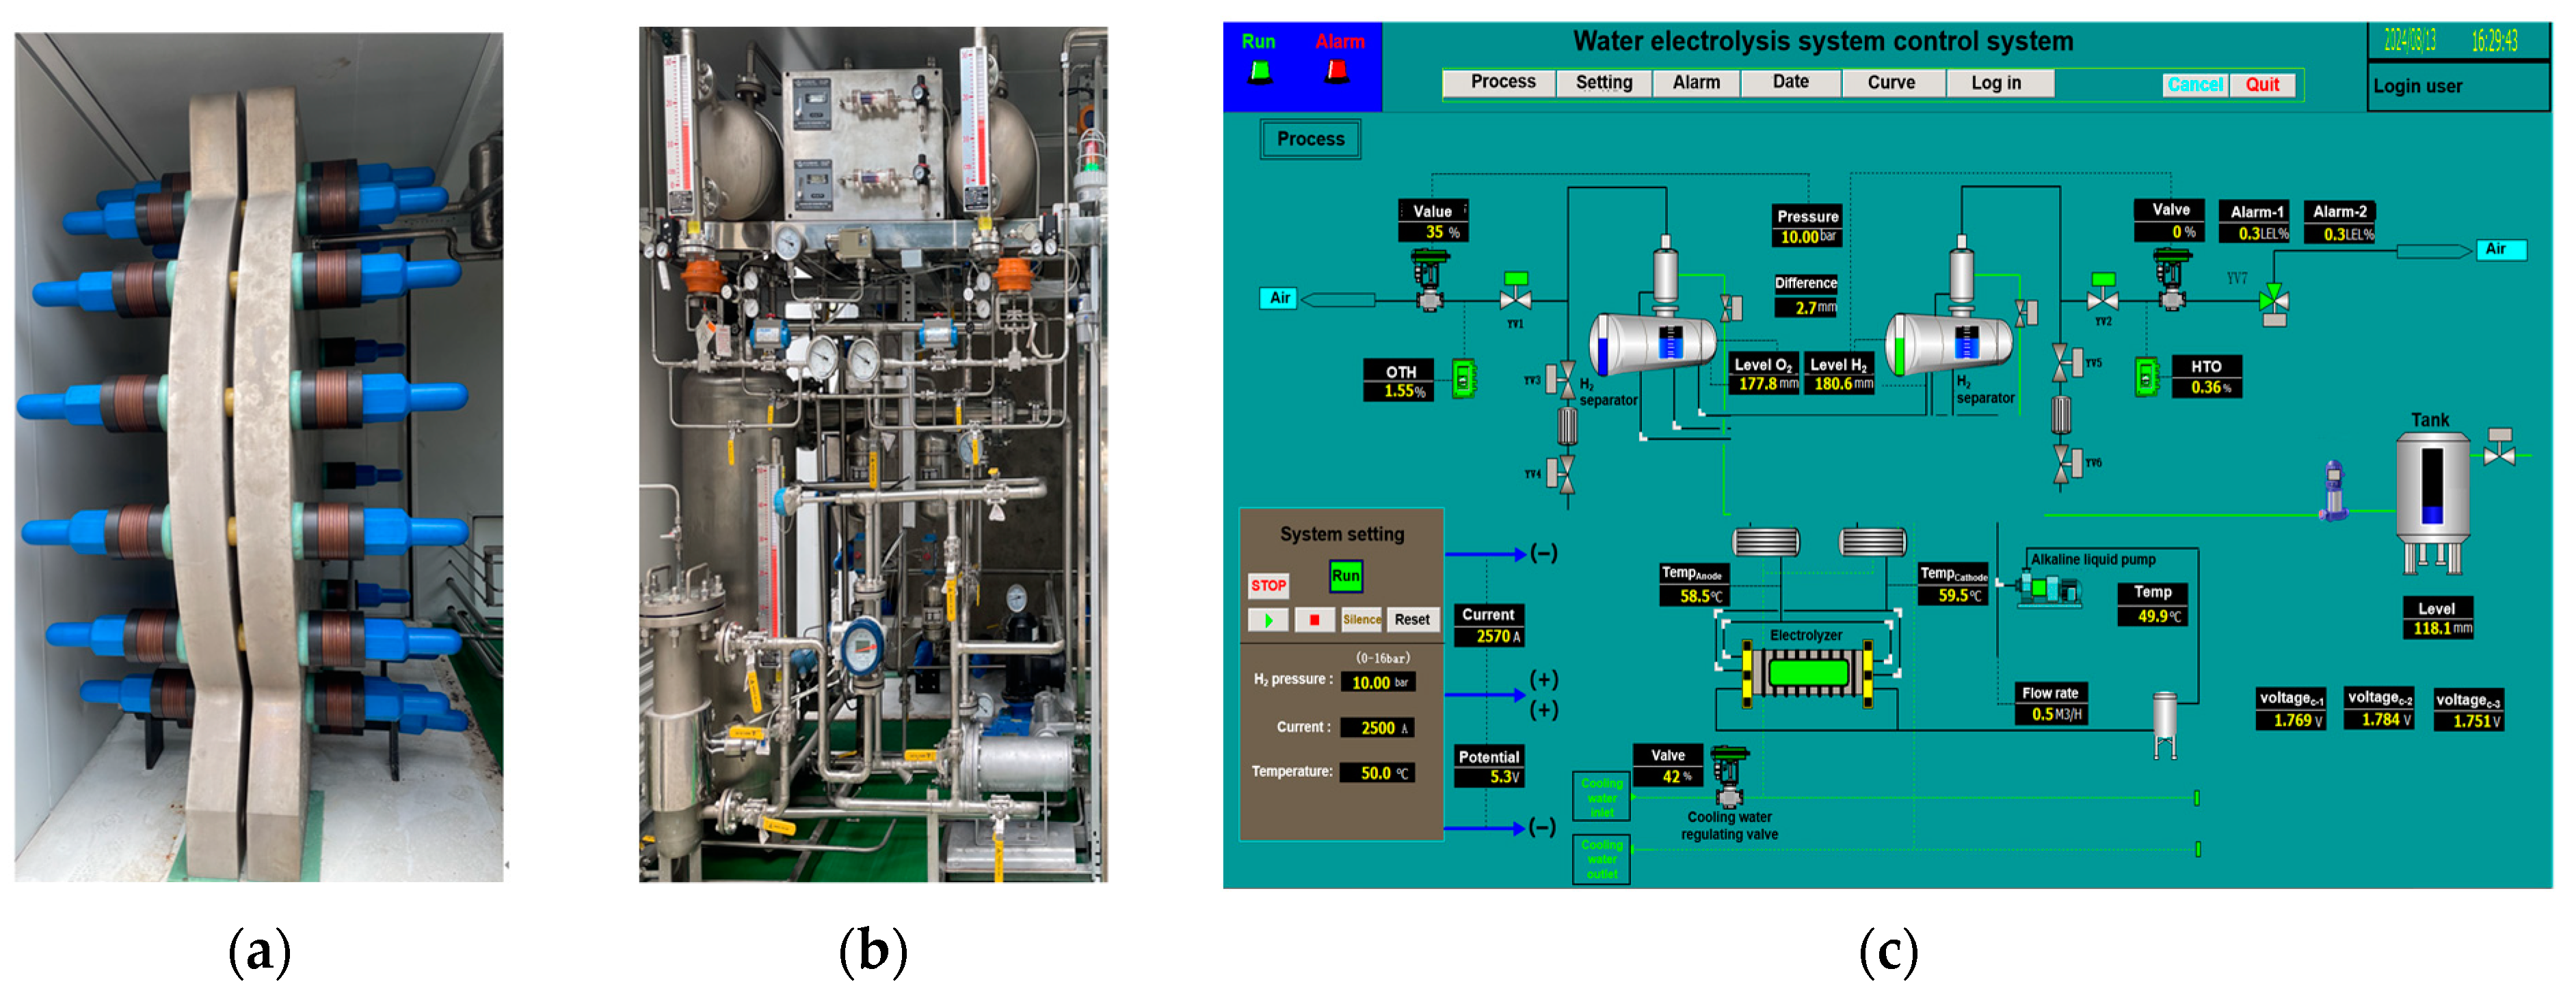
3.1. 50 kW AWE Test Bench

Measurements were carried out on an industrial scale at a 50 kW AWE test bench, which included a custom-built 10 Nm3/h alkaline electrolyzer and the BOP components (Figure 2). The test electrolyzer was equipped with three electrolysis cells that had the same technical parameters as commercial 1000 Nm3/h electrolyzers. This set-up replicated the operational characteristics of a large commercial electrolyzer while ensuring both safety and convenience. The key technical data of this test bench are presented in Table 1. The electrodes had a diameter of 1.8 m, and the electrolysis current ranged from 0 to 7600 A (corresponding to a current density of 0 to 3000 A/m2), with a total cell voltage range of 0 to 6.5 V.
The electrolyzer operates at a maximum working pressure of 16 bar and a maximum working temperature of 90 °C. The electrolyte used in this system was a 30 wt% KOH solution. The lye flow rate was maintained at 0.5 m3/h, controlled by circulating pumps and valves within the piping system. The control interface of the H2 production system comprised two main components: experimental parameter settings and result data monitoring. Based on the experiment’s design, the required current, H2 production pressure, and temperature should be input accordingly. The ideal H2 production pressure was achieved by controlling the operation of the pneumatic valves mounted on the gas phase piping. With a rational piping design, the pressure difference between the cathode and anode of the electrolyzer was balanced and maintained. Simultaneously, the temperature of the alkaline tank was controlled by adjusting the temperature of the incoming lye. Excess waste heat was managed by regulating the flow of cooling water through circulating pumps, ensuring that the temperature of the electrolytic tank remained at the desired set point.
A variety of data outputs are presented on a visual control interface, including the individual voltage of each cell and the total electrolysis voltage. Additionally, the lye and tank temperatures measured using temperature sensors are displayed. To maintain the pressure balance between the anode and cathode, a liquid level height sensor and a liquid level balance regulator were incorporated into the system. Gas purity was closely monitored using online electrochemical sensors to ensure HTO remained well below the explosion limit of the gas mixture. The central control module receives data from various sensors. It drives various actuators according to the PID (Proportional Integral Derivative) strategy to ensure the H2 production system operates safely within the preset parameters.

3.2. Test Protocols

The following test protocols were established to ensure the repeatability and reliability of the collected data. Prior to the formal investigation of operational parameters within the H2 production system, it was imperative to strictly follow a standardized startup and preheating procedure. This protocol ensures that all system components attain a stable operating condition, including soaking the electrolyzer diaphragms, purging the piping with nitrogen, and pre-starting the BOP system. Once the circulation of the electrolyte has stabilized, the electrolyzer power supply is safely activated, and an initial preheating phase is initiated under a low-load mode. The completion of the preheating process is marked by the continuous monitoring of all crucial operational parameters remaining within a constant range for three consecutive hours. At this point, the electrolyzer is adjusted to operate under nominal conditions for an additional 2 h to further ensure the system’s full activation status.
Given the inherent time delay in the AWE electrolyzer’s response to parameter changes, a test cycle of 2 h was designated for each operational state to ensure the scientific rigor and accuracy of experimental data. Specifically, during the first hour following the parameter adjustment, the system underwent a dynamic adjustment phase, followed by one consecutive hour of intensive data collection and recording. Static inputs, including current density, temperature, and pressure, were rigorously maintained at constant levels during each test, and the corresponding cell voltage and HTO data were recorded, respectively. Ultimately, statistical analysis of these 1 h data sets yielded an average value that served as a representative data point for that particular operational condition. Based on the test protocols, we conducted a performance evaluation of the AWE electrolyzer under various pressures (7, 10, and 12 bar) and temperatures (45, 55, 64, 75, and 85 °C), measuring the polarization curves and HTO trends under different operating conditions.

4. Results and Discussion

All experimental data are listed in Table 2. Table 3 presents the fitting coefficients for the electrochemical and gas purity model in the 50 kW AWE electrolyzer. Non-linear regression fitting of the experimental data was performed using the Curve Fitting Tool in MATLAB R2024a to solve the model coefficients. The custom fitting module in the Curve Fitting Tool was selected. In the custom fitting module, we input the polarization curve model (Equation (5)) and the gas purity model (Equation (6)), both of which contain fitting coefficients, along with the experimental data of polarization curves and HTO under various pressures and temperatures. The fitting module automatically calculated the fitting coefficients based on the models and experimental data, and provided indicators of the fitting effectiveness. Specifically, the performance tests were conducted at a current density of 1000 to 3000 A/m2, an operating temperature of 45 to 85 °C, and under a pressure of 7 to 12 bar. Therefore, the applicability scope of the proposed model is precisely as described above. The effect of fit is represented by R2, a coefficient used as a regression evaluation metric, which is calculated using the following equation:
R 2 = 1 i   ( y ^ i y i ) 2 i   ( y i y - ) 2
where y ^ i represents the predicted value, y i represents the experimental data, and y - is the mean value. The value of R2 ranges from [0, 1]. A larger R2 indicates a better model fit. In this study, an R2 value greater than 0.95 was considered an adequate fit.

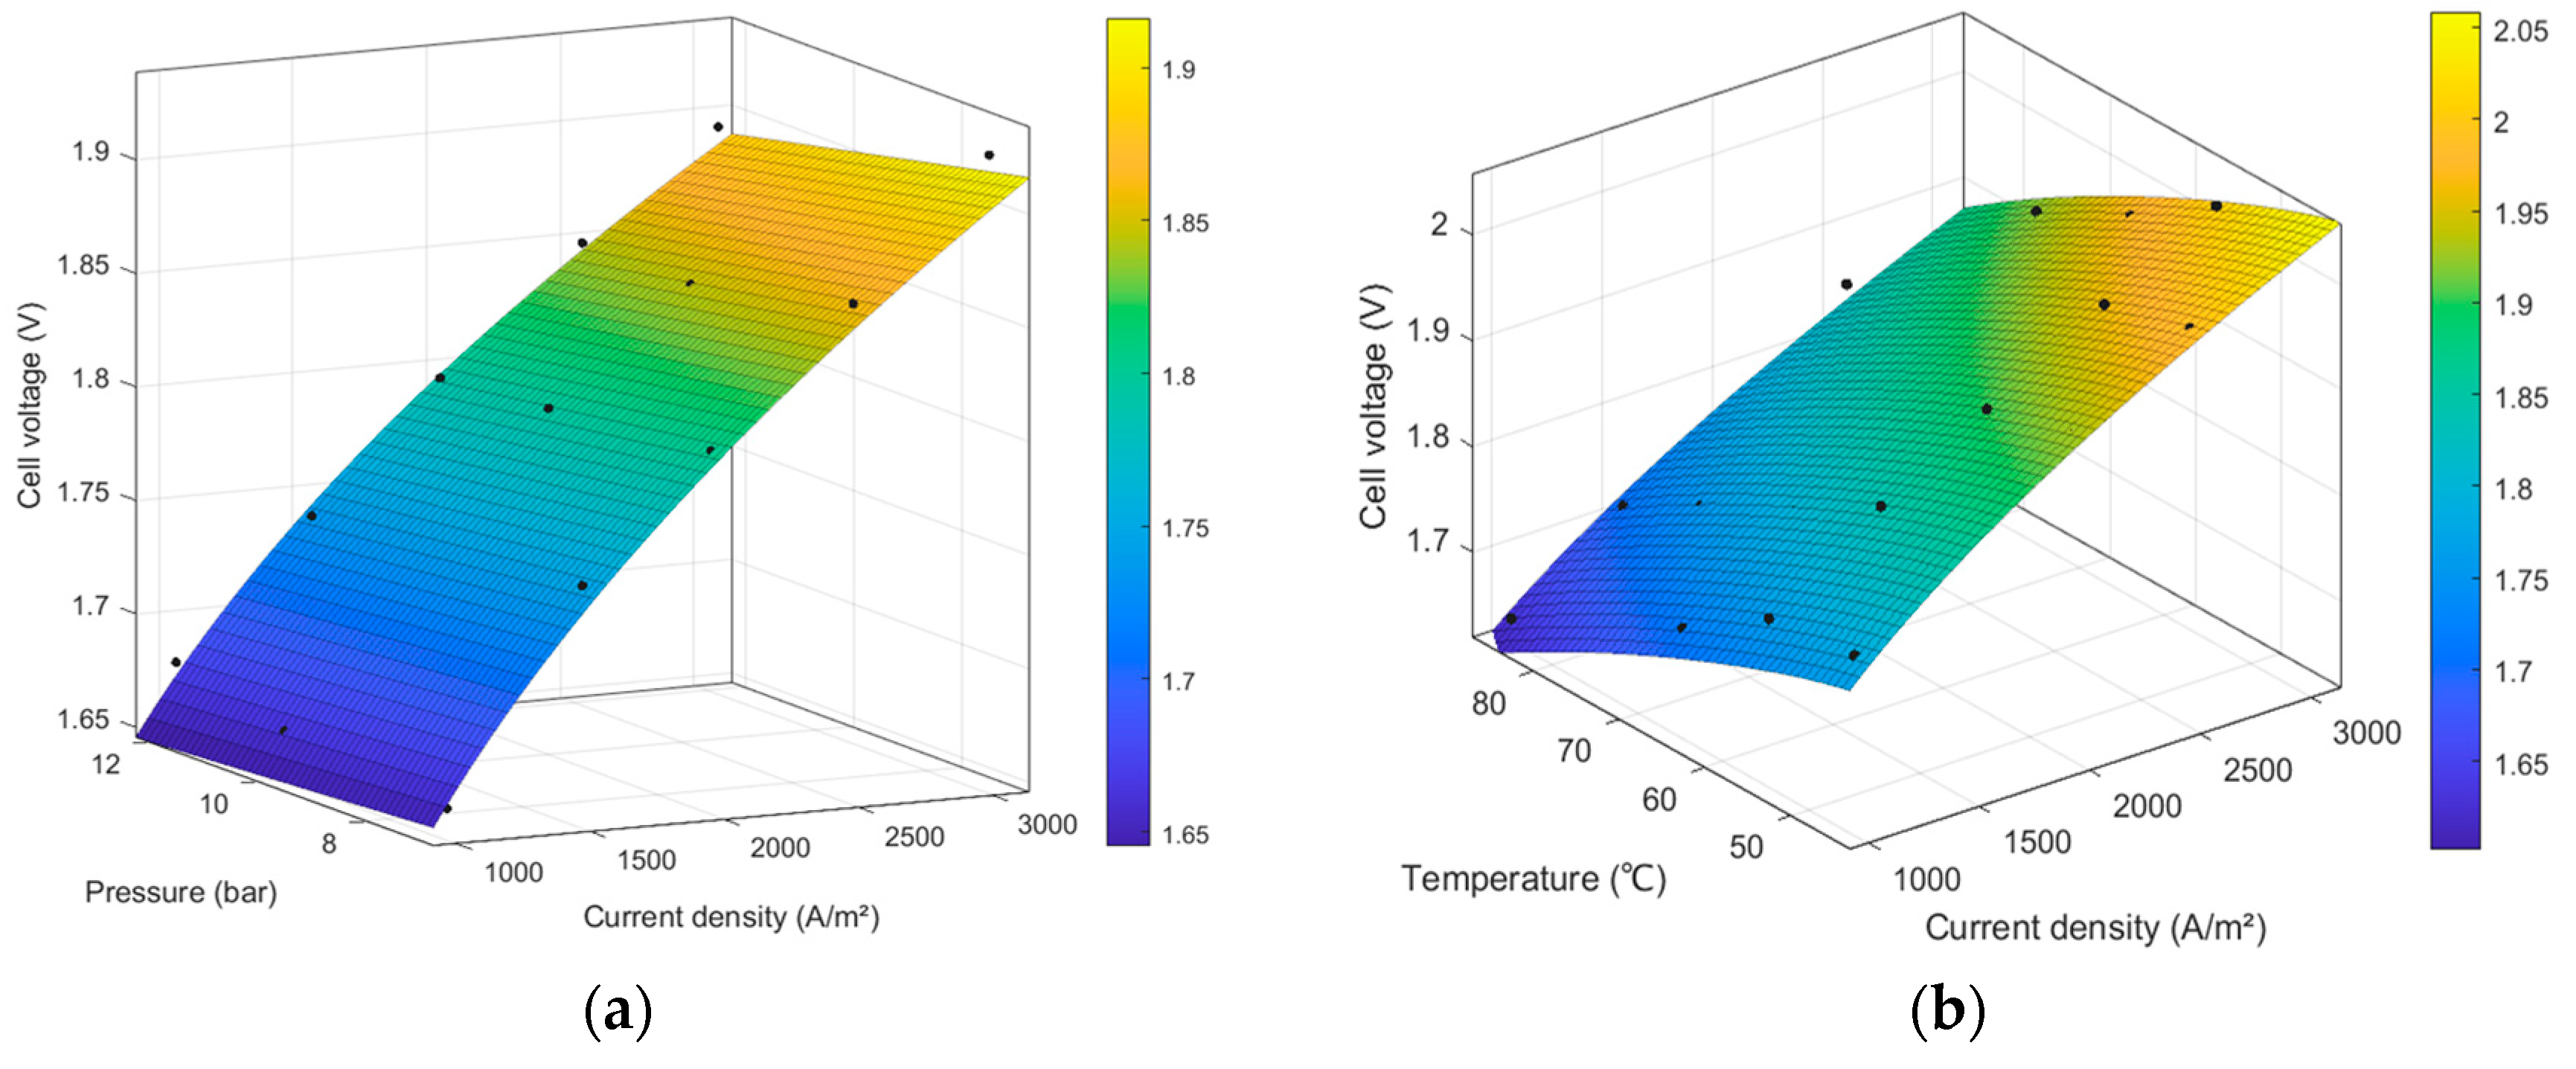
4.1. Results of the Electrochemical Model

Figure 3 shows the surface fitting of the electrochemical model under different pressures (7, 10, and 12 bar) and temperatures (45, 55, 65, 75, and 85 °C), with R2 values of 0.96117 and 0.99208, respectively, demonstrating that the fitting results are valid. To more clearly illustrate the comparison between the fitted curves and experimental data, Figure 4 presents the comparison of the electrochemical model’s fitted curves and experimental data at the same temperature (45 °C and 75 °C) under different pressures (7, 10, and 12 bar), as well as the comparison at the same pressure (7 and 12 bar) under different temperatures (45, 55, 65, 75, and 85 °C).
As shown in Figure 4a, at 45 °C, the electrolyzer voltage normally decreased with increasing pressure. However, at a current density of 1000 A/m2, the voltage initially decreased from 1.784 V to 1.776 V as the pressure increased from 7 to 10 bar, then rose from 1.776 V to 1.779 V when the pressure increased from 10 to 12 bar. At full load (a current density of 3000 A/m2), the cell voltage exhibited a slight decrease of 0.024 V as the pressure increased from 7 to 12 bar. Figure 4b shows a similar phenomenon at 75 °C. Above 2000 A/m2, the voltage decreased with increasing pressure, but below 2000 A/m2, lower current densities exhibited a more significant increase in the voltage with rising pressure.
It can be concluded that in the high current density range, the total cell voltage decreases with increasing pressure. In contrast, the total cell voltage may increase with rising pressure in the low current density range. This is because gas bubbles occur at the active surface of the electrode, whose escape radius is inversely proportional to pressure [33,34,35]. Thus, as the pressure increases, gas bubbles with a relatively small radius tend to detach from the electrode [36]. The improvement in bubble dynamics reduces the electrolyte resistance due to the smaller bubble diameter, resulting in a lower ohmic overpotential [37]. However, since the size of the gas bubbles is small, the buoyancy force of the bubbles decreases, leading to a longer adhesion time to the electrode and bubble coverage, which increases the cell voltage by bubble blockage. Therefore, the effect of pressure on the electrolysis voltage is bidirectional.
Furthermore, these results show that changes in the current density also influence the effect of pressure on the electrolysis voltage, which aligns well with the reported literature [38,39]. In the high current density range, the effect of pressure on reducing the overvoltage was more pronounced than its effect on increasing the cell voltage, resulting in an overall decrease in the cell voltage. The reason may be that at high current densities, the electrolysis reaction is intense, with the generation of a large number of bubbles. Dense bubbles generated by high pressure can accelerate the mass transfer, resulting in a decreasing trend of voltage increase with pressure. However, at low current densities, the phenomenon is the opposite. According to Equation (1), increasing the operating pressure can lead to a rise in the reversible voltage, and its effect outweighs the positive impact of bubble generation on mass transfer. Therefore, at low current densities, the total cell voltage may increase with the rising pressure.
As shown in Figure 4c,d, at the same pressure, an increase in temperature resulted in a decrease in the electrolysis voltage, and the effect of temperature on voltage was more significant than that of pressure. When the electrolyzer operated at a current density of 3000 A/m2, the cell voltage decreased significantly by 0.17 V at 7 bar and 0.16 V at 12 bar as the temperature rose from 45 °C to 85 °C. This is because, as the temperature increases, the Gibbs free energy required for electrolysis decreases, and the reaction kinetics are accelerated. Additionally, the conductivity of the electrolyte improves, lowering the ohmic overpotential, and thus the overall electrolysis voltage decreases.
Finally, we conducted a sensitivity analysis on the electrolysis voltage with respect to the operating temperature and pressure. Figure S1 shows the influence of the operating temperature and pressure over the cell voltage at a current density of 3000 A/m2. The cell voltage at 65 °C and 10 bar was considered as the central point. It is evident that the temperature is the most influential parameter on the polarization curve. Over a variation range of 0 to 30%, a variation of 10% of the temperature implies a voltage variation of around 1.5%, while the same variation in pressure only changes the voltage by around 0.1%.

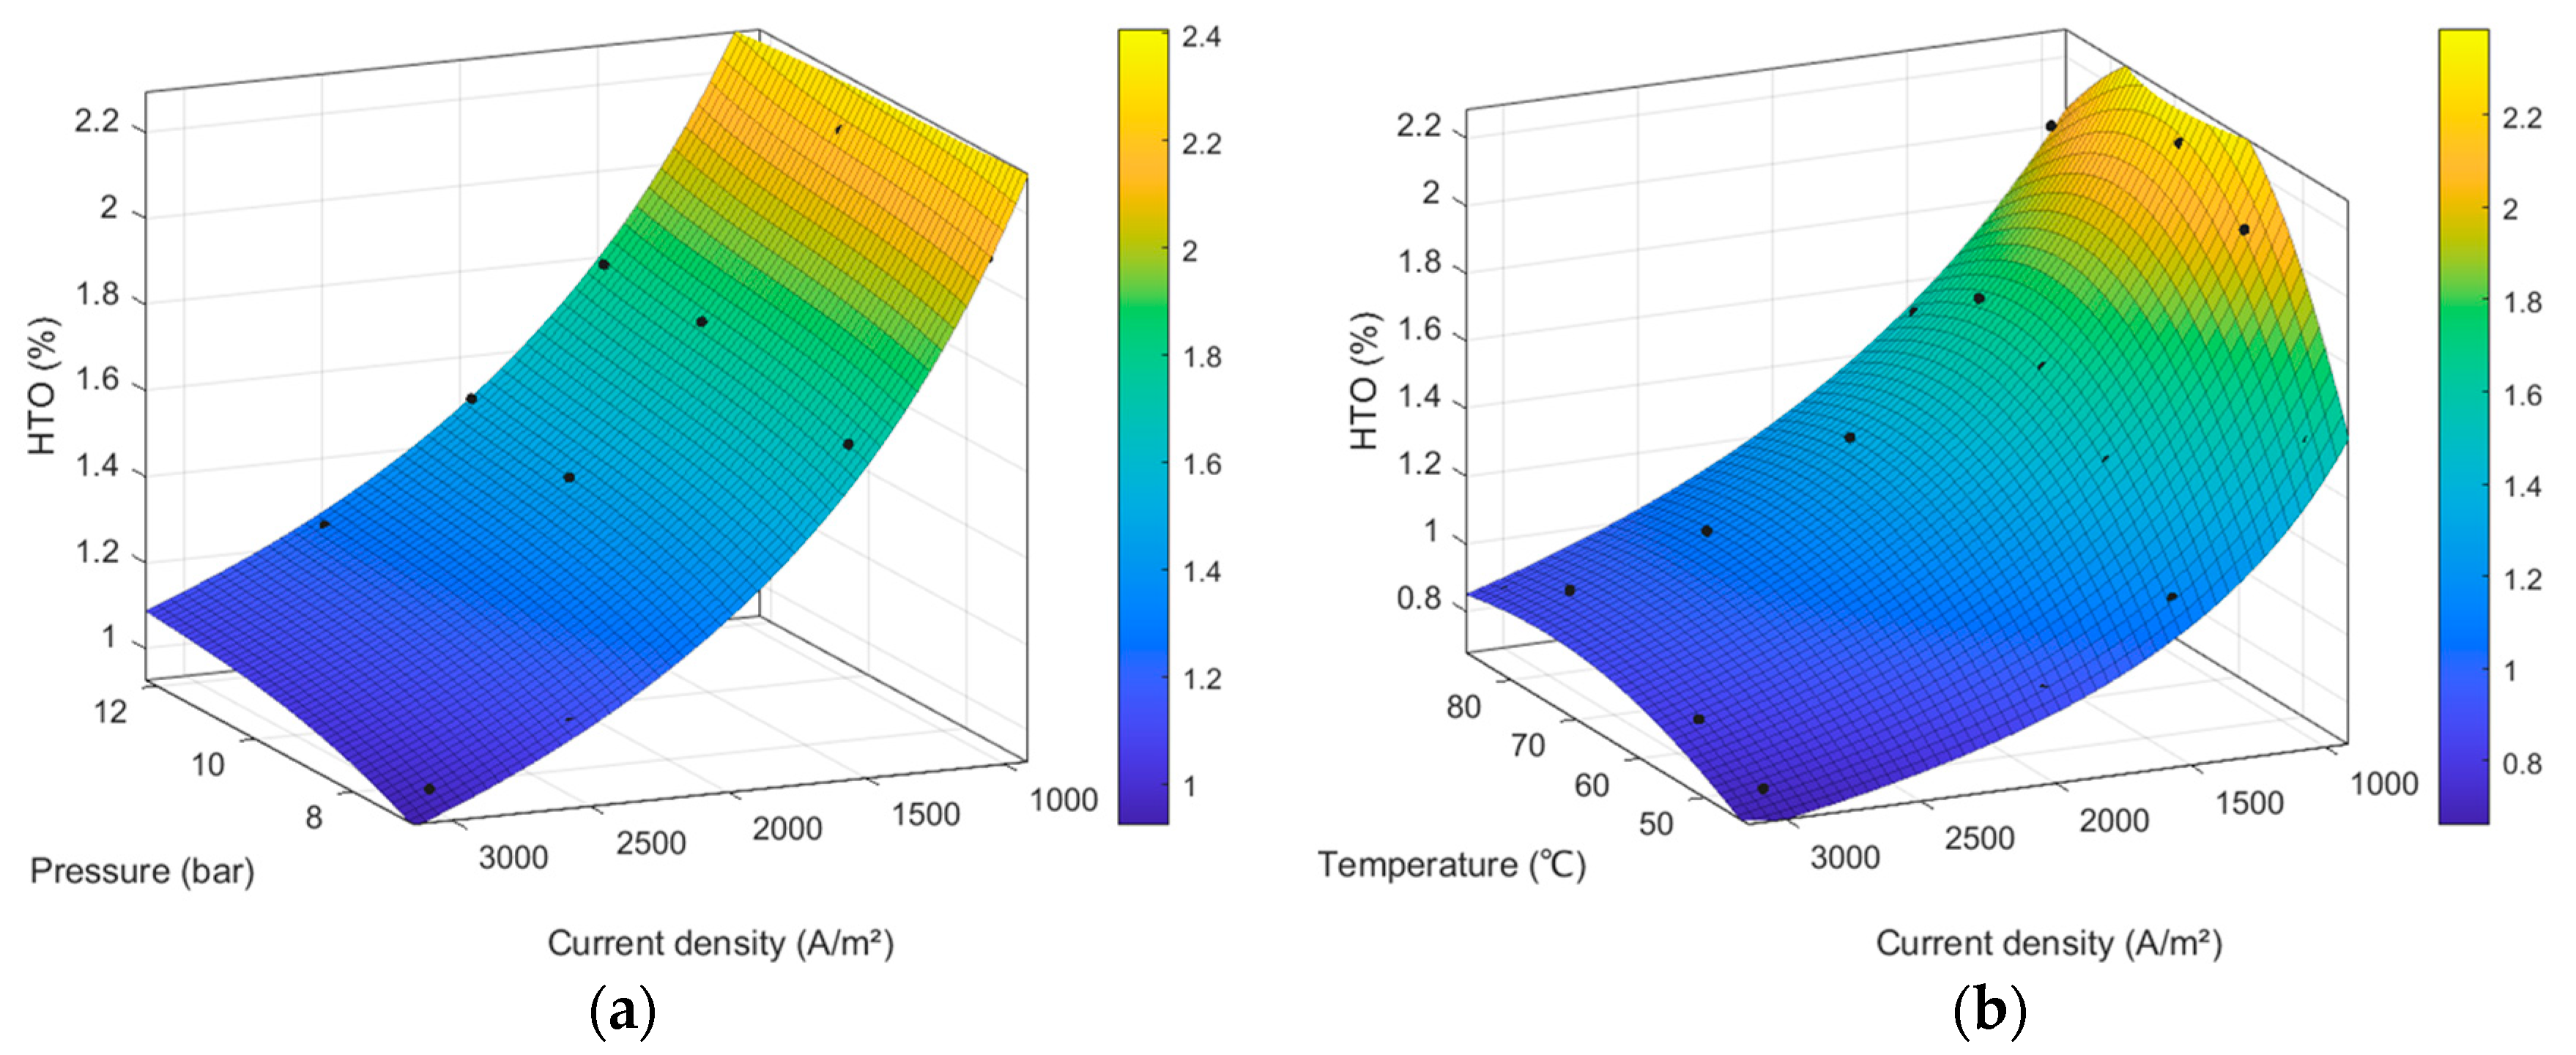
4.2. Results of the Gas Purity Model

Figure 5 shows the surface fitting of the gas purity model under different pressures (7, 10, and 12 bar) and various temperatures (45, 55, 65, and 75 °C), with R2 values of 0.99258 and 0.9919, respectively, demonstrating that the fitting results are valid. As shown in Figure 5a, the HTO increases with rising pressure, indicating that an increased pressure negatively impacts the gas purity. Unlike the consistent effect of pressure, the influence of temperature on gas purity is more complex. As shown in Figure 5b, at high current densities, the HTO increases with rising temperature. However, at low current densities, the HTO initially increases and then decreases as the temperature rises.
Figure 6 compares the fitted curves with experimental data, further validating the feasibility of the simulation model. As shown in Figure 6a,b, at a certain pressure and temperature (e.g., 7 bar and 45 °C), the HTO exhibited a decrease of 0.81% with the current density increasing from 1000 to 3000 A/m2. At a current density of 3000 A/m2 and temperature of 45 °C and 75 °C, the HTO increased by 0.14% and 0.1% as the pressure rose from 7 to 12 bar. It is worth noting that at 75 °C and 1000 A/m2, the HTO exceeded the safety threshold of 2%, suggesting that the AWE electrolyzer faces safety risks at low current densities.
These above results are primarily because the solubility of H2 in the electrolyte solution increases with pressure, and the increased pressure may lead to a more significant pressure differential ( Δ P ) between the cathode and anode. According to Darcy’s law (Equation (10)), the convection of impurities through the membrane increases with rising pressure, leading to a corresponding increase in the HTO [40]. Furthermore, when the temperature and pressure remain stable, the decrease in the current density reduces the O2 production at the anode. At the same time, the H2 impurity level is basically unchanged, so the HTO shows an upward trend.
N H 2 conv = K sep η L   S H 2 , KOH   P H 2 cat   Δ P δ m
N H 2 diff = D H 2 , KOH eff δ m Δ C H 2
In the equation, N H 2 conv is the convection flux density of H2. S H 2 , KOH denotes the solubility of H2 in the KOH solution. K sep represents the hydraulic permeability. N H 2 diff is the diffusion flux density of H2. D H 2 , KOH eff represents the effective diffusion coefficient of H2 within the membrane under the conditions of a KOH solution environment, δ m denotes the thickness of the diaphragm, and Δ c H 2 signifies the concentration gradient of dissolved H2 between the cathode and anode.
As shown in Figure 6c,d, the HTO increased with rising temperature as the current density increased from 1500 A/m2 to 3000 A/m2. This is because the diffusion coefficient ( D H 2 , KOH eff ) of H2 in a 30% KOH solution increases with temperature, and according to Fick’s law (Equation (11)), the diffusion of impurities through the membrane increases. However, an increasing temperature can lead to a downward trend in the HTO (65 °C–75 °C, ≤1000 A/m2). Since the solubility of H2 in the solution decreases with increasing temperature, this may reduce the concentration difference of H2 between the cathode and anode, as well as the H2 partial pressure. Based on Equations (10) and (11) (without considering the effect of the diffusion coefficient change), the cross-diffusion and convection of gases through the membrane decrease, which leads to a reduction in the HTO as the temperature rises. At low current densities, the influence of temperature on the H2 concentration difference and partial pressure may outweigh its effect on the H2 diffusion coefficient, resulting in the observed trend where the HTO increases with temperature and then decreases.
Finally, Figure S2 shows the influence of the operating temperature and pressure on the HTO at the current density of 3000 A/m2, with the reference point set at 65 °C and 10 bar. It can be seen that in the range of variable change from −30% to 0, temperature has the most significant impact on the HTO. A variation of 10% in the temperature implies an HTO variation of around 7.5%, while the same variation in pressure only changes the HTO by around 5%. However, within the range of 0% to 20% variation, the effects of the operating temperature and pressure are similar.

5. Conclusions

In this study, an empirical model for polarization voltage and HTO was developed for a 50 kW AWE electrolyzer. The model parameters were fitted based on experimental data under different pressure and temperature conditions using non-linear regression fitting. According to the experimental data and the fitting curve, this paper comprehensively summarized the impacts of temperature, pressure, and current density on the electrolysis voltage and HTO, as well as the underlying reasons behind these influences. Moreover, since the 50 kW AWE stack used in the experiments was composed of three cells of industrial AWE electrolyzers connected in series, the effective electrode surface area was comparable to that of industrial MW-level AWE systems, making the experimental and modeling results also applicable to industrial MW-level AWE systems. This approach enhances system monitoring, reduces risks, and supports the predictive maintenance of AWE systems driven by RESs. The validated model offers significant potential for improving the safety, efficiency, and operational sustainability of industrial-scale H2 production systems. However, the non-linear relationship between the electrolysis voltage and the operating pressure could be further investigated. More detailed experimental studies could explore this non-linear trend under varying current densities. Future work could also explore the dynamic modeling of AWE systems coupled with RESs to optimize real-time control. Additionally, it could investigate the effects of pressure and temperature on the voltage and the HTO from the perspectives of electrochemical thermodynamics and kinetics.

Supplementary Materials

The following supporting information can be downloaded at: https://www.mdpi.com/article/10.3390/pr12122616/s1, Figure S1: Sensitivity analysis of the electrolysis voltage to operating temperature and pressure at 3000 A/m2, the cell voltage at 65 °C and 10 bar is considered as a central point; Figure S2: Sensitivity analysis of the HTO to operating temperature and pressure at 3000 A/m2, the HTO at 65 °C and 10 bar is considered as a central point; Figure S3: Schematic diagram illustrating the effects of pressure and temperature on electrolysis voltage and HTO.

Author Contributions

Methodology, M.L. and X.Z.; investigation, M.L., X.Z. and Y.J.; formal analysis, M.L. and X.Z.; data curation, G.S.; writing—original draft preparation, M.L., X.Z., Y.J. and G.S.; resources, K.W.; writing—review and editing, Y.L. and S.Z.; supervision, J.S. and C.G.; project administration, Y.L. All authors have read and agreed to the published version of the manuscript.

Funding

This research was funded by the Technology Project of State Grid Zhejiang Electric Power Co., Ltd. (no. B311DS230005).

Data Availability Statement

The original contributions presented in the study are included in the article, and further inquiries can be directed to the corresponding authors.

Acknowledgments

We sincerely thank Kun Wang for their discussion and input to this work. The authors would also like to acknowledge the equipment from the Hangzhou Meiyida Qingneng Technology Co., Ltd.

Conflicts of Interest

Author Min Liu was employed by the State Grid Zhejiang Electric Power Co., Ltd. The remaining authors declare that the research was conducted in the absence of any commercial or financial relationships that could be construed as a potential conflict of interest. The State Grid Zhejiang Electric Power Co., Ltd. had no role in the design of the study; in the collection, analyses, or interpretation of data; in the writing of the manuscript, or in the decision to publish the results.

Nomenclature

E rev   0 the standard reversible potential
Rthe universal gas constant
Tthe electrolyzer temperature, °C
Ffaraday constant
Pthe electrolyzer pressure, bar
P H 2 O the pressure of H2 and O2 gases in the existence of water vapor near the electrode, bar
P H 2 O * the pure water’s vapor pressure, bar
U rev the reversible voltage, V
r · i the ohmic overpotential, V
ithe current density, A/m2
rthe electrolyzer ohmic, Ω
U rev the reversible voltage for electrolysis, V
N H 2 conv the convection flux density of H2, kg/(m2·s)
N H 2 diff the diffusion flux density of H2, kg/(m2·s)
S H 2 , KOH the solubility of H2 in the KOH solution, g
K sep the hydraulic permeability, D
D H 2 , KOH eff the effective diffusion coefficient of H2, m2/s
δ m the thickness of the diaphragm, m
Δ c H 2 the concentration gradient of dissolved H2 between the cathode and anode, mol/L
Not mentioned symbolscoefficient (noted in Table 3)

References

  1. Buttler, A.; Spliethoff, H. Current status of water electrolysis for energy storage, grid balancing and sector coupling via power-to-gas and power-to-liquids: A review. Renew. Sustain. Energy Rev. 2018, 82, 2440–2454. [Google Scholar] [CrossRef]
  2. Glenk, G.; Reichelstein, S. Economics of converting renewable power to hydrogen. Nat. Energy 2019, 4, 216–222. [Google Scholar] [CrossRef]
  3. Guo, J.; Zhang, Y.; Zavabeti, A.; Chen, K.; Guo, Y.; Hu, G.; Fan, X.; Li, G.K. Hydrogen production from the air. Nat. Commun. 2022, 13, 5046. [Google Scholar] [CrossRef] [PubMed]
  4. Turner, J.A. Sustainable Hydrogen Production. Science 2004, 305, 972–974. [Google Scholar] [CrossRef] [PubMed]
  5. Xie, H.; Zhao, Z.; Liu, T.; Wu, Y.; Lan, C.; Jiang, W.; Zhu, L.; Wang, Y.; Yang, D.; Shao, Z. A membrane-based seawater electrolyser for hydrogen generation. Nature 2022, 612, 673–678. [Google Scholar] [CrossRef]
  6. Haoran, C.; Xia, Y.; Wei, W.; Yongzhi, Z.; Bo, Z.; Leiqi, Z. Safety and efficiency problems of hydrogen production from alkaline water electrolyzers driven by renewable energy sources. Int. J. Hydrogen Energy 2024, 54, 700–712. [Google Scholar] [CrossRef]
  7. Hu, S.; Guo, B.; Ding, S.; Yang, F.; Dang, J.; Liu, B.; Gu, J.; Ma, J.; Ouyang, M. A comprehensive review of alkaline water electrolysis mathematical modeling. Appl. Energy 2022, 327, 120099. [Google Scholar] [CrossRef]
  8. Kwon, J.; Choi, S.; Park, C.; Han, H.; Song, T. Critical challenges and opportunities for the commercialization of alkaline electrolysis: High current density, stability, and safety. Mater. Chem. Front. 2024, 8, 41–81. [Google Scholar] [CrossRef]
  9. Daoudi, C.; Bounahmidi, T. Overview of alkaline water electrolysis modeling. Int. J. Hydrogen Energy 2024, 49, 646–667. [Google Scholar] [CrossRef]
  10. Sharshir, S.W.; Joseph, A.; Elsayad, M.M.; Tareemi, A.A.; Kandeal, A.W.; Elkadeem, M.R. A review of recent advances in alkaline electrolyzer for green hydrogen production: Performance improvement and applications. Int. J. Hydrogen Energy 2024, 49, 458–488. [Google Scholar] [CrossRef]
  11. Gomez Vidales, A.; Semai, M. Platinum nanoparticles supported on nickel-molybdenum-oxide for efficient hydrogen production via acidic water electrolysis. J. Mol. Struct. 2023, 1290, 135956. [Google Scholar] [CrossRef]
  12. Gomez Vidales, A.; Millan, N.C.; Bock, C. Modeling of anion exchange membrane water electrolyzers: The influence of operating parameters. Chem. Eng. Res. Des. 2023, 194, 636–648. [Google Scholar] [CrossRef]
  13. Burton, N.A.; Padilla, R.V.; Rose, A.; Habibullah, H. Increasing the efficiency of hydrogen production from solar powered water electrolysis. Renew. Sustain. Energy Rev. 2021, 135, 110255. [Google Scholar] [CrossRef]
  14. Iribarren, A.; Barrios, E.; Ibaiondo, H.; Sanchez-Ruiz, A.; Arza, J.; Sanchis, P.; Ursua, A. Dynamic modeling and simulation of a pressurized alkaline water electrolyzer: A multiphysics approach. IEEE Trans. Ind. Appl. 2023, 59, 3741–3753. [Google Scholar] [CrossRef]
  15. Janssen, H.; Bringmann, J.C.; Emonts, B.; Schroeder, V. Safety-related studies on hydrogen production in high-pressure electrolysers. Int. J. Hydrogen Energy 2004, 29, 759–770. [Google Scholar] [CrossRef]
  16. Zhang, T.; Song, L.; Yang, F.; Ouyang, M. Research on oxygen purity based on industrial scale alkaline water electrolysis system with 50 Nm3 H2/h. Appl. Energy 2024, 360, 122852. [Google Scholar] [CrossRef]
  17. Cheng, H.; Xia, Y.; Hu, Z.; Wei, W. Optimum pulse electrolysis for efficiency enhancement of hydrogen production by alkaline water electrolyzers. Appl. Energy 2024, 358, 122510. [Google Scholar] [CrossRef]
  18. Speckmann, F.-W.; Bintz, S.; Birke, K.P. Influence of rectifiers on the energy demand and gas quality of alkaline electrolysis systems in dynamic operation. Appl. Energy 2019, 250, 855–863. [Google Scholar] [CrossRef]
  19. Ursúa, A.; Marroyo, L.; Gubía, E.; Gandía, L.M.; Diéguez, P.M.; Sanchis, P. Influence of the power supply on the energy efficiency of an alkaline water electrolyser. Int. J. Hydrogen Energy 2009, 34, 3221–3233. [Google Scholar] [CrossRef]
  20. Xia, Y.; Cheng, H.; He, H.; Hu, Z.; Wei, W. Efficiency Enhancement for Alkaline Water Electrolyzers Directly Driven by Fluctuating PV Power. IEEE Trans. Ind. Electron. 2024, 71, 5755–5765. [Google Scholar] [CrossRef]
  21. Xia, Y.; Cheng, H.; He, H.; Wei, W. Efficiency and consistency enhancement for alkaline electrolyzers driven by renewable energy sources. Commun. Eng. 2023, 2, 22. [Google Scholar] [CrossRef]
  22. Xiong, J.; Xia, Y.; Peng, Y.; Wei, W. A Multimode Self-Optimization Electrolysis Converting Strategy for Improving Efficiency of Alkaline Water Electrolyzers. IEEE Trans. Ind. Electron. 2024, 39, 3738–3748. [Google Scholar] [CrossRef]
  23. Milewski, J.; Guandalini, G.; Campanari, S. Modeling an alkaline electrolysis cell through reduced-order and loss-estimate approaches. J. Power Sources 2014, 269, 203–211. [Google Scholar] [CrossRef]
  24. Olivier, P.; Bourasseau, C.; Bouamama, P.B. Low-temperature electrolysis system modelling: A review. Renew. Sustain. Energy Rev. 2017, 78, 280–300. [Google Scholar] [CrossRef]
  25. Haug, P.; Kreitz, B.; Koj, M.; Turek, T. Process modelling of an alkaline water electrolyzer. Int. J. Hydrogen Energy 2017, 42, 15689–15707. [Google Scholar] [CrossRef]
  26. Abdin, Z.; Webb, C.J.; Gray, E.M. Modelling and simulation of an alkaline electrolyser cell. Energy 2017, 138, 316–331. [Google Scholar] [CrossRef]
  27. Henao, C.; Agbossou, K.; Hammoudi, M.; Dubé, Y.; Cardenas, A. Simulation tool based on a physics model and an electrical analogy for an alkaline electrolyser. J. Power Sources 2014, 250, 58–67. [Google Scholar] [CrossRef]
  28. Kirati, S.K.; Hammoudi, M.; Mousli, I.M.A. Hybrid energy system for hydrogen production in the Adrar region (Algeria): Production rate and purity level. Int. J. Hydrogen Energy 2018, 43, 3378–3393. [Google Scholar] [CrossRef]
  29. Hug, W.; Bussmann, H.; Brinner, A. Intermittent operation and operation modeling of an alkaline electrolyzer. Int. J. Hydrogen Energy 1993, 18, 973–977. [Google Scholar] [CrossRef]
  30. Ulleberg, Ø. Modeling of advanced alkaline electrolyzers: A system. Int. J. Hydrogen Energy 2003, 28, 21–33. [Google Scholar] [CrossRef]
  31. Sánchez, M.; Amores, E.; Rodríguez, L.; Clemente-Jul, C. Semi-empirical model and experimental validation for the performance evaluation of a 15 kW alkaline water electrolyzer. Int. J. Hydrogen Energy 2018, 43, 20332–20345. [Google Scholar] [CrossRef]
  32. Ren, Z.; Wang, J.; Yu, Z.; Zhang, C.; Gao, S.; Wang, P. Experimental studies and modeling of a 250-kW alkaline water electrolyzer for hydrogen production. J. Power Sources 2022, 544, 231886. [Google Scholar] [CrossRef]
  33. Sillen, C.W.M.P.; Barendrecht, E.; Janssen, L.J.J.; van Stralen, S.J.D. Gas bubble behaviour during water electrolysis. Int. J. Hydrogen Energy 1982, 7, 577–587. [Google Scholar] [CrossRef]
  34. Angulo, A.; van der Linde, P.; Gardeniers, H.; Modestino, M.; Fernández Rivas, D. Influence of Bubbles on the Energy Conversion Efficiency of Electrochemical Reactors. Joule 2020, 4, 555–579. [Google Scholar] [CrossRef]
  35. Sakas, G.; Ibáñez-Rioja, A.; Pöyhönen, S.; Järvinen, L.; Kosonen, A.; Ruuskanen, V.; Kauranen, P.; Ahola, J. Sensitivity analysis of the process conditions affecting the shunt currents and the SEC in an industrial-scale alkaline water electrolyzer plant. Appl. Energy 2024, 359, 122732. [Google Scholar] [CrossRef]
  36. Altuntepe, A.; Erkan, S.; Olgar, M.A.; Çelik, S.; Zan, R. Investigating surface area and hydrogen pressure effects on LiH and NaH. J. Solid State Chem. 2024, 330, 124483. [Google Scholar] [CrossRef]
  37. Kuleshov, N.V.; Kuleshov, V.N.; Dovbysh, S.A.; Grigoriev, S.A.; Kurochkin, S.V.; Millet, P. Development and performances of a 0.5 kW high-pressure alkaline water electrolyser. Int. J. Hydrogen Energy 2019, 44, 29441–29449. [Google Scholar] [CrossRef]
  38. Li, Y.; Zhang, T.; Deng, X.; Liu, B.; Ma, J.; Yang, F.; Ouyang, M. Active pressure and flow rate control of alkaline water electrolyzer based on wind power prediction and 100% energy utilization in off-grid wind-hydrogen coupling system. Appl. Energy 2022, 328, 120172. [Google Scholar] [CrossRef]
  39. Li, Y.; Zhang, T.; Ma, J.; Deng, X.; Gu, J.; Yang, F.; Ouyang, M. Study the effect of lye flow rate, temperature, system pressure and different current density on energy consumption in catalyst test and 500W commercial alkaline water electrolysis. Mater. Today Phys. 2022, 22, 100606. [Google Scholar] [CrossRef]
  40. Schalenbach, M.; Lueke, W.; Stolten, D. Hydrogen Diffusivity and Electrolyte Permeability of the Zirfon PERL Separator for Alkaline Water Electrolysis. J. Electrochem. Soc. 2016, 163, F1480–F1488. [Google Scholar] [CrossRef]
Figure 1. Process flow diagram of an alkaline electrolysis plant.
Processes 12 02616 g001
Figure 2. 50 kW AWE system. (a) Electrolyzer; (b) balance of plant; (c) control interface.
Processes 12 02616 g002
Figure 3. Fitting results of the polarization curve of the AWE electrolyzer with respect to different (a) pressures (at 75 °C) and (b) temperatures (at 7 bar).
Processes 12 02616 g003
Figure 4. Comparison between simulated (line) and measured (dot) polarization curves of the AWE electrolyzer at different (a) pressures (at 45 °C); (b) pressures (at 75 °C); (c) temperatures (at 7 bar); and (d) temperatures (at 12 bar).
Processes 12 02616 g004
Figure 5. Fitting results of the HTO of the AWE electrolyzer with respect to different (a) pressures (at 75 °C) and (b) temperatures (at 7 bar).
Processes 12 02616 g005
Figure 6. Comparison between simulated (line) and measured (dot) HTO at different (a) pressures (at 45 °C); (b) pressures (at 75 °C); (c) temperatures (at 7 bar); and (d) temperatures (at 12 bar).
Processes 12 02616 g006aProcesses 12 02616 g006b
Table 1. Technical data of the 50 kW AWE test bench.
Main FeaturesValuesUnit
Capacity of hydrogen production10.00Nm3 h−1
Maximum operating pressure1.60MPa
Electrolyte concentration30wt% KOH
Voltage range0–6.5V
Electrical current range0–7600A
Maximum power50kW
Table 2. Summary of the experimental data.
No.Current (A)Pressure (bar)Temperature (°C)Cell Voltage (V)HTO (%)
125337451.791.56
238007451.861.15
350007451.930.93
463307452.000.78
576007452.040.75
625337551.782.07
738007551.851.44
850007551.911.13
963307551.970.90
1076007552.030.84
1125337651.722.21
1238007651.801.60
1350007651.851.25
1463307651.911.01
1576007651.970.85
1625337751.662.09
1738007751.751.69
1850007751.811.33
1963307751.871.11
2076007751.930.99
2125337851.642.03
2238007851.711.53
2350007851.761.21
2463307851.811.00
2576007851.870.87
26253310751.672.20
27380010751.731.79
28500010751.801.46
29633010751.851.18
30760010751.911.04
31253312751.682.23
32380012751.741.80
33500012751.791.52
34633012751.851.26
35760012751.891.09
Table 3. Coefficients calculated modeling a 50 kW AWE electrolyzer.
CoefficientValueUnit
r 1 5.5137 × 10⁻⁵Ω·m2
r 2 −1.2270 × 10⁻⁷Ω·m2·°C
d 1 8.2132 × 10⁻⁶Ω·m2
d 2 −1.6911 × 10⁻⁶Ω·m2·bar−1
s0.1467V
t 1 −0.0357m2·A−1
t 2 4.9644m2·°C·A−1
t 3 −90.4262m2·°C·A−1
C 1 16.0995\
C 2 −0.2259°C−1
C 3 8.4417 × 10⁻⁴°C−2
C 4 −14.8585\
C 5 0.1948°C−1
C 6 −6.5825 × 10⁻⁴°C−2
C 7 151.4947A·m−2
C 8 0.0052A·m−2·°C−1
C 9 −0.1755A·m−2·°C−2
E 1 0.1172\
E 2 −1.2924bar−1
E 3 0.0940bar−2
E 4 −0.9123\
E 5 1.4749bar−1
E 6 −0.1018bar−2
E 7 1.8452A·m−2
E 8 0.9521A·m−2·bar−1
E 9 −0.7132A·m−2·bar−2
Disclaimer/Publisher’s Note: The statements, opinions and data contained in all publications are solely those of the individual author(s) and contributor(s) and not of MDPI and/or the editor(s). MDPI and/or the editor(s) disclaim responsibility for any injury to people or property resulting from any ideas, methods, instructions or products referred to in the content.

