Article

Comprehensive Study of Sustainable Pressurized Liquid Extractions to Obtain Bioavailable Antioxidant Phenolic Compounds from Grape Seed By-Products

1
Institute of Food Science Research (CIAL), Universidad Autónoma de Madrid (CEI UAM+CSIC), 28049 Madrid, Spain
2
Pólo de Inovação de Dois Portos, Instituto Nacional de Investigação Agrária e Veterinária, I.P., Quinta da Almoinha, 2565-191 Dois Portos, Portugal
3
School of Functional Food and Wine, Shenyang Pharmaceutical University, Shenyang 110016, China
4
Instituto Madrileño de Estudios Avanzados (IMDEA-Food Institute), Universidad Autónoma de Madrid (CEI UAM+CSIC), 28049 Madrid, Spain
*
Author to whom correspondence should be addressed.
Processes 2024, 12(11), 2308; https://doi.org/10.3390/pr12112308
Submission received: 27 September 2024 / Revised: 14 October 2024 / Accepted: 19 October 2024 / Published: 22 October 2024

Abstract

:
Few investigations have been conducted to evaluate pressurized liquid extraction (PLE) technology as a sustainable method for the recovery of phenolic compounds of grape seed by-products. In this study, PLE combined with an experimental design was evaluated for optimizing the sustainable extraction of phenolic compounds from grape seed by-products. The solvent ethanol content (X1, 0–100%), temperature (X2, 20–100 °C) and time (X3, 1–11 min) were studied as independent experimental factors. Yield, TPC, antioxidant activity and phenolic composition were analyzed as optimized dependent variables. Two optimal extraction conditions at different temperatures (20 °C and 100 °C) were found, but thermal degradations at 100 °C allowed for selecting the optimal condition as 75% ethanol, 11 min and 20 °C. The optimal extracts showed high phenolic content (TPC = 350.80 ± 3.97 mg GAE/g extract) and antioxidant activity (ABTS, 9.31 ± 0.33 mmol Trolox/g extract), mainly composed of polymeric and mono-oligomeric flavan-3-ols. The digestion process reduced the TPC and antioxidant activity due to the low bioaccessibility of the flavan-3-ols, mainly as catechin, epicatechin and polymeric proanthocyanidin losses during the digestion process. However, increases in the antioxidant activity of the basolateral side (DDPH, 0.061 ± 0.000 mmol Trolox/g extract) were determined after in vitro transepithelial transport, which is a consequence of bioavailable catechin and epicatechin and reduced amounts of dimer B2, dimer B1, epicatechin gallate and gallic acid. Consequently, PLE combined with hydroalcoholic solvents at a low temperature resulted in a valuable methodology to obtain sustainable extracts from grape seed by-products (contributing to the circular economy), containing bioavailable phenolic compounds, which are able to increase the antioxidant status.

1. Introduction

In recent years, the recovery of bioactive compounds from agro-industrial by-products has considerably increased [1]. In that regard, grape wastes are one of the most investigated by-products for the circular economy. Grape by-products represent 5% of the grape weight, and 40–50% of the generated solid wastes during the winemaking process, which involves the production of a high mass of by-products [2]. A noticeable global market has been estimated for grape phenolic compounds, which is estimated to reach 946.90 million USD by 2023 with its own trademark through functional foods based on polyphenol-fortified products [3]. In this context, grape by-products have been extensively investigated as sources of phenolic compounds with potential health benefits [4]. Among them, grape seeds have received noticeable attention from the scientific community due to their greater amounts of phenolic compounds and antioxidant activity [5,6]. Most of the grape phenolic compounds are contained in grape seeds (60–70% of the total phenolic compounds) [5], which consist of approximately 7% phenolic substances, including flavonoids and phenolic acids [6]. Derived from their high content of phenolic compounds, grape seed extracts have shown several beneficial activities, such as neuroprotection due to their antioxidant activity [7] or the modulation of metabolic biomarkers associated with obesity or diabetes [8,9], arousing great interest as potential functional ingredients [3]. However, oral intake of phenolic extracts may limit their potential health benefits because of their low bioavailability due to their gastrointestinal degradation, instability under certain pH conditions, or low intestinal permeability. Therefore, when evaluating the potential health benefits of phenolic extracts, their bioavailability becomes a critical factor [10]. Phenolic bioavailability depends on several factors, including the food matrix and the type and structure of the phenolic compounds. Hence, the bioaccessibility and bioavailability of phenolic extracts must be studied when developing an enriched phenolic extract [10,11].
When considering the recovery of bioactive compounds from plant sources, the extraction procedure is critical. Solid–liquid extractions (SLEs) have been commonly used to generate phenolic extracts. However, these methods usually have different drawbacks, such as intensive laborious procedures, long extraction times, the need for large volumes of solvents or low extraction yields. Consequently, more efficient and sustainable extraction technologies have been investigated, such as ultrasonic-assisted extraction (UAE), supercritical fluid extraction (SFE), electric field treatment (EFT), microwave-assisted extraction (MAE) and pressurized liquid extraction (PLE) [1]. Specifically, PLE commonly combines the application of high pressure with high temperatures, allowing for solvents to be overheated while maintaining a liquid state. Because overheating solvents enhances the penetration capacity of the solvent in the food matrix due to the applied pressure, PLE allows for improving the extraction yield while reducing the extraction time and the used solvent amount, reaching more sustainable and efficient extractions [1,10]. Regarding grape seeds, advanced extraction technologies such as UAE [12], MAE [13] or subcritical water extractions [14,15] have been studied, among others. However, although improved extractions can be conducted by applying these methodologies, the diverse extraction factors determine the final extraction capacity of the applied method [16]. Hence, to maximize the recovery of a compound or group of compounds, the extraction procedure must be optimized in terms of the extraction conditions to achieve the most efficient compound recovery. For this purpose, the use of experimental designs, along with the response surface methodology (RSM), has been previously indicated as a useful tool that enables the analysis of the influence of different extraction factors and allows for reducing the number of experimental trials [17]. However, poor attention has been paid to optimizing a sustainable extraction process for grape seed by-products based on PLE technology combined with green solvents through the RSM. As a consequence, an optimized PLE process based on hydroalcoholic (water:ethanol) mixtures through the RSM has not been reported.
In this study, a sustainable PLE process based on ethanol:water mixtures as green solvents, and optimized through the RSM, was conducted to maximize phenolic compound recoveries from grape seed by-products. Also, the bioavailability of the optimal extract was investigated, characterizing the bioaccessible and bioavailable compounds, as well as their potential capacity to enhance the antioxidant status.

2. Materials and Methods

2.1. Chemicals and Reagents

Acetonitrile HPLC quality was supplied by Labscan (Dublin, Ireland) and formic acid HPLC quality was by Acros Organic (Geel, Belgium). Protocatechuic acid, vanillic acid, p-coumaric acid, 3 coumaric acid, (+)-catechin, (−)-epicatechin, epicatechin gallate, catechin gallate, procyanidin B1, procyanidin B2, procyanidin A2, quercetin-3-O-glucuronide, quercetin-3-O-glucoside and quercetin dehydrate were purchased from Extrasynthèse (Genay, France). Gallic acid, trans-caftaric acid, ellagic acid, protocatechuic aldehyde, 6-hydroxy-2,5,7,8-tetramethylchromane-2-carboxylic acid (Trolox), potassium persulfate, 2,2′-azinobis(3-ethylbenzothiazoline-6-sulphonic acid) diammonium salt (ABTS), 2,2-diphenyl-1-picrylhydrazyl (DPPH), phosphate buffer 1 M, fluorescein sodium and 2,2′-azobis(2-methylpropionamidine) dihydrochloride (AAPH) were obtained from Sigma-Aldrich (Madrid, Spain). Disodium carbonate, Folin–Ciocalteu reagent, methanol and ethanol were from Panreac (Barcelona, Spain).

2.2. Plant Material

Grape seeds from Merlot variety (Vitis vinifera L. cv. Merlot) were provided by Instituto Madrileño de Investigación y Desarrollo Rural, Agrario y Alimentario (IMIDRA, Madrid, Spain). After manually de-stemming, grape berries were slowly crushed for 3.5 h to remove the must. The solid waste was washed 3 times with ultrapure water (1:1.5 w/v) at 20 °C to remove pulp wastes. Seed samples were collected after manual separation from the generated marc and washed with ultrapure water (20 °C) and dried in laboratory paper to remove must residues and excess water. After that, seeds were dried at 40 °C for 48 h in an air bath Stuart S150 (Stuart S150, VWR, Barcelona, Spain). Thereafter, dried material was grounded in a commercial blender and sieved to a ≤1 mm particle size. Dried seed powder was defatted following the method proposed by Xu et al. [18]. The resulting material was stored in a closed bag at −20 °C until further use.

2.3. Experimental Design

A central composite rotatable design (CCRD) was used to evaluate the influence of three independent variables (factors), i.e., solvent composition (X1, 0–100% ethanol), extraction temperature (X2, 20–100 °C) and extraction time (X3, 1–11 min) on the yield, antioxidant activity (ABTS), total phenolic content (TPC) and flavan-3-ols content (mono-oligomers fraction and polymeric fraction), measured by means of polymerization degree by NP HPLC. A total of 19 experimental conditions were conducted at five levels (23 full factorial design + 6-star points + 5 central points) (Table 1). The influence of the different experimental factors was measured using the RSM. Regression analysis of the response variable data was performed and fitted to a quadratic polynomial model indicated in the following equation:
Y = β0 + β1Et + β2T + β3t + β1,1Et2 + β2,2T2 + β3,3t2 + β1,2EtT + β1,3Ett + β2,3Tt + ε,
where Y is the response variable; β0 is the independent term; β1, β2, β3 are the linear coefficients; β1,1, β2,2, β3,3 are the quadratic coefficients; β1,2, β1,3, β2,3 are the factor interaction coefficients; and ε is the experimental error. The goodness of fit was evaluated by the determination coefficient (R2), the residual standard deviation (RSD) and the lack-of-fit test provided by the analysis of variance (ANOVA).

2.4. Pressurized Liquid Extraction (PLE)

Extractions were carried out using ASE 350 equipment (Sunnyvale, CA, USA). A total of 0.5 g of dry defatted seed powder was homogenized with 1.5 g of diatomaceous earth (Dionex Corporation, Sunnyvale, CA, USA) in a ceramic mortar. The mixture was loaded in an 11 mL extraction cell. Two cellulose filters (Dionex Corporation, USA) were placed at the bottom of the cell to prevent the system clogging. The cell was automatically filled with the proper solvent up to a pressure of 1500 psi. A static extraction (a single extraction cycle) at the established temperature and time conditions was carried out below (heat-up time was fitted according to the applied extraction temperature, e.g., 5 min, when the extraction temperature was 40 °C). After the static extraction step, a rinsing step was conducted in the extraction cell (with 60% cell volume using the same extraction solvent) and the solvent was removed from the cell entrained with pressurized N2 gas for 90 s. After cell depressurization, the whole system was rinsed to avoid carry-over to subsequent extractions. The ethanol from all extracts was removed by vacuum evaporation at 37 °C using an IKA RV 10 control (IKA RV 10 control, IKA, Staufen, Germany). The remaining water was removed by freeze-drying (Telstar Lyobeta 15 equipment; Telstar, Madrid, Spain), resulting in a powder extract, which was stored at −20 °C until further analysis.

2.5. HPLC-PAD Analysis of Phenolic Composition

Phenolic composition was conducted following the method previously reported by our group [17]. Chromatographic analyses were carried out in an Agilent Infinity 1260 liquid chromatograph, equipped with a photodiode array detector (PAD). Chromatographic separations were conducted using a chromatographic column C18 ACE RP18-AR (150 mm × 4.6 mm, 3 μm particle size) (Symta, Madrid, Spain) protected by a guard column ACE 3 C18-AR (7 mm × 13 mm) packed with the same stationary phase. Identification and quantification processes were performed through Agilent ChemStation software (Agilent, vers. 6.8). Phenolic compound identification was conducted by comparing their retention time and UV/Vis spectrum with analytical reference substances. Quantification was carried out through the interpolation of peak areas with respect to the calibration curves of their reference compounds. Hydroxybenzoic acids and flavan-3-ols were quantified at 280 nm, hydroxycinnamic acids and stilbenes at 320 nm and flavonols at 360 nm. Analyses of 3 individual samples were conducted in triplicate.

2.6. Analysis of Total Flavan-3-ol Mono-Oligomers and Total Polymers by NP HPLC

Phenolic composition based on their polymerization degree and polarity was conducted following the previous method reported by Muñoz-Labrador et al. [19] and Nieto et al. [10]. Chromatographic analyses were performed using the same equipment mentioned above (Agilent Infinity 1260 liquid chromatograph system). Chromatographic separation was conducted using a polar chromatographic column Kromasil 60 DIOL (250 mm × 4.6 mm, 5 µm particle size; AzkoNobel, Amsterdam, The Netherland) equipped with a pre-column with the same material Lichrospher Diol-5 (7 mm × 13 mm). Solvent (A) was 2% acetic acid in acetonitrile, solvent (B) was methanol containing 2% acetic acid and 3% water and solvent (C) was a 2% aqueous acetic acid. The column temperature was maintained at 35 °C during the whole analysis. The mobile phase was pumped at a constant flow rate of 0.8 mL min−1. A total of 10 μL of each sample was used for the analyses.
Flanvan-3-ol monomers and oligomers were identified according to their retention time and UV/Vis spectrum in comparison with a purified flavan-3-ol oligomer from a cocoa-rich extract, used here as a complex reference substance for oligomer procyanidins up to octamers. Total polymer procyanidins eluted as a singular peak at the end of the chromatogram. Total polymers, as well as both mono- and oligomers, were monitored at 280 nm and quantified through interpolation with respect to a catechin calibration curve. Therefore, the results were expressed as mg of catechin equivalent (CE)/g extract. Samples were analyzed in triplicate.

2.7. Determination of Mean Degree of Procyanidin Polymerization (mDP)

Polymeric and oligomeric flavan-3-ol procyanidins were isolated following the method reported by Sun et al. [20]. This method is based on a minicolumn assembly-line system, comprising a minicolumn cartridge C18 Sep-Pack and a tC18 Sep-Pack (Waters, Milford, MA, USA), where phenolic fractions are generated with diverse solvents until the phenolic polymers are reached. Isolated proanthocyanidins were acid-catalyzed and degraded using toluene-α-tiol to characterize the proanthocyanidin composition. Quantification of the degradation products was conducted by RP-HPLC-PAD. Triplicates were conducted.

2.8. TPC

The total phenolic content was determined using the well-established method of Folin–Ciocalteu reagent [21]. The results were expressed as mg of gallic acid equivalents (GAE)/g extract. All analyses were conducted in triplicate.

2.9. Antioxidant Activity

An ABTS•+ radical scavenging assay was performed following the original method described by Re et al. [22], whereas a DPPH radical scavenging assay was conducted according to Brand-Williams et al. [23]. An ORAC assay was carried out using the method previously reported by our group [17]. The antioxidant analyses were performed in triplicate, and the results obtained with the three antioxidant methods were expressed as the TEAC value (mmol Trolox/g extract).

2.10. In Vitro Digestion Process

The in vitro digestion process was carried out following a previously published protocol by our group [17], conducted in a titrator Tritinio Plus 877 (Methrom, Herisau, Switzerland). Briefly, 5 mL of the optimal extract (30 mg/mL in water) was placed in the conical double-jacket vessel, mixed with 0.1 mL of a simulated human saliva (9.3 mg of α-amylase from human saliva-type XIII-A in Cl2Ca 1 mM; Sigma-Aldrich, Madrid, Spain) and shaken for 2 min at 37 °C, generating the oral phase. Immediately after, the oral phase was subsequently submitted to the gastric and intestinal digestion steps. The stomach and intestinal phases were carried out. Gastric digestion was simulated by mixing the oral phase with 25 mL of a gastric solution (127 mg of porcine pepsin from porcine mucosa, 536 U/mg; Sigma-Aldrich, Madrid, Spain). The pH was adjusted at pH 2 with 0.1 M HCl, and the gastric medium was shaken for 1 h at 37 °C (gastric phase). After gastric digestion and prior to the pancreatic step, the digestion medium was adjusted to pH 7 with 1 M NaHCO3. For performance of the intestinal digestion, a simulated intestinal fluid consisting of 9.3 mg pancreatin (pancreatic-bile extract, Sigma-Aldrich, Madrid, Spain) and 115,7 mg of bile salts in 2.8 mL of 10 mM trizme-maleate buffer was added. The mixture was maintained for 2 h at 37 °C (intestinal phase). After the digestion process, the soluble/bioaccessible fraction was obtained by filtrating the digested sample through a 0.45 μm PVDF filter to remove the non-soluble/precipitated compounds. The samples were kept at −20 °C until analysis. The digestion studies were conducted in duplicate.

2.11. Caco-2 Cell Transepithelial Transport

Caco-2 cells (American Type Culture Collection, ATCC, Manassas, VA, USA) were maintained in Dulbecco’s Modified Eagle’s Medium (DMEM; Gibco, Barcelona, Spain) supplemented with 10% FBS, 100 U/mL penicillin, 100 mg/mL streptomycin, 1% nonessential amino acids and 2 mM L-glutamine (Invitrogen, Barcelona, Spain) at 37 °C in a humidified atmosphere containing 5% CO2. The cytotoxic effect of the extracts after the digestion process on Caco-2 cells was tested using a 3-(4,5-dimethylthiazol-2-yl)-2,5-diphenyl tetrazolium bromide (MTT) assay (Sigma-Aldrich, Madrid, Spain), following the Mosmann [24] method.
For the cell transepithelial transport experiments, Caco-2 cells were seeded onto six-well Transwell® plates with a 0.4 μm pore size and inserts of 24 mm diameter (Costar, Corning, Madrid, Spain) at a density of 3 × 10⁵ cells per insert. The cells were maintained for 21 days, once the monolayer was formed, during which time the culture medium was replaced every three days. The integrity of the monolayer was checked by measuring the transepithelial electrical resistance (TEER) (Evon World Precision Instruments, Sarasota, FL, USA). After this period, transepithelial transport assays were conducted. The apical and basolateral compartments were washed once with PBS and then incubated with 1.5 mL and 1 mL of supplement DMEM without FBS, respectively, during the 30 min prior to the experiments. A total of 100 µL of digested extracts was incorporated in the apical compartment and incubated for 6 h at 37 °C. The TEER value was measured twice before and after the experiment to monitor the integrity of the Caco-2 monolayer. Then, the cell monolayer (collected with PBS), the apical and the basolateral samples were stored at −20 °C prior to analysis. The assays were conducted in triplicate for each digested sample.

2.12. Statistical Analyses

The statistical analysis of the CCR experimental design data was carried out by the RSM with the statistical program Statgraphics Centurion XVI (Statpoint Inc., Warrenton, VA, USA). Correlation coefficients between the different experimental data were performed by using Pearson’s test (p ≤ 0.05). Significant differences between the samples were conducted through one-way ANOVA analysis, followed by post hoc analyses by the Duncan test for the digestion step analyses.

3. Results and Discussion

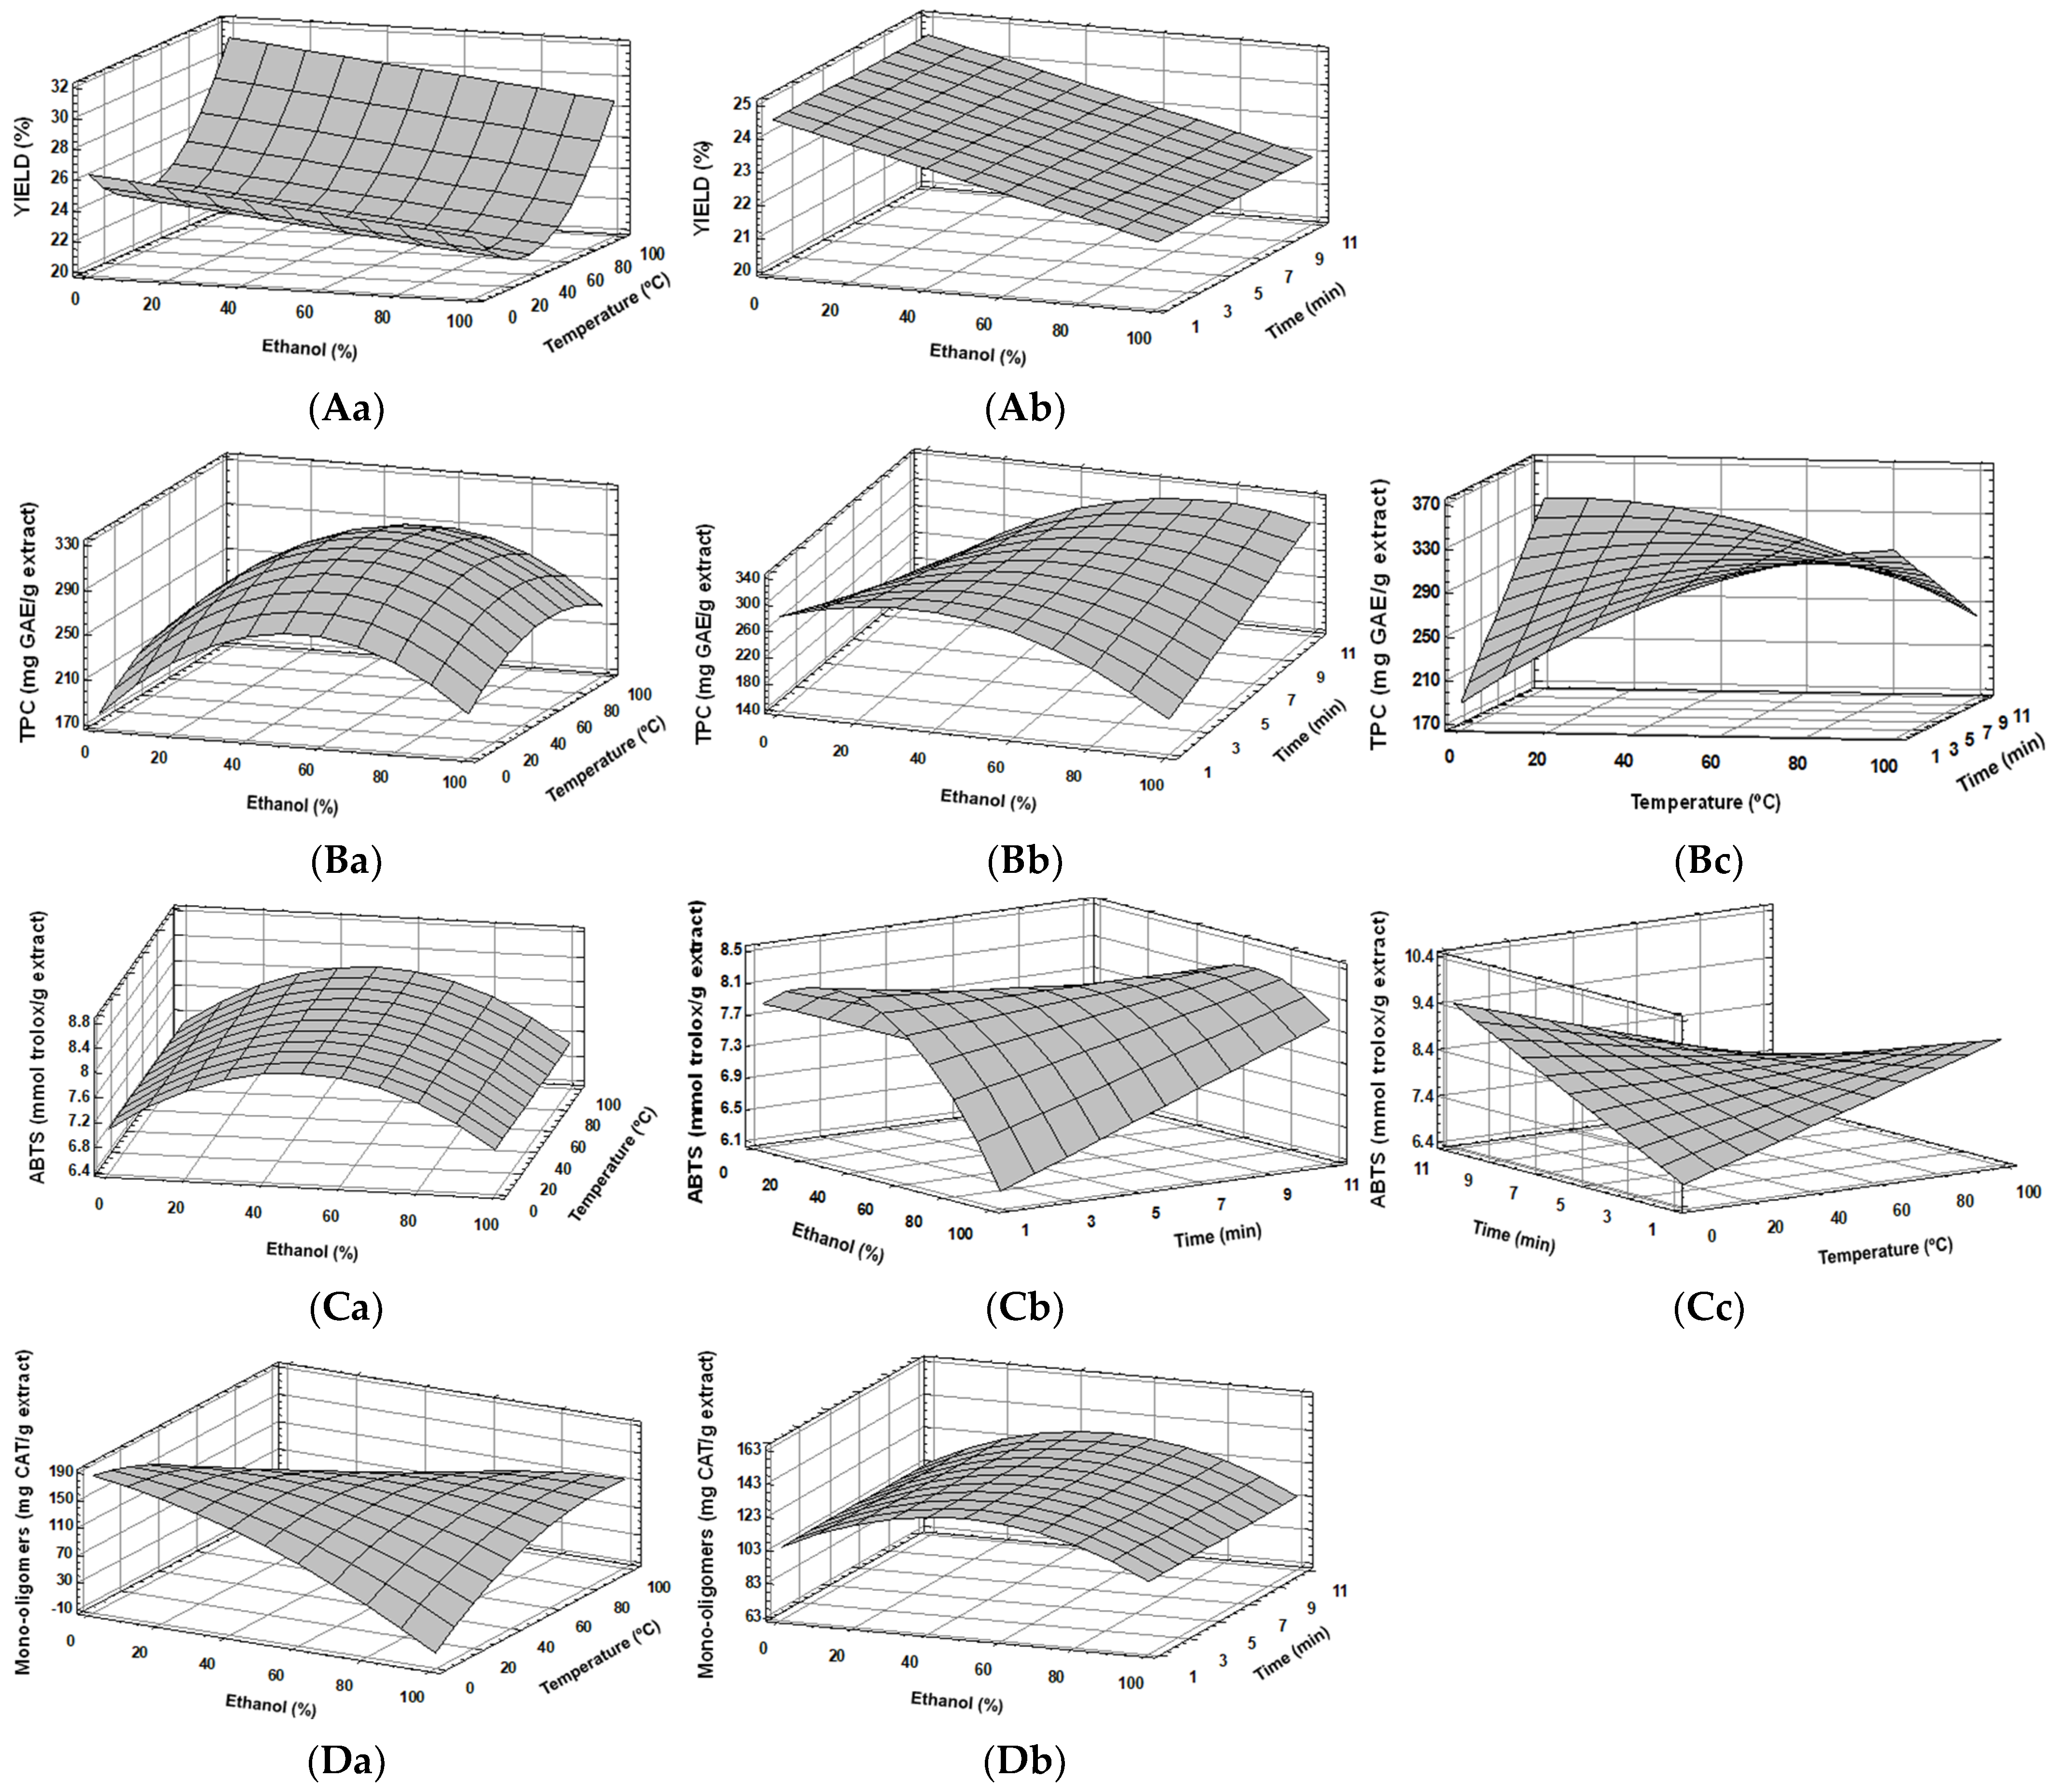
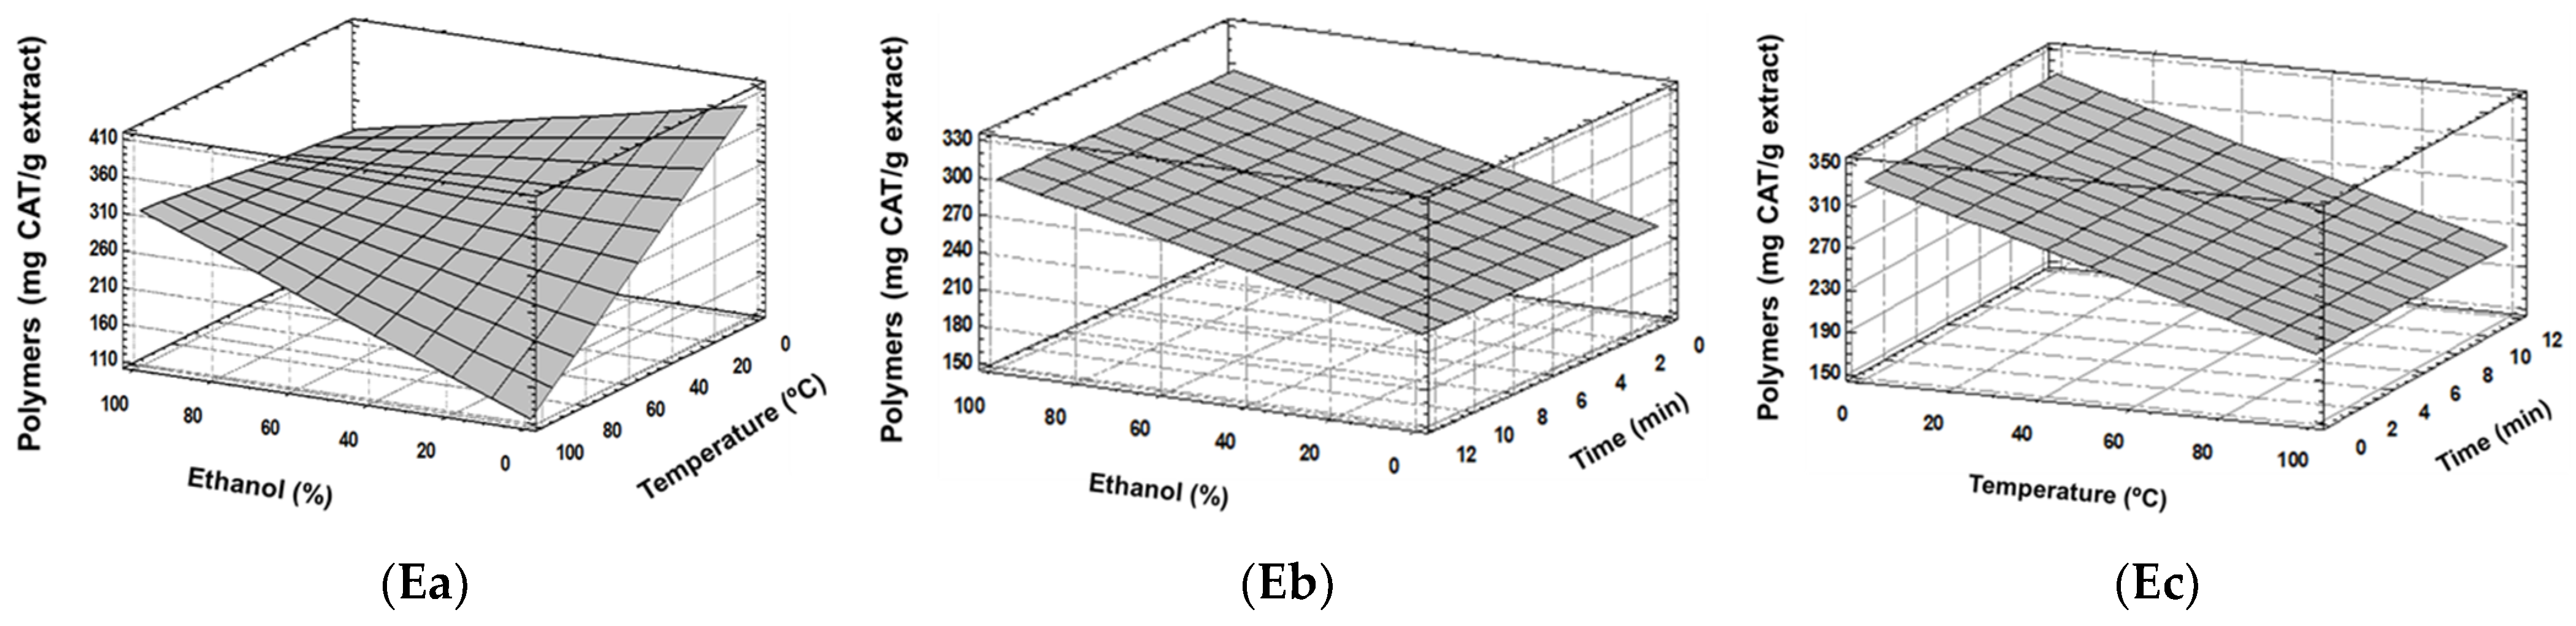
3.1. Experimental Model Fitting

The present study investigated optimizing PLE using the RSM for the extraction of phenolic antioxidants from grape seeds (Vitis vinifera L. Merlot’s). The evaluated factors were the solvent composition, extraction temperature and time (Table 2), since the literature data show them as the most influential factors during phenolic compound recovery [13,25]. The TPC, antioxidant activity and phenolic composition (mono-oligomers and total polymers) were evaluated as dependent variables.
During the extraction of phenolic compounds from grape by-products, diverse solvents not characterized as GRAS (Generally Recognized as Safe) were evaluated, such as methanol, acetone or ethyl acetate [11,26]. As a consequence, these solvents are not suitable for developing green extraction processes. On the contrary, water, ethanol or ethanol:water mixtures are recognized as GRAS, being widely used for sustainable phenolic compound extraction from grape by-products [17,27,28]. In that regard, it is important to point out that few studies have evaluated the capacity of PLE conducted with green solvents based on hydroalcoholic mixtures. To our knowledge, only Piñeiro et al. [14], García-Marino et al. [29] and Allcca-Alca et al. [30] have conducted sustainable recovery of phenolic compounds from grape seed by-products based on water or ethanol:water mixtures through PLE, although other solvents have also been explored [30,31]. Nevertheless, it is important to indicate that there is not a large amount of research focused on the recovery of phenolic compounds specifically for grape seeds with PLE despite the used solvent.
On the other hand, although PLE allows for high extraction temperatures [30], it is advisable not to exceed 120 °C in order to avoid degradation reactions in phenolic compounds [28,32]. For this reason, in our research, we considered 100 °C as the highest extraction temperature to avoid phenolic compound degradation. In addition, considering a possible extraction temperature–time interaction, this study evaluated short intervals of extraction time, since extensive extraction times may promote phenolic degradation without extraction yield improvements [13].
The results obtained for the dependent variables (response variable) of the experimental design were fitted to a quadratic linear regression model, allowing for the determination of the regression coefficients for the intercept, linear, quadratic and interaction terms of the independent variables (experimental factors). The statistical significance of each term in the model was determined, where quadratic and interaction terms not significantly different from zero (p ≤ 0.05) were considered as not significant and therefore excluded from the model. The resulting mathematical model was refitted by multiple linear regression (MLR), obtaining the model based on a polynomial equation (Table 3).
The optimization of the evaluated response variables was successfully reached with the RSM, since the models did not show a significant lack of fit (p > 0.05) for all the studied variables, except the mono-oligomer content. Therefore, the proposed models could be categorized as an approach of the studied variables in terms of the analyzed extraction parameters.
The response surface plot showed that extraction yield was mainly ruled by the extraction temperature (quadratic and linear effects) together with a minor linear contribution from the solvent composition, decreasing this variable with ethanol % increases (Figure 1). Therefore, extraction yield was maximized when higher and lower temperatures were applied, with a greater influence when the temperature rose up to 40 °C (Figure 1(Aa)). On the contrary, extraction time was not a significant factor in this model (Figure 1(Ab)).
The TPC and antioxidant activity (ABTS) both showed a similar trend. The ethanol % was the principal factor, characterized by a strong quadratic effect with a less influential linear effect (Figure 1(Ba,Bb,Ca,Cb)). However, regarding the TPC, the linear effect of the temperature was also determined. The extraction time was not a significant factor for both variables, whereas the time interactions with the temperature and solvent composition had meaningful results, with a greater influence on the TPC variable (Figure 1(Bb,Bc)) and to lesser extent regarding the ABTS (Figure 1(Cb,Cc)).
Although a similar trend was observed regarding the TPC and ABTS variables, different optimal conditions were determined for both factors. The optimal conditions were determined as 75% ethanol, 20 °C and 10.6 min for the TPC (Figure 1(Ba,Bb,Bc) and 100 °C, ethanol 30% and 1 min for the ABTS (Figure 1(Ca,Cb,Cc)). These results are explained by the existence of double optimal conditions for both variables, which are similar in both cases (Figure 1(Bc,Cc)). Hence, the TPC and ABTS showed optimal conditions at a low ethanol % with a high extraction temperature within a short time and, conversely, also at a higher ethanol % combined with the lowest temperature with the longest extraction time. In this context, the extraction time had minimal influence, being dependent on the temperature and solvent composition. These results agree with previous studies, which indicated that, during the PLE of grape by-products, the time results in a low contribution to the response variables, generally associated with the extraction temperature [13] but also with ethanol % [17,32]. Phenolic compound recovery from grape stems through PLE using ethanol:water mixtures resulted in ethanol % being the principal factor, with a quadratic main effect, for the TPC and ABTS variables [17]. Specifically for the phenolic compound extraction from grape seeds, Atanasov et al. [33] indicated that SLE using ethanol:water mixtures reached higher TPC values with 75% ethanol, whereas Kadri et al. [34] obtained the greatest TPC values at 100% ethanol. On the other hand, both the TPC and ABTS responses were also governed by the temperature–time interaction rather than the temperature itself. The literature data usually show the highest TPC or TEAC extract values at high temperatures [17,29,30], which is in concordance with one of the optimal extraction conditions observed in this study. In line with this, the optimal extraction temperature of phenolic compounds from different food matrices is close to 100 °C, or even at higher temperatures, for short extraction times [30,35]. However, because less attention has been paid to room temperature extraction when PLE is considered, it was not possible to compare the results obtained in the present study at this temperature with the literature data on PLE, even when considering other sample matrices. For example, the lowest temperature evaluated by García-Marino et al. [29] during the PLE of grape seeds was 50 °C and in Allcca et al. [30] it was 100 °C, whereas García-Jares et al. [31] conducted the PLE at a fixed temperature of 105 °C.
On the other hand, the mono-oligomeric content of the extracts showed a lack-of-fit model when the experimental data were plotted with the proposed model, suggesting a more complex behavior for this variable. However, a general trend could be observed regarding the response surface plots. Extraction temperature was the most influential factor, although a strong ethanol–temperature interaction could be observed (Figure 1(Da)). Also, a clear negative effect of the ethanol % was determined (Figure 1(Da,Db)), whereas extraction time was not significant (Figure 1(Db)). The lowest ethanol content at low temperatures allows for enhancing the mono-oligomer extraction while being slightly lower at high temperatures and ethanol %. At low temperatures, subcritical water extractions are suitable for the polar and slightly non-polar compound recovery [15], agreeing with these results.
Conversely, the total polymeric content data fitted to the quadratic proposed model. Both the extraction time and their possible interactions were not significant for the polymeric content (Figure 1(Eb)), whereas a strong effect of the temperature was observed (Figure 1(Ea,Ec)) together with an evident ethanol % contribution (Figure 1(Ea,Eb)). In addition, an important temperature–ethanol % interaction was observed (Figure 1(Ea)) allowing for the existence of a double optimal value, although higher polymeric contents were determined with a reduced ethanol % and the lowest extraction temperature (37% of ethanol, 20 °C and 10.5 min). Piñeiro et al. [14] showed a total proanthocyanidin reduction when the extraction temperature increased during the PLE of grape seeds, being in concordance with this study. Whereas in this study optimal conditions for polymers were determined with low amounts of ethanol, Karvela et al. [25] found that greater proanthocyanidin contents were reached at 55% of ethanol:water mixes. Conversely, in an SLE conducted at room temperature, pure ethanol was determined as the greater solvent content to obtain procyanidins from grape seeds compared to ethanol:water mixtures [34]. Since an interaction between the ethanol % and temperature was found in this investigation, the differences observed in the literature data may be explained by the different specific extraction conditions applied in each study, principally regarding the extraction temperature.

3.2. Optimal Conditions and Validation of the Model

The optimal extraction conditions could be determined by each studied variable (Table 3). However, as was indicated previously, the RSM allowed for observing the existence of double optimal conditions for the TPC and ABTS. Regarding the TPC, one optimal condition was characterized by high temperatures for a short time (50% ethanol, 100 °C and 1 min) and another at low temperatures for longer extraction times (75% ethanol, 20 °C and 10.6 min). PLE was conducted by applying both optimal experimental conditions to compare the resulting extracts. When tentative analyses of both extract compositions were conducted (expressing the results as a % of the relative area with respect to the extract conducted at 75% ethanol, 20 °C and 10.6 min), a clear temperature effect could be observed affecting the extract’s composition (Figure 2). High temperatures (100 °C) increased the gallic acid, catechin, epicatechin and epicatechin gallate content compared to the low temperatures (20 °C). However, a clear, important decrease was observed for the oligomeric (dimers B1, B2, B3 and B4) and especially for the polymeric proanthocyanidins.
These results suggest thermal proanthocyanidin degradations [14]. The degradation process during high temperature extraction was also confirmed by the direct measure of the samples at 420 nm (a browning process indicator). Noticeable higher absorbance values were observed at 100 °C (ten times higher) compared to the 20 °C extraction, which is a consequence of phenolic thermal degradations or caramelization reactions. These results were also in agreement with the TPC and ABTS results, since higher TPC content was observed at 100 °C (392.22 mg GAE/g extract) but lower antioxidant activity (8.52 mmol Trolox/g extract), compared to 20 °C (350.80 mg GAE/g extract and 9.31 mmol Trolox/g extract). Thus, 75% ethanol, 20 °C and 11 min were selected as the optimal extraction conditions since higher integrity of the extract was observed, avoiding thermal degradations. These results are also in agreement with Chamorro et al. [36], who observed increments of gallic acid content and epicatechin gallate but hydrolyses of procyanidins and falvan-3-ol monomers during thermal treatment of a grape seed extract. In addition, it is important to consider that reduced energy and nitrogen is consumed when the extraction is carried out at 20 °C, resulting in a cheaper extraction process because of lower resource consumption [37] and, therefore, being more sustainable.
Furthermore, to confirm that the maximum extraction capacity was achieved at optimum conditions, additional extractions were conducted (75% ethanol and 20 °C) but while applying extended extraction times. Therefore, the optimal extract was compared with the additional extracts obtained at 75% ethanol and at 20 °C for 15, 20, 25 and 30 min. For this purpose, the TPC values were determined in all the obtained extracts, which were, respectively, 361.30, 363.12, 317.49 and 358.33 mg GAE/g extract. Therefore, no significant increases in the TPC were reached after 15 min, showing similar values to the optimal conditions (11 min). Furthermore, similar phenolic compositions were determined for the extracts obtained at 11 and 15 min (Figure 2). These results confirm the lack of influence previously determined by the extraction time factor. Thus, it was demonstrated that a single extraction at 75% ethanol, 20 °C and 11 min resulted in the maximum effectiveness (optimal extraction conditions), achieving an exhaustive extraction of phenolic compounds from the Merlot seed matrix.
Then, optimal extract samples were obtained by applying the optimal previously mentioned conditions (75% ethanol, 20 °C and 11 min). The experimental values were close to the statistical model-predicted values (Table 3), validating the proposed model. The extract was characterized by a 21.2% extraction yield, a TPC of 350.8 ± 3.97 mg GAE/g extract and an antioxidant activity of 9.31 ± 0.33 mmol Trolox/g extract. Even the mono-oligomeric and polymeric compounds were close to the predicted values, which were quantified in the extract as 118.42 mg/g extract (predicted 100.42 mg/g extract) and 327.20 mg/g extract, respectively (Table 3). In addition, the antioxidant activity through the DPPH (4.09 ± 0.24 mmol Trolox/g extract) and ORAC (4.05 ± 0.003 mmol Trolox/g extract) assays was carried out to perform a comprehensive antioxidant characterization of this extract.
The extraction yield of the PLE was in concordance with the interval of the values determined during the subcritical water extraction of grape seeds [29]. When the optimal extract was compared with the grape seed extracts obtained using SLE with ethanol:water mixtures in the literature, PLE allowed for superior values regarding the extraction yield and TPC [34], as well as higher TPC and antioxidant activity [38]. On the other hand, the PLE extract of this study resulted in higher antioxidant activity and TPC compared with the SLE extracts obtained with 80% methanol through two extraction cycles [11] and UAE extracts obtained with 50% ethanol:water from several varieties of grape seeds [12]. Furthermore, when the optimal PLE extract was compared with only grape seed extracts from the Merlot variety to avoid the possible variety influence, higher TPC [39] and antioxidant activity values [40] were observed compared to the SLE extracts reported in the literature.
Then, although environmental conditions can affect the TPC and antioxidant activity of grape by-products [27], the improvement observed in this study for PLE compared with SLE could be ascribed to decreases in the electric constant of the water as a solvent at high pressure [41], allowing for enhanced extraction of phenolic compounds with PLE [15]. Thus, individual optimization of extraction conditions is required since the variety, agro- and weather conditions, along with the plant material, significantly influence the extraction process [27].

3.3. Correlation Between Response Variables

The contribution of the phenolic compounds to the antioxidant activity of the extract was evaluated by establishing multiple correlation analyses between the TPC, TEAC values (ABTS) and mono-oligomeric and total polymeric content. The antioxidant activity resulted in a great correlation with the TPC, with r = 0.983 (p ≤ 0.01). Regarding the phenolic compound fractions, a good correlation was found with the total polymeric content (r = 0.517; p ≤ 0.05), whereas the mono-oligomeric compounds were poorly correlated (r = 0.377; p > 0.05). Similar results were determined between the TPC and the total polymeric compounds (r = 0.456; p ≤ 0.05) and the TPC with the mono-oligomeric compounds (r = 0.311; p > 0.05). This result indicates that the antioxidant activity is a consequence principally of the phenolic content and suggests that the whole antioxidant activity of the extracts is mainly governed by the polymeric fraction, which is in concordance with De Sá et al. [42].

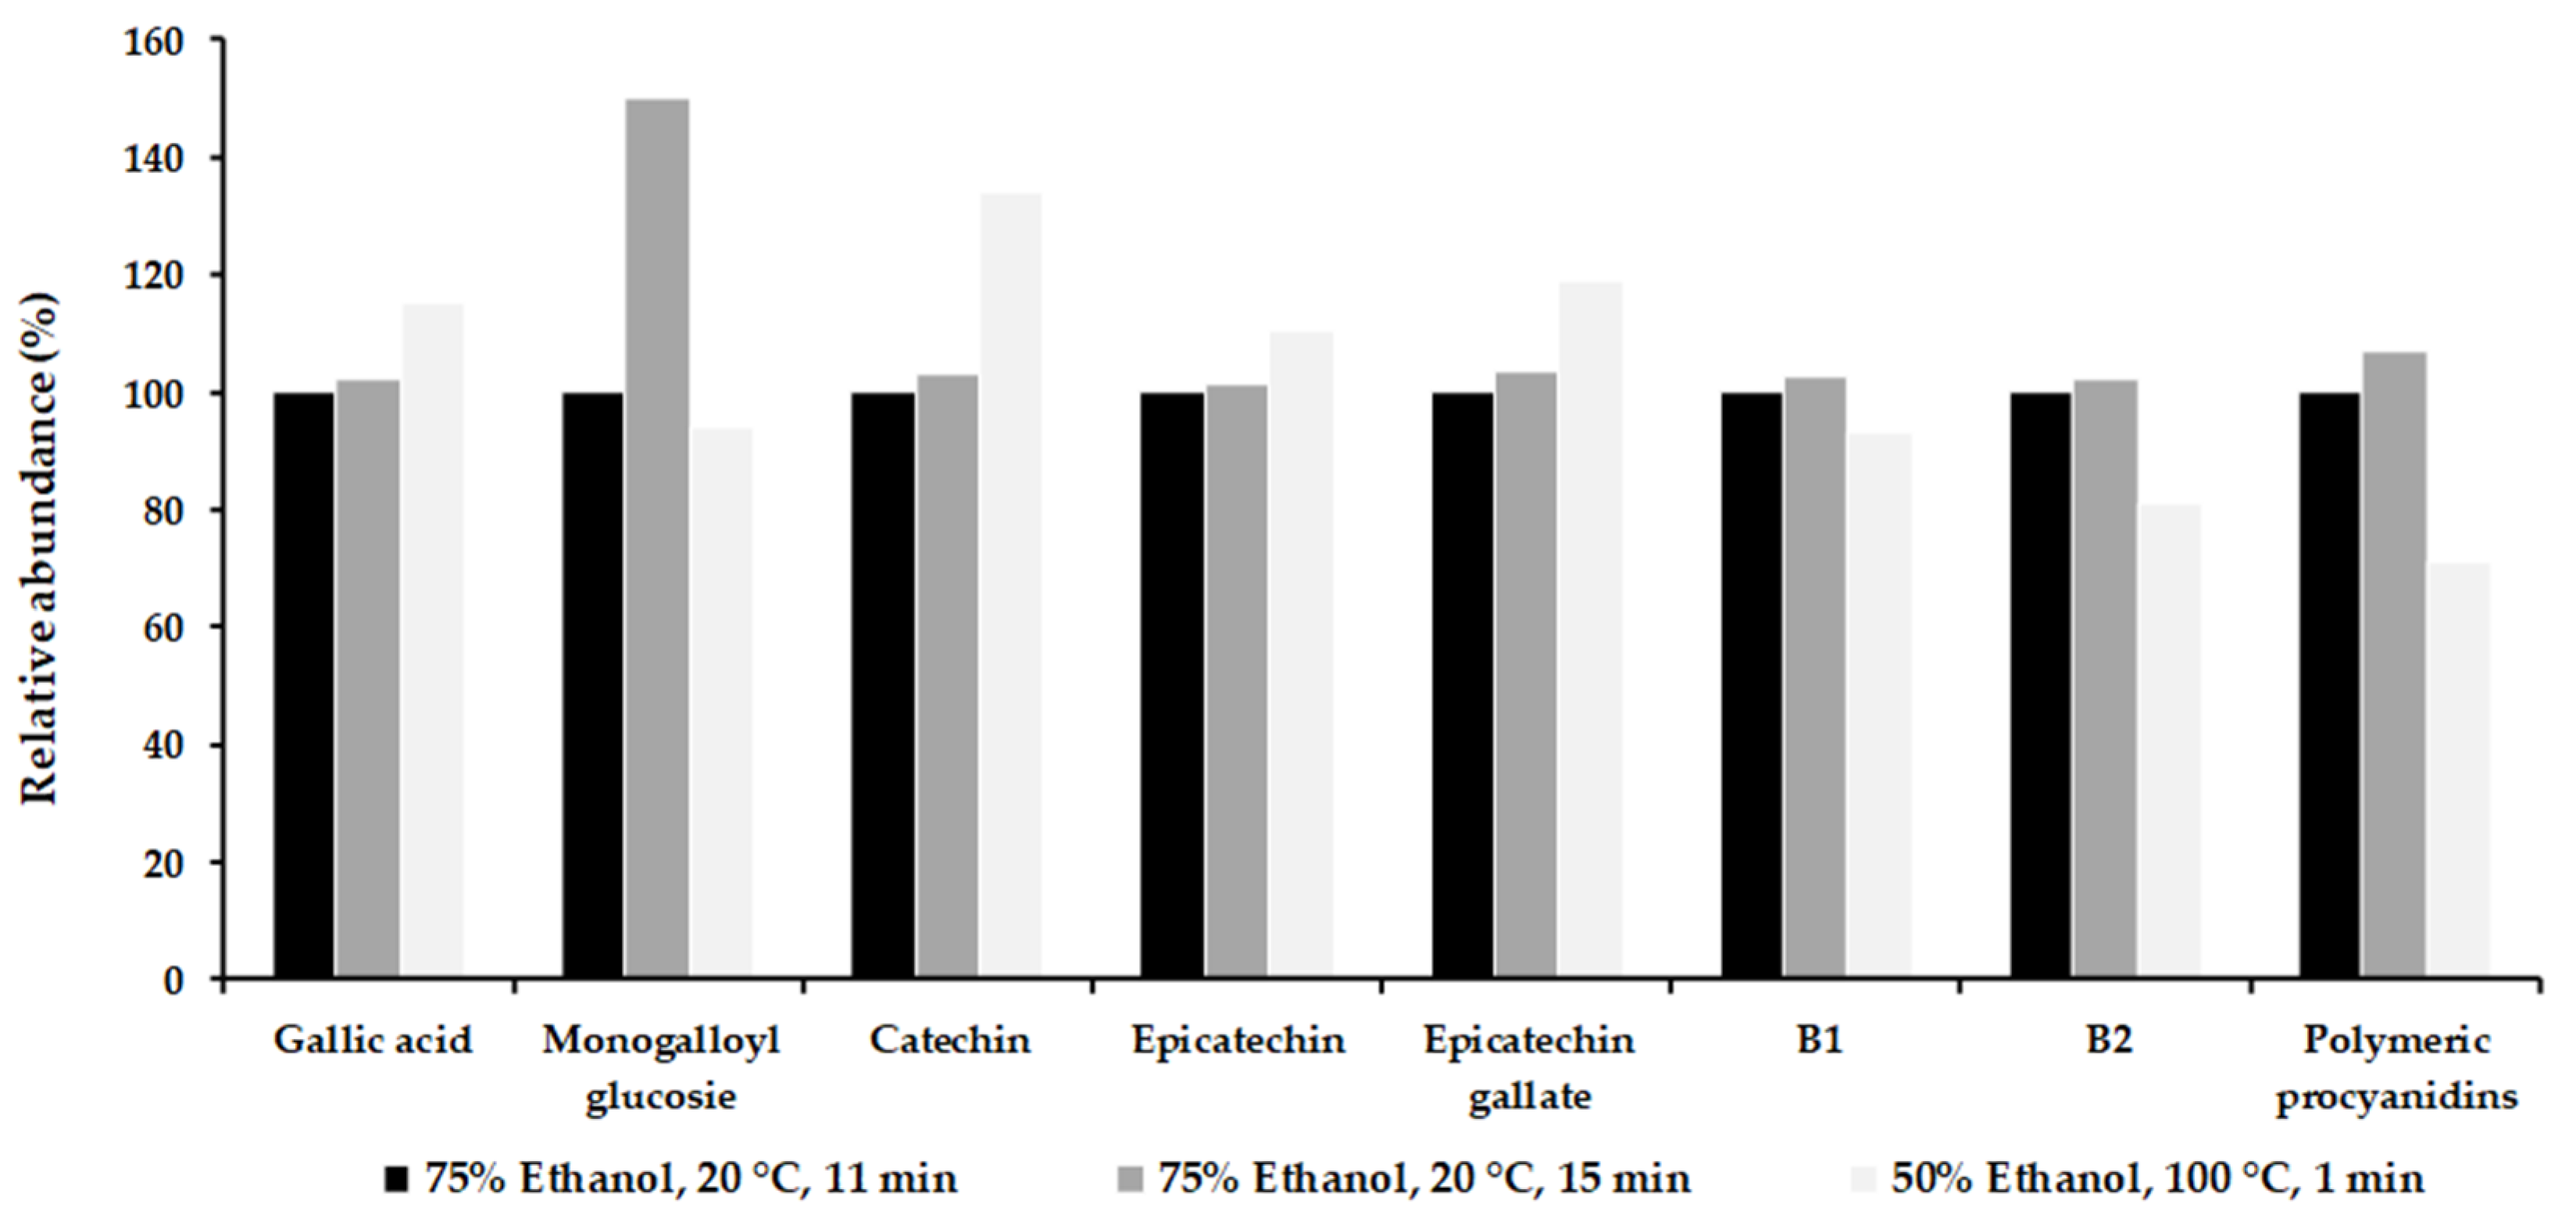
3.4. Phenolic Composition of the Optimum Extract

The optimal extract was composed of different phenolic acids, mainly flavonoids, comprising diverse flavonols and flavanols, together with other compounds, such as protocatechuic aldehyde (Table 4).
Diverse phenolic acids, comprising hydroxybenzoic and hydroxycinnamic acids, were found in the optimal sample. Among them, gallic acid was the main compound. Other phenolic acids, such as caftaric acid and p-coumaric acid, were quantified to a lesser extent. The determined phenolic acids of the optimum extract are frequently reported for grape seed extracts, irrespective of the grape variety under consideration [11], where gallic acid is recognized as the main phenolic acid [38].
The most abundant compounds in the sample were flavan-3-ols, whereas scarce amounts of quercetin and its derivative compounds were also determined. The extract was characterized by an extended composition of flavan-3-ol monomers and dimers. Epicatechin was the main compound, followed by catechin. Dimer B2 turned out to be the highest dimer compound, alongside other dimeric procyanidins. Grape seeds have been generally characterized as great sources of flavan-3-ols, where great amounts of epicatechin and catechin have been reported, with lower quantities of dimer procyanidins [12,38].
The extract was also characterized by an extended amount of polymeric proanthocyanidins where the oligomeric and polymeric proanthocyanidin fraction was quantified as 340.33 ± 6.36 mg of catechin/g extract. Regarding the polymeric proanthocyanidin fraction, the mean polymerization degree (mDP) was determined as 19 constitutional units, consisting of approximately 30% of galloilated units. A greater amount of epicatechin extension units (62%) was determined together with epicatechin gallate (24.7%) and lower amounts of catechin (8.00%) but was lacking epigallocatechin. The terminal units were composed of epicatechin gallate (2.1%), catechin (2.0%) and epicatechin (1.2%). The procyanidin composition was consistent with the general proanthocyanidin characteristics regarding grape seeds [43].
Therefore, the extract composition of the optimal extract agreed with the general phenolic profile reported for grape seed extracts in previous studies, mainly comprising monomeric, oligomeric and polymeric flavan-3-ols [2,12,34,38,44].

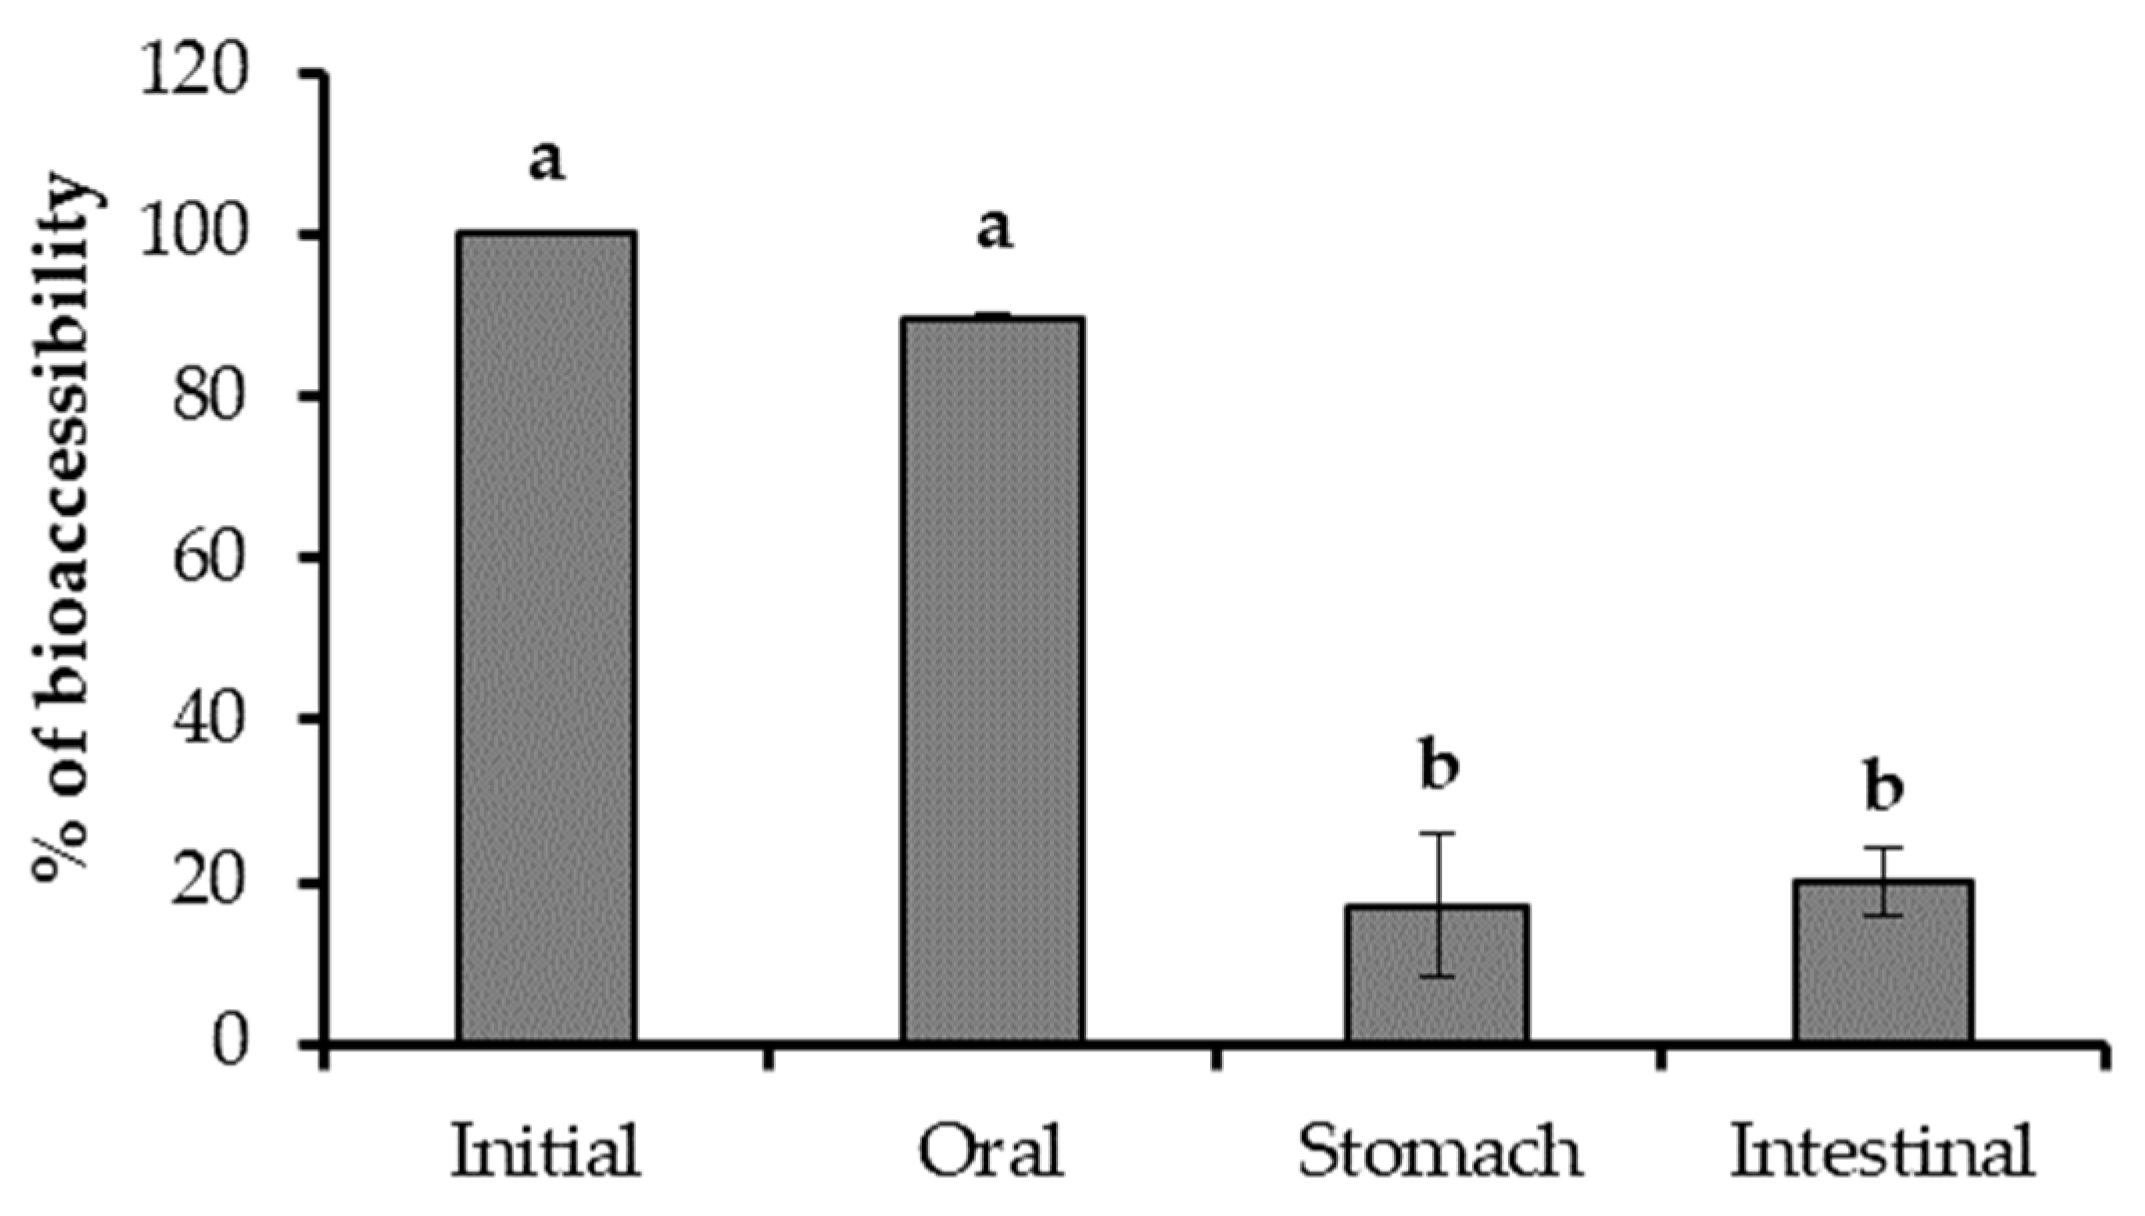
3.5. Changes in Phenolic Composition of the Optimal Extract During In Vitro Gastrointestinal Digestion

To evaluate the stability of individual phenolic compounds during in vitro gastrointestinal digestion, each digestion step was analyzed through RP-HPLC-PAD. Also, analyses conducted by NP HPLC-PAD were performed to analyze the changes in the polymeric procyanidin fraction. The extract showed a trend characterized by a decrease in the phenolic content as gastrointestinal digestion progressed (Table 5).
The oral step showed a limited effect on the phenolic composition, where only slight changes were observed in some specific compounds. Epicatechin was the most affected compound, although only minor reductions were determined. On the contrary, the stomach and intestinal phases were critical steps for the bioaccessibility of the phenolic compounds in the extract. In general, the gastric phase affected the phenolic composition more intensively (60% of phenolic compound bioaccessibility) compared to the intestinal digestion (46% of phenolic compound bioaccessibility).
In general, phenolic acids were found to be more stable compounds compared to other phenolic constituents throughout the digestion process. Gallic acid resulted in the most bioaccessible phenolic acid after the digestion process (90%). Also, the marginal amounts of flavonols determined in the extracts showed a noticeable bioaccessibility, being higher for the Quercetin-3-O-glucuronide (77%). On the contrary, flavan-3-ols showed a significant decrease during the digestion process, mainly after the gastric step. Epicatechin (the major component of this group) was reduced by 62% after the whole gastrointestinal process, and the catechin was 44%. Regarding dimer flavan-3-ols, dimer B2 showed a higher bioaccessibility (55%) compared to dimer B1 (37%). Marginal amounts of dimer A2 were also determined in the bioaccessible fraction. Moreover, among the flavan-3-ols, lower bioaccessibility was determined for the polymeric procyanidins, with it being reduced during the gastric step. These compounds reached a final bioaccessibility of 20% (Figure 3).
Previous studies have reported that marginal effects occur during oral digestion, whereas gastric and intestinal digestion are responsible for the main changes in the phenolic composition of grape seed extracts [12,13,44]. However, differences in the phenolic composition changes in the grape seed extract during the digestion process can be found in the literature data. Whereas phenolic acids used to be reported as more stable compounds and flavan-3-ols are characterized by great losses of bioaccessibility [12,13], Jara-Palacios et al. [45] reported high bioaccessibility for flavan-3-ols and reduced bioaccessibility for phenolic acids and flavonols. In this study, phenolic acids were more stable compounds; meanwhile, noticeable reductions were determined for flavan-3-ols regardless of the degree of polymerization. Gallic acid was the most abundant phenolic acid in the bioaccessible fraction, remaining close to 90% of the initial compound. Meanwhile, pure gallic acid submitted to in vitro gastrointestinal digestion showed a bioaccessibility close to 60% [46]; conversely, Jara-Palacios et al. [45] reported a high reduction in this phenolic compound. The bioaccessibility of gallic acid from other grape by-products, such as grape stem extracts, has been reported as 44% [10], 39% [47] and 0% [45]. According to Garbetta et al. [48], caftaric acid resulted in a high bioaccessibility (79%), whereas other authors have reported low stability for this compound [47]. Additionally, limited increases in certain protocatechuic acid levels were found after the digestion process, probably a consequence of the degradation of more complex phenolic structures, which is also consistent with procyanidin reduction [10,49]. The differences in the literature data regarding the bioaccessibility of phenolic compounds when the same or different phenolic samples are compared suggest an important influence of the sample matrix [50] or the phenolic matrix. In this regard, the presence of polymeric proanthocyanidins can modulate the bioaccessibility of other monomeric compounds [10]. Hence, the matrix effect may explain the differences found in this study with the previously reported investigations, since we observed during grape seed extractions that the diverse extraction conditions result in different mono-oligomeric and polymeric procyanidin contents.
On the other hand, an extensive loss of flavan-3-ols was determined in the sample. Changes in the individual phenolic compounds during the digestion process could be a consequence of diverse events, such as the interaction of the phenolic compounds with the digestive enzymes [51], phenolic–phenolic compound reactions [52] or possible transformations [47]. Specifically, precipitations and interactions of favan-3-ols explain their reduction during the digestion of grape seed extracts [44]. These compounds used to be reported as less bioaccessible, as has been observed in diverse phenolic samples, such as grape by-product extracts [10,44] or cocoa samples [53], where gastric and intestinal digestion are critical steps. Recently, a similar trend was reported for the bioaccessibility of individual phenolic compounds of diverse grape seed extracts [12]. In contrast, increases in catechin, epicatechin and dimers B1 and B2, but a reduction in trimeric procyanidins, have also been reported for grape seed extract digestion [45]. In addition, noticeable losses of flavan-3-ols were determined during the digestion of pure flavan-3-ol compounds, as well as for other grape or wine sources [46,54], which is in concordance with this study. Also, intensive losses of polymeric proanthocyanidins were found in the present study. Procyanidins have been identified as unstable compounds through the digestive tract, with extensive losses occurring in the stomach, as well as an acidic decomposition. Lingua et al. [55] and Jara-Palacios et al. [45] suggested that proanthocyanidin degradations occur during the gastrointestinal process, releasing monomeric compounds. In our study, proanthocyanidin degradation should not be considered since monomeric flavan-3-ol augmentations were not determined. Thus, this result is more consistent with the well-known interaction of polymeric phenolics with the digestive enzymes [42] or precipitations [44], explaining the polymeric procyanidin reductions. In this context, Gonthier et al. [56] did not observe proanthocyanidins degradation, nor the appearance of subsequent compounds, such as catechin. Abia and Fry [57] reported that the majority of the proanthocyanidins ingested by lab rats remain undigested and appear in feces, supporting the procyanidin precipitation suggested in this study.

3.6. Changes in TPC and Antioxidant Activity of the Optimal Extract during In Vitro Gastrointestinal Digestion

Both the TPC and antioxidant activity of the extracts showed the same trend throughout the gastrointestinal digestion process. Additionally, the antioxidant activity measured by both antioxidant DDPH and ORAC methods also had similar results among them (Table 6).
Oral digestion did not change the antioxidant activity of the extract, whereas decreases occurred during the gastric digestion step. After intestinal digestion, 66% of the TPC remained, as well as 71% of the initial antioxidant activity (DPPH) and 63% for the ORAC method. However, when the digested sample was filtered (0.45 μm PVDF filters) to obtain the bioaccessible fraction, greater losses were observed, with only 52% of the initial antioxidant activity (47% for the ORAC method) and 46% of the TPC remaining. Hence, the TPC reductions explain the observed loss of the antioxidant activity. These results also suggest that the phenolic compound decreases were due to possible precipitation or their binding with digestive proteins [44,58].
Previous studies have reported that gastrointestinal digestion intensively reduces the antioxidant activity of grape seed extracts. Elejalde et al. [12] observed reductions of 32–46% in the TPC values of diverse grape seed extracts after the digestion process, followed by a reduction in the antioxidant activity. Henning et al. [59] observed higher bioaccessibility values for a grape seed extract, whereas similar bioaccessibility values of the antioxidant activity were observed by Jara-Palacios et al. [45] for the DPPH methods. However, these authors determined there were increases in the antioxidant activity when the ORAC method was considered. Additionally, similar antioxidant reductions were determined for other phenolic matrices, such as wine samples [55,60] or grape stem extracts [10].
Diverse studies demonstrated that the antioxidant activity of the extracts during the digestion process is principally a consequence of the phenolic compounds, where flavan-3-ols such as catechin, epicatechin and dimers B1 and B2 are the main contributors to the antioxidant activity [45,46]. However, scarce attention has been paid to the polymeric contribution to the total antioxidant activity of polyphenol extracts during the digestion process. To this end, in this study, Pearson’s test was conducted to establish the correlation of the phenolic fractions of the extract with the antioxidant activity during the digestion process. A strong correlation was observed in the antioxidant activity (DPPH values) with the polymeric content (r = 0.967 and p ≤ 0.001), whereas a weaker correlation was determined for the mono-oligomeric fraction (r = 0.886 and p ≤ 0.01). Hence, the results of this study suggest that the reductions in the antioxidant activity are a consequence of the decrease in the total phenolic content, with a strong influence of the polymeric phenolic compounds [10]. In line with this, proanthocyanidins have been determined as the principal contributor to the antioxidant activity of grape seed extracts [42], which is in concordance with the behavior of the antioxidant activity and TPC. The results of this study are also in concordance with the precipitation of procyanidins during the digestion process [44]. Therefore, it seems plausible that the antioxidant activity trend is associated with the loss of polymeric procyanidins in the digestion process, although possible precipitations or enzyme bindings could be considered for other compounds, such as monomeric and dimeric flavan-3-ols [44,58].

3.7. Caco-2 Cell Transport Experiments

A significant increase in the antioxidant activity of the basolateral chamber occurred in the extract after the in vitro transepithelial absorption of the digested sample (measured through the DPPH method). As a consequence, the TEAC value of this fraction increased up to 0.061 ± 0.000 mmol Trolox/g extract (Table 6). Nonetheless, the antioxidant of the basolateral chamber represented only 1.5% of the initial antioxidant activity of the extract. A similar trend was determined for the TPC values of the bioavailable fraction, where only 3% of the TPC was determined in the basolateral chamber (11.416 ± 1.260 mg GAE/g extract). The ORAC method was not able to be studied since great interferences were found with the control samples of the basolateral fraction.
Diverse phenolic compounds, comprising various phenolic acids, flavan-3-ols and quercetin-3-O-glucoside, were quantified in the bioavailable fraction. Flavan-3-ols, mainly as epicatechin and catechin (22% and 18%, respectively), together with reduced amounts of the dimer B2, were the most abundant phenolic compounds (Table 5). Gallic acid has been reported previously as a bioavailable compound [54]. Flavan-3-ols such as catechin, epicatechin and dimer B1 are also bioavailable compounds in in vivo studies [61], whereas procyanidins are not absorbed [56]. Catechin, epicatechin or dimers can be absorbed in the intestine through paracellular transport [51], although limited absorption of these compounds occurs by continuous efflux to the apical side [62] or their intestinal metabolization [63]. In agreement with this study, Serra et al. [44] reported significant absorption of diverse flavan-3-ol compounds from grape seed extracts, as well as gallic acid. Also, gallic acid, catechin and epicatechin have been reported as the most bioavailable compounds of grape stem extracts [10]. In addition, the detection of catechin, epicatechin, epicatechin gallate, dimer B1 and dimer B2 in the basolateral fraction was in concordance with human in vivo data for grape seed extract consumption [64].
The bioavailable phenolic compounds are responsible for the antioxidant status of the bioavailable fraction [54]. Thus, flavan-3-ols, mainly as epicatechin and catechin, and other less abundant compounds such as gallic acid or quercetin-3-O-glucoside are responsible for the increased antioxidant activity observed in this study, which is in concordance with other investigations [10,64].

4. Conclusions

In this study, an optimal grape seed extract was obtained by sustainable PLE using the RSM, with 75% ethanol at 20 °C for 11 min. Few studies have evaluated the extraction capacities of PLE for grape seed by-products during the development of sustainable extraction processes. Sustainable extraction conducted at low temperatures through PLE for phenolic compound recovery from grape seeds, and even other winery by-products, has also been scarcely investigated. This study highlights that sustainable water:ethanol mixture solvents, through PLE conducted at room temperature, avoid the thermal degradation of the phenolic compounds while maximizing the phenolic compound recovery. These conditions allow for avoiding thermal degradation of the phenolic compounds, as well as less energy consumption of the PLE equipment. Hence, more studies are required to elucidate the PLE capacity for recovering bioavailable antioxidant phenolic compounds at lower temperatures, regarding grape seed matrices but also other grape by-product samples. Although an optimum extract with a high TPC (350.8 ± 3.97 mg GAE/g extract) and antioxidant activity (ABTS, 9.31 ± 0.33 mmol Trolox/g extract) was achieved, noticeable reductions in the phenolic content (46% bioaccessible) and antioxidant activity of the extract (DPPH, 52%; ORAC, 47%) occurred during gastrointestinal digestion, mainly due to its polymeric proanthocyanidin and flavan-3-ol losses. Furthermore, an important contribution of the polymeric fraction to the antioxidant activity of the extract has been suggested in this study. This phenolic fraction has been marginally evaluated as being responsible for the antioxidant activity changes during gastrointestinal digestion of phenolic extracts. Since the phenolic matrix has previously been proven to condition the changes in the phenolic composition and antioxidant activity of the phenolic extracts, further studies are required to improve the knowledge of the contribution of this phenolic fraction to the total antioxidant activity, as well as its effect on the total bioaccessibility and bioavailability. Nevertheless, this study highlights that, although small amounts of phenolic compounds were bioavailable, grape seed extracts were able to enhance the antioxidant status of the basolateral fraction.

Author Contributions

Conceptualization, J.A.N., S.S. and L.J.; methodology, J.A.N., S.S., M.d.S., S.B. and L.J.; formal analysis, J.A.N. and M.d.S.; investigation, J.A.N., S.S. and L.J.; writing—original draft preparation, J.A.N.; writing—review and editing, J.A.N., S.S. and L.J.; supervision, S.S. and L.J.; project administration, S.S., L.J. and G.R.; funding acquisition, G.R. All authors have read and agreed to the published version of the manuscript.

Funding

This research was funded by Comunidad Autónoma de Madrid, ALIBIRD, project number P2013/ABI2728.

Data Availability Statement

Dataset available on request from the authors.

Acknowledgments

The authors would also like to thank Félix Cabello for their kind supply of the grapes.

Conflicts of Interest

The authors declare no conflicts of interest. The funders had no role in the design of the study; in the collection, analyses, or interpretation of the data; in the writing of the manuscript; or in the decision to publish the results.

References

  1. Ran, X.L.; Zhang, M.; Wang, Y.; Adhikari, B. Novel technologies applied for recovery and value addition of high value compounds from plant byproducts: A review. Crit. Rev. Food Sci. Nutr. 2019, 59, 450–461. [Google Scholar] [CrossRef] [PubMed]
  2. Bordiga, M.; Montella, R.; Travaglia, F.; Arlorio, M.; Coïsson, J.D. Characterization of polyphenolic and oligosaccharidic fractions extracted from grape seeds followed by the evaluation of prebiotic activity related to oligosaccharides. Int. J. Food Sci. Technol. 2019, 54, 1283–1291. [Google Scholar] [CrossRef]
  3. Sridhar, K.; Charles, A.L. Fortification using grape extract polyphenols—A review on functional food regulations. Int. J. Food Sci. Technol. 2021, 56, 3742–3751. [Google Scholar] [CrossRef]
  4. Almanza-Oliveros, A.; Bautista-Hernández, I.; Castro-López, C.; Aguilar-Zárate, P.; Meza-Carranco, Z.; Rojas, R.; Michel, M.R.; Martínez-Ávila, G.C.G. Grape Pomace-Advances in Its Bioactivity, Health Benefits, and Food Applications. Foods 2024, 13, 580. [Google Scholar] [CrossRef]
  5. Chengolova, Z.; Ivanov, Y.; Godjevargova, T. Comparison of identification and quantification of polyphenolic compounds in skins and seeds of four grape varieties. Molecules 2023, 28, 4061. [Google Scholar] [CrossRef]
  6. Monagas, M.; Gómez-Cordovés, C.; Bartolomé, B.; Laureano, O.; Ricardo Da Silva, J.M. Monomeric, oligomeric, and polymeric Flavan-3-Ol composition of wines and grapes from Vitis vinifera L. cv. Graciano, Tempranillo, and cabernet sauvignon. J. Agric. Food Chem. 2003, 51, 6475–6481. [Google Scholar] [CrossRef]
  7. Yan, B.; Lu, G.; Wang, R.; Kang, S.; Huang, C.; Wu, H.; Yong, Q. Protective effects of lignin fractions obtained from grape seeds against bisphenol AF neurotoxicity via antioxidative effects mediated by the Nrf2 pathway. Front. Chem. Sci. Eng. 2023, 17, 976–989. [Google Scholar] [CrossRef]
  8. Talebi, M.; Esmaeeli, H.; İlgün, S.; Talebi, M.; Farkhondeh, T.; Mishra, G.; Samarghandian, S. The Protective Role of Grape Seed in Obesity and Lipid Profile: An Updated Narrative Overview of Preclinical and Clinical Studies. Endocr. Metab. Immune Disord. Drug Targets 2023, 23, 46–62. [Google Scholar]
  9. Ghanbari, P.; Raiesi, D.; Alboebadi, R.; Zarejavid, A.; Dianati, M.; Razmi, H.; Bazyar, H. The effects of grape seed extract supplementation on cardiovascular risk factors, liver enzymes and hepatic steatosis in patients with non-alcoholic fatty liver disease: A randomised, double-blind, placebo-controlled study. BMC Complement. Med. Ther 2024, 24, 192. [Google Scholar] [CrossRef]
  10. Nieto, J.A.; Fernández-Jalao, I.; Siles-Sánchez, M.D.L.N.; Santoyo, S.; Jaime, L. Implication of the Polymeric Phenolic Fraction and Matrix Effect on the Antioxidant Activity, Bioaccessibility, and Bioavailability of Grape Stem Extracts. Molecules 2023, 28, 2461. [Google Scholar] [CrossRef]
  11. Gomes, T.M.; Toaldo, I.M.; da Silva Haas, I.C.; Burin, V.M.; Caliari, V.; Luna, A.S.; Santos de Gois, J.; Bordignon-Luiz, M.T. Differential contribution of grape peel, pulp, and seed to bioaccessibility of micronutrients and major polyphenolic compounds of red and white grapes through simulated human digestion. J. Funct. Foods 2019, 52, 699–708. [Google Scholar] [CrossRef]
  12. Elejalde, E.; Villarán, M.C.; Esquivel, A.; Alonso, R.M. Bioaccessibility and Antioxidant Capacity of Grape Seed and Grape Skin Phenolic Compounds After Simulated In Vitro Gastrointestinal Digestion. Plant Foods Hum. Nutr. 2024, 79, 432–439. [Google Scholar] [CrossRef] [PubMed]
  13. Li, Y.; Skouroumounis, J.K.; Elsey, G.M.; Taylor, D.K. Microwave-assistance provides very rapid and efficient extraction of grape seed polyphenols. Food Chem. 2011, 129, 570–576. [Google Scholar] [CrossRef] [PubMed]
  14. Piñeiro, Z.; Palma, M.; Barroso, C.G. Determination of catechins by means of extraction with pressurized liquids. J. Chromatogr. A 2004, 1026, 19–23. [Google Scholar] [CrossRef]
  15. Tian, Y.; Wang, Y.; Ma, Y.; Zhu, P.; He, J.; Lei, J. Optimization of subcritical water extraction of resveratrol from grape seeds by response surface methodology. Appl. Sci. 2017, 7, 321. [Google Scholar] [CrossRef]
  16. Amador-Luna, V.M.; Herrero, M.; Domínguez-Rodríguez, G.; Ibáñez, E.; Montero, L. Enhancing the bioactivity of Dunaliella salina extracts through ultra-high pressure supercritical fluid extraction (UHP-SFE). Innov. Food Sci. Emerg. Technol. 2024, 95, 103697. [Google Scholar] [CrossRef]
  17. Nieto, J.A.; Santoyo, S.; Prodanov, M.; Reglero, G.; Jaime, L. Valorisation of Grape Stems as a Source of Phenolic Antioxidants by Using a Sustainable Extraction Methodology. Foods 2020, 9, 604. [Google Scholar] [CrossRef]
  18. Xu, C.; Zhang, Y.; Cao, L.; Lu, J. Phenolic compounds and antioxidant properties of different grape cultivars grown in China. Food Chem. 2010, 119, 1557–1565. [Google Scholar] [CrossRef]
  19. Muñoz-Labrador, A.; Prodanov, M.; Villamiel, M. Effects of high intensity ultrasound on disaggregation of a macromolecular procyanidin-rich fraction from Vitis vinifera L. seed extract and evaluation of its antioxidant activity. Ultrason. Sonochem. 2019, 50, 74–81. [Google Scholar] [CrossRef]
  20. Sun, B.S.; Leandro, M.C.; Ricardo-da-Silva, J.M.; Spranger, M.I. Separation of grape and wine proanthocyanidins according to their degree of polymerisation. J. Agric. Food Chem. 1998, 46, 1390–1396. [Google Scholar] [CrossRef]
  21. Singleton, V.L.; Orthofer, R.; Lamuela-Raventós, R.M. Analysis of total phenols and other oxidation substrates and antioxidants by means of Folin-Ciocalteu Reagent. Methods Enzymol. 1999, 299, 152–178. [Google Scholar]
  22. Re, R.; Pellegrini, N.; Proteggente, A.; Pannala, A.; Yang, M.; Rice-Evans, C. Antioxidant activity applying an improved ABTS radical cation decolorization assay. Free Radic Biol Med. 1999, 26, 1231–1237. [Google Scholar] [CrossRef] [PubMed]
  23. Brand-Williams, W.; Cuveleir, M.E.; Berset, C. Use of a free radical method to evaluate antioxidant activity. LWT-Food Sci. Technol. 1995, 28, 25–30. [Google Scholar] [CrossRef]
  24. Mosmann, T. Rapid colorimetric assay for cellular growth and survival: Application to proliferation and cytotoxicity assays. J. Immunol. Methods 1983, 65, 55–63. [Google Scholar] [CrossRef]
  25. Karvela, E.; Makris, D.P.; Kalogeropoulosa, N.; Karathanosa, V.T. Deployment of response surface methodology to optimize recovery of grape (Vitis vinifera) stem and seed polyphenols. 11th International Congress on Engineering and Food (ICEF11). Procedia Food Sci. 2011, 1, 1686–1693. [Google Scholar] [CrossRef]
  26. Pintać, D.; Majkić, T.; Torović, L.; Orčić, D.; Beara, I.; Simin, N.; Mimica-Dukić, N.; Lesjak, M. Solvent selection for efficient extraction of bioactive compounds from grape pomace. Ind. Crop. Prod. 2018, 111, 379–390. [Google Scholar] [CrossRef]
  27. Domínguez-Perles, R.; Teixeira, A.; Rosa, E.; Barros, A. Assessment of (poly)phenols in grape (Vitis vinifera L.) stems by using food/pharma industry compatible solvents and response surface methodology. Food Chem. 2014, 164, 339–346. [Google Scholar] [CrossRef]
  28. Pereira, D.T.V.; Tarone, A.G.; Cazarin, C.B.B.; Barbero, G.F.; Martínez, J. Pressurized liquid extraction of bioactive compounds from grape marc. J. Food Eng. 2019, 240, 105–113. [Google Scholar] [CrossRef]
  29. García-Marino, M.; Rivas-Gonzalo, J.C.; Ibáñez, E.; García-Moreno, C. Recovery of catechins and proanthocyanidins from winery by-products using subcritical water extraction. Anal. Chim. Acta 2006, 563, 44–50. [Google Scholar] [CrossRef]
  30. Allcca-Alca, E.E.; León-Calvo, N.C.; Luque-Vilca, O.M.; Martínez-Cifuentes, M.; Pérez-Correa, J.R.; Mariotti-Celis, M.S.; Huamán-Castilla, N.L. Hot pressurized liquid extraction of polyphenols from the skin and seeds of Vitis vinifera L. Cv. negra criolla pomace a peruvian native pisco industry waste. Agronomy 2021, 11, 866. [Google Scholar] [CrossRef]
  31. Garcia-Jares, C.; Vazquez, A.; Lamas, J.P.; Pajaro, M.; Alvarez-Casas, M.; Lores, M. Antioxidant white grape seed phenolics: Pressurized liquid extracts from different varieties. Antioxidants 2015, 4, 737–749. [Google Scholar] [CrossRef] [PubMed]
  32. Arapitsas, P.; Turner, C. Pressurized solvent extraction and monolithic column HPLC/DAD analysis of anthocyanins in red cabbage. Talanta 2008, 74, 1218–1223. [Google Scholar] [CrossRef] [PubMed]
  33. Atanasov, S.; Stoylov, B.L.; Saykova, I.; Tchaoushev, S.T. Mass transfer intensification in bioactive compounds recovery by alternative extraction methods: Effects of solvent. Glob. Nest J. 2019, 21, 30–36. [Google Scholar]
  34. Kadri, S.; El Ayed, M.; Mabrouk, M.; Limam, F.; Elkahoui, S.; Aouani, E.; Mokni, M. Characterization, anti-oxidative effect of grape seed powder and in silico affinity profiling of polyphenolic and extra-phenolic compounds for calpain inhibition. J. Pharm. Biomed. Anal. 2019, 164, 365–372. [Google Scholar] [CrossRef] [PubMed]
  35. Aliakbarian, B.; Fathi, A.; Perego, P.; Dehghani, F. Extraction of antioxidants from winery wastes using subcritical water. J. Supercrit. Fluids 2012, 65, 18–24. [Google Scholar] [CrossRef]
  36. Chamorro, S.; Goñi, I.; Viveros, A.; Hervert-Hernández, D.; Brenes, A. Changes in polyphenolic content and antioxidant activity after thermal treatments of grape seed extract and grape pomace. Eur. Food Res. Technol. 2012, 234, 147–155. [Google Scholar] [CrossRef]
  37. Todd, R.; Baroutian, S. A techno-economic comparison of subcritical water, supercritical CO2 and organic solvent extraction of bioactives from grape marc. J. Clean. Prod. 2017, 158, 349–358. [Google Scholar] [CrossRef]
  38. Krasteva, D.; Ivanov, Y.; Chengolova, Z.; Godjevargova, T. Antimicrobial potential, antioxidant activity, and phenolic content of grape seed extracts from four grape varieties. Microorganisms 2023, 11, 395. [Google Scholar] [CrossRef]
  39. Lorrain, B.; Chira, K.; Teissedre, P.L. Phenolic composition of Merlot and Cabernet-Sauvignon grapes from Bordeaux vineyard for the 2009-vintage: Comparison to 2006, 2007 and 2008 vintages. Food Chem. 2011, 126, 1991–1999. [Google Scholar] [CrossRef]
  40. Yilmaz, Y.; Toledo, R.T. Oxygen radical absorbance capacities of grape/wine industry byproducts and effect of solvent type on extraction of grape seed polyphenols. J. Food Compos. Anal. 2006, 19, 41–48. [Google Scholar] [CrossRef]
  41. Hawthorne, S.B.; Yang, Y.; Miller, D.J. Extraction of organic pollutans from environmental solids with subcritical and supercritical water. Anal. Chem. 1994, 66, 2912–2920. [Google Scholar] [CrossRef]
  42. De Sá, M.; Justino, V.; Spranger, M.I.; Zhao, Y.Q.; Hanc, L.; Sun, B. Extraction yields and anti-oxidant activity of proanthocyanidins from different parts of grape pomace: Effect of mechanical treatments. Phytochem. Anal. 2014, 25, 134–140. [Google Scholar] [CrossRef] [PubMed]
  43. Souquet, J.M.; Labarbe, B.; Le Guernevé, C.; Cheynier, V.Y.; Moutounet, M. Phenolic Composition of Grape Stems. J. Agric. Food Chem. 2000, 48, 1076–1080. [Google Scholar] [CrossRef] [PubMed]
  44. Serra, A.; Macia, A.; Romero, M.P.; Valls, J.; Blade, C.; Arola, L.; Motilva, M.J. Bioavailability of procyanidin dimers and trimers and matrix food effects in in vitro and in vivo models. Br. J. Nutr. 2010, 103, 944–952. [Google Scholar] [CrossRef]
  45. Jara-Palacios, M.J.; Gonçalves, S.; Hernanz, D.; Heredia, F.J.; Romano, A. Effects of in vitro gastrointestinal digestion on phenolic compounds and antioxidant activity of different white winemaking byproducts extracts. Food Res. Int. 2018, 109, 433–439. [Google Scholar] [CrossRef]
  46. Tagliazucchi, D.; Verzelloni, E.; Bertolini, D.; Conte, A. In vitro bio-accessibility and antioxidant activity of grape polyphenols. Food Chem. 2010, 120, 599–606. [Google Scholar] [CrossRef]
  47. Ferreyra, S.; Torres-Palazzolo, C.; Bottini, R.; Camargo, A.; Fontana, A. Assessment of in-vitro bioaccessibility and antioxidant capacity of phenolic compounds extracts recovered from grapevine bunch stem and cane by-products. Food Chem. 2021, 348, 129063. [Google Scholar] [CrossRef]
  48. Garbetta, A.; Nicassio, L.; D’Antuono, I.; Cardinali, A.; Linsalata, V.; Attolico, G.; Minervini, F. Influence of in vitro digestion process on polyphenolic profile of skin grape (cv. Italia) and on antioxidant activity in basal or stressed conditions of human intestinal cell line (HT-29). Food Res. Int. 2018, 106, 878–884. [Google Scholar] [CrossRef]
  49. McDougall, G.J.; Fyffe, S.; Dobson, P.; Stewart, D. Anthocyanins from red wine—Their stability under simulated gastrointestinal digestion. Phytochemistry 2005, 66, 2540–2548. [Google Scholar] [CrossRef]
  50. Rodríguez, M.; Bianchi, F.; Simonato, B.; Rizzi, C.; Fontana, A.; Tironi, V.A. Exploration of grape pomace peels and amaranth flours as functional ingredients in the elaboration of breads: Phenolic composition, bioaccessibility, and antioxidant activity. Food Func. 2024, 15, 608–624. [Google Scholar] [CrossRef]
  51. Deprez, S.; Mila, I.; Huneau, J.F.; Tome, D.; Scalbert, A. Transport of proanthocyanidin dimer, trimer and polymer across monolayers of human intestinal epithelial caco-2 cells. Antioxid. Redox Signal. 2001, 3, 957–967. [Google Scholar] [CrossRef] [PubMed]
  52. Krook, M.A.; Hagerman, A.E. Stability of polyphenols epigallocatechin gallate and pentagalloyl glucose in a simulated digestive system. Food Res. Int. 2012, 49, 112–116. [Google Scholar] [CrossRef] [PubMed]
  53. Toro-Uribe, S.; López-Giraldo, L.J.; Alvarez-Rivera, G.; Ibáñez, E.; Herrero, M. Insight of Stability of Procyanidins in Free and Liposomal Form under an In Vitro Digestion Model: Study of Bioaccessibility, Kinetic Release Profile, Degradation, and Antioxidant Activity. J. Agric. Food Chem. 2019, 67, 1990–2003. [Google Scholar] [CrossRef] [PubMed]
  54. Lingua, M.S.; Theumer, M.G.; Kruzynski, P.; Wunderlin, D.A.; Baroni, M.V. Bioaccessibility of polyphenols and antioxidant properties of the white grape by simulated digestion and Caco-2 cell assays: Comparative study with its winemaking product. Food Res. Int. 2019, 122, 496–505. [Google Scholar] [CrossRef]
  55. Lingua, M.S.; Wunderlin, D.A.; Baroni, M.V. Effect of simulated digestion on the phenolic components of red grapes and their corresponding wines. J. Funct. Foods 2018, 44, 86–94. [Google Scholar] [CrossRef]
  56. Gonthier, M.P.; Donovan, J.L.; Texier, O.; Felgines, C.; Remesy, C.; Scalbert, A. Metabolism of dietary procyanidins in rats. Free Radic. Biol. Med. 2003, 35, 837–844. [Google Scholar] [CrossRef]
  57. Abia, R.; Fry, S.C. Degradation and metabolism of 14C-labelled proanthocyanidins from carob (Ceratonia siliqua) pods in the gastrointestinal tract of the rat. J. Sci. Food Agric. 2001, 81, 1156–1165. [Google Scholar] [CrossRef]
  58. Laurent, C.; Besancon, P.; Caporiccio, B. Flavonoids from a grape seed extract interact with digestive secretions and intestinal cells as assessed in an in vitro digestion/caco-2 cell culture model. Food Chem. 2007, 100, 1704–1712. [Google Scholar] [CrossRef]
  59. Henning, S.M.; Zhang, Y.; Rontoyanni, V.G.; Huang, J.; Lee, R.P.; Trang, A.; Nuernberger, G.; Heber, D. Variability in the Antioxidant Activity of Dietary Supplements from Pomegranate, Milk Thistle, Green Tea, Grape Seed, Goji, and Acai: Effects of In Vitro Digestion. J. Agric. Food Chem. 2014, 62, 4313–4321. [Google Scholar] [CrossRef]
  60. Tamargo, A.; Cueva, C.; Silva, M.; Molinero, N.; Miralles, B.; Bartolomé, B.; Moreno-Arribas, M.V. Gastrointestinal co-digestion of wine polyphenols with glucose/whey proteins affects their bioaccessibility and impact on colonic microbiota. Food Res. Int. 2022, 155, 111010. [Google Scholar] [CrossRef]
  61. Said, I.H.; Truex, J.D.; Heidorn, C.; Retta, M.B.; Petrov, D.D.; Haka, S.; Kuhnert, N. LC-MS/MS based molecular networking approach for the identification of cocoa phenolic metabolites in human urine. Food Res. Int. 2020, 132, 109119. [Google Scholar] [CrossRef] [PubMed]
  62. Crespy, V.; Morand, C.; Besson, C.; Cotelle, N.; Vézin, H.; Demigné, C.; Rémésy, C. The splanchnic metabolism of flavonoids highly differed according to the nature of the compound. Am. J. Physiol. Gastrointest. Liver Physiol. 2003, 284, 980–988. [Google Scholar] [CrossRef] [PubMed]
  63. Gómez-Juaristi, M.; Sarria, B.; Goya, L.; Bravo-Clemente, L.; Mateos, R. Experimental confounding factors affecting stability, transport and metabolism of flavanols and hydroxycinnamic acids in Caco-2 cells. Food Res. Int. 2020, 129, 108797. [Google Scholar] [CrossRef] [PubMed]
  64. Xue, B.; Lu, Q.Y.; Massie, L.; Qualls, C.; Mao, J.T. Grape seed procyanidin extract against lung cancer: The role of microrna-106b, bioavailability, and bioactivity. Oncotarget 2018, 9, 15579. [Google Scholar] [CrossRef]
Figure 1. Response surface plots of effects of independent factors, ethanol %, temperature and time, on the variables: extraction yield (Aa,Ab), TPC values (Ba,Bb,Bc), antioxidant activity through ABTS method (Ca,Cb,Cc), flavan-3-ol monomer and oligomer content (Da,Db) and total polymer content (Ea,Eb,Ec).
Processes 12 02308 g001aProcesses 12 02308 g001b
Figure 2. Relative abundance of individual compounds of the PLE extracts obtained at 75% ethanol, 20 °C and 15 min and the extract at 50% ethanol, 100 °C and 1 min, with respect to the phenolic content of the extract obtained at 75% ethanol, 20 °C and 11 min (100% abundance). GA (gallic acid), GA-Gluc (Monogalloil glucoside), C (catechin), EC (epicatechin), EC-G (epicatechin gallate) and Poly-PA (polymeric proanthocyanidins).
Processes 12 02308 g002
Figure 3. Bioaccessibility of the polymeric phenolic compounds of the optimal extract during the simulated digestion process. Data represent mean ± SD (n = 9). a,b Different letters indicate significant differences between the digestion steps using the Duncan test (p < 0.05).
Processes 12 02308 g003
Table 1. Experimental design coded factors and levels.
FactorCoded FactorCoded Levels
−1.68−1011.68
Ethanol content (%)X10205080100
Temperature (°C)X220366084100
Time (min)X3136911
Table 2. Experimental design matrix and studied variable values.
FactorResponse Variable
RunX1X2X3YieldTPCABTSMono-OligomersTotal Polymers
(%)(°C)(min)(g Extract/100 Seed)(g GAE/g Extract)(mmol Trolox/g Extract)(mg Catechin/g Extract)(mg Catechin/g Extract)
12036321.7269.147.56132.12267.70
28036321.5238.447.30135.61272.77
32084326.5297.898.0563.47154.32
48084324.7279.197.87139.11311.34
52036924.5263.007.75144.67273.22
68036921.8297.898.05127.54326.63
72084927.5205.236.4766.52162.55
88084924.8286.177.96143.86240.64
9060623.1230.917.05128.67232.05
1010060621.1255.757.4165.91242.36
115020622.4310.178.29131.14305.33
1250100630.7281.707.8774.00235.78
135060123.5304.318.17134.96283.79
1450601123.3323.018.49140.01285.07
155060625.6308.228.2095.88274.16
165060623.2314.648.50134.93276.96
175060624.3297.058.01137.80280.99
185060622.3308.788.22131.68276.45
195060623.4295.947.93134.62225.56
Table 3. Polynomial equations and statistical parameters of the fitted models obtained for response variables. Experimental (real) values obtained by applying the optimal extraction conditions for each significant variable.
Model Optimal Conditions
VariablePolynomial Equation of Fitted ModelRLack of Fit (p-Value)Et
(%)
T
(°C)
t
(min)
PredictedReal *
Yield
(g extract/g seed)
Y = 26.2984 − 0.0263927(Et) − 0.14602(T) + 0.00194226(T)20.910.3801001122.1721.20
TPC
(mg GAE/g extract)
Y = 159.929 + 1.71911(Et) + 2.88061(T) + 3.08083(t) − 0.0286387(Et)2 + 0.235371(Et × t) − 0.0116306(T)2 − 0.24749(T × t)0.930.12752011354.02350.80
ABTS
(mmol Trolox/g extract)
Y = 6.44972 + 0.0235014(Et) + 0.0259616(T) + 0.100783(t) –0.000425612(Et)2 + 0.00317664(Et × t) − 0.00432693(T × t)0.850.253010019.129.31
Total Polymers
(mg catechin/g extract)
Y = 387.285 − 1.11844(Et) − 2.77271(T) + 0.0314506(Et × T)0.620.140.22011331.11327.20
* Variable values obtained by applying the selected optimal extraction conditions (75% ethanol, 20 °C and 11 min).
Table 4. Phenolic composition analysis of the optimal seed extracts (mg compound/g dry extract). Data are expressed as mean ± S.D.
mg/g of Extract
Hydroxybenzoic acids
Gallic acid1.355 ± 0.004
Protocatechuic acid0.008 ± 0.000
Monogalloyl glucoside0.524 ± 0.001
Ellagic acid0.016 ± 0.002
Protocatechuic aldehyde0.022 ± 0.001
Hydroxycinnamic acids
Caftaric acid0.029 ± 0.000
p-Coumaric acid0.040 ± 0.000
3-Coumaric acid0.025 ± 0.000
Flavan-3-ols
Catechin32.405 ± 0.755
Epicatechin44.217 ± 0.089
Catechin gallate0.034 ± 0.004
Epicatechin gallate3.927 ± 0.019
Dimer B17.761 ± 0.017
Dimer B211.856 ± 0.015
Dimer A20.440 ± 0.018
Flavonols
Quercetin-3-O-glucuronide0.013 ± 0.000
Quercetin-3-O-glucoside0.101 ± 0.000
QuercetinTraces
Σ Phenolic compounds102.77 ± 0.054
Table 5. Phenolic composition of the optimal grape seed extract during the digestion process and transepithelial transport assays (mg compound/g of extract). Data are expressed as mean ± S.D.
InitialOralStomachIntestineApicalBasolateral
Hydroxybenzoic acids
Gallic acid1.355 ± 0.004 a1.267 ± 0.008 b1.278 ± 0.011 b1.214 ± 0.009 c0.845 ± 0.004 d0.052 ± 0.003 e
Protocatechuic acid0.008 ± 0.000 c0.007 ± 0.000 c0.008 ± 0.001 c0.010 ± 0.000 b0.018 ± 0.000 a0.002 ± 0.000 d
Monogalloyl glucoside0.524 ± 0.001 a0.532 ± 0.007 a0.390 ± 0.003 b0.382 ± 0.032 b0.312 ± 0021 cTr
Vanillic acidNdNdNdNdNd0.072 ± 0.001
Ellagic acid0.016 ± 0.002 a0.015 ± 0.000 a,b0.013 ± 0.001 b,c0.012 ± 0.000 c0.007 ± 0.000 dNd
Protocatechuic aldehyde0.022 ± 0.001 a0.019 ± 0.002 aNdNdNdNd
Hydroxycinnamic acids
Caftaric acid0.029 ± 0.000 a0.025 ± 0.001 b0.023 ± 0.000 c0.021 ± 0.001 d0.021 ± 0.000 dNd
p-Coumaric acid0.040 ± 0.000 a0.036 ± 0.001 b0.031 ± 0.001 d0.033 ± 0.001 c0.021 ± 0.000 e0.014 ± 0.000 f
3-Coumaric acid0.025 ± 0.000 a0.025 ± 0.001 a0.014 ± 0.000 b0.005 ± 0.000 d0.018 ± 0.001 cNd
Flavan-3-ols
Catechin32.405 ± 0.755 a31.643 ± 0.049 a21.349 ± 0.496 b18.028 ± 0.226 c13.160 ± 0.383 d3.315 ± 0.071 e
Epicatechin44.217 ± 0.089 a41.786 ± 0.737 b22.143 ± 0.044 c16.782 ± 0.106 d13.673 ± 1.037 e3.671 ± 0.087 f
Catechin gallate0.034 ± 0.004 a0.036 ± 0.002 a0.008 ± 0.001 c0.013 ± 0.001 b0.004 ± 0.001 d0.001 ± 0.000 e
Epicatechin gallate3.927 ± 0.019 a3.427 ± 0.031 b1.510 ± 0.003 d1.588 ± 0.002 c0.704 ± 0.081 e0.191 ± 0.001 f
Dimer B17.761 ± 0.017 b7.951 ± 0.132 a7.730 ± 0.021 b2.874 ± 0.077 c3.013 ± 0.029 c0.080 ± 0.003 d
Dimer B211.856 ± 0.015 a11.149 ± 0.205 b6.848 ± 0.008 c6.470 ± 0.082 d5.849 ± 0.073 e0.253 ± 0.002 f
Dimer A20.440 ± 0.018 a0.473 ± 0.021 a0.239 ± 0.006 b0.075 ± 0.028 c0.081 ± 0.007 cNd
Flavonols
Quercetin-3-O-glucuronide0.013 ± 0.000 a0.010 ± 0.000 b0.002 ± 0.001 c0.010 ± 0.001 b0.012 ± 0.001 aNd
Quercetin-3-O-glucoside0.101 ± 0.000 a0.094 ± 0.001 a0.063 ± 0.006 b0.067 ± 0.001 c0.039 ± 0.002 d0.023 ± 0.000 e
QuercetinTrTrNdNdNdNd
Σ Phenolic compounds102.77 ± 0.054 a98.494 ± 0.071 a61.652 ± 0.038 b47.584 ± 0.035 c37.779 ± 0.103 d7.674 ± 0.015 e
a,b,c,d,e,f Different letters indicate significant differences in the compound content between digestion steps by the Duncan test at p < 0.05 (ANOVA). Tr = traces. Nd = not detected.
Table 6. TPC (mg GAE/g extract) and TEAC (mmol trolox/g extract) of optimal grape seed extract during digestion process and transepithelial transport assays. Data are expressed as mean ± S.D.
InitialOralStomachIntestine0.45 µmApicalBasolateral
TPC
(mg GAE/g extract)
394.883 ± 30.543 a389.808 ± 20.648 a303.113 ± 8.254 b262.088 ± 6.256 c182.050 ± 7.507 d157.487 ± 21.386 e11.416 ± 1.260 f
DDPH
(mmol Trolox/g extract)
4.089 ± 0.236 a3.999 ± 0.046 a3.057 ± 0.053 b2.888 ± 0.147 b2.114 ± 0.016 c1.682 ± 0.007 d0.061 ± 0.000 e
ORAC
(mmol Trolox/g extract)
4.050 ± 0.003 a4.290 ± 0.740 a2.748 ± 0.175 b2.536 ± 0.239 b1.915 ± 0.086 c--
a,b,c,d,e,f Different letters indicate significant differences in compound content between digestion steps by Duncan test at p < 0.05 (ANOVA). (-) = no analyzed value.
Disclaimer/Publisher’s Note: The statements, opinions and data contained in all publications are solely those of the individual author(s) and contributor(s) and not of MDPI and/or the editor(s). MDPI and/or the editor(s) disclaim responsibility for any injury to people or property resulting from any ideas, methods, instructions or products referred to in the content.

