Article

Microencapsulation of a Flaxseed and Avocado Oil Blend: Influence of Octenyl Succinic Anhydride (OSA)-Modified Starch and Rice and Pea Proteins on Powder Characterization and Oxidative Stability

by
Paulo Cesar Gonçalves Junior
1,
Caroline Bertagnolli
2,
Carlos Alexandre Moreira da Silva
1 and
Matheus Boeira Braga
1,*
1
Department of Chemical Engineering, Universidade Federal de São Paulo (UNIFESP), São Nicolau Street, 210, Diadema 09913-030, SP, Brazil
2
Institut Pluridisciplinaire Hubert Curien (IPHC), Université de Strasbourg, CNRS, IPHC UMR 7178, F-67000 Strasbourg, France
*
Author to whom correspondence should be addressed.
Processes 2024, 12(10), 2230; https://doi.org/10.3390/pr12102230
Submission received: 27 September 2024 / Revised: 9 October 2024 / Accepted: 10 October 2024 / Published: 13 October 2024
(This article belongs to the Special Issue Advanced Drying Technologies in Food Processing)

Abstract

:
This work investigated the influence of the OSA-modified starch, pea protein, and rice protein combination in the microencapsulation process of a blend of avocado and flaxseed oil (25–75%, w/w) by freeze-drying, focusing on emulsions and powders characteristics and oxidative stability. Four different ratios between the mixture of vegetable proteins (1:1) and the OSA-modified starch were analyzed, using a fixed ratio between the oils blend and the combined encapsulant agents of 1:3. Based on the creaming index, the separation of hydrophilic and hydrophobic phases was not observed. The results demonstrated a tendency to increase the droplet mean diameter with increased protein content (4.71–19.36 μm). An increase in the encapsulation efficiency was verified with the increase in the OSA-modified starch content (51.33–60.32%). Powders presented low moisture content and hygroscopicity, and an oxidative induction time value varying from 0.86 to 1.18 h. The increase in the vegetable protein content increased the powders’ oxidative stability, which could be associated with the antioxidant capacity of rice and pea proteins.

1. Introduction

Flaxseed oil (FO) is rich in α-linolenic (~57%) fatty acids and presents considerable contents of linoleic (~16%) [1] and oleic (~20%) fatty acids [2]. The polyunsaturated fatty acids (PUFAs) from FO have anti-inflammatory action and the potential to destroy and inhibit the proliferation of cancer cells, in addition to preventing cardiovascular diseases and reducing the level of lipids in the blood [1,3]. However, PUFAs are highly susceptible to lipid oxidation triggered by heat, light, and reactive oxygen, compromising the oil’s safety and shelf life [2,4]. According to Choo et al. [5], the stability of flaxseed oil (obtained by cold-pressed) varies from 5 to 12 weeks when stored in the refrigerator.
The reactions between unsaturated fatty acids and oxygen form hydroperoxides (primary products of lipid oxidation). Hydroperoxide molecules eventually react to form secondary lipid oxidation products such as short-chain volatile acids, aldehydes, ketones, and high-molecular-weight polymers [6]. Once oils with a high content of PUFAs are more prone to oxidation when compared to oils with a high content of monounsaturated fatty acids (MUFAs), blends of oils with distinct compositions stand by a no-complex technique that can be applied to increase their shelf life [7]. Moura et al. [8] analyzed the blend of golden flaxseed oil and Hass avocado oil to increase flaxseed oil’s oxidative stability. Avocado oil (AO) was chosen due to the high MUFA content, rich in oleic fatty acid, and minor compounds with antioxidant capacity, such as tocopherols, chlorophylls, and carotenoids. The addition of AO increased the oxidative stability of all blends evaluated.
However, blends of oils rich in unsaturated fatty acids are still susceptible to oxidative degradation, and their incorporation into food products may be restricted due to low solubility in aqueous systems. Emulsion production, followed by microencapsulation, is one of the main strategies influencing shelf life and diversifying oil applications. Emulsions are formed by immiscible liquids, such as oil and water in the continuous phase when one of the liquids is dispersed as small droplets (with droplet diameters ranging from ~0.1 to ~100 μm). The production of O/W emulsions is possible by employing emulsifier agents to keep the oil droplets dispersed and avoid their coalescence [9].
Regarding the microencapsulation process, the oil is trapped in the solid matrix formed by a single or a mixture of encapsulant agents. Freeze-drying and spray-drying are widely employed techniques for encapsulating oils and lipidic compounds [2,6,10,11,12,13,14,15,16]. A spray-dryer process is commonly used on an industrial scale, due to its low cost and easy operation. However, it results in a high waste of energy, because much of the heat is not used in the evaporation of water [2]. Furthermore, due to the high temperatures and airflow (oxygen), the process can compromise the oxidative stability of the product. Freeze-drying of biological materials is an attractive water removal method to obtain high-quality final products. The process occurs under partial vacuum and at lower temperatures, which is adequate for heat and or oxygen-sensitive food products. However, it is an expensive process with high energy consumption and lengthy processing times [17].
Proteins of animal origin are routinely used as emulsifiers and encapsulant agents [18]. However, there is a growing interest in plant-based proteins to replace animal proteins once these proteins can be consumed by people with intolerance to gluten and dairy products [19,20]. Rice brain proteins present a well-balanced amino acid profile, antioxidant activity, and hypoallergenic properties [21]. Pea proteins present antioxidant activity, hypoallergenic properties, and a relatively high lysine but low cystine and methionine content. However, pea protein’s essential amino acid profile can be supplemented by essential amino acids from cereal grains [22], such as rice protein.
The OSA-modified starch is obtained from the esterification reaction between the hydroxyl groups of starch and the octenyl succinic anhydride. Due to the hydroxyl groups and hydrophobic octenyl side chains, a strong interaction at the water/oil interface can be achieved [22]. As a result, OSA-modified starch presents good properties as an emulsifying, stabilizing, and encapsulating agent. It can be applied alone or combined with other materials (such as proteins) in the microencapsulation process of hydrophobic compounds [10].
Previously, we analyzed the FO microencapsulation using mixtures of OSA-modified starch and rice protein concentrate as encapsulant agents. It was observed that decreasing rice protein content increased encapsulation efficiency. In this research, oxidative stability was not analyzed [15]. In another study, we examined the influence of these encapsulant agents on the physical characteristics of vegetable oil microencapsulated. Lower peroxide index values were observed for the powders containing the highest content of proteins [16]. Despite these results, a more detailed investigation of the influence of vegetable protein properties on oil stability (especially the formation of secondary products from lipid oxidation) is necessary.
The novelty of this work was the production of an avocado and flaxseed oil blend (25–75%, w/w) followed by emulsification and microencapsulation processes as a strategy to delay oxidative reactions. This research aimed to study the impact of rice proteins, pea proteins, and OSA-modified starch combination on the microencapsulation process of a blend of oil by freeze-drying. Protein characteristics were related to the emulsions’ stability, encapsulation efficiency, powders’ microstructure, and oxidative stability to deepen the study of the application of rice and pea proteins as emulsifying and encapsulation agents. Our results show that combining rice/pea proteins could be a promising alternative to produce based-plant microencapsulated oil powders with high nutritional quality. The powdered product could be employed in formulations of infant and bakery products.

2. Materials and Methods

Cold-pressed extra virgin golden flaxseed (FO) and Hass avocado oil (AO) were procured from the local market (Americana Indústria e Comércio de Óleos Vegetais, Arealva, SP, Brazil). Rice protein concentrate (RPC) and pea protein concentrate (PPC) were purchased from Growth Supplements (Tijucas, SC, Brazil). OSA-modified corn wax starch Capsul® was obtained from Ingredion Ingredients (São Paulo, SP, Brazil). Deionized water was utilized throughout the analysis procedures. All reagents employed in this research were analytical grade. Figure 1 presents a diagram of the methodology followed in this work.

2.1. Characterization of Vegetable Proteins and OSA-Modified Starch

The water retention capacity (WRC) of proteins was determined from a sample solution, 10% (w/v), according to the method presented by [23]. The suspension remained at rest for 30 min and was centrifuged at 2000× g for 10 min at room temperature. The WRC was defined as the amount of water retained per gram of protein.
The solubility of the proteins was measured following the method presented by [24], with slight modifications. The pH of the 1% (w/w) RPC and PPC solutions was adjusted to 3.5, 5.0, or 7.0 (±0.01) using 0.1 M solutions of HCl or NaOH. Afterward, the solutions were stirred for 1 h at a temperature of 30 °C. Aliquots of the solutions were centrifuged for 14 min at 14,500 rpm. The supernatant fractions were filtered using Whatman n°1 filter paper, and the protein content was measured following the Bradford method [25]. Protein solubility (S) was calculated from Equation (1):
S = mp m × 100
where mp = protein mass in the supernatant (g); m = sample mass (g).
The emulsifying activity index and emulsification stability of the proteins were measured based on the method reported in [26]. RPC and PPC solutions (10 mg/mL, WE), pH = 11.0, were stirred at 30 °C for 30 min. Afterward, 18 mL of solution was added to 2 mL of flaxseed oil and homogenized at 13,500 rpm for 1 min (Ultra Turrax T10, IKA, Staufen, Germany). A 50 µL solution sample was pipetted at 0 and 10 min after homogenization, diluting in 5 mL of sodium lauryl sulfate solution 0.1%. The emulsion’s absorbance (500 nm) was measured at 0 (Ao) and 10 min (A10). The emulsifying activity index and emulsification stability were determined from Equations (2) and (3), respectively.
EAI = 4.606 × A o 0.1 × WE
ES = 10 × A o ( A o A 10 )
where EAI = emulsifying activity index (g/m2); ES = emulsification stability (min).
The antioxidant capacity of the proteins was measured following the method presented in [27], with slight modifications. Protein solutions 5% (w/v), in methanol/water 60/40% (v/v), underwent mixing and centrifugation at 3500 rpm for 10 min. Afterward, 0.5 mL of the solutions were added to 3.0 mL of 1,1-diphenyl-2-picrylhydrazyl (DPPH) methanolic solution (0.10 mM). After a 30 min reaction period in the absence of light, absorbance was recorded at 515 nm. The antioxidant capacity was determined from Equation (4):
AC ( % ) = A DPPH A P A DPPH × 100
where AC = antioxidant capacity (%); ADPPH = absorbance of DPPH solution; AP = absorbance of the samples.
The degree of substitution (DS) of the modified starch can be defined as the average number of hydroxyl groups substituted per glucose unit. The DS was determined by titration according to the method proposed by [28] and calculated from Equations (5) and (6):
OSA sub = ( V b V s ) × 0.1 × M HCl × 100 m
DS = 162 × OSA subs ( 21000 209 × OSA sub )
where OSAsub = OSA substitution (%); Vb = volume of HCl solution employed for native starch titration; vs. = volume of HCl solution employed for modified starch titration; MHCl = molarity of HCl solution (mol/L); m = sample mass (g); 162 = molecular weight of glucose unity; 21,000 = 100 × molecular weight of octenyl succinic group; 209 = molecular weight of octenyl succinic group—molecular weight of hydrogen.
The spectrophotometric measurements were carried out using a spectrophotometer (model IL-593-BI, Kasuaki, Wuxi, China).

2.2. Emulsions Production and Characterization

The oil blend was prepared by mixing 25% of avocado oil and 75% of flaxseed oil (w/w) for 10 min at 100 rpm. The fatty acid composition of the FO and AO-FO (25–75%, w/w) blend was determined in our previous work [8]. The FO showed an α-linolenic fatty acid content of 54.0%, linoleic content of 15.97%, oleic content of 21.0%, palmitic content of 5.18%, palmitoleic content of 0.08%, and stearic fatty acid content of 4.01%. The blend showed an α-linolenic fatty acid content of 40.70%, linoleic content of 14.65%, oleic content of 27.93%, palmitic content of 9.41%, palmitoleic content of 3.31%, and stearic fatty acid content of 3.12%. This formulation was chosen based on the good results of oxidative stability (low values of peroxide index and extinction coefficients K232 and K270 at the end of the oxidative stability analysis).
Emulsions were prepared based on the methodology reported in [15]. The emulsifier agents were hydrated in water for 1 h and homogenized at 8300 rpm for 5 min/100 g emulsion (Ultra Turrax T10, IKA, Staufen, Germany). Afterward, the AO-FO (25–75%, w/w) blend was mixed with the aqueous solution and homogenized at 14,500 rpm for 6 min/100 g of emulsion, using the Ultra Turrax to form the emulsions.
A ratio between RPC and PPC of 1:1 was fixed to guarantee the supplementation of cystine and methionine as essential amino acids in the amino acids profile of the protein mixture. The OSA-modified starch and the protein concentrates were combined at different mass proportions, keeping a fixed ratio between the AO-FO (25–75%, w/w) blend and the mixture of emulsifier agents of 1:3. Therefore, four emulsion formulations (E1, E2, E3, and E4) were produced, as follows: E1, oil’s blend–modified starch ratio of 1:3; E2, oil’s blend–RPC–PPC–modified starch ratio of 1:0.15:0.15:2.7; E3, oil’s blend–RPC–PPC–modified starch ratio of 1:0.3:0.3:2.4; E4, oil’s blend–RPC–PPC–modified starch ratio of 1:0.45:0.45:2.1.
The emulsions’ pH was determined in a calibrated potentiometer. Rheological assessments were conducted in a rheometer (compact modular MCR92 rheometer, Anton Paar, Graz, Austria), equipped with a 60 mm cone-plate geometry. The flow curves were generated at 25 °C through a multistep program, employing shear rates ranging from 0 to 300 s1, in a three-stage up/down/up sequence. The data of the third curve were fitted using the Power Law rheological model, Equation (7).
τ = k × γ n
where τ = shear stress (Pa); γ = shear rate (s1); n = behavior index (-); k = consistency index (Pa·sn).
Droplet size distribution was determined using a Cilas Particle Size Analyzer (model 1190, Orleans, France), immediately after emulsion preparation. All samples were dispersed in water applying ultrasound for 60 s. The droplet mean diameter was expressed as De Brouckere’s mean diameter, Equation (8). The width of size distribution was measured by the span value, Equation (9).
D [ 4 , 3 ] = y i × ( d eqi ) 4 / y i × ( d eqi ) 3
Span = d p ( 90 % ) d p ( 10 % ) d p ( 50 % )
where D[4,3] = De Brouckere’s mean diameter (μm); yi = numerical fraction; deq = equivalent diameter (μm); dp (10%) = diameter of accumulated distribution of 10% of total droplets (μm); dp (50%) = diameter of accumulated distribution of 50% of total droplets (μm); dp (90%) = diameter of accumulated distribution of 90% of total droplets (μm). The emulsion’s stability was evaluated by the creaming index (ICr), following the procedure reported in [11], Equation (10).
ICr ( % ) = ( H H 0 ) × 100
where H0 = emulsion initial height; H = upper phase height after 24 h (separation of the hydrophobic phase).
The emulsion droplets’ morphology was evaluated via optical microscopy employing a Primo Star microscope (Carl Zeiss, Göttingen, Germany) equipped with a 40× magnification lens.

2.3. Freeze-Drying Process

The emulsions underwent freezing at −18 °C for 120 h and subsequently submitted to a freeze-drying process using a bench-scale freeze dryer (L101 LIOTOP, São Carlos, Brazil) under a pressure of 0.5 mmHg, at −56 °C, for 168 h. The powders were stored in sealed plastic containers at −18 °C until further analyses.
The encapsulation efficiency (Є) of the AO:FO (25–75%, w/w) blend was determined based on the method reported in [12], Equation (11). The amount of oil on the particle’s surfaces (unencapsulated oil) was measured by adding 45 mL of n-hexane to 4.5 g of powder followed by mixing for 6 min. The samples were filtered using a Whatman filter n. 1 and powders were washed twice with 45 mL of n-hexane. The unencapsulated oil mass was determined after complete evaporation of n-hexane in a fume hood.
Є   = TO UO TO × 100
where UO = unencapsulated oil mass (g); TO = total oil mass (g).

2.4. Characterization of the Powders

The moisture content (U) was measured by drying 1 g of powder samples at 105 °C on a halogen balance Shimadzu (MOC63u, Kyoto, Japan). Particle size distribution was assessed by laser diffraction (Cilas Particle Size Analyzer, Model 1190, Orleans, France). The powder samples were dispersed in ethanol applying ultrasound for 60 s. Particle size was expressed as De Brouckere’s mean diameter, Equation (8). The width of size distribution was measured by the span value, Equation (9).
The hygroscopicity was determined following the protocol presented by [29]. Samples of 1 g were placed in sealed containers at a temperature of 25 °C and relative humidity of 75% (obtained from saturated NaCl solution), for 7 days. The hygroscopicity was measured based on powder weight variation, Equation (12).
H = M P , f M P , i M P , i
where H = hygroscopicity (kg water/kg sample); MP,I = initial sample weight (kg); MP,f = final sample weight (kg).
The morphology of the powders was verified using scanning electron microscopy (SEM). The powders were coated with a gold film and analyzed using a microscope JEOL (model JSM 6610 LV, Peabody, MA, USA) at 10 kV with amplifications of 2000 times.

2.5. Fourier-Transform Infrared Spectroscopy (FTIR) Analysis

The powder structure was analyzed by infrared spectroscopy using the Fourier transform (FTIR IRPrestige-21, Shimadzu, Kyoto, Japan), from 400 to 4000 cm1, employing the KBr cell method at a resolution of 4 cm1 and 256 scans.

2.6. Oxidative Stability

The oxidative stability of the FO, AO-FO (25–75%, w/w) blend, and powders was determined following the Cd 12b-92 method, accelerated Rancimat method [30]. Briefly, approximately 3 g of sample were added into a reaction vessel with an air stream of 10 L/h at 110 °C in a Rancimat (873 Biodiesel Rancimat, Metrohm, Herisau, Switzerland). The volatile compounds from the secondary reactions of lipid oxidation, formed during the heating of the samples, were transported to a container containing deionized water. The presence of volatile compounds was detected from a sharp increase in water conductivity, as observed by the inflection point of conductivity versus the time graphic recorded by the equipment.

2.7. Statistical Analysis

All analyses were performed in triplicate, except morphology and encapsulation efficiency. The results were presented as the average calculated followed by mean deviation (AD) and underwent Tukey Test analysis using the Past 4.06b software, with a confidence level of 95%. Pearson’s correlation coefficient (R) was employed to verify the correlation among the different properties.

3. Results

3.1. Characterization of Vegetable Proteins and OSA-Modified Starch

The emulsifying properties of rice and pea protein concentrates were analyzed by emulsifying activity index and emulsifier stability results, Table 1. The EAI is a measure of the ability of the protein to promote the dispersion of the oil and the coating of the interfacial area, preventing the coalescence of oil droplets [31]. The ES indicates the ability of an emulsion to maintain its structure over a period, avoiding the coalescence of oil droplets and the aggregation of emulsifying agents [26]. It was found that the rice and pea protein concentrates showed close and low values of EAI, which may have compromised the emulsifying capacity of the vegetal proteins. Zhao et al. [32] reported EAI values of approximately 10 m2/g for rice protein concentrate and approximately 117 m2/g for pea protein concentrate at pH 7.0.
Regarding the emulsifier stability, it was found that the PPC presented a value 1.77 times higher than the RPC. Zhao et al. [32] reported an ES value of approximately 98 min for the PPC. The emulsifying properties of proteins are related to solubility, surface charge, surface hydrophobicity, and molecular flexibility [26,33]. Furthermore, the drying operation is part of processing rice and pea protein concentrates. The use of extreme drying operating conditions (high temperatures and extended drying periods) on an industrial scale [18,34] can result in protein denaturation, insolubility, exposure of hydrophobic groups, and changes in protein surface characteristics [13,15,18].
Low values of RPC solubility were observed at pH 3.5 and 7.0 and an even lower value at pH 5.0 due to the proximity of the rice protein isoelectric point of approximately 4.5 [21]. Regarding PPC, a higher solubility was observed when compared to RPC. Considering a pH of 3.5, the increase in solubility was approximately 6.0 times, and considering a pH of 7.0, the increase was approximately 8.2 times. Therefore, PPC’s better emulsifier stability result may be associated with its higher solubility.
Zhao et al. [32] reported values of RPC solubility close to zero for a pH range between 2.0 and 11.0. Mota da Silva et al. [18] reported values of PPC solubility of approximately 30% for pH 3.5, 10% for pH 5.0, and 60% for pH 7.0. Zhao et al. [32] reported values of PPC solubility of approximately 10% for pH 3.5, 3% for pH 5.0, and 12% for pH 7.0.
Rice and pea proteins and their derived hydrolysates and specific peptide fractions present potential antioxidative activity [35,36]. The free radical-scavenging ability may be related to small-molecular-weight peptides and amino acids such as aspartic acid, glutamate, glycine, histidine, threonine, tyrosine, methionine, cystine, and lysine [37]. In food products, antioxidants could retard lipids’ peroxidation and the formation of secondary products during oxidation reactions.
Rice protein concentrate showed an antioxidant capacity value close to the value obtained for pea protein concentrate. Considering the rice and pea protein concentrates mixture (1:1), the antioxidant capacity was 33.72%, with a mean deviation of 0.99. Singh et al. [38] reported an AC value of 14.81% for natural rice brain protein, a value of AC of 33.68% for a degree of hydrolysis of ~15%, an AC value of 37.19% for a degree of hydrolysis of ~25%, and an AC value of 43.21% for a degree of hydrolysis of ~32%. In this study, rice brain protein was hydrolyzed by a commercial food-grade enzyme papain.
Analyzing the results of water retention capacity, it was observed that the PPC presented a value 1.3 times higher than the value obtained for the RPC. It is important to highlight that the origin of the vegetable protein and its processing directly influence its functional properties. Perrechil et al. [15] reported a value of WRC of 2.32 g/g for RPC at pH 6.7. Zhao et al. [32] reported a value of WRC of 1.4 g/g for RPC and 3.3 g/g for PPC.
OSA-modified starch showed a degree of substitution of 0.017 with AD of 0.001. This result follows the maximum value of ~0.023 established by the United States Food and Drug Administration [39]. The degree of substitution is an important structural characteristic of OSA-modified starch, and the increase in its values is related to a better emulsifier capacity and emulsion stability [22].

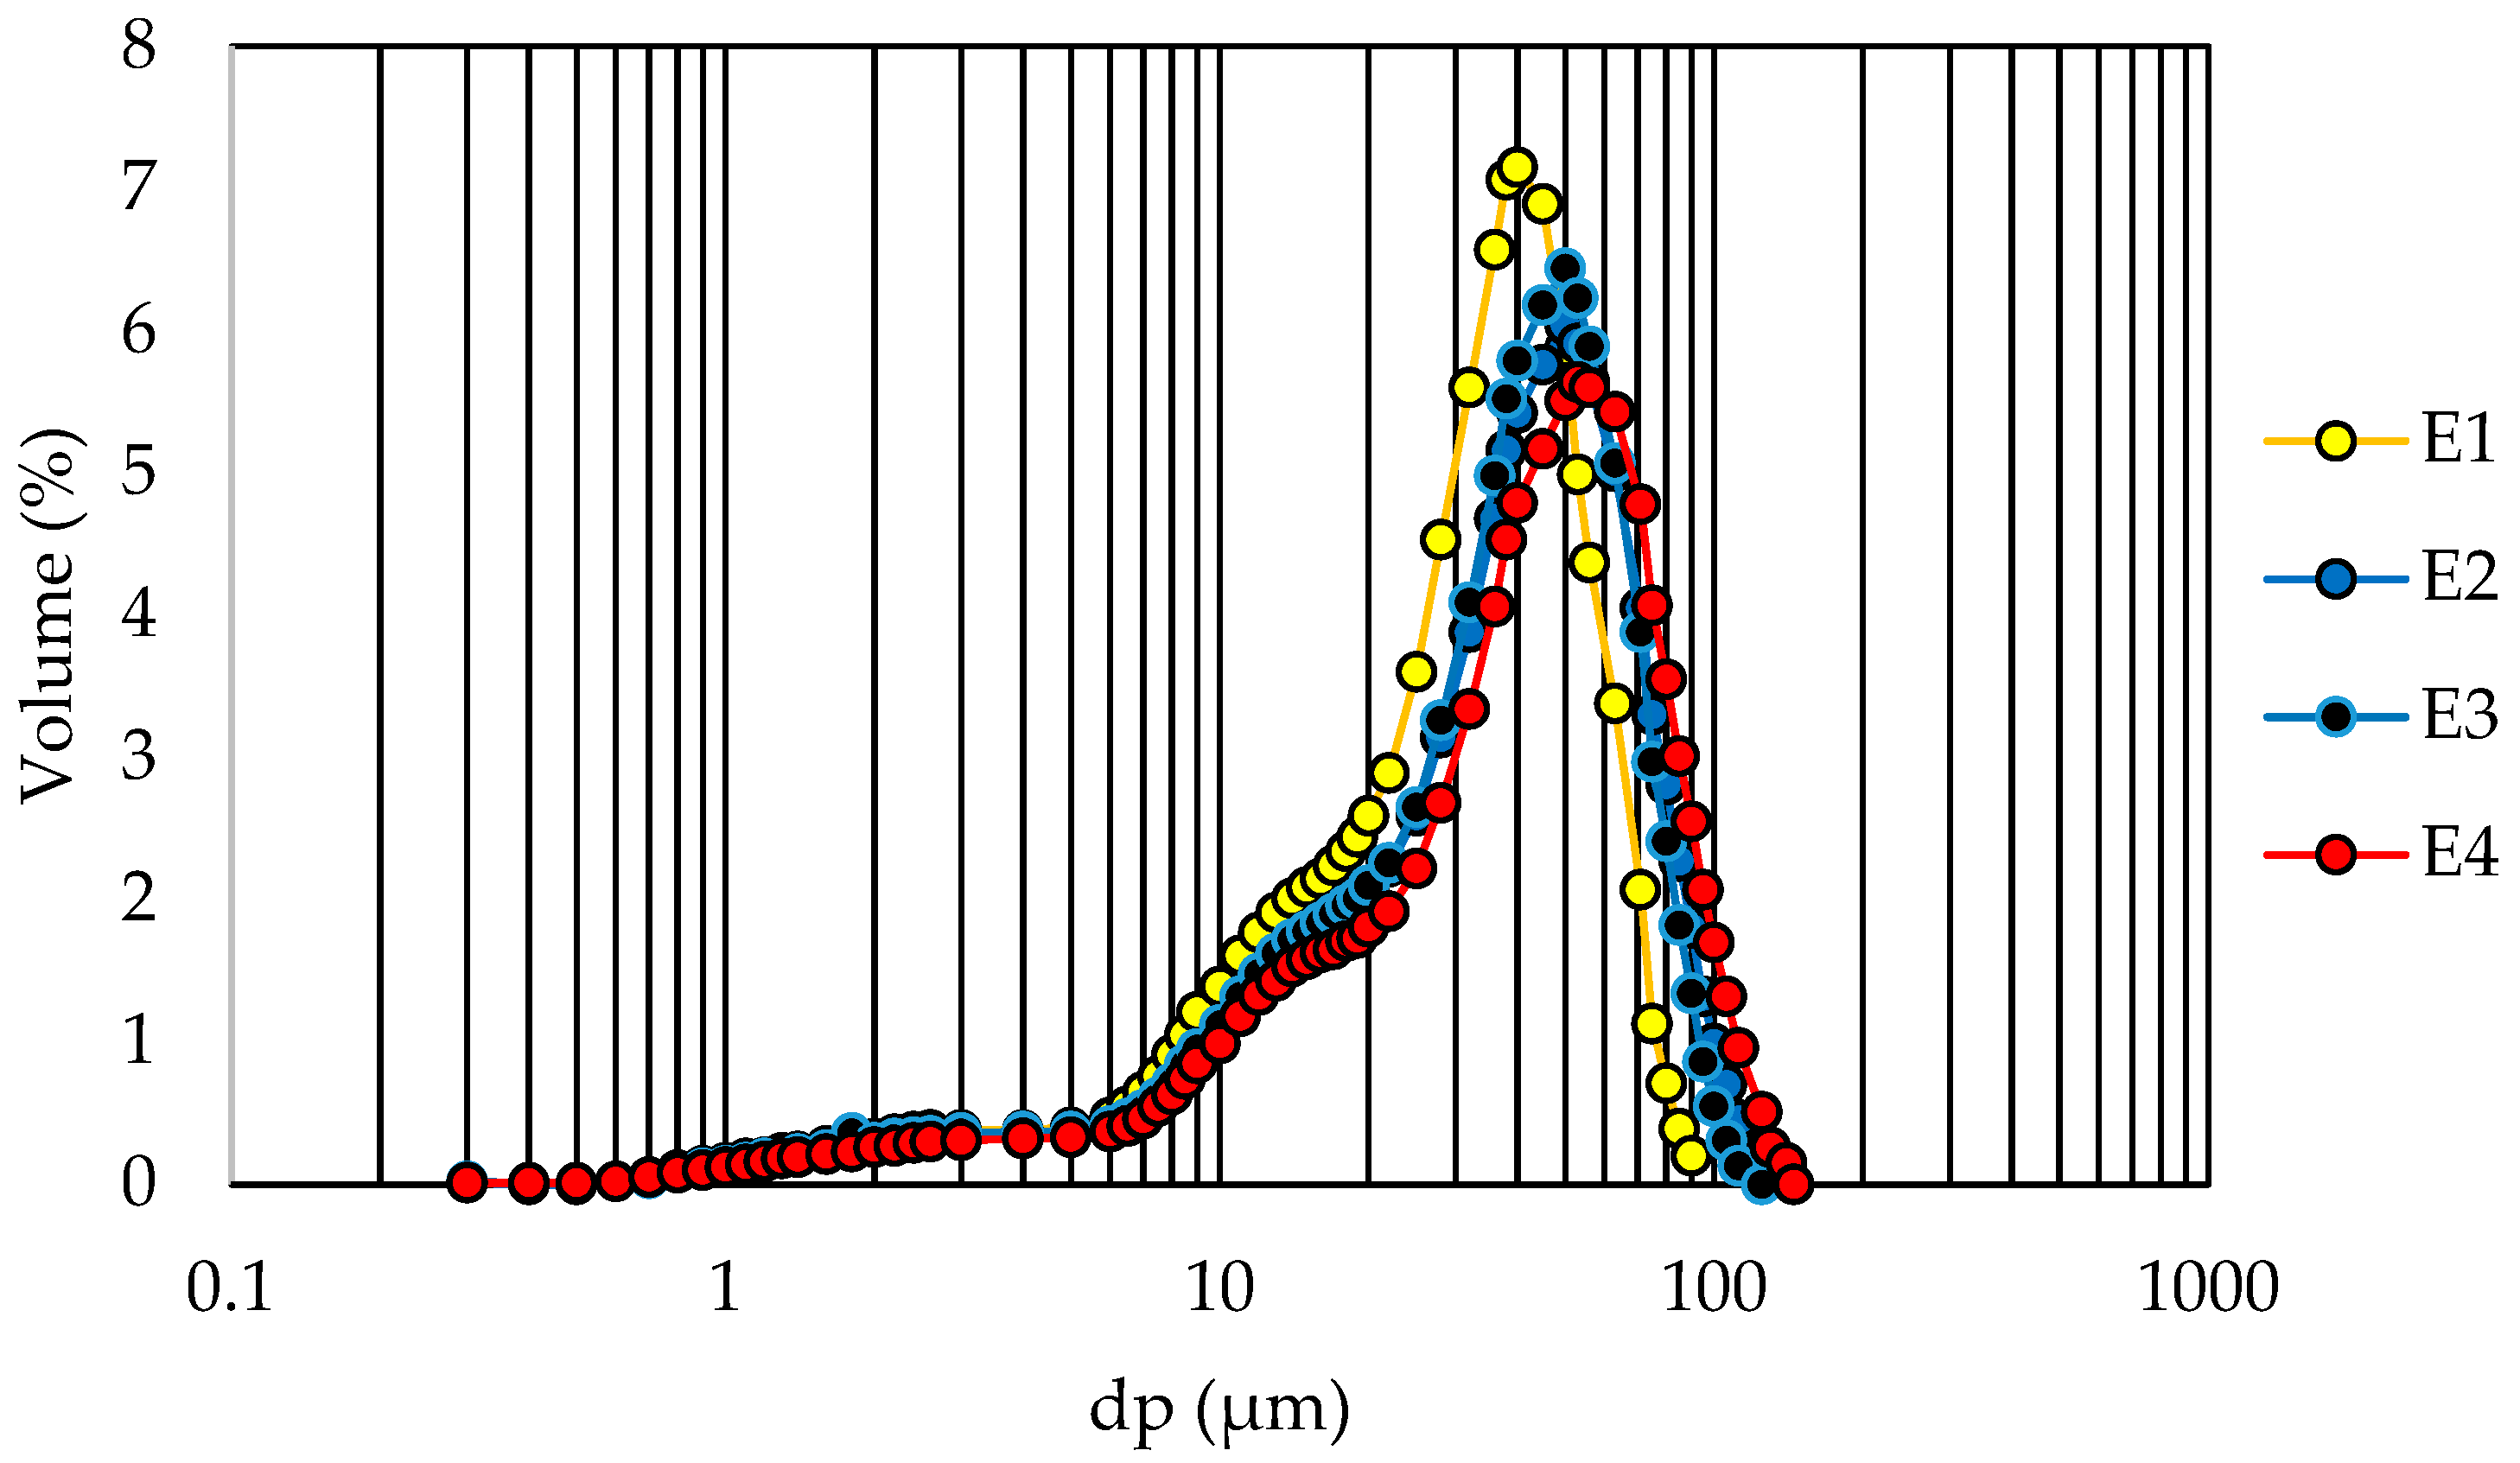
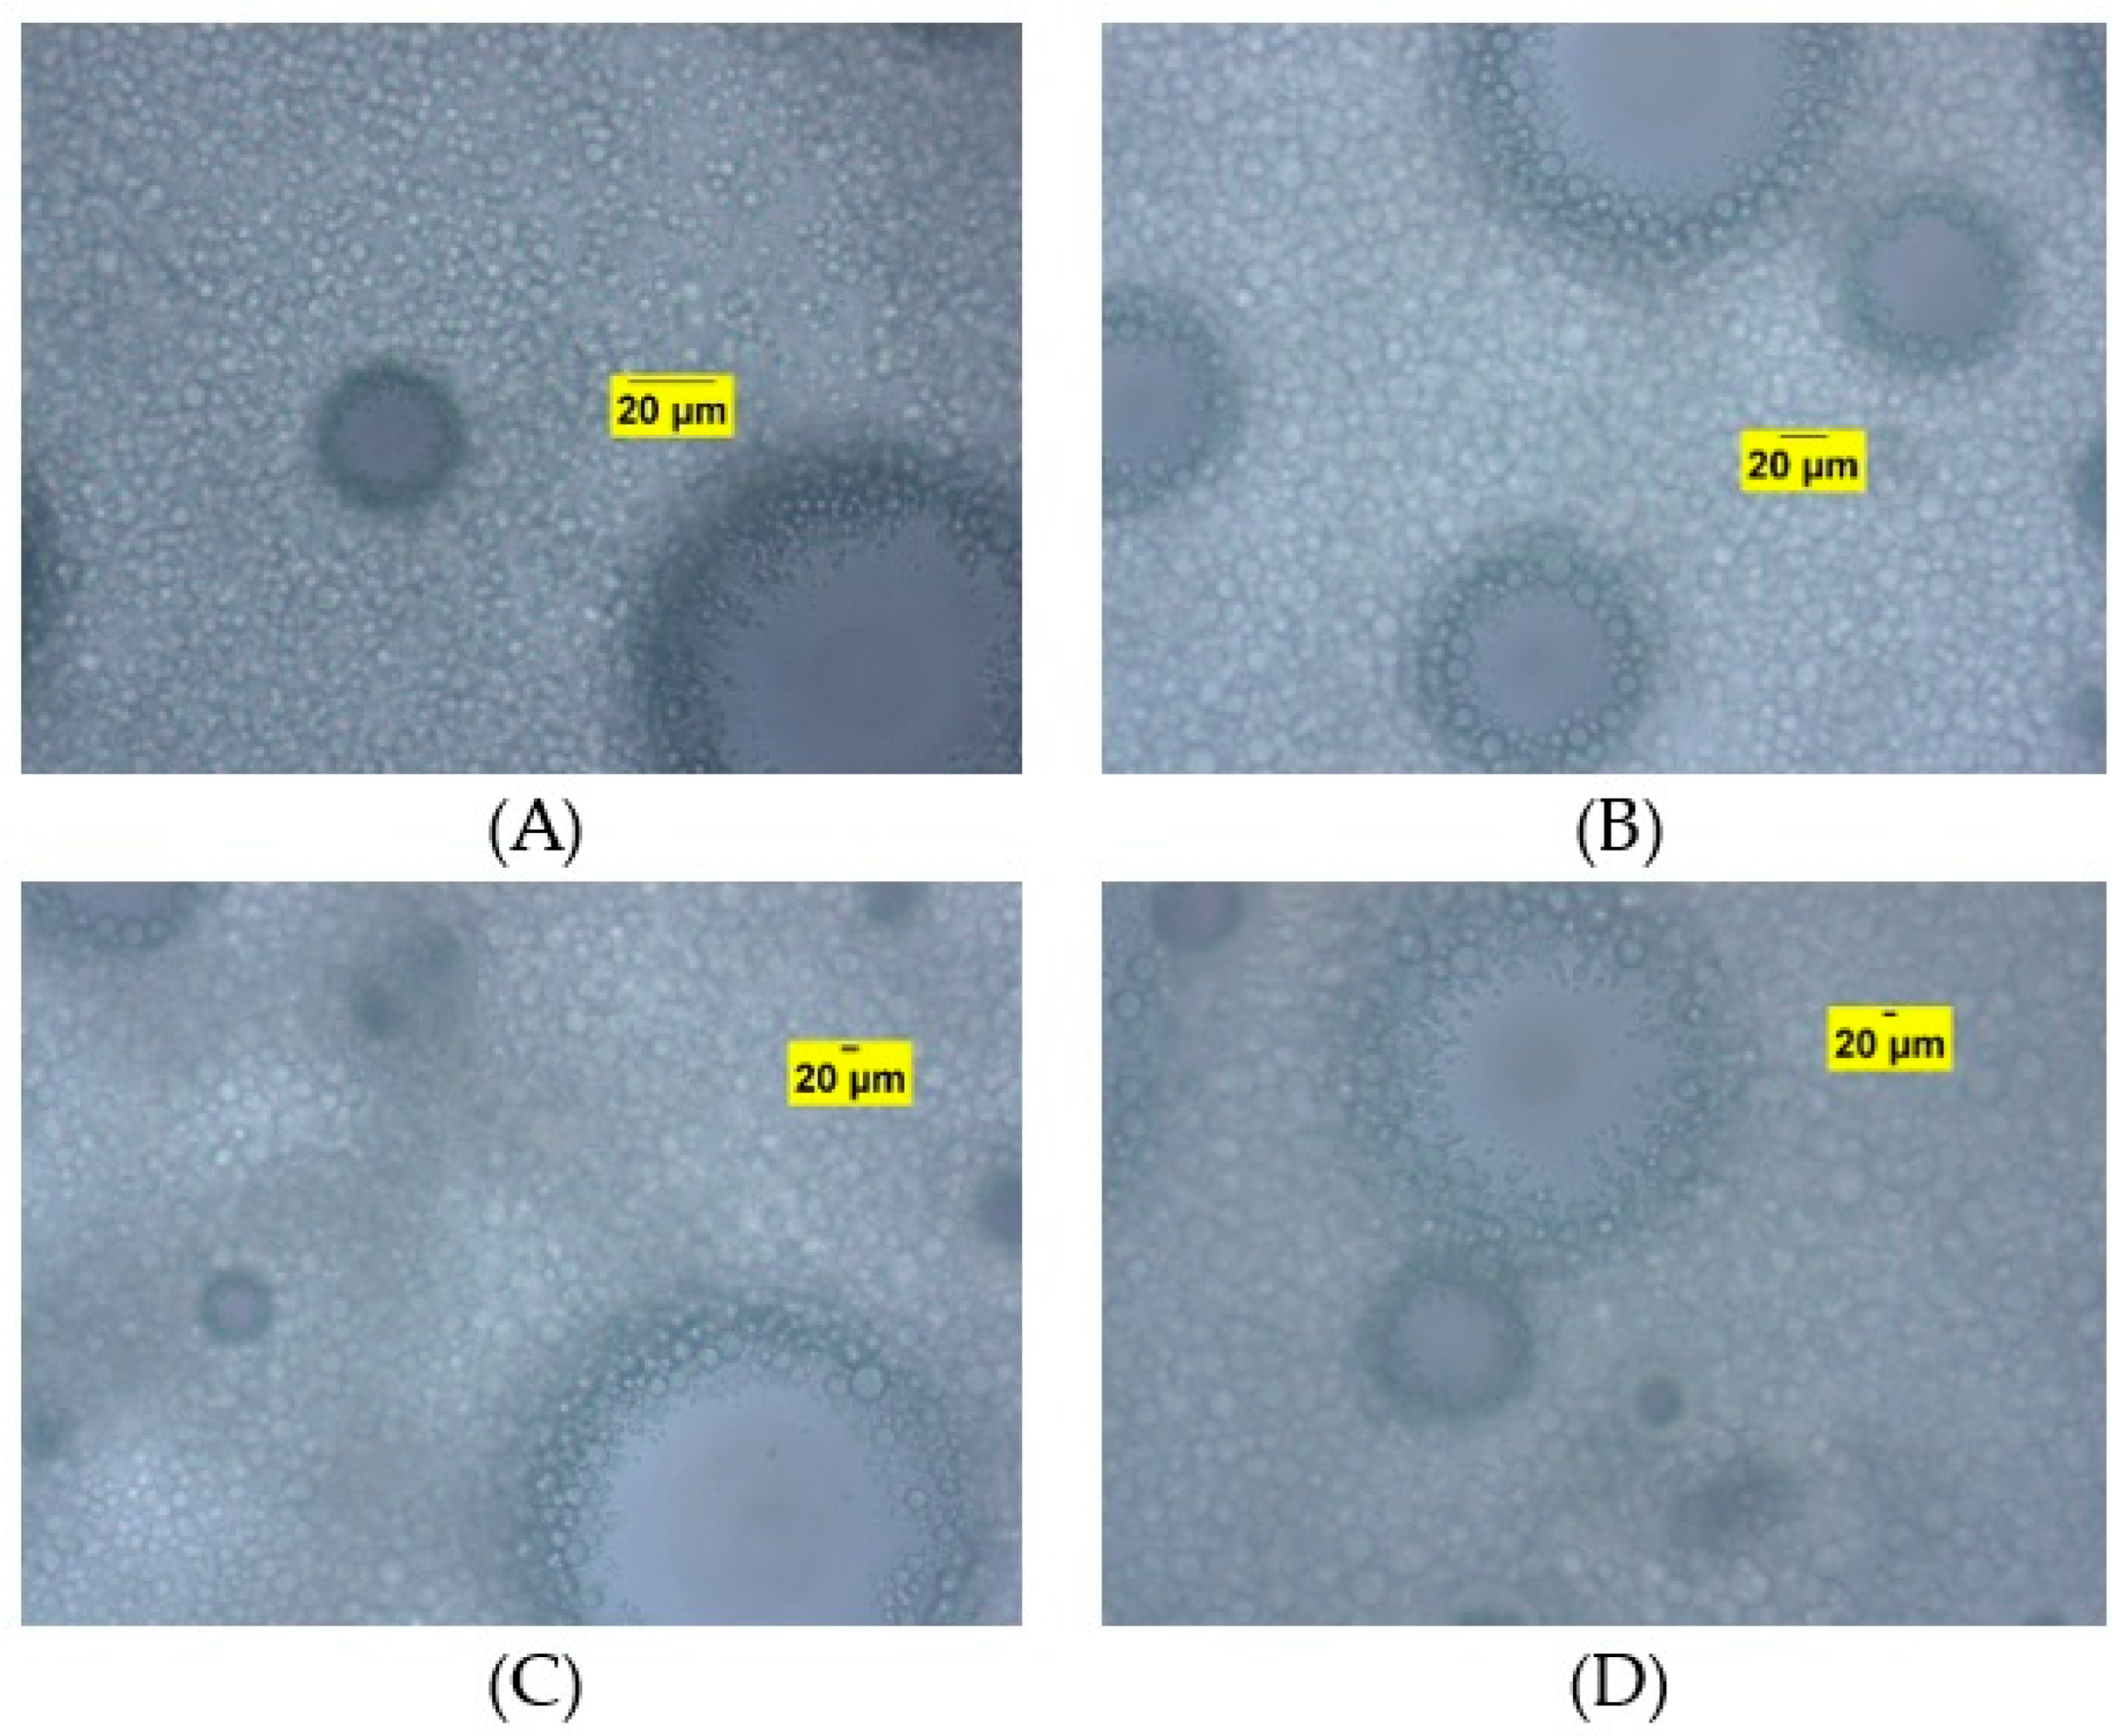
3.2. Emulsions Characterization

Table 2 presents the results of the physical characterization (pH, creaming index, rheology, droplet size distribution, and droplet mean diameter) of emulsions E1 (0% RPC and PPC + 100% OSA-modified starch), E2 (10% RPC and PPC + 90% OSA-modified starch), E3 (20% RPC and PPC + 80% OSA-modified starch), and E4 (30% RPC and PPC + 70% OSA-modified starch).
It was observed that the increase in the content of starch modified with octenyl succinic anhydrous resulted in a statistically significant decrease in the pH value. Moreover, emulsions E2, E3, and E4 presented pH values close to the isoelectric points of the vegetable proteins, which could compromise the solubility and result in protein aggregation.
The formation of stable emulsions is essential for the microencapsulation process, resulting in solid particles able to protect the compounds of interest. It was found that all emulsions showed phase separations after the 24 h analysis period. However, the upper phase did not comprise a typical oil phase (a blend of flaxseed and avocado oil) but a less dense phase of agglomerates. Therefore, the separation of hydrophilic and hydrophobic phases was not observed for all emulsions.
Regarding the results of the rheological trials, a tendency to increase the consistency index values (k) was observed with the increase in the OSA-modified starch content. However, statistically significant differences between emulsions E1 and E2 and between emulsions E3 and E4 were not observed. All emulsions exhibited the behavior of a non-Newtonian fluid of the pseudoplastic type (behavior index n < 1). Considering a shear rate of 100 s−1, it was observed a tendency to increase the apparent viscosity with the increase in the OSA-modified starch content, with an average value of 75.45 mPa.s for emulsion E1 and a value of 61.40 mPa.s for emulsion E4, an increase of ~22.9%.
Figure 2 presents the apparent viscosity values as a function of the shear rate for all formulations. The apparent viscosity of all emulsions decreased with the increasing shear rate (0–300 s−1). Such behavior is related to the shear-induced breakdown of the polymer network of the emulsions (amylopectin and proteins). The lower apparent viscosity and resistance to flow are linked to the rate of intermolecular disruption, which is higher than the reformation rate [40].
The droplet diameter values of all emulsions exhibited no statistically significant variations and remained below 1.90 μm for 10% of the droplets. Analyzing the results for a percentage of 50% of the droplets, the emulsion E4 (containing the higher level of vegetable proteins) presented the highest droplet diameter value of 9.43 μm and the emulsions E2 and E3 presented the lowest droplet diameter values. Notably, between formulations E2 and E3, no statistically significant variations were observed. Considering 90% of the droplets, an increase in the vegetable protein content led to a tendency towards larger droplet diameters, mainly for the emulsions E3 and E4. However, no statistically significant variations were observed between formulations E1 and E2.
Concerning the droplet mean diameter, a tendency to increase with the increase in the content of vegetable proteins was also observed. Between formulations E1 and E2, no statistically significant variations were observed. It can be concluded that increasing the content of OSA-modified starch increased the presence of small, well-dispersed droplets in the continuous phase, which could be related to the good emulsifying properties of Capsul® [41]. Moreover, the higher values of droplet size of formulations E3 and E4 indicate a strong interaction and aggregation among PPC, RPC, and OSA-modified starch, which could be related to protein content and the pH of the emulsions.
Figure 3 presents the droplet size distribution diagrams for emulsions E1, E2, E3, and E4. Analyzing the results of emulsion E1, containing only OSA-modified starch as an emulsifier agent, it was found that the droplet diameter ranged from approximately 0.07 μm to 18 μm, with a monomodal distribution containing only one dominant peak (~7.0 μm). Emulsion E2 showed droplet diameter values between approximately 0.2 μm and 22.0 μm, and a monomodal distribution with a dominant peak at ~4.0 μm.
Emulsion E3 presented droplet diameter values between approximately 0.04 μm and 90.0 μm and a multimodal distribution with four dominant peaks at ~0.3, 4.0, 12.0, and 45.0 μm. Regarding the results of emulsion E4, containing 70% of OSA-modified starch and 30% of vegetable proteins as emulsifier agents, it was found that the diameter of the droplets varied from approximately 0.2 μm to 112 μm, with a multimodal distribution of three peaks, indicating the occurrence of three dominant droplet diameters (~2.6, 10.0, and 53.0 μm, respectively). Regarding polydispersity span, all emulsions showed statistically significant differences. Emulsion E3 followed by E4 presented the higher values of span. Emulsion E1 presented the lowest span value, indicating a higher density of small particles.
Figure 4 presents the images of emulsions E1, E2, E3, and E4, with an amplification of 40 times. The shape and distribution of the oil droplets dispersed in the emulsions and in the interface between the emulsions and the air bubbles (larger circles with a homogeneous color) could be observed for all formulations. Droplet populations with different sizes could be observed, corroborating with multimodal distribution results detected by droplet size distribution analysis.

3.3. Powders Characterization

Powders from each formulation were characterized by encapsulation efficiency, moisture content, hygroscopicity, particle mean diameter, and particle distribution (Table 3). A gradual decrease in the encapsulation efficiency was observed with the increase in the RPC + PPC content. For instance, analyzing the results for powder E1 (only the OSA-modified starch) and powder E4 (70% OSA-modified starch and 30% RPC + PPC), a variation of 14.90% of Є was observed.
Gomes and Kurozawa [42] investigated the microencapsulation of flaxseed oil by spray-drying using isolated rice protein and maltodextrin with 10 DE or isolated rice protein with different degrees of hydrolysis (obtained by Alcalase or Flavourzyme) as encapsulant agents. A negative correlation between oil droplet size and encapsulation efficiency was reported. The authors argue that larger oil droplets are more susceptible to disruption during microencapsulation, increasing the superficial oil content. Analyzing Table 2, an increase in droplet size with the increase in the concentration of vegetable proteins was observed. Additionally, a negative and strong correlation between droplet size and encapsulation efficiency was confirmed by Pearson’s correlation coefficient (R = −0.871).
Powders from each formulation showed low moisture content values, which is desired once humidity directly influences the glass transition, development of microorganisms, enzymatic reactions, and oxidative reactions. It is worth mentioning that the maximum level of moisture content for powdered food should remain between 3% and 4% (w/w) [13]. Hygroscopicity is also a property related to powder stability, indicating the ability of the product to attract and hold molecules of water from an environment with high levels of humidity. All powder samples showed low hygroscopicity values, and only powder from emulsion E4 presented a statistically significant variation (lower hygroscopicity value). Low hygroscopicity values could be related to encapsulation efficiency. Considering that part of the oil’s blend remained on the surface of the particles, the absorption of water molecules could be compromised due to hydrophobic interactions [14].
Particle size can impact the physical properties of a powdered product, its suitability for use in food formulations, and its shelf life. For instance, smaller particles result in larger surface areas prone to oxidation reactions. Analyzing the results in Table 3, all powder formulations presented values of particle diameter below 9.11 μm for 10% of the particles, below 39.41 μm for 50% of the particles, and below 74.85 μm for 90% of the particles. Overall, an increase in the De Brouckere mean diameter by the addition of vegetable proteins could be observed. However, no statistical differences were observed among formulations E2, E3, and E4.
The particle size distribution of each powder formulation is presented in Figure 5. All powder samples presented particle diameters ranging from approximately 0.50 μm to 110 μm and a monomodal distribution with one peak, indicating the occurrence of only one dominant particle diameter (E1 ~40 μm, E2 and E3 ~50 μm, and E4 ~53 μm). Regarding polydispersity span, a tendency to increase its value was observed with the addition of vegetable proteins. However, no statistical differences were observed among emulsions E2, E3, and E4.
Figure 5. Particle size distribution of powders from formulations E1, E2, E3, and E4. Figure 6 represents the scanning electron microscopy images of the powders obtained from each formulation, amplifying 2000×. All powder samples showed an irregular shape. Analyzing the images, it was possible to observe the presence of small channels formed during the water sublimation process.
Processes 12 02230 g005
Figure 6. Scanning electron microscopy of the powder (a) from emulsion E1, (b) from emulsion E2, (c) from emulsion E3, and (d) from emulsion E4. Amplification of 2000×.
Processes 12 02230 g006

3.4. Oxidative Stability

In the analysis of accelerated oxidative stability via Rancimat, the samples were exposed to a high temperature (110 °C) and a constant flow of oxygen (10 L/h). At the end of the experiment, the lipoperoxidation process reaches its final stages, and the oil molecules are oxidized into short-chain volatile acids. These volatiles are collected in distilled water, increasing their conductivity [14]. The results were expressed as oxidation induction time (OIT). Therefore, higher values of OIT indicate higher oxidative stability. Conversely, lower values of IOT are related to a lower oxidative stability of the product. Figure 7 presents the results of OIT of bulk flaxseed oil, AO-FO (25:75%, w/w) blend, and each powder formulation.
In bulk oil, association colloids are formed due to the self-assembled amphiphilic molecules, such as phospholipids, free fatty acids, and surfactants. Lipid oxidation usually occurs at the oil–water interface of the association colloids where different compounds accumulate (antioxidants, hydroperoxides, transition metals, and polyunsaturated fatty acids) [43]. Bulk flaxseed oil showed an OIT value of 2.07 h, and the blend of avocado and flaxseed oil (25–75%, w/w) showed a higher OIT value of 2.60 h, an increase of ~26%.
Moura et al. [8] noted that the enhanced oxidative stability of the AO-FO (25%:75%, w/w) oil blend is related to the chemical composition of avocado oil, which presented a higher monounsaturated and saturated fatty acids content and natural antioxidants (alpha-tocopherols, chlorophylls, and carotenoids) when compared to pure flaxseed oil.
It is worth mentioning that similar lipid oxidation sites (oil–water interface) occur in bulk oil and emulsion systems. However, a more complex composition of the emulsions results in more factors that can affect the oxidation rates [43]. After freeze-drying, the emulsifier agents became the encapsulant agents, responsible for the oil’s blend protection against oxidative degradation. Analyzing Figure 7, an increase in OIT values was observed with the increase in vegetable protein content. For instance, powder E1 presented an average OIT value of 0.86 h and powder E4 had an average OIT value of 1.18, an increase of ~37.2%. Overall, the increase in the vegetable protein content resulted in an increase in the droplet size of the emulsions, a decrease in the encapsulation efficiency of the oils blend, an increase in the particle size, and an increase in the powder’s OIT. The tendency towards improvement in the oxidative stability of the powders could be associated with the antioxidant capacity of rice and pea proteins.
The microencapsulation process by freeze-drying resulted in lower induction time values when compared to bulk flaxseed oil and the oils blend. It is worth mentioning that Racimat induces exposure of large superficial areas for powdered products, which are susceptible to oxidation. Therefore, the induction period may be underestimated compared to bulk oil and oil’s blend [42]. As a means of comparison, Di Giorgio and Salgado [14] studied the microencapsulation process of fish oil by spray-drying using the soy protein isolate as an encapsulant agent to protect the product against lipid autoxidation. The authors reported an average induction time value for bulk fish oil of 3.91 h. Overall, microencapsulation also resulted in lower values of induction time when compared to pure oil.

3.5. FTIR Analysis

The elemental composition analysis of the powders using FTIR revealed the primary constituent characteristics of the investigated formulations. The spectra of the formulations containing a mixture of avocado and flaxseed oil, rice and pea protein, and OSA-starch modified are depicted in Figure 7. Only the bands with the highest intensity were highlighted in Figure 8.
The spectra for all powders exhibited broad asymmetric bands with peaks within the range of 3450–3400 cm−1, associated with the stretching vibration of the OH (hydroxyl) group in modified starch molecules and rice and pea protein [44,45,46]. The peaks around 3500–3000 cm−1 are also associated with the stretching vibration of the NH (nitrogen–hydrogen) bonds of amines I and II [47].
The peaks around 2900 cm−1 are linked to the stretching of CH (carbon–hydrogen) bonds of triglyceride molecules of the oils, modified starch, and proteins [15,48,49]. Arpi et al. [49] analyzed the FTIR spectra of avocado oil. According to the authors, high-frequency values on this absorption path indicate a sample with unsaturated and polyunsaturated fat acids, similar to olive oil.
Peaks around 1745 cm−1 are related to stretching the C=O (carbonyl) bond of esters from lipid triglycerides and fatty acids [44,45] and starch modified with octenyl succinic anhydride. Additionally, peaks at band 1745 cm−1 are associated with stretching vibrations for aldehydes and ketones [47], while peaks at 1639 cm−1 and cm−1 1530 are associated with the amide I and amide II present in proteins [43,44].
Peaks around 1460 and 1369 cm−1 are related to shear vibrations of CH2 and CH3 ethers, while peaks at bands 1207, 1157, 1085, and 1020 cm−1 can be linked to the stretching vibrations of the C–O group [47]. Ester linkages in triglycerides (major components of flaxseed and avocado oil) will exhibit C-O stretching vibrations around 1100 cm−1 [46].
Peaks at 1157 cm−1 and close to it are associated with (-COC-) glycoside stretch vibration and the ring vibrations juxtaposed with (C-OH) lateral group stretch vibration [44,45]. The peaks close to 1040 and 1020 cm−1 correspond to starch’s crystalline and amorphous regions, respectively [45]. Bands between 1000 and 600 cm−1 are related to aromatic ring stretch vibration [44,50].

4. Conclusions

Rice and pea proteins showed close and low values of emulsifying activity index (lower than 3.01 m2/g), solubility, and water retention capacity. Pea protein showed a higher value of emulsifier stability (76.95 min) when compared to rice protein (43.33 min). The antioxidant capacity was evaluated toward the 1,1-diphenyl-2-picrylhydrazyl (DPPH) radical; both proteins showed values of antioxidant capacity close to 30%.
Based on creaming index results, the emulsions’ separation of hydrophilic and hydrophobic phases was not observed. All formulations showed a pseudoplastic fluid behavior. A tendency to increase the droplet mean diameter of the emulsions with the increase in the protein content was also observed (4.71–19.36 μm).
A gradual increase in the encapsulation efficiency was observed with the increase in the OSA-modified starch (51.33–60.32%). Additionally, Pearson’s correlation confirmed a negative and strong correlation between droplet size and encapsulation efficiency. All powder formulations presented good physical characteristics with low moisture content (<3.71%) and hygroscopicity (<0.0965 kg/kg).
Bulk flaxseed oil showed an OIT value of 2.07 h, and the AO-FO (25–75%, w/w) blend showed an OIT value of 2.60 h, an increase of ~26.0%. Powders presented an OIT value varying from 0.86 to 1.18 h. Overall, the increase in the vegetable protein content resulted in an increase in the droplet size of the emulsions, a decrease in the encapsulation efficiency, an increase in the particle size of the powders, and an increase in the oxidative stability of the powders (which could be related to the antioxidant capacity of the proteins).

Author Contributions

Methodology, M.B.B.; resources, M.B.B.; data curation, P.C.G.J.; writing—original draft, M.B.B., C.A.M.d.S. and C.B.; writing—review and editing, C.A.M.d.S. and C.B.; supervision, M.B.B. and C.A.M.d.S. All authors have read and agreed to the published version of the manuscript.

Funding

This research was supported by the São Paulo Research Foundation (FAPESP), process numbers 2021/13134-1.

Data Availability Statement

The original contributions presented in the study are included in the article; further inquiries can be directed to the corresponding author.

Conflicts of Interest

The authors declare no conflicts of interest.

References

  1. Kouamé, K.J.E.-P.; Bora, A.F.M.; Li, X.; Sun, Y.; Liu, L. Novel trends and opportunities for microencapsulation of flaxseed oil in foods: A review. J. Funct. Foods 2021, 87, 104812. [Google Scholar] [CrossRef]
  2. Wang, Y.; Ghosh, S.; Nickerson, M.T. Microencapsulation of flaxseed oil by lentil protein isolate-κ-carrageenan and -ι-carrageenan based wall materials through spray and freeze drying. Molecules 2022, 27, 3195. [Google Scholar] [CrossRef] [PubMed]
  3. Kauser, S.; Hussain, A.; Ashraf, S.; Fatima, G.; Ambreen; Javaria, S.; Abideen, Z.U.; Kabir, K.; Yaqub, S.; Akram, S.; et al. Flaxseed (Linum usitatissimum); phytochemistry, pharmacological characteristics and functional food applications. Food Chem. Adv. 2024, 4, 100573. [Google Scholar] [CrossRef]
  4. Ghosh, S.; Bhattacharyya, D.; Ghosh, M. Antioxidant activity and oxidative stability of some binary and ternary blended vegetable oil. Int. Res. J. Eng. Technol. 2019, 6, 2068–2077. [Google Scholar]
  5. Choo, W.-S.; Birch, J.; Dufour, J.-P. Physicochemical and quality characteristics of cold-pressed flaxseed oils. J. Food Compos. Anal. 2007, 20, 202–211. [Google Scholar] [CrossRef]
  6. Espinosa-Andrews, H.; Morales-Hernández, N.; García-Márquez, E.; Rodríguez-Rodríguez, R. Development of fish oil microcapsules by spray drying using mesquite gum and chitosan as wall materials: Physicochemical properties, microstructure, and lipid hydroperoxide concentration. Int. J. Polym. Mater. Polym. Biomater. 2023, 72, 646–655. [Google Scholar] [CrossRef]
  7. Pattnaik, M.; Mishra, H.N. Amelioration of the stability of polyunsaturated fatty acids and bioactive enriched vegetable oil: Blending, encapsulation, and its application. Crit. Rev. Food Sci. Nutr. 2022, 62, 6253–6276. [Google Scholar] [CrossRef] [PubMed]
  8. Moura, M.d.S.; da Silva, C.A.M.; Braga, M.B. Flaxseed and avocado oil blends: Physical and physicochemical characterization, nutritional quality and oxidative stability. Appl. Food Res. 2023, 3, 100370. [Google Scholar] [CrossRef]
  9. McClements, D.J. Food Emulsions: Principles, Practices, and Techniques, 3rd ed.; CRC Press: Boca Raton, FL, USA, 2015; p. 714. [Google Scholar]
  10. Mujica-Álvarez, J.; Gil-Castell, O.; Barra, P.A.; Ribes-Greus, A.; Bustos, R.; Faccini, M.; Matiacevich, S. Encapsulation of vitamins A and E as spray-dried additives for the feed industry. Molecules 2020, 25, 1357. [Google Scholar] [CrossRef]
  11. Carneiro, H.C.F.; Tonon, R.V.; Grosso, C.R.F.; Hubinger, M.D. Encapsulation efficiency and oxidative stability of flaxseed oil microencapsulated by spray drying using different combinations of wall materials. J. Food Eng. 2013, 115, 443–451. [Google Scholar] [CrossRef]
  12. Bae, E.K.; Lee, S.J. Microencapsulation of avocado oil by spray drying using whey protein and maltodextrin. J. Microencapsul. 2008, 25, 549–560. [Google Scholar] [CrossRef] [PubMed]
  13. Can Karaca, A.; Low, N.; Nickerson, M. Encapsulation of flaxseed oil using a benchtop spray dryer for legume protein–maltodextrin microcapsule preparation. J. Agric. Food Chem. 2013, 61, 5148–5155. [Google Scholar] [CrossRef] [PubMed]
  14. Di Giorgio, L.; Salgado, P.R.; Mauri, A.N. Encapsulation of fish oil in soybean protein particles by emulsification and spray drying. Food Hydrocoll. 2019, 87, 891–901. [Google Scholar] [CrossRef]
  15. Perrechil, F.; Louzi, V.C.; Alves da Silva Paiva, L.; Valentin Natal, G.S.; Braga, M.B. Evaluation of modified starch and rice protein concentrate as wall materials on the microencapsulation of flaxseed oil by freeze-drying. LWT 2021, 140, 110760. [Google Scholar] [CrossRef]
  16. Perrechil, F.; Natal, G.S.V.; Paiva, L.A.d.S.; Braga, M.B. Mixtures of modified starch and rice and pea protein concentrate as wall material in the microencapsulation of flaxseed Oil. Powders 2023, 2, 323–337. [Google Scholar] [CrossRef]
  17. Chen, X.D.; Mujumdar, A.S. Drying Technologies in Food Processing, 1st ed.; Blackwell Publishing: Singapore, 2008; p. 352. [Google Scholar]
  18. Mota da Silva, A.M.; Souza Almeida, F.; Kawazoe Sato, A.C. Functional characterization of commercial plant proteins and their application on stabilization of emulsions. J. Food Eng. 2021, 292, 110277. [Google Scholar] [CrossRef]
  19. Helm, R.M.; Burks, A.W. Hypoallergenicity of rice protein. Cereal Foods World 1996, 41, 839–843. [Google Scholar]
  20. Andreola, K.; Silva, C.A.M.; Taranto, O.P. Agglomeration process of rice protein concentrate using glucomannan as binder: In-line monitoring of particle size. Chem. Eng. Res. Des. 2018, 135, 37–51. [Google Scholar] [CrossRef]
  21. Zhu, S.M.; Lin, S.L.; Ramaswamy, H.S.; Yu, Y.; Zhang, Q.T. Enhancement of functional properties of rice bran proteins by high pressure treatment and their correlation with surface hydrophobicity. Food Bioprocess Technol. 2017, 10, 317–327. [Google Scholar] [CrossRef]
  22. Wu, D.; Lin, Q.; Singh, H.; Ye, A. Complexation between whey protein and octenyl succinic anhydride (OSA)-modified starch: Formation and characteristics of soluble complexes. Food Res. Int. 2020, 136, 109350. [Google Scholar] [CrossRef]
  23. Sosulski, F.; Garratt, M.D.; Slimkard, A.E. Functional properties of ten legume flours. Can. Inst. Food Sci. Technol. J. 1976, 9, 66–69. [Google Scholar] [CrossRef]
  24. Morr, C.V.; German, B.; Kinsella, J.E.; Regenstein, J.M.; Van Buren, J.P.; Killara, A.; Lewis, B.A.; Mangino, M.E. A Collaborative study to develop a standardized food protein solubility procedure. J. Food Sci. 1985, 50, 1715–1718. [Google Scholar] [CrossRef]
  25. Bradford, M.M. A rapid and sensitive method for the quantitation of microgram quantities of protein utilizing the principle of protein-dye binding. Anal. Biochem. 1976, 7, 248–254. [Google Scholar] [CrossRef]
  26. Rodsamran, P.; Sothornvit, R. Physicochemical and functional properties of protein concentrate from by-product of coconut processing. Food Chem. 2018, 241, 364–371. [Google Scholar] [CrossRef]
  27. Kiralan, M.; Bayrak, A.; Ozkaya, M.T. Oxidation stability of virgin olive oils from some important cultivars in East Mediterranean area in Turkey. J. Am. Oil Chem. Soc. 2009, 86, 247–252. [Google Scholar] [CrossRef]
  28. Liu, Z.; Li, Y.; Cui, F.; Ping, L.; Song, J.; Ravee, Y.; Jin, L.; Xue, Y.; Xu, J.; Li, G.; et al. Production of octenyl succinic anhydride-modified waxy corn starch and its characterization. J. Agric. Food Chem. 2008, 56, 11499–11506. [Google Scholar] [CrossRef]
  29. Sun-Waterhouse, D.; Waterhouse, G.I.N. Spray-drying of green or gold kiwifruit juice–milk mixtures; novel formulations and processes to retain natural fruit colour and antioxidants. Food Bioprocess Technol. 2015, 8, 191–207. [Google Scholar] [CrossRef]
  30. AOCS. A.O.C.S. Official Methods and Recommended Practices of the AOCS; AOCS Press: Champaign, IL, USA, 2004. [Google Scholar]
  31. Yousif, E.-S.I.; Kishk, Y.F.M.; El-Sheshetawy, H.E.; El-Makarem, M.A. Functional and nutritional characteristics of prepared rice bran protein products. World J. Dairy Food Sci. 2016, 11, 100–108. [Google Scholar]
  32. Zhao, H.; Shen, C.; Wu, Z.; Zhang, Z.; Xu, C. Comparison of wheat, soybean, rice, and pea protein properties for effective applications in food products. J. Food Biochem. 2020, 44, e13157. [Google Scholar] [CrossRef]
  33. Shevkani, K.; Kaur, A.; Kumar, S.; Singh, N. Cowpea protein isolates: Functional properties and application in gluten-free rice muffins. LWT 2015, 63, 927–933. [Google Scholar] [CrossRef]
  34. Stone, A.K.; Karalash, A.; Tyler, R.T.; Warkentin, T.D.; Nickerson, M.T. Functional attributes of pea protein isolates prepared using different extraction methods and cultivars. Food Res. Int. 2015, 76, 31–38. [Google Scholar] [CrossRef]
  35. Wang, X.; Chen, H.; Fu, X.; Li, S.; Wei, J. A novel antioxidant and ACE inhibitory peptide from rice bran protein: Biochemical characterization and molecular docking study. LWT 2017, 75, 93–99. [Google Scholar] [CrossRef]
  36. Rani, S.; Pooja, K.; Pal, G.K. Exploration of rice protein hydrolysates and peptides with special reference to antioxidant potential: Computational derived approaches for bio-activity determination. Trends Food Sci. Technol. 2018, 80, 61–70. [Google Scholar] [CrossRef]
  37. Zhang, X.; Tang, Y.; Cheng, H.; Zhang, J.; Zhang, S. Investigating structure, biological activity, peptide composition and emulsifying properties of pea protein hydrolysates obtained by cell envelope proteinase from Lactobacillus delbrueckii subsp. bulgaricus. Int. J. Biol. Macromol. 2023, 245, 125375. [Google Scholar] [CrossRef]
  38. Singh, T.P.; Siddiqi, R.A.; Sogi, D.S. Enzymatic modification of rice bran protein: Impact on structural, antioxidant and functional properties. LWT 2021, 138, 110648. [Google Scholar] [CrossRef]
  39. Miao, M.; Li, R.; Jiang, B.; Cui, S.W.; Zhang, T.; Jin, Z. Structure and physicochemical properties of octenyl succinic esters of sugary maize soluble starch and waxy maize starch. Food Chem. 2014, 151, 154–160. [Google Scholar] [CrossRef]
  40. Ye, F.; Miao, M.; Jiang, B.; Hamaker, B.R.; Jin, Z.; Zhang, T. Characterizations of oil-in-water emulsion stabilized by different hydrophobic maize starches. Carbohydr. Polym. 2017, 166, 195–201. [Google Scholar] [CrossRef]
  41. Bhosale, R.; Singhal, R. Process optimization for the synthesis of octenyl succinyl derivative of waxy corn and amaranth starches. Carbohydr. Polym. 2006, 66, 521–527. [Google Scholar] [CrossRef]
  42. Gomes, M.H.G.; Kurozawa, L.E. Improvement of the functional and antioxidant properties of rice protein by enzymatic hydrolysis for the microencapsulation of linseed oil. J. Food Eng. 2020, 267, 109761. [Google Scholar] [CrossRef]
  43. Wang, X.; Chen, Y.; McClements, D.J.; Meng, C.; Zhang, M.; Chen, H.; Deng, Q. Recent advances in understanding the interfacial activity of antioxidants in association colloids in bulk oil. Adv. Colloid Interface Sci. 2024, 325, 103117. [Google Scholar] [CrossRef]
  44. Da Silva Moura, M.; da Costa, B.d.S.G.; Giaconia, M.A.; da Andrade, R.R.; Braga, A.R.C.; Braga, M.B. Jaboticaba powders production by freeze-drying: Influence of octenyl succinic anhydride-modified starch concentrations over anthocyanins and physical properties. J. Food Process Eng. 2023, 46, e14256. [Google Scholar] [CrossRef]
  45. Ito, V.C.; Schnitzler, E.; Demiate, I.M.; Eusébio, M.E.S.; Lacerda, L.G.; Castro, R.A.E. Physicochemical, thermal, crystallographic, and morphological properties of biodynamic black rice starch, and of residual fractions from aqueous extraction. Starch-Stärke 2018, 70, 1700348. [Google Scholar] [CrossRef]
  46. Lao, Y.; Ye, Q.; Wang, Y.; Vongsvivut, J.; Selomulya, C. Quantifying the effects of pre-roasting on structural and functional properties of yellow pea proteins. Food Res. Int. 2023, 172, 113180. [Google Scholar] [CrossRef] [PubMed]
  47. Merino, D.; Paul, U.C.; Athanassiou, A. Blending of polysaccharide-based carrot pomace with vegetable proteins for biocomposites with optimized performance for food packaging applications. Food Hydrocoll. 2024, 152, 109903. [Google Scholar] [CrossRef]
  48. Elzey, B.; Pollard, D.; Fakayode, S.O. Determination of adulterated neem and flaxseed oil compositions by FTIR spectroscopy and multivariate regression analysis. Food Control 2016, 68, 303–309. [Google Scholar] [CrossRef]
  49. Arpi, N.; Satriana; Mustapha, W.A.W.; Syamsuddin, Y.; Putra, T.W.; Supardan, M.D. Effect of cooking pre-treatment on the properties of dried avocado flesh and its oil extract. S. Afr. J. Chem. Eng. 2023, 43, 1–8. [Google Scholar] [CrossRef]
  50. Belwal, T.; Huang, H.; Li, L.; Duan, Z.; Zhang, X.; Aalim, H.; Luo, Z. Optimization model for ultrasonic-assisted and scale-up extraction of Anthocyanins from Pyrus communis ‘Starkrimson’ fruit peel. Food Chem. 2019, 297, 124993. [Google Scholar] [CrossRef]
Figure 1. Schematic illustration of the steps carried out to produce AO-FO (25–75%, w/w) blend powders.
Processes 12 02230 g001
Figure 2. Apparent viscosity as a function of shear rate for emulsions E1, E2, E3, and E4.
Processes 12 02230 g002
Figure 3. Droplet size distribution of emulsions E1, E2, E3, and E4.
Processes 12 02230 g003
Figure 4. Photomicrographs of the emulsions at 40× amplification: (A) emulsion E1; (B) emulsion E2; (C) emulsion E3; and (D) emulsion E4.
Processes 12 02230 g004
Figure 7. Oxidation induction time (OIT) of flaxseed oil (FO), flaxseed and avocado oil blend (FO + AO (75%:25%, w/w)), and powders from formulations E1, E2, E3, and E4. a–e Different letters mean statistically significant differences (p < 0.05).
Processes 12 02230 g007
Figure 8. FTIR spectra of powders from formulations E1, E2, E3, and E4.
Processes 12 02230 g008
Table 1. Characterization of rice (RPC) and pea (PPC) protein concentrate: emulsifying activity index (EAI); emulsifier stability (ES); antioxidant capacity (AC); solubility (S); water retention capacity (WRC).
AnalysisRPCPPC
EAI (m2/g)2.84 a ± 0.052.94 a ± 0.07
ES (min)43.33 b ± 2.8076.95 a ± 8.93
AC (%)30.62 a ± 0.8229.88 a ± 0.89
S (%) pH = 3.52.09 b ± 0.1012.66 a ± 0.27
S (%) pH = 5.01.83 b ± 0.028.75 a ± 0.08
S (%) pH = 7.01.94 b ± 0.0115.87 a ± 0.14
WRC (g/g)3.72 b ± 0.234.79 a ± 0.27
a,b Different letters mean statistically significant differences (p < 0.05).
Table 2. Characterization of emulsions E1, E2, E3, and E4: pH; creaming index (ICr); droplet diameter (dp); De Brouckere mean diameter (D[4,3]); span value; consistency index (k); behavior index (n); apparent viscosity (η).
AnalysisE1E2E3E4
pH3.04 d ± 0.024.24 c ± 0.004.74 b ± 0.025.15 a ± 0.01
ICr (%)0.0 ± 0.00.0 ± 0.00.0 ± 0.00.0 ± 0.0
dp (μm) 10%1.47 a ± 0.001.44 a ± 0.000.59 a ± 0.281.89 a ± 0.00
dp (μm) 50%4.04 b ± 0.133.64 c ± 0.043.71 c ± 0,009.43 a ± 0.09
dp (μm) 90%8.98 c ± 0.3210.08 c ± 0.0836.86 b ± 0.1653.06 a ± 1.60
Span 1.86 d ± 0.022.37 c ± 0.019.79 a ± 0.045.43 b ± 0.12
D[4,3] (μm) 4.71 c ± 0.144.78 c ± 0.0410.64 b ± 0.0919.36 a ± 0.45
k (Pa·sn)0.0825 a ± 0.00290.0843 a ± 0.00110.0729 b ± 0.00020.0680 b ± 0.0010
n (-)0.9780 a ± 0.00090.9747 a ± 0.00030.9749 a ± 0.00000.9733 a ± 0.0014
η (mPa·s) 100 s−175.45 a ± 2.4271.42 a,b ± 2.5465.66 b,c ± 0.2361.40 c ± 1.28
a–d Different letters mean statistically significant differences (p < 0.05).
Table 3. Powder characterization of each formulation: encapsulation efficiency (Є); moisture content (U); hygroscopicity (H); particle diameter (dp); span value; De Brouckere mean diameter (D[4,3]).
AnalysisE1E2E3E4
Є (%)60.3257.6352.2551.33
U (%)3.62 a ± 0.083.18 b ± 0.143.06 b ± 0.103.02 b ± 0.13
H (kg/kg)0.0934 a ± 0.00150.0921 a ± 0.00310.0934 a ± 0.00300.0809 b ± 0.0012
dp (μm) 10%8.11 b ± 0.098.98 a ± 0.128.60 a,b ± 0.138.97 a ± 0.28
dp (μm) 50%30.44 c ± 0.4635.74 a,b ± 0.9834.97 b ± 0.9137.53 a ± 1.87
dp (μm) 90%52.16 b ± 1.7566.16 a ± 2.8862.87 a,b ± 2.4069.06 a ± 5.78
Span1.45 b ± 0.041.60 a ± 0.031.55 a,b ± 0.021.60 a ± 0.06
D[4,3] (μm)30.42 b ± 0.6336.89 a ± 1.2935.52 a,b ± 1.0638.49 a ± 2.57
a–c Different letters mean statistically significant differences (p < 0.05).
Disclaimer/Publisher’s Note: The statements, opinions and data contained in all publications are solely those of the individual author(s) and contributor(s) and not of MDPI and/or the editor(s). MDPI and/or the editor(s) disclaim responsibility for any injury to people or property resulting from any ideas, methods, instructions or products referred to in the content.

