Abstract
The effects of different mild drying conditions using various drying methods [freeze drying (FD), vacuum drying at 15 kPa pressure (VD15), vacuum drying at 1 kPa pressure (VD1), convective drying (CD), and infrared drying (IRD)] on drying kinetics, proximate composition, yield of extracted pectin, methoxyl content, sugar content, total carotenoids content, antioxidant potential, and color parameters of carrot wastes were examined experimentally. CD was the shortest drying treatment compared to the other drying processes, at 270 min, followed by IRD, VD1, FD, and VD15. The results showed a higher retention of pectin and carotenoids in CD-dried samples. Moreover, along with VD1, CD was able to maintain sucrose and antioxidant potential to a greater extent than other methods. Based on color parameters, FD and IRD had the most significant changes in relation to CIELab values, with ∆E* values close to 33 and 34 units, whereas VD15, VD1, and CD had values (without significant differences) close to 16, 18, and 21 units, respectively. Therefore, the current findings suggest that a short period of exposure of the waste to mild drying temperature conditions is essential for obtaining high-quality waste with potential for use in the food industry.
1. Introduction
In the 21st century, the valorization of food waste is one of the most important environmental and public health issues; there is also an enormous emphasis on sustainable development in food production sectors [1]. The Food and Agriculture Organization (FAO) estimates that one-third of all edible foods produced for human consumption are discarded every year, which equates to approximately 1.3 billion tons per year, raising several serious environmental and ecological concerns and leading to global warming [2]. The food waste generated costs around USD 680 billion in developed countries and USD 310 billion in developing countries [3]. Approximately 20–25% of the fruit and vegetable mass is estimated to be lost during production. This might be caused by multiple factors such as low shelf life, product defects, diseases, low stability of their components under adverse environmental conditions, and bad agronomic practices [4].
In the last few years, the world’s production of carrots (Daucus carota L.) has increased significantly, since these root vegetables have been highlighted in the human diet due to their high nutritional profile, including carotene (particularly β-carotene) and dietary fiber contents. In addition, carrots are a good source of carbohydrates, minerals, and phenolic compounds [5,6]. Moreover, these vegetables are recognized for their pectin content, a structural hetero-polysaccharide with high functional value as a hydrocolloid due to its excellent stability and emulsifying properties, facilitating its use as a gelling agent [7]. However, a considerable quantity of carrots are discarded annually in various regions of the world due to the raw material not meeting quality standards; hence, there is considerable economic loss for producers focused on primary production. The discarded carrots also represent a relevant environmental problem [8]. Therefore, several studies have indicated the need for key technologies for the valorization of biologically active components in both edible and non-edible parts of food waste [9].
Among the key technologies, drying methods such as convective hot air, vacuum, infrared, and freeze drying have been applied to preserve carrots, with freeze-drying treatment showing low tissue shrinkage and minimal loss of color, flavor, and nutrients in the treated samples [10]. Therefore, freeze drying is typically recommended for materials that contain heat-sensitive compounds such as tocopherols, ascorbic acid, carotenoids, and phenols; however, freeze drying has high initial investment and processing costs and needs longer drying time compared to convective hot air drying. Additionally, convective hot air drying is associated with simplicity of operation [11].
The novelty of the use of different drying methods adjusted to mild operating conditions such as temperature, vacuum pressure, air velocity, etc., is based on information on the physicochemical characteristics, nutritional value, and organoleptic properties that can be recovered from food waste, in particular, carrot waste. This information, in turn, could be used for the preparation of different food products or certain recovered components could served as functional ingredients.
Therefore, the aim of the present work was to determine the effects of different drying technologies, namely (freeze drying (FD), vacuum drying at 15 kPa pressure (VD15), vacuum drying at 1 kPa pressure (VD1), convective drying (CD), and infrared drying (IRD)) adjusted to mild drying temperature conditions, on drying kinetics, color, and some chemical properties such as proximate composition, pectin content, sugar content, carotenoids content, and antioxidant capacity of carrot (D. carota) waste, and to identify the most appropriate drying method for these discards in terms of valorization for the food industry.
2. Materials and Methods
2.1. Preparation of Raw Materials and Drying Processes
Carrot (D. carota) waste, including discarded outsized, undersized, and irregularly shaped fresh carrots, as well as rejected tops and tips, was kindly donated by carrot growers in La Serena (Region de Coquimbo, Chile). Fresh waste material was selected, washed, and grated manually to construct the drying curves. A total of 30 g of grated carrots were placed in 14 × 8 cm baskets, forming a 0.4 cm thick layer of material. The sample weights were monitored at specified time intervals for each drying method using a digital balance (SP402, Ohaus, New Jersey, USA). The experiments continued until equilibrium was reached, indicated by a stable sample weight. Each drying experiment was carried out in triplicate at a temperature of 40 °C (except FD). Process conditions for each drying method are detailed in Table 1:

Table 1.
Drying methods, conditions and time, as well as the dryers used in the study.
2.2. Proximate Composition Analysis and Water Activity Measurement
Proximate composition was used for chemical characterization of carrot waste based in moisture, fat, ash, crude protein and crude fiber contents, following the guidelines described by AOAC (Association of Official Analytical Chemists) [12] methodologies. Water activity was also determined for both fresh and dried carrot waste. All measurements were conducted in triplicate.
2.3. Extraction and Characterization of Pectin from Carrot Waste
Pectin extraction was carried out following an acid hydrolysis protocol as described by Jafari et al. [7], with minor modifications. Pectin was extracted from the five carrot waste treatments. Briefly, milled samples were taken and mixed with 2 N HCl at pH 2.5, in a ratio of 1:3 (carrot:solution, w/v). Subsequently, acid hydrolysis was carried out by heating, and later, the solution was stirred on a heating plate (Dragon Lab model MS-H280-Pro, Beijing, China) at 50 °C for 3 h. Then, the samples were filtered using a metal strainer, and the filtrate was centrifuged (Eppendorf 5810 R, Hamburg, Germany) at 4000 rpm for 20 min at 5 °C. The supernatant was mixed with ethanol 1:1 (supernatant:ethanol, v/v) and the precipitated pectin was re-covered and it was brought to freezing conditions at −20 °C for 24 h. After this time, it was again centrifuged at 4000 rpm for 20 min at 5 °C, where the solid was recovered. The obtained pectin was dried in a freeze dryer (Virtis, Benchtop 3L model, NY, USA), and it was stored to determine the yield and the methoxyl content.
The pectin yield was calculated from Equation (1) according to Qiu et al. [13]. Pectin was kept in a hermetically sealed tube, and kept at room temperature, protected from light, moisture and heat.
The determination of the methoxyl group content of commercial pectin and pectin from carrot waste was carried out using the methodology of Biltekin et al. [14], with modifications. 0.5 g of pectin (Sigma-Aldrich, St. Louis, MO, USA) or pectin from carrot waste was weighed and 100 mL of distilled water was added, and then, 25 mL of 0.1 N NaOH was added, and the solution was stirred. Later, the solution was left at room temperature for 30 min. After this time, 25 mL of 0.25 N HCl was added, and the mixture was titrated with 0.1 N NaOH until reaching a pH of 7.5. The methoxyl content was calculated by Equation (2), and expressed as % methoxyl.
where 3.1 represents the molecular weight of the methoxyl group (31 g/mol) normalized.
2.4. Sugar Content
Sugars (glucose, fructose, and sucrose) were extracted according to the protocol described by Djendoubi et al. [15], with some modifications. Specifically, 2 g of dried carrot waste and 8 g of fresh carrot waste were dissolved in 80% methanol (HPLC grade) and mixed for 30 min in an orbital shaker (Boeco, OS 20, Hamburg, Germany) at 200 rpm. The extracts were centrifuged for 3 min and the supernatants were filtered using a 0.45 µm membrane filter. Thus, sugar analysis was carried out by HPLC (Perkin-Elmer, FlexarLC model, Boston, MA, USA) with a refractive index detector (RID), and it includes a Flexar binary LC pump, a Flexar LC autosampler and a furnace Flexar column. Sugars were separated using a Superosil ™ LC-NH2 column, 5 µm particle sizes (25 cm × 4.6 mm) at 25 °C. The mobile phase was composed of acetonitrile:water (82.5:17.5). The data were processed using the Totalchrom®, 6.2.1 software. Quantifications were carried out using calibration curves prepared for glucose, fructose and sucrose, and their contents were expressed as mg/g dry matter (d.m.).
2.5. Total Carotenoids Contents and Antioxidant Potential of Carrot Waste
2.5.1. Total Carotenoid Content (TCC)
TCC was determined using the methodology reported by Saleh et al. [16], with modifications. Concisely, dried carrot discards (3 g) were extracted with 75 mL of a solvent mixture composed of hexane/acetone/ethanol (2:1:1, v/v) at room temperature for 1 h. The extracts were then filtered, and the filtrate volume was adjusted to 100 mL using the same solvent mixture. The diluted extracts were transferred to a separating funnel, where 25 mL of distilled water was added. The mixture was left to separate, and the absorbance (A) of the organic layer was measured at 470 nm. Hence, TCC was calculated according to Equation (3), and TCC results were expressed as mg/100 g d.m.
where v is total extract volume (mL), A1% = 2600 (molar extinction coefficient of β-carotene) and w is sample weight (g).
2.5.2. Preparation of Extracts for Antioxidant Potential Measurement
The preparation of extracts was carried out using the method of Bochnak & Świeca [17], with some modifications. 2 g of dried carrot waste and 8 g of fresh carrot waste were mixed with 10 mL of 80% methanol in an orbital shaker (BOECO, OS-20, Hamburg, Germany) for 30 min at 200 rpm (at room temperature). The samples were centrifuged (Eppendorf, 5804 R, Germany) at 5000 rpm for 15 min and the supernatants were filtered (Whatman filter paper grade No1, size 125 mm) in 50 mL glass round-bottom flask kept in the dark. After centrifugation, the pellets were extracted with 10 mL of 80% methanol, and the previously steps were repeated under the same conditions. A final extraction with 10 mL of 80% acetone was carried out and the flasks were evaporated until dryness in a rotary evaporator (Büchi, RE-210, Flawil, Switzerland). Each sample was reconstituted in methanol:formic acid (99:1, v/v), and later, transferred to a 5 mL volumetric flask. The different extract solutions were stored at −80 °C until use.
2.5.3. 2,2′-Diphenyl-2-Picrylhydrazyl (DPPH) Assay
The free radical scavenging capacity of carrot waste was assessed following the method outlined by Brand-Williams et al. [18]. Briefly, 100 μL of the sample was combined with 3.9 mL of a DPPH solution (2.0 mg of DPPH dissolved in 100 mL of acidified methanol). The mixture was then incubated in the dark at room temperature for 30 min to allow the reaction to occur and the absorbance was read at 515 nm. The DPPH results were expressed as µmol Trolox equivalent (T.E)/g d.m., with Trolox being used to establish the standard curve (y = −0.4688x + 0.4052; R2 = 0.9987).
2.5.4. Oxygen Radical Absorbance Capacity (ORAC) Assay
The antioxidant activity by ORAC assay was assessed following the procedure described by Zhang et al. [19] using a Multilabel plate reader (Perkin-Elmer, Victor X3, Hamburg, Germany). In a 96-well plate, 200 μL of fluorescein solution (4 µM) in 75 mM phosphate buffer (pH 4.0) was added to each well, and immediately, 40 μL of the extract solution was added, and then, the solution was incubated at 37 °C for 20 min. After incubation, 35 μL of 0.36 M 2,2′-Azobis(2-amidinopropane)dihydrochloride (AAPH) was added and the fluorescence was measured at 37 °C with excitation at 485 nm (λex) and emission at 535 nm (λem). The ORAC results were expressed as µmol T.E/g d.m., with Trolox being used to establish the standard curve (y = 0.00003x − 25.667; R2 = 0.9769).
2.6. Surface Color
The surface color of fresh and dehydrated carrot waste was determined with a colorimeter (HunterLab, MiniScan XE Plus, Reston, VA, USA). The results were expressed using the CIELab color space system (illuminant D65 and 10° observer angle). All determinations were carried out in triplicates at ambient temperature (≈22 °C). The total color difference (ΔE*) between the dried and the initial sample was calculated by Equation (4). Similarly, Chroma (C*ab) (colorfulness relative to the brightness of its surrounding) and Hue (h*ab) (attribute described by color name such as red, green, blue, etc.) was also estimated by Equation (5) and Equation (6), respectively.
where ΔL* = (L* − L0*), Δa* = (a* − a0*), Δb* = (b* − b0*), and L0*, a0*, and b0* correspond to the control values for fresh carrot waste.
2.7. Statistical Analyses
Statistical analyses were conducted using Statgraphics Centurion Version 18.1.12 (Statgraphics Technologies, Inc., The Plains, VA, USA). All experimental values were measured in triplicate, and the results expressed as the average ± standard deviation. Analysis of Variance (ANOVA) was performed to examine differences among group means. In addition, Duncan’s Multiple Range Test (DMRT) was used as a post hoc test to identify specific differences between pairs of means (p < 0.05).
3. Results and Discussion
3.1. Exploring Drying Curves of Carrot Waste
Drying curves of carrot waste under FD, VD15, VD1, CD and IRD are illustrated in Figure 1.
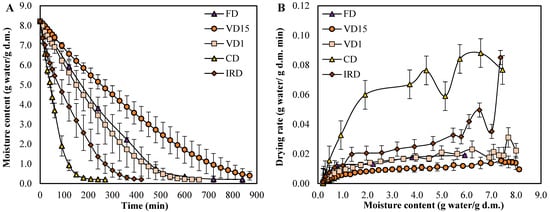
Figure 1.
(A) Variation of moisture content (g water/g d.m.) versus drying time (min) and (B) variation of drying rate (g water/g d.m. min) versus moisture content (g water/g d.m.) of carrot wastes undergoing different drying methods. Values represent the means of triplicate analyses (n = 3), with error bars indicating the standard deviation.
The variations of moisture content (g water/g d.m.) as a function of time measured under different drying conditions are shown in Figure 1A. It can be seen that the moisture content decreased continuously until a mean moisture value of 0.20 g water/g d.m. was reached. At this point, the curve approaches an asymptotic value, representing the equilibrium moisture content of the carrot waste. The same outcomes have been observed across a wide range of studies on carrot drying [16,20,21,22,23,24]. Likewise, the drying time was found to vary significantly depending on the drying method and conditions used. For instance, the CD process resulted in the shortest drying time (270 min), while the VD15 method led to the longest drying time (870 min). The longest drying time observed for the carrot waste under VD15 process can be associated to the high water vapor content inside the vacuum chamber, which might cause condensation in the vacuum pump heads under prolonged operation, leading to inefficient expulsion of water vapor [25]. On the other hand, the shortest drying time in the CD process can be due to the continuous circulation of hot air inside the oven, which contributes to a faster elimination of humidity, resulting in high heat/mass transport coefficients [26].
The drying rate presented in Figure 1B shows a negligible constant rate period in all curves, indicating that drying mainly occurs during the falling rate period. This means that diffusion is the main mechanism involved in the drying of carrot waste [27]. Nonetheless, in the case of VD15 and VD1, this period it is not only controlled by moisture diffusion but it can also involve surface diffusion, capillary action, and other mechanisms driven by vacuum pressure [28]. Our results are in agreement with other authors, who observed that drying of carrot or black carrot pomace subjected to different drying methods only occurred in the falling rate period, whereas the constant rate period was not observed in any curve [16,20,21,22,23]. However, it should be noted that the slope of the curves in the falling rate period observed in our study is less prominent than those reported in the aforementioned literature. This allows us to deduce that at mild drying temperatures (40 °C), the energy available for water evaporation is reduced, which slowed down the rate of water loss during the falling rate phase. Similar findings have been reported by Kocabiyik et al. [29], who used infrared radiation at 25 °C to dry carrot slices. In the case of FD, the process transitions from sublimation (the dominant phase of primary drying) to desorption of bound water, which occurs in secondary drying phase. This change significantly reduces the rate of water removal due to the increased energy requirements and diffusion limitations [30,31].
3.2. Proximate Composition and Water Activity of Carrot Waste
The values of the proximate composition and water activity (aw) evaluated for fresh carrot waste and dried by different drying technology are presented in Table 2.
Table 2.
Proximate composition analysis and aw of carrot waste undergoing different drying methods.
The moisture content of fresh carrot waste was 89.15%, wet basis (wb), whereas the aw was 0.989. Lipids, ash, protein and crude fiber constitute 2.14%, 7.15%, 7.60% and 13.96% dry matter (d.m.), respectively. These results are in accordance with those values reported in literature [8,22,24,32,33,34,35].
As a result of the drying process, the dried carrot waste showed low moisture content and low aw values (Table 2). This reduction, ranging from 4.15% to 8.63% on a wet basis for moisture and from 0.310 to 0.426 for aw, can be attributed to water vaporization from the carrot waste. In fact, different drying mechanisms and conditions may influence on how effective water vaporizes. For example, internal transport mechanisms, such as capillary flow in the porous matrix of VD15 and VD1 samples, can add complexity to water evaporation. This may result in samples that are drier at the surface while retaining higher moisture in the central regions [28], leading to a higher overall moisture content in certain areas. FD instead was more efficient in reducing moisture content, which is difficult to achieve with other drying methods, as it allows water molecules to vaporize directly from the solid state through sublimation [31].
As a consequence, the decrease in lipid content of the dried samples could be associated with the enzymatic hydrolysis in high moisture samples (VD15 and VD1) [36], as well as oxidation reaction with unsaturated fatty acids during IR drying [37]. FD samples showed the same lipid content as in the fresh carrot waste, whereas an increase lipid content in sample under CD treatment might be due to short duration of drying process, which lead only the breakdown of cell wall, and thereby, increasing the lipid content [38]. The ash content of drying wastes was not significantly different from that of raw waste, and the content ranged from 6.13 to 7.80 g/100 g d.m., indicating that the drying treatment had little effect on the ash content of carrot waste. Regarding the protein content, fresh carrot waste contained 7.60 g/100 g d.m., significantly lower than the content in all dehydrated samples; this is probably due to destruction of protein inhibitors as a consequence of drying, whereas in the determination of crude fiber content, the samples of the CD method obtained the highest and VD1 the lowest values, which can be probably a response to heating mechanism and employed drying conditions [38].
3.3. Pectin Yield and Pectin Characterization of Carrot Waste
Pectin is a complex heteropolysaccharide found in plant cell walls. It possesses interesting functional properties, making it suitable for use as a multifunctional ingredient [7]. Figure 2 presents the pectin extraction yield and methoxyl content of the samples dehydrated by means of the five technologies.
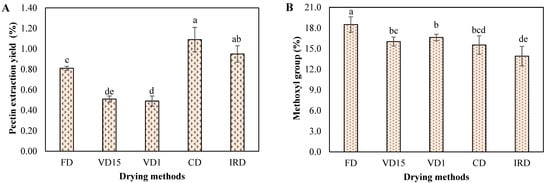
Figure 2.
(A) pectin extraction yield and (B) methoxyl content of carrot waste undergoing different drying methods. Different letters on bar indicate a statistically significant difference at a 95% confidence level (p < 0.05). Values represent the average of triplicate analyses (n = 3), with error bars indicating the standard deviation.
As shown in Figure 2A, the highest pectin yield of 1.09% was achieved by CD method, followed by IRD (0.95%) and FD (0.81%), whereas significantly lower yield of pectin was observed in VD15 (0.51%) and VD1 (0.49%) samples. Gao et al. [39] explained that the drying method has a significant influence on the variation in pectin yield from carrots. For example, rapid drying processes, such as CD and IRD, may enhance pectin extraction yields by inducing structural changes that facilitate the diffusion and solubility of pectin from the food material into the extraction solvent [14]. In the case of FD, water is removed from the frozen carrot through sublimation under vacuum, causing minimal damage to the pectin content of the plant material [40]. Conversely, the combined effects of high pressure, prolonged exposure time in the VD15 and VD1 processes, and the higher moisture content of the samples likely contributed to some degradation of the pectin fraction, ultimately leading to a reduced yield.
It is noteworthy that pectin yield from dried carrot was significantly below the range reported in literature [7,14,39,41,42]. These differences are attributed to the pectin extraction methods employed in those works, which have demonstrated greater efficiency compared to the method utilized in the present study.
The degree of methylation of the pectin samples from carrot, as influenced by different drying method, is shown in Figure 2B. The methoxyl content of pectin extracted from carrot dried by FD, VD1, VD15, CD and IRD was 18.50%, 16.63%, 16.03%, 15.53% and 13.91% respectively. This indicated that all pectin obtained from dried carrot can be categorized as low-methoxyl pectin. Therefore, they can form gels with low sugar concentrations and in the presence of divalent cations such as calcium ions [14,41,43]. These findings align with the degree of methylation values reported by other researchers [7,14].
Pectin extracted from carrot dried by FD had higher degree of methylation by comparison to pectin extracted from the same vegetable, but dried by other method. This difference was attributed to the temperature of 40 °C used during drying, which could activate the natural pectin methylesterase, leading to partial demethylation of pectin [40,43,44]. In contrast, vacuum and low-temperature conditions during FD could maintain, to some extent, the pectin’s natural methoxylation level of carrot.
3.4. Soluble Sugar Content of Carrot Waste
Quantitative determination of soluble sugars in fresh and dried carrot waste by different methods was evaluated by HPLC-RID and results are shown in Figure 3.
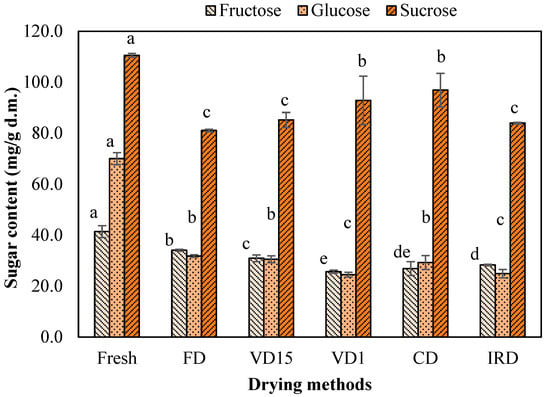
Figure 3.
Fructose, glucose, and sucrose of carrot waste undergoing different drying methods. Different letters on bar indicate a statistically significant difference at a 95% confidence level (p < 0.05). Values represent the average of triplicate analyses (n = 3), with error bars indicating the standard deviation.
Sucrose was the predominant sugar contributor in fresh carrot waste (110.52 mg/g d.m.), followed by glucose (69.98 mg/g d.m.) and fructose (41.36 mg/g d.m.). These results are consistent with the values of soluble sugars content (based on fresh weight [FW]) reported by other authors for fresh carrot [45,46]. After the application of drying, a significant decrease (p < 0.05) in sucrose, fructose, glucose was observed compared to fresh waste. This reduction is thought to be primarily caused by the progressive rise in the concentration of soluble sugars within cell tissues as drying progresses, which may decompose, transform, or engage in reactions with other substances, influenced by enzyme activities (specifically glycosidase), which may help reduce sugar levels during the drying process [35,47].
Despite the loss of soluble sugars in dried samples, a significant amount of fructose and glucose was maintained in FD-dried carrot. It was also observed that the CD process retained a higher amount of sucrose compared to the other methods, but there were no statistically significant differences (p > 0.05) with VD1-dried sample (Figure 3). Consequently, it is reasonable to conclude that drying at low temperatures, under vacuum conditions, or for a short duration may help minimize the Maillard browning reaction and its associated losses [37,48].
3.5. Total Carotenoid Contents and Antioxidant Potential of Carrot Waste
Data in Figure 4 depicted the total carotenoids content (TCC) and antioxidant potential (using the DPPH and ORAC assays) of both fresh and dried carrot wastes.
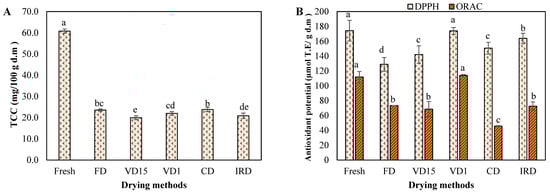
Figure 4.
(A) total carotenoids content and (B) antioxidant potential of carrot waste undergoing different drying methods. Different letters on bar indicate a statistically significant difference at a 95% confidence level (p < 0.05). Values represent the average of triplicate analyses (n = 3), with error bars indicating the standard deviation.
As shown in Figure 4A, the TCC of fresh carrot waste was 60.8 mg/100 g d.m. (or 6.60 on FW), which was within the wide range (6.0–54.8 mg/100 g FW) reported in literature [21,45,46,49]. TCC decreased after drying processes and ranged from 20.0 to 23.8 mg/100 g d.m. It is known that carotenoids are easily degraded or isomerized by various factors, including drying temperature, drying time, and moisture content [34]. Saleh et al. [16] observed that TCC started to degrade noticeably when the carrot reached a moisture content of less than 30% during drying. Moreover, the loss of turgor pressure due to the disruption of the vegetable matrix during drying, as well as exposure to light, oxygen, or metal ions, can also contribute to the degradation of these compounds [49,50]. In this study, the highest TCC retention was obtained by CD due to the short drying time, followed by FD under vacuum conditions and lower temperatures. In fact, there was no significant difference between the TCC of samples dried by CD and FD (p > 0.05). Although IRD also offer rapid drying, it significantly impacts on TCC from carrot, since exposure to radiant light can trigger the isomerization and degradation of carotenoids, resulting in the formation of reactive oxygen species (ROS). These ROS can damage carotenoid molecules, compromising their stability and reducing their concentration [2]. Likewise, VD15 samples had the lowest TCC probably due to longer effective drying time of the product, which may have intensified degradative reactions such as β-carotene isomerization in carrots [16]. While both VD15 and VD1 were set at the same drying temperature (40 °C), VD1-dried samples retained higher TCC compared to VD15, demonstrating that vacuum pressure is also a factor affecting carotenoids in carrots.
On the other hand, the antioxidant potential was assessed using 2,2′-diphenyl-2-picryl-hydrazyl (DPPH) and Oxygen Radical Absorbance Capacity (ORAC) assays, which are established assays in food research. As indicated in Figure 4B, DPPH radical scavenging capabilities decreased in general when the samples were subjected to various drying conditions and its value was found to be 174.3 μmol TE/g d.m in fresh carrots and between 128.9 and 173.9 μmol TE/g d.m in dried carrot samples. The values were consistent with a previous study conducted on the fresh carrot and dried by radio frequency-assisted hot air drying, hot air drying and freeze drying [23], with reported values of 184.45 μmol TE/g d.w in fresh carrot and between 102.32 μmol TE/g d.w and 130.24 μmol TE/g d.w in dried samples. Likewise, Keser et al. [6] reported equivalent values of 5.44 mM Trolox/g in fresh carrots and between 2.55 and 3.85 mM Trolox/g in samples dried by microwave at different power levels.
Based on the ORAC assay (Figure 4B), the fresh waste exhibited a value of 111.8 μmol TE/g d.m. This value falls within the range reported in literature. Yusuf et al. [51] determined the antioxidant activity of 12 colored carrot varieties using ORAC assay and reported a wide range of values, from 25.2 to 170.6 μmol TE/g d.m. Likewise, Singh et al. [52] reported values on fresh weight between 2.3 and 12.4 μmol TE/g for 5 carrot cultivars, which are equivalents to our results.
Regardless of the measurement assay, the potential antioxidant of fresh carrot waste was stronger than that of dried waste, but there was no significant difference (p > 0.05) with VD1-dried sample in both assays. This could be due to the fact that the vacuum pressure at 1 kPa used in VD1 restricted the respiration of plant tissues by the absence of oxygen, which contributed to the reduction of oxidative degradation of antioxidant-active compounds [53]. Instead, higher oxygen concentrations and extended drying periods in VD15 may accelerate the breakdown of such compounds. However, the lowest DPPH and ORAC values were noted in the FD- and CD-dried samples respectively, with reductions of 26.05% and 59.12% compared to the fresh samples. The difference between the results of antioxidant capacity of the two assays may be due to the complex system formed by numerous antioxidant compounds, which produces varying responses depending on the assay used. This variation arises because the radical quenching capability differs for each assay [48]. Nonetheless, this study did not conclusively determine the associated antioxidant compounds, warranting further investigation.
3.6. Surface Color of Carrot Waste
The change in vegetable color during drying results from a combination of thermal effects, isomerization, oxidation, and enzymatic browning. In the case of carrots, this change is closely linked to their carotenoid content [54]. In this study, the changes in appearance of carrot waste after drying by different methods are shown in Table 3.
Table 3.
Color parameters of carrot waste undergoing different drying methods.
The CIELab values for fresh carrot waste were 49.10, 37.68, 48.63 units, for L*, a* and b* respectively, and these values specify the characteristic orange color of fresh carrots. These values are consistent with literature data [6,20,21,23].
After the drying processes, the L* parameter of the dehydrated samples increased considerably compared to the fresh sample (p ≤ 0.05), with 73.57, 61.62, 62.96, 65.98, and 70.40 units for FD, VD15, VD1, CD, and IRD treatments, respectively. These results are in accordance with Keser et al. [6], who also reported an increase in luminosity after the drying treatment of carrots. The concordance of results can be accredited to the fact that the dehydrated products have much less water and therefore the light is reflected differently [55]. All drying methods produced a decrease in a* and b* parameters in comparison to the fresh sample, indicating a decrease in redness and yellowness of the dried carrot waste. The losses in redness and yellowness of carrot can be strongly related to the decomposition of their carotenoids, flavonols, flavones, and isoflavones [22]. In particular, the IRD treatment showed the lowest a* and b* values among all samples (p < 0.05), which can be explained by the fact that exposure to radiant light exposure promotes the isomerization of carotenoids and their degradation [2]. The difference in ΔE* values of dried carrot waste was significant (p < 0.05), ranging from 15.55 to 34.39. This indicates that the drying process caused a visible color difference compared to fresh waste, as a ΔE* value greater than 3.5, according to the International Commission on Illumination (CIE), signifies a noticeable color change [56]. Among the dried samples, both IRD and FD presented the highest ΔE*. This is explained by the increase in L* and the reduction of b* and C*ab, meaning a lighter overall color and less vibrant orange. In fact, the higher h°ab and lower C*ab values in the IRD- and FD-dried samples confirmed that they turned more yellowish, while the VD15-dried carrot exhibited a more vivid orange character compared to the other dried samples. Although the VD15 sample has the lowest amount of carotenoids (Figure 4A), other pigments in carrots may have been enhanced by this drying method.
4. Conclusions
The results obtained in the present study indicate that FD-dried samples had the least impact on carrot waste, preserving a brighter color and retaining higher levels of fructose and glucose. At the same time, their degree of methylation was higher than that of the other analyzed methods, but required longer drying time. The drying time of CD was the shortest, resulting in higher retention of sucrose and carotenoids, as well as an improved yield in pectin extraction. Thus, CD stands out as the most viable drying process for carrot waste. Nonetheless, it is important to note that the VD1 treatment demonstrated better performance in terms of retaining antioxidant activity of the carrot waste. Future studies should aim to identify and quantify these antioxidant compounds to enhance the valorization of waste in food and pharmaceutical industry.
Author Contributions
Conceptualization, Validation, A.V.-G.; Writing—original draft, Writing—review & editing, P.O.-P.; Writing—review & editing, A.P.; Supervision, Validation, E.U.; Investigation, Methodology, Formal Analysis, D.C. and M.C. All authors have read and agreed to the published version of the manuscript.
Funding
Antonio Vega-Galvez acknowledges the financial support of DIDULS/ULS, through the funding N°ADI2553852.
Data Availability Statement
The datasets generated for this study are available on request to the corresponding author.
Conflicts of Interest
The authors declare that they have no known competing financial interests or personal relationships that could have appeared to influence the work reported in this paper.
References
- Alvi, T.; Asif, Z.; Khan, M.K.I. Clean label extraction of bioactive compounds from food waste through microwave-assisted extraction technique—A review. Food Biosci. 2022, 46, 101580. [Google Scholar] [CrossRef]
- Mussagy, C.U.; Oshiro, A.; Farias, F.O.; Haddad, F.F.; dos Santos, J.L.; Scarim, C.B.; Herculano, R.D.; Pessoa, A., Jr.; Santos-Ebinuma, V.C. Emerging role of bio-based solvents mixtures to increase the solubility and recovery of carotenoids from processed carrot wastes for potential skin care application. Ind. Crops Prod. 2023, 205, 117436. [Google Scholar] [CrossRef]
- Ramasamy, R.; Subramanian, P. Bioconversion of food waste to wealth-circular bioeconomy approach. In Biotechnology for Zero Waste: Emerging Waste Management Techniques; Hussain, C.M., Kadeppagari, R.K., Eds.; Wiley-VCH: Weinheim, Germany, 2022; pp. 421–438. [Google Scholar]
- Pietrangeli, R.; Cicatiello, C. Lost vegetables, lost value: Assessment of carrot downgrading and losses at a large producer organization. J. Clean. Prod. 2024, 478, 143873. [Google Scholar] [CrossRef]
- Lee, S.W.; Kim, B.K.; Han, J.A. Physical and functional properties of carrots differently cooked within the same hardness-range. LWT-Food Sci. Technol. 2018, 93, 346–353. [Google Scholar] [CrossRef]
- Keser, D.; Guclu, G.; Kelebek, H.; Keskin, M.; Soysal, Y.; Sekerli, Y.E.; Arslan, A.; Selli, S. Characterization of aroma and phenolic composition of carrot (Daucus carota ‘Nantes’) powders obtained from intermittent microwave drying using GC MS and LC–MS/MS. Food Bioprod. Process. 2020, 119, 350–359. [Google Scholar] [CrossRef]
- Jafari, F.; Khodaiyan, F.; Kiani, H.; Hosseini, S.S. Pectin from carrot pomace: Optimization of extraction and physicochemical properties. Carbohydr. Polym. 2017, 157, 1315–1322. [Google Scholar] [CrossRef] [PubMed]
- Clementz, A.; Torresi, P.A.; Molli, J.S.; Cardell, D.; Mammarella, E.; Yori, J.C. Novel method for valorization of by-products from carrot discards. LWT-Food Sci. Technol. 2019, 100, 374–380. [Google Scholar] [CrossRef]
- Rifna, E.J.; Misra, N.N.; Dwivedi, M. Recent advances in extraction technologies for recovery of bioactive compounds derived from fruit and vegetable waste peels: A review. Crit. Rev. Food Sci. Nutr. 2023, 63, 719–752. [Google Scholar] [CrossRef] [PubMed]
- Motegaonkar, S.; Shankar, A.; Tazeen, H.; Gunjal, M.; Payyanad, S. A comprehensive review on carrot (Daucus carota L.): The effect of different drying methods on nutritional properties and its processing as value-added foods. Sustain. Food Technol. 2024, 2, 667–688. [Google Scholar] [CrossRef]
- Bhatta, S.; Janezic, T.S.; Ratti, C. Freeze-drying of plant-based foods. Foods 2020, 9, 87. [Google Scholar] [CrossRef]
- AOAC (Association of Official Analytical Chemists). Official Method of Analysis; Association of Official Analytical Chemists: Washington, DC, USA, 1990; Volume 1. [Google Scholar]
- Qiu, L.P.; Zhao, G.L.; Wu, H.; Jiang, L.; Li, X.F.; Liu, J.J. Investigation of combined effects of independent variables on extraction of pectin from banana peel using response surface methodology. Carbohydr. Polym. 2010, 80, 326–331. [Google Scholar] [CrossRef]
- Biltekin, S.İ.; Demir, A.E.; Yanik, D.K.; Göğüş, F. A Novel and environmentally friendly technique for extracting pectin from black carrot pomace: Optimization of microwave-assisted high-pressure CO2/H2O and characterization of pectin. Food Bioprocess Technol. 2024, 1–14. [Google Scholar] [CrossRef]
- Djendoubi, N.; Bonazzi, C.; Boudhrioua, N.; Kechaou, N.; Courtois, F. Influence of sugar composition on water sorption isotherms and on glass transition in apricots. J. Food Eng. 2012, 111, 403–411. [Google Scholar] [CrossRef]
- Saleh, R.M.; Kulig, B.; Emiliozzi, A.; Hensel, O.; Sturm, B. Impact of critical control-point based intermittent drying on drying kinetics and quality of carrot (Daucus carota var. laguna). Therm. Sci. Eng. Prog. 2020, 20, 100682. [Google Scholar] [CrossRef]
- Bochnak, J.; Świeca, M. Potentially bioaccessible phenolics, antioxidant capacities and the colour of carrot, pumpkin and apple powders–effect of drying temperature and sample structure. Int. J. Food Sci. Technol. 2020, 55, 136–145. [Google Scholar] [CrossRef]
- Brand-Williams, W.; Cuvelier, E.; Berset, C. Use of a free radical method to evaluate antioxidant activity. LWT-Food Sci. Technol. 1995, 28, 25–30. [Google Scholar] [CrossRef]
- Zhang, L.; Li, J.; Hogan, S.; Chung, H.; Welbaum, G.E.; Zhou, K. Inhibitory effect of raspberries on starch digestive enzyme and their antioxidant properties and phenolic composition. Food Chem. 2010, 119, 592–599. [Google Scholar] [CrossRef]
- Wiktor, A.; Nowacka, M.; Dadan, M.; Rybak, K.; Lojkowski, W.; Chudoba, T.; Witrowa-Rajchert, D. The effect of pulsed electric field on drying kinetics, color, and microstructure of carrot. Dry. Technol. 2016, 34, 1286–1296. [Google Scholar] [CrossRef]
- Wang, C.; Kou, X.; Zhou, X.; Li, R.; Wang, S. Effects of layer arrangement on heating uniformity and product quality after hot air assisted radio frequency drying of carrot. Innov. Food Sci. Emerg. Technol. 2021, 69, 102667. [Google Scholar] [CrossRef]
- Elik, A. Hot air-assisted radio frequency drying of black carrot pomace: Kinetics and product quality. Innov. Food Sci. Emerg. Technol. 2021, 73, 102800. [Google Scholar] [CrossRef]
- Özbek, H.N. Radio frequency-assisted hot air drying of carrots for the production of carrot powder: Kinetics and product quality. LWT-Food Sci. Technol. 2021, 152, 112332. [Google Scholar] [CrossRef]
- Santos, N.C.; Almeida, R.L.J.; Monteiro, S.S.; Andrade, E.W.V.; Saraiva, M.M.T.; Lima, T.L.B.; Nascimento, A.P.S.; Sousa, F.M.; Carvalho, R.O.; Gregório, M.G.; et al. Potential of drying carrot using ozone pre-treatment: Mass transfer modelling and techno-functional properties. Food Bioprod. Process. 2024, 146, 124–134. [Google Scholar] [CrossRef]
- Bao, X.; Min, R.; Zhou, K.; Traffano-Schiffo, M.V.; Dong, Q.; Luo, W. Effects of vacuum drying assisted with condensation on drying characteristics and quality of apple slices. J. Food Eng. 2023, 340, 111286. [Google Scholar] [CrossRef]
- Deng, L.Z.; Yang, X.H.; Mujumdar, A.S.; Zhao, J.H.; Wang, D.; Zhang, Q.; Wang, J.; Gao, Z.J.; Xiao, H.W. Red pepper (Capsicum annuum L.) drying: Effects of different drying methods on drying kinetics, physicochemical properties, antioxidant capacity, and microstructure. Dry. Technol. 2018, 36, 893–907. [Google Scholar] [CrossRef]
- Zhao, C.C.; Ameer, K.; Eun, J.B. Effects of various drying conditions and methods on drying kinetics and retention of bioactive compounds in sliced persimmon. LWT-Food Sci. Technol. 2021, 143, 111149. [Google Scholar] [CrossRef]
- Liu, C.; Grimi, N.; Lebovka, N.; Vorobiev, E. Impacts of preliminary vacuum drying and pulsed electric field treatment on characteristics of fried potatoes. J. Food Eng. 2020, 276, 109898. [Google Scholar] [CrossRef]
- Kocabiyik, H.; Tezer, D. Drying of carrot slices using infrared radiation. Int. J. Food Sci. Technol. 2009, 44, 953–959. [Google Scholar] [CrossRef]
- Sujinda, N.; Varith, J.; Shamsudin, R.; Jaturonglumlert, S.; Chamnan, S. Development of a closed-loop control system for microwave freeze-drying of carrot slices using a dynamic microwave logic control. J. Food Eng. 2021, 302, 110559. [Google Scholar] [CrossRef]
- Silva, A.C.C.; Schmidt, F.C. Intensification of freeze-drying rate of coffee extract by vacuum freezing. Innov. Food Sci. Emerg. Technol. 2022, 78, 103022. [Google Scholar] [CrossRef]
- Sharma, K.D.; Karki, S.; Thakur, N.S.; Attri, S. Chemical composition, functional properties and processing of carrot—A review. Food Sci. Technol. 2012, 49, 22–32. [Google Scholar] [CrossRef] [PubMed]
- Al-Amin, M.; Hossain, M.S.; Iqbal, A. Effect of pre-treatments and drying methods on dehydration and rehydration characteristics of carrot. Univers. J. Food Nutr. Sci. 2015, 3, 23–28. [Google Scholar] [CrossRef]
- de Souza, A.U.; Corrêa, J.L.G.; Tanikawa, D.H.; Abrahão, F.R.; Junqueira, J.R.; Jiménez, E.C. Hybrid microwave-hot air drying of the osmotically treated carrots. LWT-Food Sci. Technol. 2022, 156, 113046. [Google Scholar] [CrossRef]
- Thakur, P.; Saini, R.; Suthar, P.; Dhiman, A.; Kumar, S. Comparative evaluation of tray and microwave drying of black carrot (Daucus carota L.): Effects on physicochemical, phytochemical and techno-functional properties. J. Indian Chem. Soc. 2024, 101, 101327. [Google Scholar] [CrossRef]
- Darfour, B.; Ofori, H.; Asare, I.K. Gamma irradiation and drying method: The effects on kola nut powder. Radiat. Phys. Chem. 2021, 185, 109489. [Google Scholar] [CrossRef]
- Mongi, R.J.; Ngoma, S.J. Effect of solar drying methods on proximate composition, sugar profile and organic acids of mango varieties in Tanzania. Appl. Food Res. 2022, 2, 100140. [Google Scholar] [CrossRef]
- Kumar, Y.; Singh, L.; Sharanagat, V.S.; Mani, S.; Kumar, S.; Kumar, A. Quality attributes of convective hot air-dried spine gourd (Momordica dioica Roxb. Ex Willd) slices. Food Chem. 2021, 347, 129041. [Google Scholar] [CrossRef] [PubMed]
- Gao, K.; Liu, B.; Wu, B.; Guo, Y.; Song, C.; Nan, S.; Dai, J.; Shen, Y.; Ma, H. A Study on the effect mechanism of pectin modification on the carrot cell wall’s texture formation under ultrasonic and infrared drying. Agriculture 2024, 14, 803. [Google Scholar] [CrossRef]
- Dranca, F.; Mironeasa, S. Hot-air drying vs. lyophilization of sugar beet flakes for efficient pectin recovery and influence of extraction conditions on pectin physicochemical properties. Int. J. Biol. Macromol. 2024, 265, 131063. [Google Scholar] [CrossRef]
- Roman-Benn, A.; Contador, C.A.; Li, M.W.; Lam, H.M.; Ah-Hen, K.; Ulloa, P.E.; Ravanal, M.C. Pectin: An overview of sources, extraction and applications in food products, biomedical, pharmaceutical and environmental issues. Food Chem. Adv. 2023, 2, 100192. [Google Scholar] [CrossRef]
- De Laet, E.; Bernaerts, T.; Ares, J.N.; De Cock, K.; Goos, P.; Van Loey, A.M. Influence of ultrasound-assisted extraction on the pectin extraction yield and structural characteristics: A case study on carrot pomace (Daucus carota). Food Bioprod. Process. 2024, 148, 309–320. [Google Scholar] [CrossRef]
- Lemmens, L.; Tibäck, E.; Svelander, C.; Smout, C.; Ahrné, L.; Langton, M.; Alminger, M.; Van Loey, A.; Hendrickx, M. Thermal pretreatments of carrot pieces using different heating techniques: Effect on quality related aspects. Innov. Food Sci. Emerg. Technol. 2009, 10, 522–529. [Google Scholar] [CrossRef]
- Imaizumi, T.; Szymanska-Chargot, M.; Pieczywek, P.M.; Chylinska, M.; Kozioł, A.; Ganczarenko, D.; Tanaka, F.; Uchino, T.; Zdunek, A. Evaluation of pectin nanostructure by atomic force microscopy in blanched carrot. LWT-Food Sci. Technol. 2017, 84, 658–667. [Google Scholar] [CrossRef]
- Aubert, C.; Bruaut, M.; Chalot, G. Spatial distribution of sugars, organic acids, vitamin C, carotenoids, tocopherols, 6-methoxymellein, polyacetylenic compounds, polyphenols and terpenes in two orange Nantes type carrots (Daucus carota L.). J. Food Compost. Anal. 2022, 108, 104421. [Google Scholar] [CrossRef]
- Tian, Z.; Dong, T.; Wang, S.; Sun, J.; Chen, H.; Zhang, N.; Wang, S. A comprehensive review on botany, chemical composition and the impacts of heat processing and dehydration on the aroma formation of fresh carrot. Food Chem. X 2024, 22, 101201. [Google Scholar] [CrossRef]
- Yang, F.; Wang, Q.; Liu, W.; Xiao, H.; Hu, J.; Duan, X.; Sun, X.; Liu, C.; Wang, H. Changes and correlation analysis of volatile flavor compounds, amino acids, and soluble sugars in durian during different drying processes. Food Chem. X 2024, 21, 101238. [Google Scholar] [CrossRef] [PubMed]
- Xue, T.T.; Ruan, K.H.; Xu, H.B.; Liu, H.B.; Tang, Z.S.; Yang, Y.G.; Duan, J.A.; Sun, X.X.; Wang, M.; Song, Z.X. Effect of different drying methods on the drying characteristics, chemical properties and antioxidant capacity of Ziziphus jujuba var. Spinosa fruit. LWT-Food Sci. Technol. 2024, 196, 115873. [Google Scholar] [CrossRef]
- Lyu, Y.; Chen, Q.; Gou, M.; Wu, X.; Bi, J. Influence of different pre-treatments on flavor quality of freeze-dried carrots mediated by carotenoids and metabolites during 120-day storage. Food Res. Int. 2023, 170, 113050. [Google Scholar] [CrossRef] [PubMed]
- Yusuf, E.H.; Wojdyło, A.; Lech, K.; Masztalerz, K.; Nowicka, P. The effect of combined drying process (OD-CD-VMD) on nutritional, phytochemical, and sensory profiles, and biological activities of colored dried carrot. LWT-Food Sci. Technol. 2023, 173, 114231. [Google Scholar] [CrossRef]
- Yusuf, E.; Tkacz, K.; Turkiewicz, I.P.; Wojdyło, A.; Nowicka, P. Analysis of chemical compounds’ content in different varieties of carrots, including qualification and quantification of sugars, organic acids, minerals, and bioactive compounds by UPLC. Eur. Food Res. Technol. 2021, 247, 3053–3062. [Google Scholar] [CrossRef]
- Singh, D.P.; Beloy, J.; McInerney, J.K.; Day, L. Impact of boron, calcium and genetic factors on vitamin C, carotenoids, phenolic acids, anthocyanins and antioxidant capacity of carrots (Daucus carota). Food Chem. 2012, 132, 1161–1170. [Google Scholar] [CrossRef] [PubMed]
- Lau, W.K.; Van Chuyen, H.; Vuong, Q.V. Physical properties, carotenoids and antioxidant capacity of carrot (Daucus carota L.) peel as influenced by different drying treatments. Int. J. Food Eng. 2018, 14, 20170042. [Google Scholar] [CrossRef]
- Wu, B.; Ma, Y.; Guo, X.; Guo, Y.; Qiu, C.; Gao, K.; Ma, H.; Pan, Z. Catalytic infrared blanching and drying of carrot slices with different thicknesses: Effects on surface dynamic crusting and quality characterization. Innov. Food Sci. Emerg. Technol. 2023, 88, 103444. [Google Scholar] [CrossRef]
- Nowacka, M.; Wedzik, M. Effect of ultrasound treatment on microstructure, colour and carotenoid content in fresh and dried carrot tissue. Appl. Acoust. 2016, 103, 163–171. [Google Scholar] [CrossRef]
- Akter, J.; Hassan, J.; Rahman, M.M.; Biswas, M.S.; Khan, H.I.; Rajib, M.M.R.; Ahmed, M.R.; Khan, N.-E.-A.; Hasan, F.A. Colour, nutritional composition and antioxidant properties of dehydrated carrot (Daucus carota var. sativus) using solar drying techniques and pretreatments. Heliyon 2024, 10, e24165. [Google Scholar] [CrossRef]
Disclaimer/Publisher’s Note: The statements, opinions and data contained in all publications are solely those of the individual author(s) and contributor(s) and not of MDPI and/or the editor(s). MDPI and/or the editor(s) disclaim responsibility for any injury to people or property resulting from any ideas, methods, instructions or products referred to in the content. |
© 2025 by the authors. Licensee MDPI, Basel, Switzerland. This article is an open access article distributed under the terms and conditions of the Creative Commons Attribution (CC BY) license (https://creativecommons.org/licenses/by/4.0/).