Article

Research on Inversion Log Evaluation Method of Special Mineral in Alkali Lake Shale Oil Reservoir—A Case Study of the Fengcheng Formation in the Mahu Sag, China

1
Faculty of Petroleum, China University of Petroleum-Beijing at Karamay, Karamay 834000, China
2
School of Geophysics, China University of Petroleum-Beijing, Beijing 102249, China
3
Research Institute of Exploration and Development, PetroChina Xinjiang Oilfield Company, Karamay 834000, China
4
Research Institute of Petroleum Exploration and Development, PetroChina, Beijing 100083, China
*
Author to whom correspondence should be addressed.
Processes 2024, 12(1), 105; https://doi.org/10.3390/pr12010105
Submission received: 20 November 2023 / Revised: 20 December 2023 / Accepted: 25 December 2023 / Published: 1 January 2024

Abstract

:
The Fengcheng Formation in the Mahu Sag of the Junggar Basin, China, is characterized by alkaline lake deposits, featuring abundant alkaline minerals. The content of alkaline minerals affects the physical properties and oil-bearing properties of the reservoir, and existing mineral inversion methods cannot calculate the content of alkaline minerals. Based on Litho Scanner Log data, we can calculate the dry weight of elements using the oxide closure model. By improving the rock volume physical model; adding trona, shortite, eitelite, and reedmergnerite to the rock volume physical model; and combining with the least squares method, the mineral content calculation was carried out, using the inversion method of combination models (Shortite Model, Eitelite Model, Reedmergnerite Model, and Trona Model) to achieve mineral inversion of alkali-bearing shale oil reservoirs. Litho Scanner Log is expensive, and its widespread application will increase exploration costs. This article scales the mineral inversion results of Litho Scanner Log into conventional log data, improves the rock volume physical model of conventional log, and uses a combination model to achieve mineral inversion of alkali-bearing shale oil reservoirs in conventional log. Compared with the results of X-ray diffraction experiments, the average absolute error of all minerals except for trona and feldspar is less than 10%, and the inversion results are consistent with the core test results. The research results of this article can provide theoretical and technical support for the log evaluation of alkali-bearing shale oil reservoirs.

1. Introduction

In the Junggar Basin of China, the Fengcheng Formation in the Mahu Sag has undergone comprehensive exploration deployment within the framework of the entire hydrocarbon system accumulation model. The initial well testing results have been promising, showcasing significant exploration potential. The Fengcheng Formation in the Mahu Sag is an alkaline lake facies deposit [1], with complex lithology and abundant development of alkaline minerals. Alkaline minerals are easily soluble, and during the process of hydrocarbon generation and acid expulsion in the source rock, alkaline minerals are prone to react with acidic fluids in the shale, forming corrosion pores, which can become a good space for storing oil and gas. During the formation process, alkaline minerals also frequently exchange fluids with fluids in the pores. The oil and gas generated by hydrocarbon source rocks can migrate with fluid exchange, promoting the filling of oil and gas [2]. Therefore, the content of alkaline minerals affects the physical and oil-bearing properties of reservoirs. However, currently, research on alkaline minerals is mainly focused on qualitative evaluation, and there has been no significant progress in quantitative evaluation research. In this study, based on the Litho Scanner Log data, according to the characteristic elements selected from different alkaline minerals, we established models of shortite, eitelite, and reedmergnerite, and the trona content was determined by employing the ratio of virgin zone resistivity to flush zone resistivity. By combining the models, the quantitative inversion of alkaline minerals was realized.
Litho Scanner Log can accurately measure the content of elements such as silicon, aluminum, calcium, iron, and sodium in the formation. Through coefficient matrices, optimization algorithms, and Schlumberger’s Elan mineral calculation methods, the formation mineral content can be quantitatively calculated [3,4,5]. However, the Fengcheng Formation in the Mahu Sag is a shale oil reservoir containing alkaline minerals, with the development of carbonate minerals, sulfate minerals, halides, borosilicate minerals, etc. [6]. The current mineral calculation model does not include alkaline minerals, so the content of alkaline minerals cannot be determined. This study takes the Fengcheng Formation in Mahu Sag as the research object; based on Litho Scanner Log data, it improves the existing mineral content calculation model; and then it combines multiple mineral combination model inversion methods to achieve mineral inversion of alkali-bearing shale oil reservoirs.

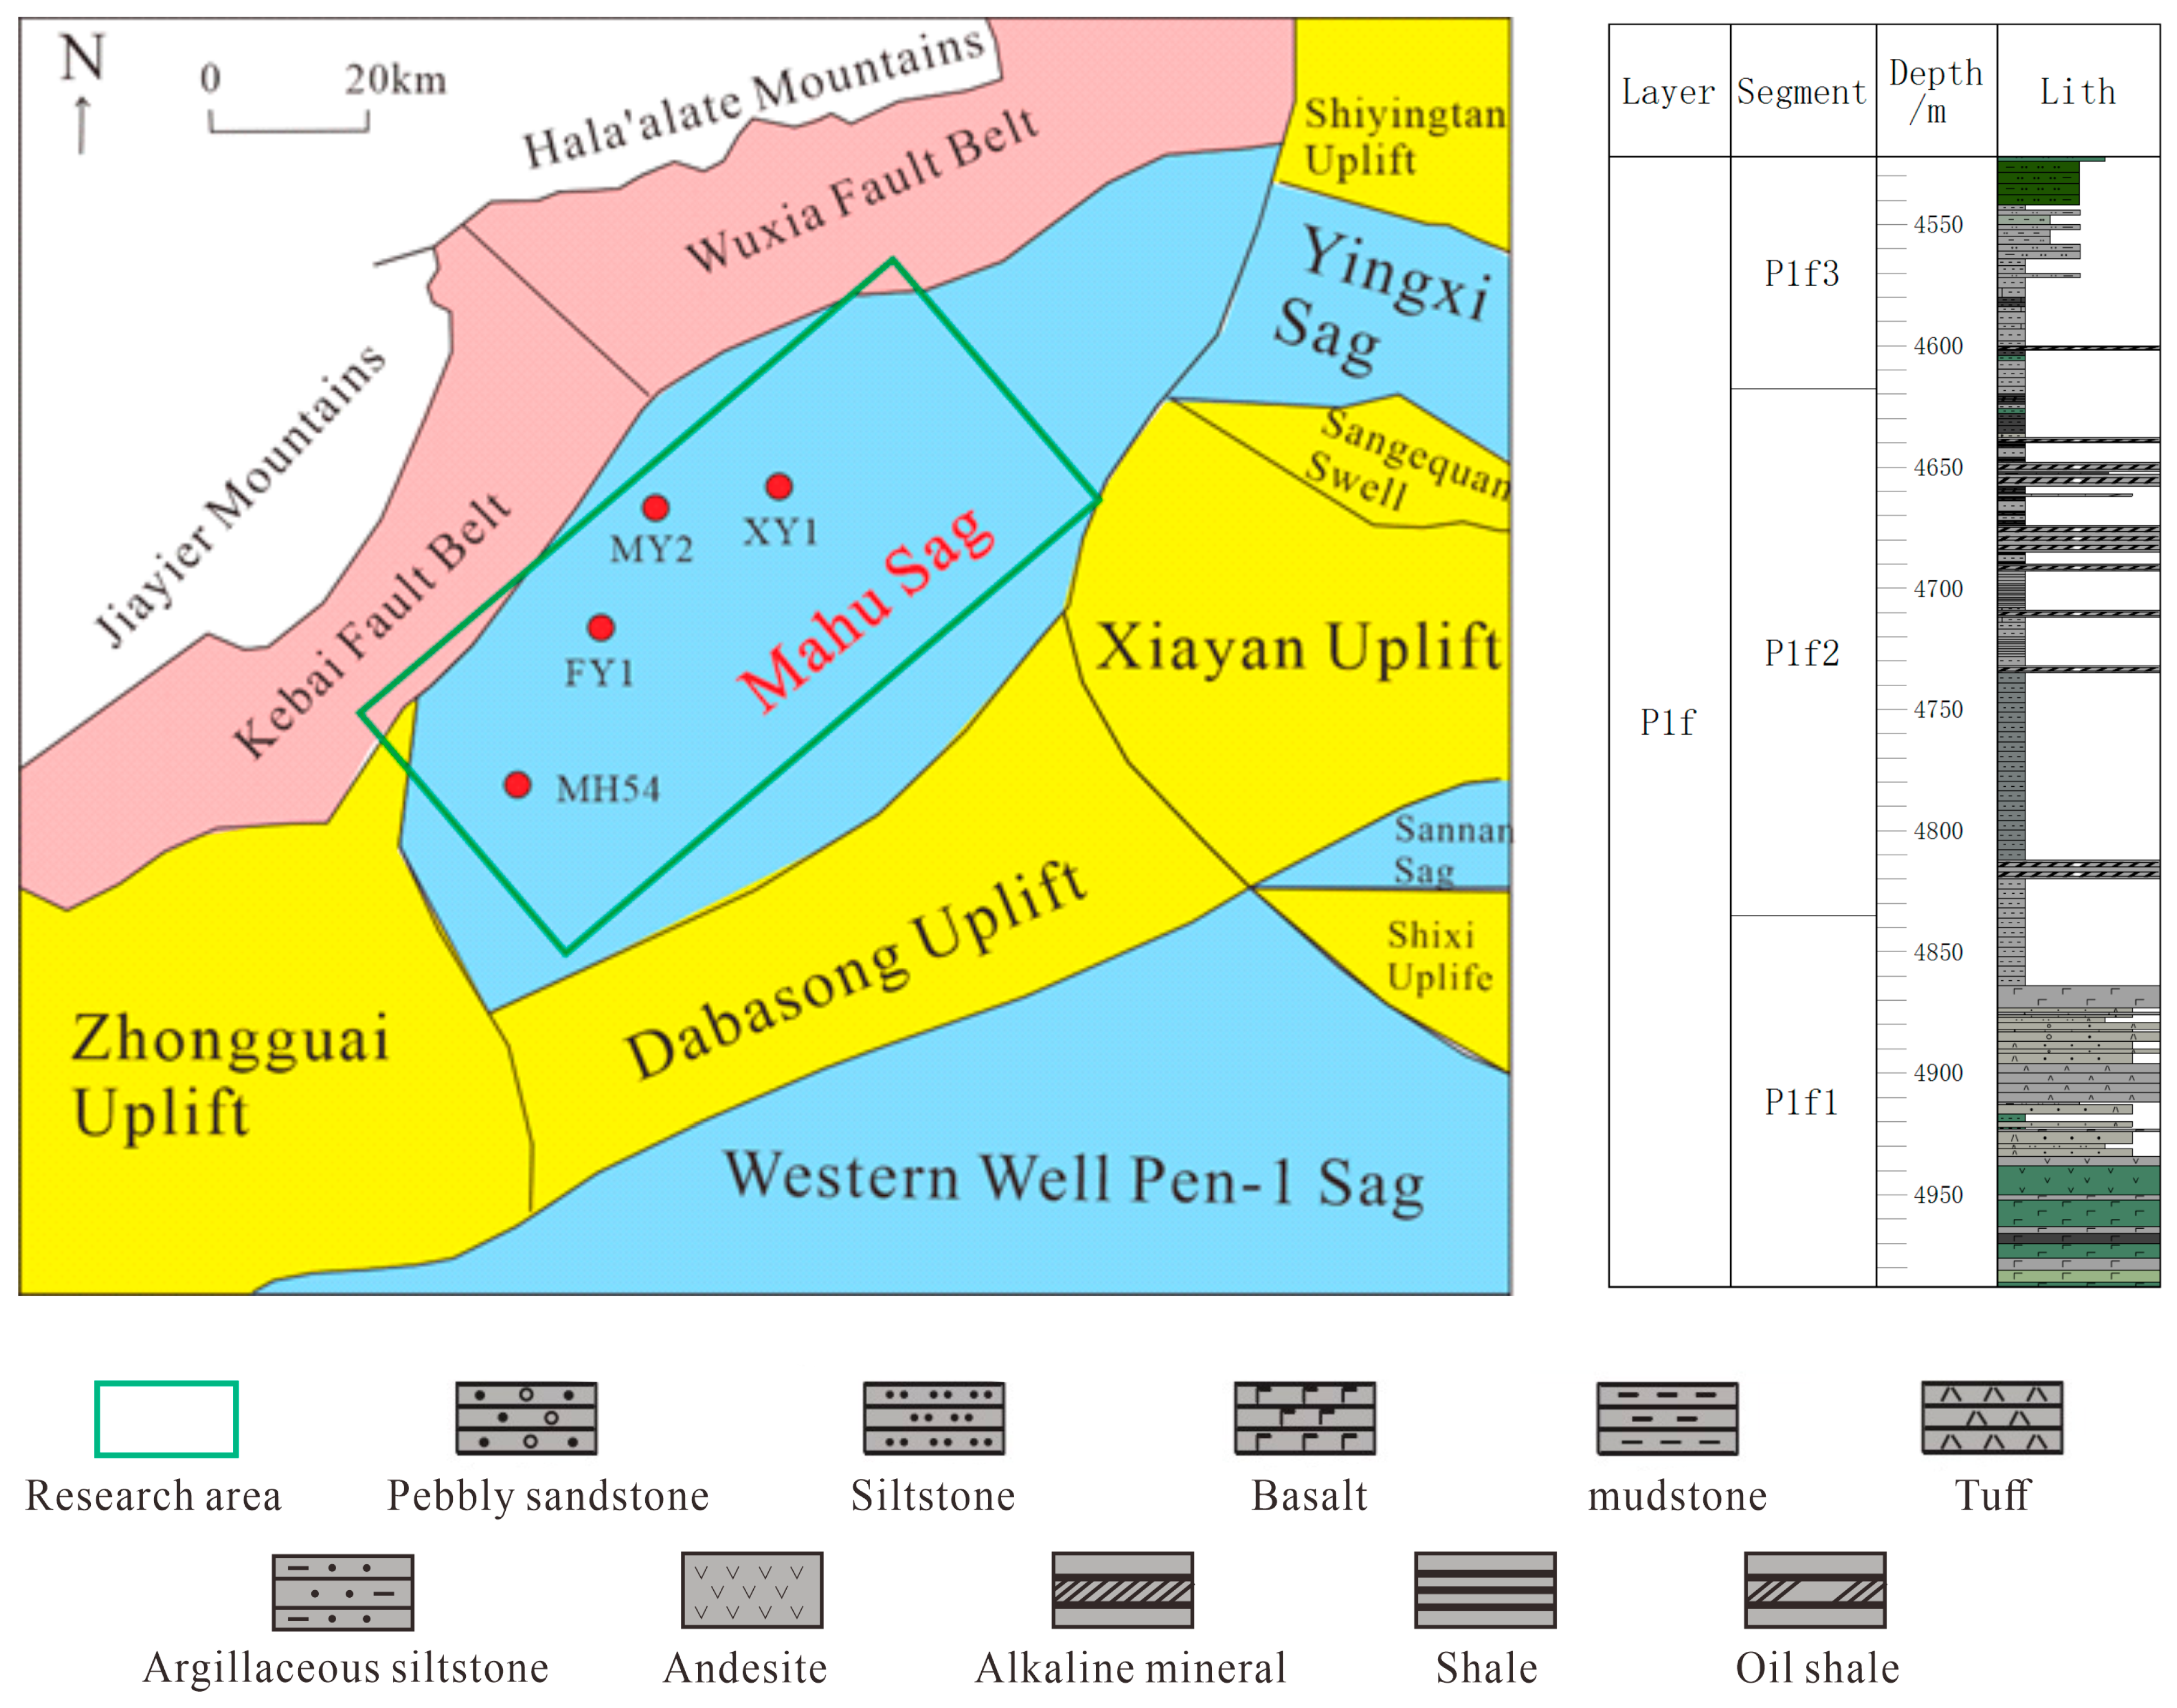
2. Geological Background

The Mahu Sag is situated in the northwestern part of the Junggar Basin, representing one of the six major hydrocarbon-rich sags in the region [7], as depicted in Figure 1. To its northwest lies the Kebai Fault Belt and the Wuxia Fault Belt, while the southeastern boundary neighbors the Xiayan Uplift and the Dabasong Uplift. Previous studies have extensively investigated various aspects of the Fengcheng Formation in the Mahu Sag, including its sedimentary, structural, reservoir, and hydrocarbon generation characteristics [8,9]. Scholars assert that the deposition period of the Fengcheng Formation was a crucial phase in the development of the foreland basin on the northwestern margin of the Junggar Basin [10], giving rise to a set of high-quality source rocks. This formation serves as a significant petroleum source in the Mahu Sag. During the deposition of the Fengcheng Formation, alternating wet and arid climates prevailed, and a pronounced evaporative environment led to a lowering of the lake level, salinization of the water body, and the development of alkaline minerals. Along the basin margins and slopes, deposition primarily occurred in marginal and shallow lake environments, while the central basin witnessed sedimentation in semi-deep-to-deep lake facies [11].
The Fengcheng Formation in the Mahu Sag exhibits complex lithology, divided into three segments from bottom to top: Feng-1(P1f1), Feng-2(P1f2), and Feng-3(P1f3). The Feng-1 segment(P1f1) is characterized by thin interbeds of mudstone and fine sandstone [12]. The Feng-2 segment(P1f2) predominantly consists of mudstone and shale, with a notable presence of abundant alkaline minerals. The Feng-3 segment(P1f3) is primarily composed of terrestrial clastic rocks and basalt. The reservoir pores in the Fengcheng Formation mainly include intergranular pores, intercrystalline pores, and microfractures. The three main pore structure types are the dissolution-pore–microfracture type, dissolution-pore–bedding-fracture type, and mesopore–bedding-fracture type. The pores in the Fengcheng Formation are small, with a diameter mainly distributed between 30 and 200 nm [13], exhibiting poor pore connectivity. The reservoir porosity ranges from 0.2% to 13.7%, and permeability varies from 0.01 mD to 6.85 mD, categorizing it as a tight, low-permeability reservoir [14].

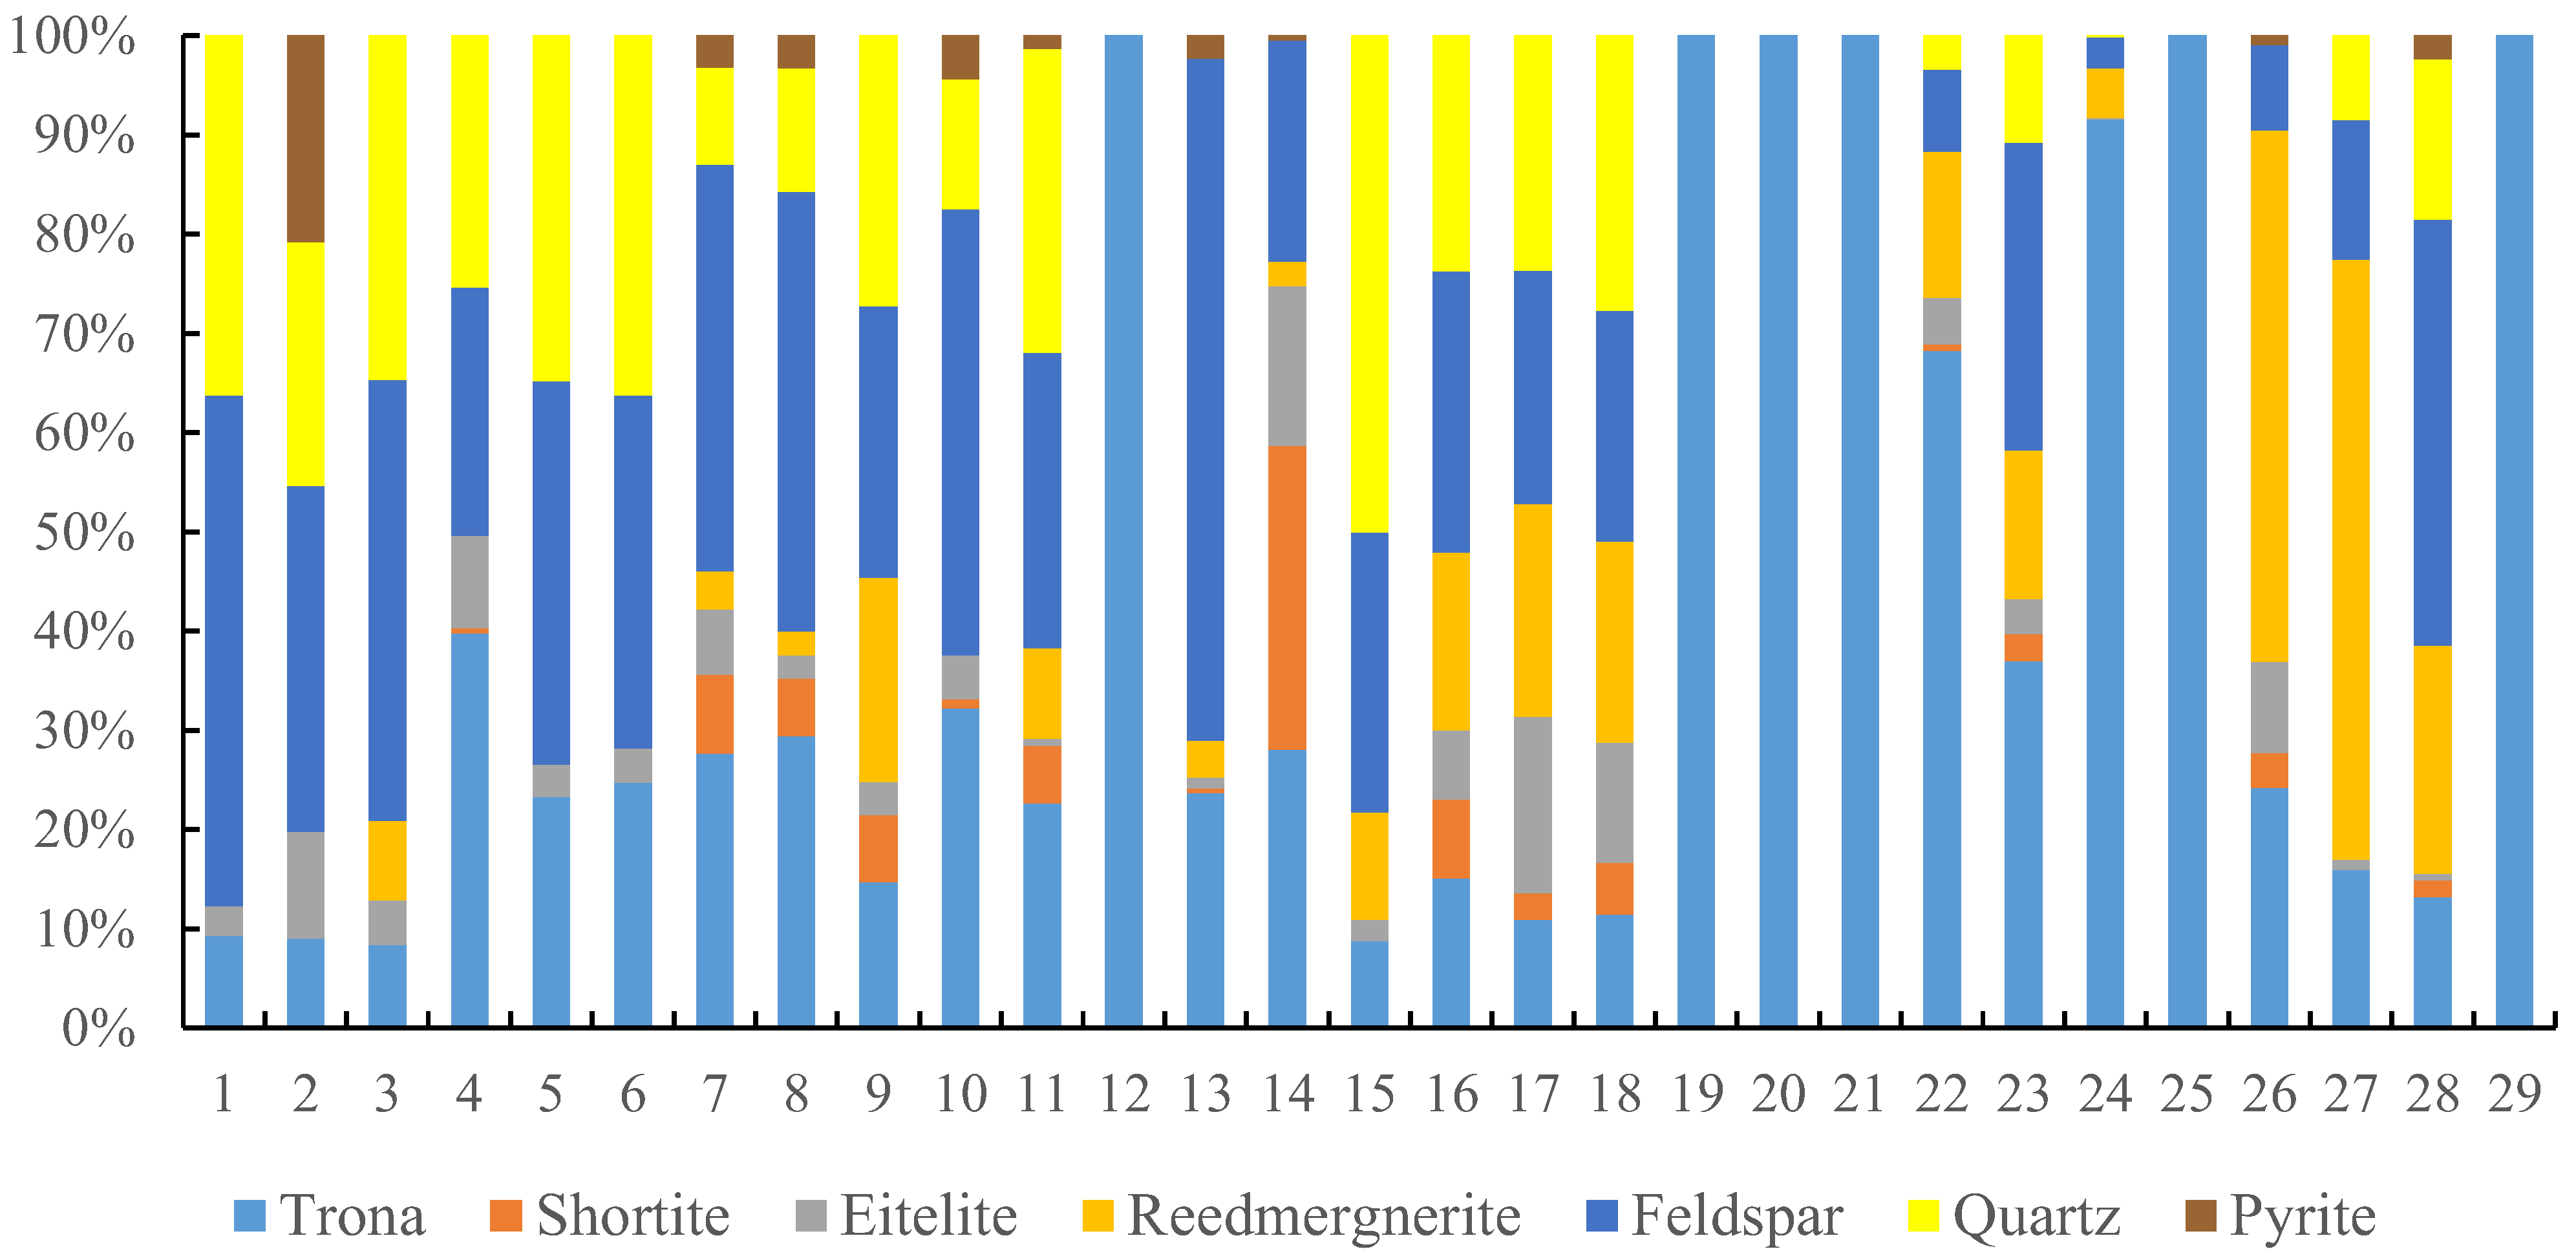
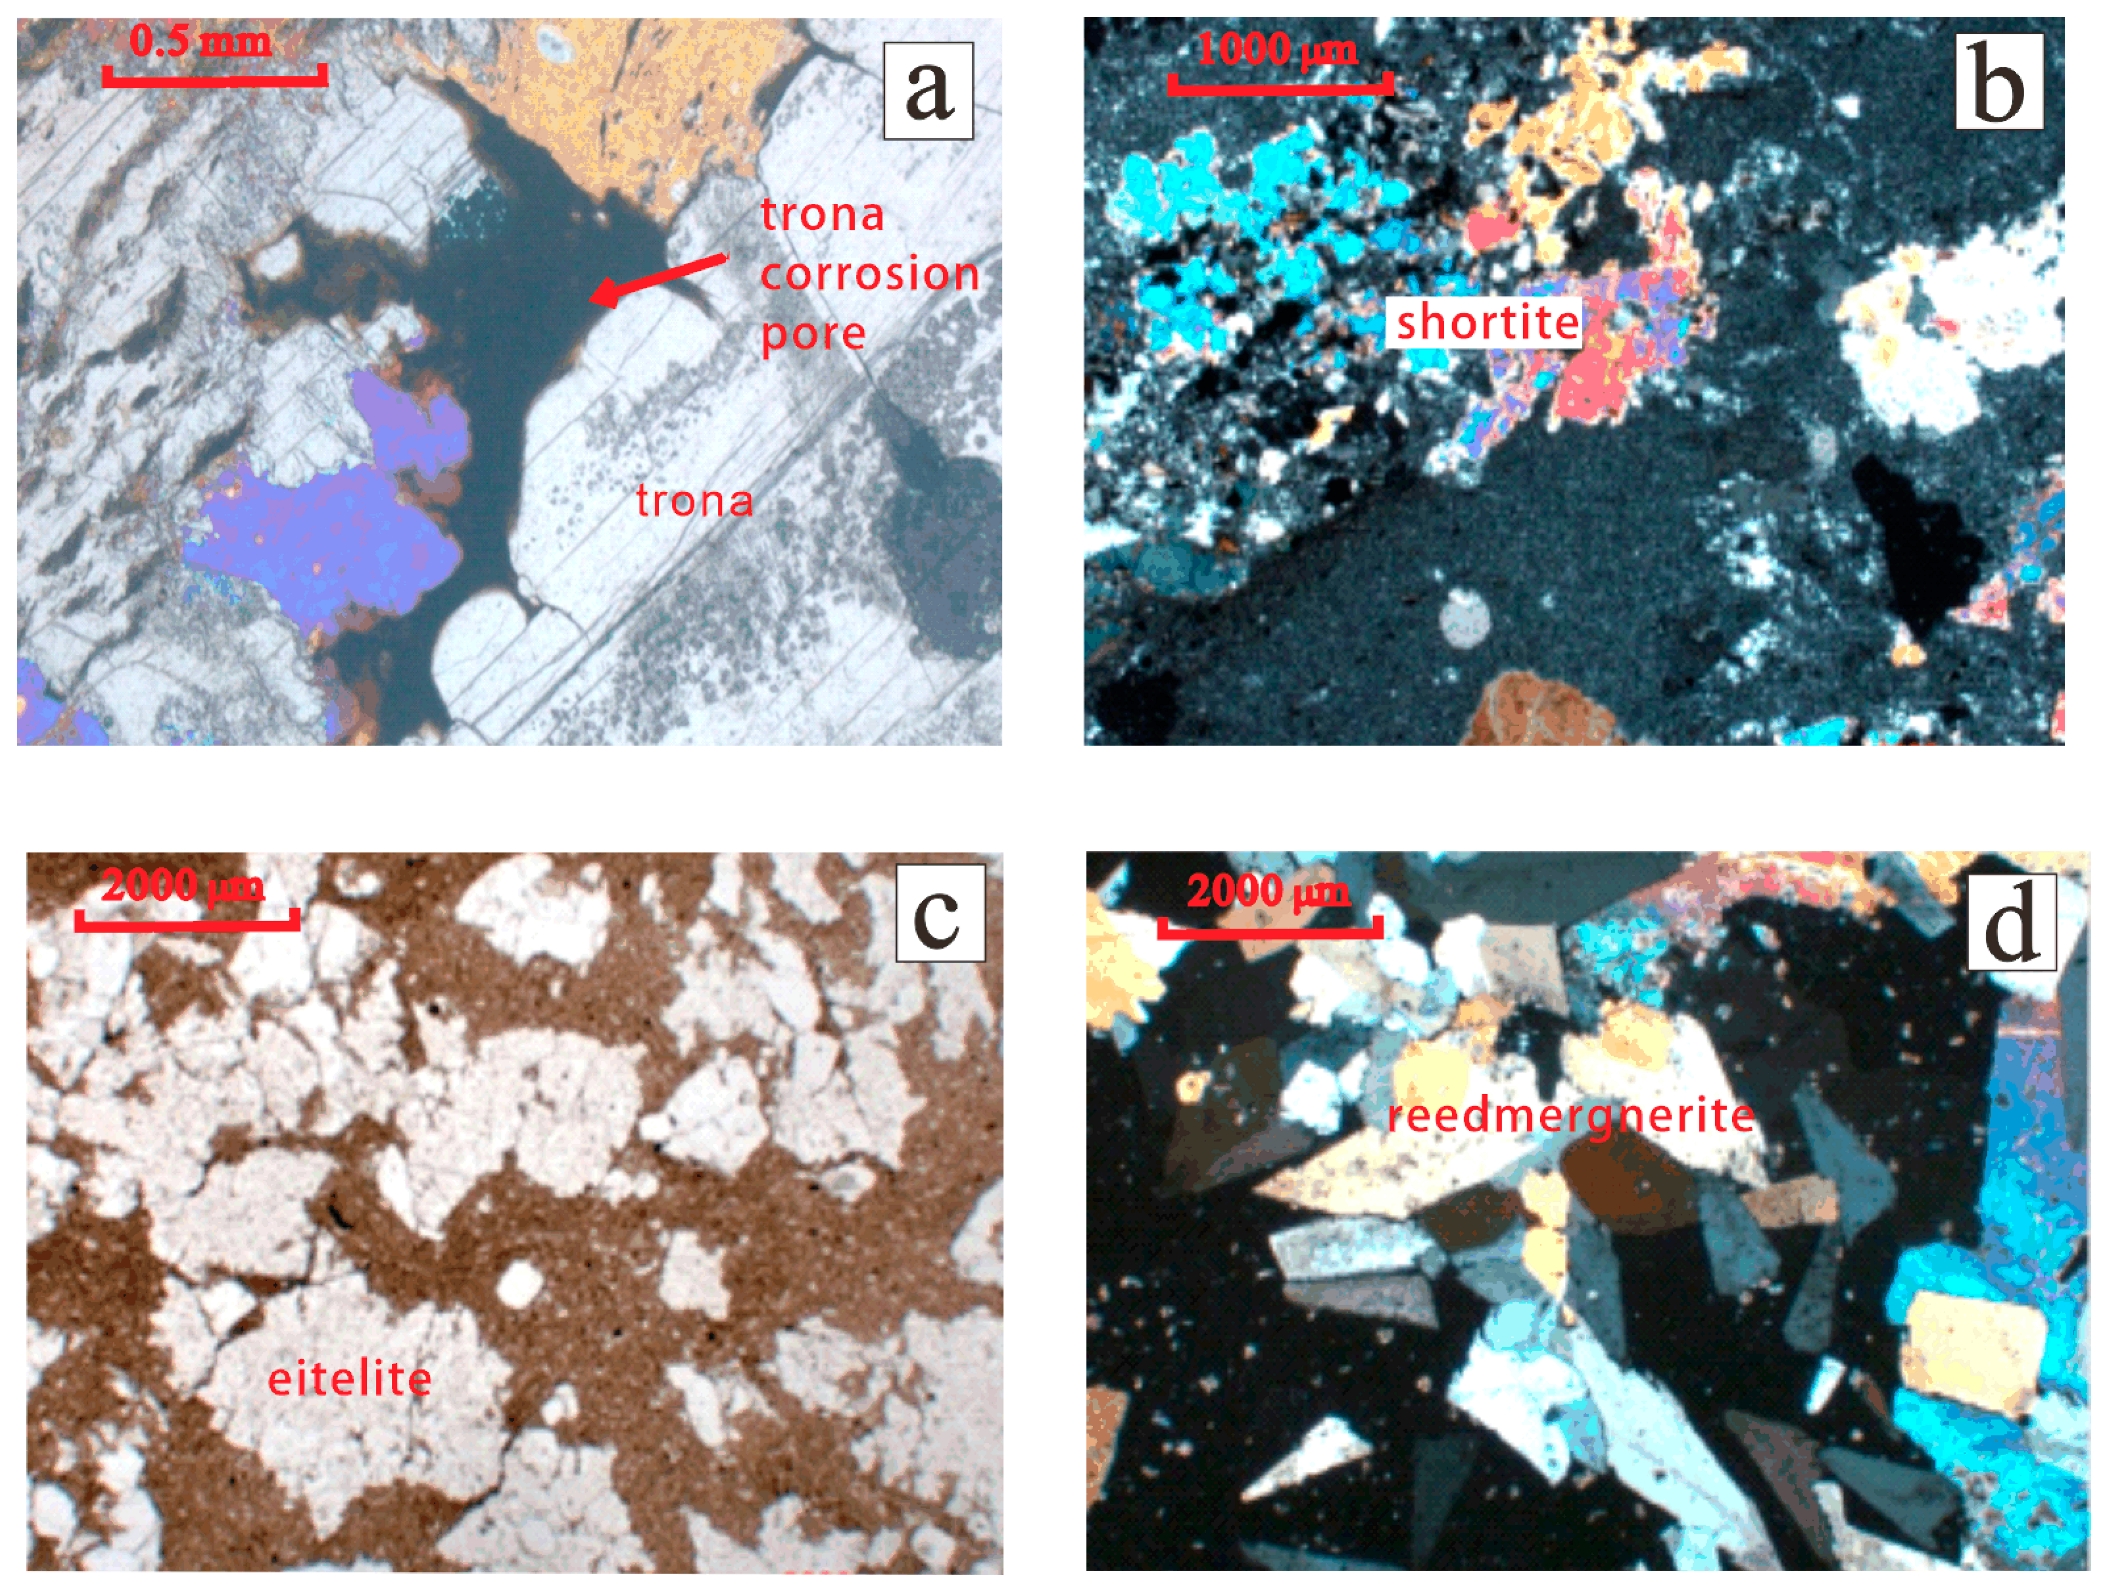
3. Main Mineral Types and Alkaline Mineral Characteristics in the Research Area

The lithology of the Fengcheng Formation in the Mahu Sag is complex, with a diverse range of mineral types and significant variations in their content. The mineral characteristics of this formation bear similarities to the Green River Formation of the Eocene Uinta Basin in the eastern part of Utah, USA [15]. This article selects 29 cores with different alkaline mineral contents for X-ray diffraction experiments to analyze their main mineral composition (Figure 2). It can be seen from the figure that the main minerals of the Fengcheng Formation are feldspar, alkaline minerals, and quartz, Among them, feldspar content is the greatest, ranging from 10% to 70%, and most of them range from 20% to 50%. This coring mainly comes from the Feng-2(P1f2) segment, so the content of alkaline minerals is relatively high, with a total number of alkaline minerals ranging from 0 to 60%. Among the alkaline minerals, the content of trona is the highest, and some cores have a trona content of 100%, which is pure trona cores; the quartz content mainly ranges from 5% to 30%; simultaneously developing a small amount of pyrite, its content is generally less than 10%.
The main alkaline minerals developed in the Fengcheng Formation of the Mahu Sag include trona, sodium bicarbonate (soda ash), eitelite, northupite, shortite, and reedmergnerite, with a small amount of gypsum and anhydrite locally developed [16,17]. This article mainly divides alkaline minerals into four categories based on their chemical composition: trona minerals, eitelite minerals, shortite minerals, and silicate borate minerals. Trona minerals mainly consist of trona (Na2CO3) and soda ash (Na5H3(CO3)4); eitelite minerals mainly include eitelite (MgNa2(CO3)2) and northupite (Na3Mg(CO3)2Cl); shortite minerals mainly include shortite (Ca2Na2(CO3)3), gaylussite (CaNa2(CO3)2·5H2O), and calcium water alkali (CaNa2(CO3)2·2H2O); and the main mineral of silicate borate is reedmergnerite (Na(BSi3O8)).
Trona minerals have low hardness and are prone to deliquescence in the air. They are highly soluble in water and react with fluids in the formation to form corrosion pores (Figure 3a); eitelite minerals are slightly soluble in water and easily soluble in acids, appearing colorless, and transparent in thin sections, often coexisting with shortite minerals [18] (Figure 3b); shortite minerals are insoluble in water and slowly dissolve in acid, exhibiting polychromism under the microscope and having a glassy luster (Figure 3c); and the main mineral of silicate borate is reedmergnerite, which is insoluble in both water and acid and has a hardness greater than that of a knife (Figure 3d).

4. Methodology

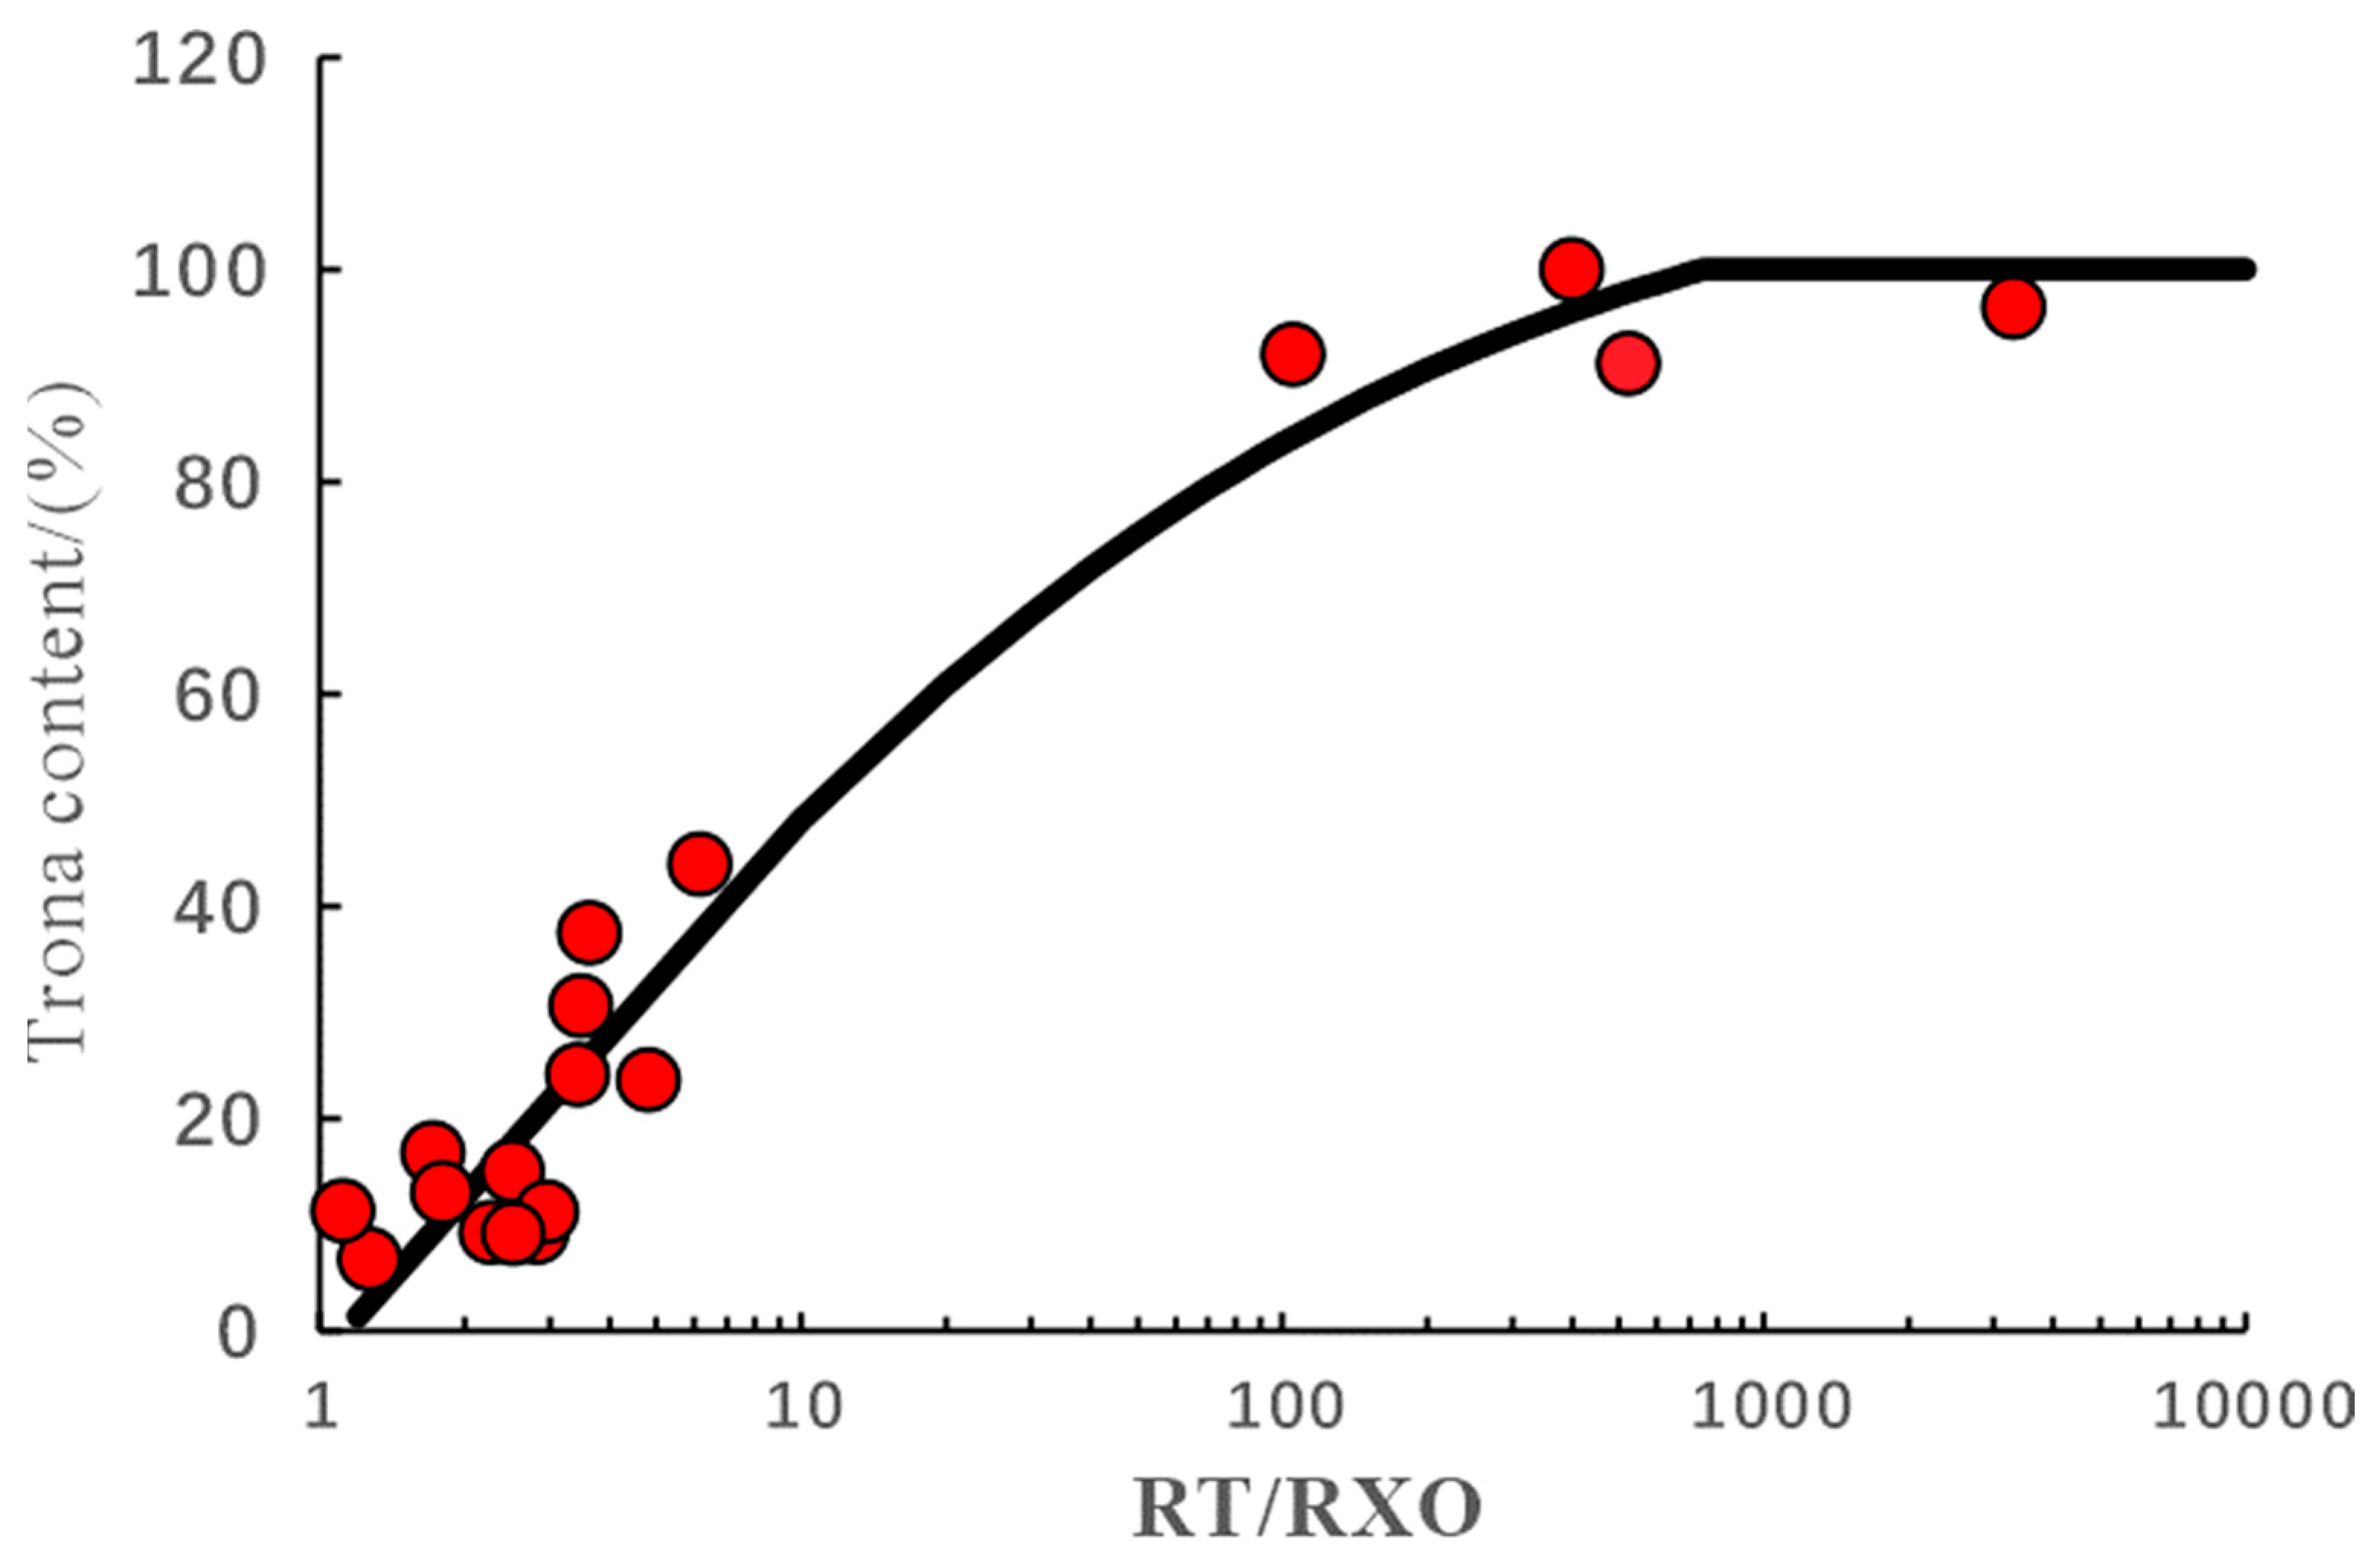
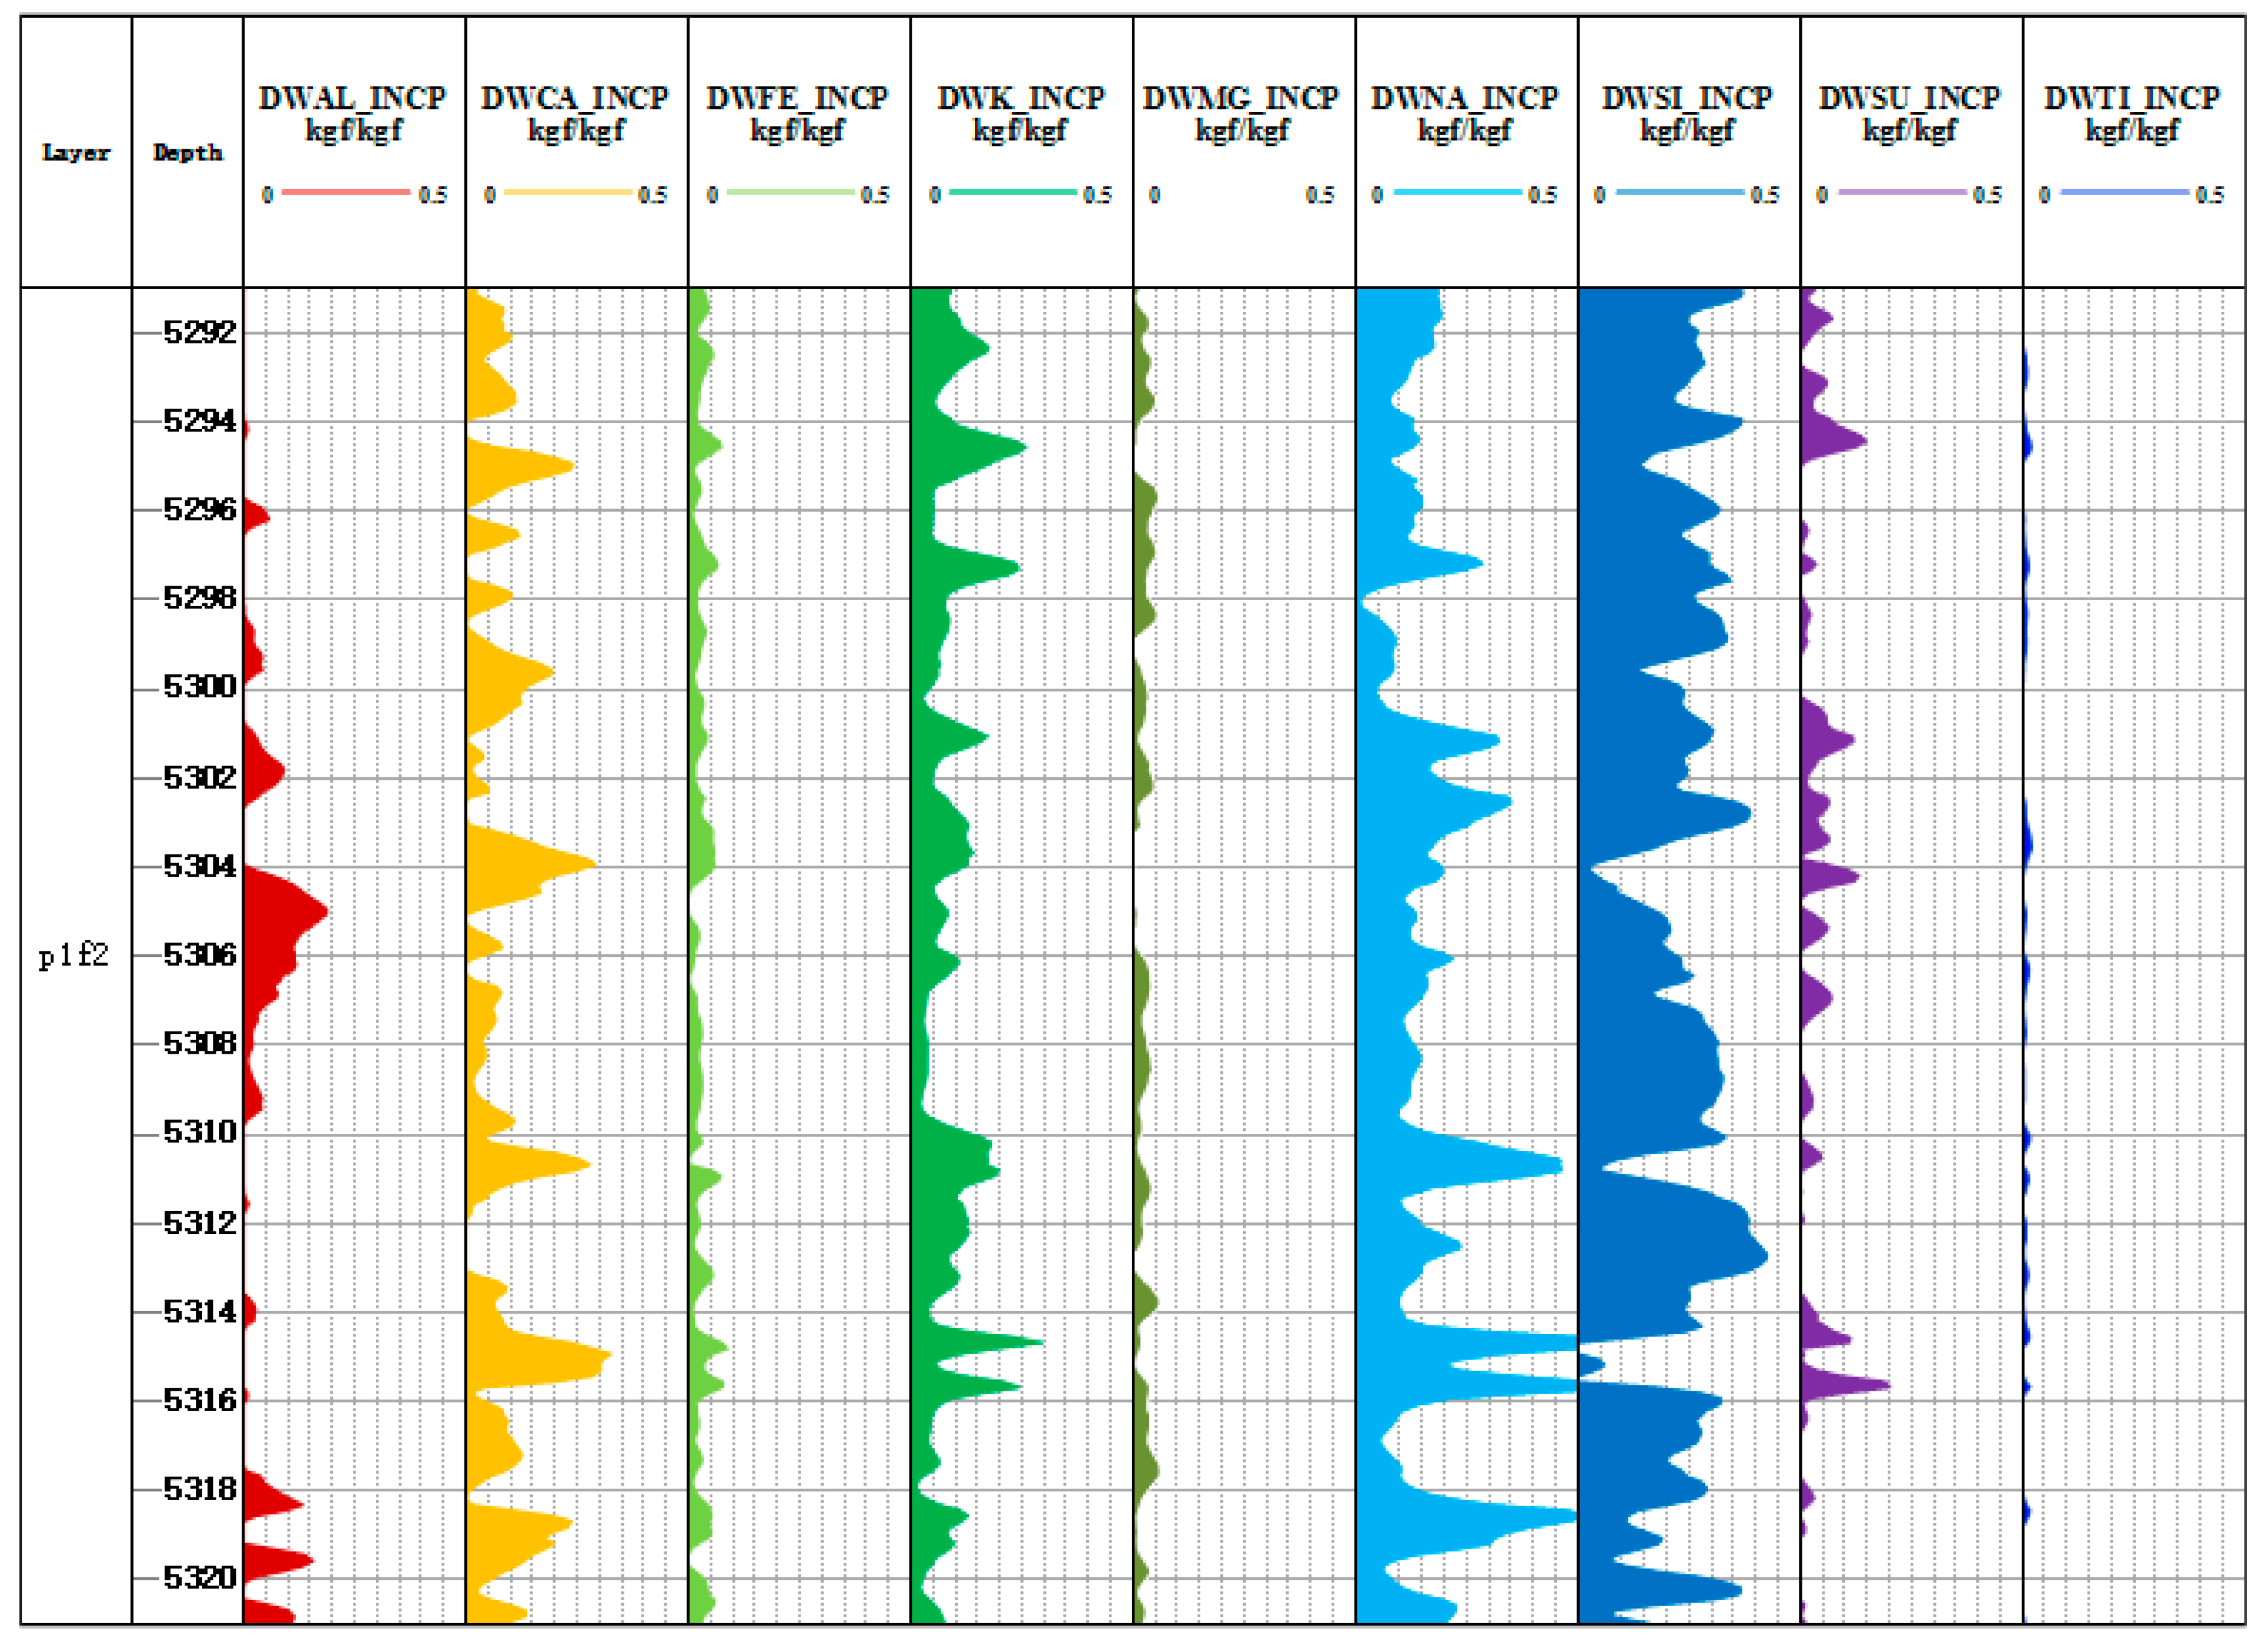
4.1. Improved Petrophysical Volume Modeling

Strata is composed of different minerals and fluids in pores, with minerals mainly including skeleton minerals and clay minerals, and fluids in pores mainly including oil, gas, and water. The skeleton minerals of conventional reservoirs mainly include minerals such as feldspar, quartz, dolomite, calcite, pyrite, mica, etc. Therefore, the rock volume physical model used in the inversion of conventional reservoir minerals mainly targets the common minerals mentioned above (Figure 4a). The Fengcheng Formation in the Mahu Depression is an alkaline lake sedimentary system, with a large amount of alkaline minerals developed. Previous X-ray diffraction experiments showed that the main minerals in the study area were quartz, feldspar, pyrite, shortite, eitelite, reedmergnerite, and trona. However, the existing rock volume physical models do not include alkaline minerals such as trona, shortite, eitelite, and reedmergnerite, Therefore, improvements were made to the existing rock volume physical model, and based on the results of previous X-ray diffraction experiments, shortite, eitelite, reedmergnerite, and trona were added to the rock volume physical model to establish a rock volume physical model suitable for alkali-bearing shale oil reservoirs (Figure 4b).
The element content in the formation is closely related to the mineral content. Previous studies have determined the matrix relationship between the minerals in the formation and the formation elements through a large number of experiments. Herron et al. used the coefficient matrix inversion method as the basis to calculate the mineral content, using the dry weight of elements [19,20]. Based on the physical model of alkali-bearing rock volume mentioned above, combined with the method of coefficient matrix, a mineral content matrix equation is established for alkali-bearing shale oil reservoirs, and constraint conditions are added based on the actual lithology characteristics of the formation (Equation (1)).
( a 11 a 12 a 13 a 1 m a 21 a 22 a 23 a 2 m a 31 a 32 a 33 a 3 m a n 1 a n 2 a n 3 a n m ) × ( x 1 x 2 x 3 x m ) = ( b 1 b 2 b 3 b n )
where m is the number of skeleton components; xj is the content of the j component (j = 1, 2,..., m), decimal; aij is the response equation coefficient of the i curve of the j mineral component (i = 1, 2,..., n; n is the number of selected log curves); bi is the value of the i formation element log curve, decimal or 10−6. Its constraint condition is j = 1 n x j = c , where c is a constant; 0 ≤ xjxmax,j, xmax,j is the maximum content of the j component found in the formation. The response coefficients of each mineral in Litho Scanner Log are shown in Table 1.
When the number of selected element curves is equal to the number of mineral components in the formation (m = n), the mineral dry weight can be calculated using the inverse matrix solution method, using Equation (2):
( x 1 x 2 x 3 x m ) = ( a 11 * det ( A ) a 12 * det ( A ) a 13 * det ( A ) a 1 n * det ( A ) a 21 * det ( A ) a 22 * det ( A ) a 23 * det ( A ) a 2 n * det ( A ) a 31 * det ( A ) a 32 * det ( A ) a 33 * det ( A ) a 3 n * det ( A ) a m 1 * det ( A ) a m 2 * det ( A ) a m 3 * det ( A ) a m n * det ( A ) ) × ( b 1 b 2 b 3 b n )
where a ji * is the adjoint matrix coefficient of aij, and det (A) is the determinant of the coefficient matrix in Equation (1).
Therefore, the dry weight content of minerals is as follows:
h i = i = 1 n a i j * det ( A ) × b i / j = 1 m i = 1 n a i j * det ( A ) × b i × 100 %
where hi is the mass percentage of the i-th mineral, %.
When the number of selected element curves is not equal to the number of formation mineral components, based on Equation (1), according to the principle of the least squares method, solving Equation (1) can be transformed into a problem of finding the extreme value (Equation (4)).
m i n f x = i = 1 m j = 1 n a i j x j b i j = 1 n x j = c 0 x j x m a x ,   j
where minf(x) is the objective function.
When nm, the solution space of Equation (1) is convex and has a unique solution [21]. Therefore, Equation (4) has and only has a minimum value, which is the optimal solution for the content of each mineral component.

4.2. Mineral Assemblage Model

The study area features a diverse range of minerals. When employing a single-mineral model for mineral inversion, the increased number of unknowns amplifies uncertainty, leading to higher errors. Consequently, in practical mineral content inversion, a combined model is often utilized. This involves selecting characteristic elements for different minerals and accurately calculating mineral content based on the principles of optimization. At present, the Elan mineral calculation module from Schlumberger Company, Houston, TX, USA is commonly used for mineral inversion [22,23]: using sulfur element to calculate pyrite content; using silicon dioxide, magnesium carbonate, calcium carbonate, and iron element content to calculate clay mineral content; using calcium and magnesium element content to determine calcite and dolomite content; and calculating quartz, feldspar, and mica content using other element content [24]. The Fengcheng Formation shale oil reservoir develops a large amount of alkaline minerals, and the Elan module does not include the calculation of alkaline minerals. Therefore, based on the Elan module and combined with the characteristic elements in alkaline minerals, as is shown in Figure 5, this article adopts a combination model method to establish 4 mineral interpretation models: Shortite Model (feldspar, quartz, pyrite, and shortite), Eitelite Model (feldspar, quartz, pyrite, and eitelite), Reedmergnerite Model (feldspar, quartz, pyrite, and reedmergnerite), and Trona Model. By combining and calculating 4 models, mineral inversion of alkali-bearing shale oil reservoirs is achieved.
The main mineral in alkaline minerals is trona, which is easily soluble in mud during actual production, resulting in wellbore collapse. However, the radial detection depth of Litho Scanner Log is only 23 cm [25], and the Litho Scanner Log data in trona development intervals are distorted. Trona dissolves in the mud, increasing the mineralization degree of the mud, leading to a decrease in the mud resistivity. Therefore, in layers with high trona content, the ratio of the original formation resistivity to the flushing resistivity is relatively large. As shown in Figure 6, the red dot in the figure is the content of trona in the core, and the black trendline is the relationship between the ratio of virgin zone resistivity to flush zone resistivity and trona content established by sigmoid function [26] (Equation (5)).
V = { 421 1.97 + 2.36 × ( R t / R x o ) 0.43 100 R t / R x o 752.21 100 R t / R x o > 752.21
where V is the trona content, %; Rt is the original formation resistivity, Ω·m; and Rxo is the formation resistivity of the flushing zone, Ω·m.
In addition to the prediction model of trona content, based on the characteristic elements of minerals, we established the Shortite Model (feldspar, quartz, pyrite, and shortite), Eitelite Model (feldspar, quartz, pyrite, and eitelite), and Reedmergnerite Model (feldspar, quartz, pyrite, and reedmergnerite). We selected different elements to perform mineral inversion on different models, and the dry weight of aluminum, potassium, iron, silicon, sulfur, and calcium elements was inverted using the Shortite Model mineral. The dry weight of aluminum, potassium, iron, silicon, sulfur, and magnesium elements was inverted using the Eitelite Model mineral. The dry weight of aluminum, potassium, iron, silicon, and sulfur elements was used to invert the model minerals of Reedmergnerite Model. Feldspar, quartz, feldspar, pyrite, shortite, eitelite and reedmergnerite were inverted based on the model mineral composition, and the mineral content was ultimately determined by combining the model method. We calculated the element response coefficients of each mineral through its chemical composition (Table 1) and performed mineral inversion for each model, using the least squares method.
We calculated and combined the mineral inversion results of the four models (Equation (6)) and obtained the final mineral content.
Wt = Mt/100
We = (100 − Mt) × Me/100
Ws = (100 − Mt) × Ms/100
Wr = (100 − Mt) × (100 − MeMs) × Mr/100
Wq = (100 − Mt) × (100 − MeMs) × Mq/100
Wf = (100 − Mt) × (100 − MeMs) × Mf/100
Wp = (100 − Mt) × (100 − MeMs) × Mp/100
where Wt is the content of trona, %; Wr is the content of reedmergnerite, %; We is the content of eitelite, %; Ws is the content of shortite, %; Wq is the content of quartz, %; Wf is the content of feldspar, %; Wp is the content of pyrite, %; Mt is the trona content calculated by the Trona Model,%; Mr is the content of reedmergnerite calculated by the Reedmergnerite Model, %; Me is the content of eitelite calculated by the Eitelite Model, %; Ms is the content of shortite calculated by the Shortite Model, %; Mq is the quartz content calculated by the Reedmergnerite Model, %; Mf is the feldspar content calculated by the Reedmergnerite Model, %; and Mp is the pyrite content calculated by the Reedmergnerite Model, %.

4.3. Oxide Closure Model

Litho Scanner Log can measure the energy spectrum of elements in formation. During the actual log process, the element energy spectrum measured by the instrument is usually regarded as a linear combination of the standard spectrum of different elements [27,28]. The element energy spectrum count rate can be expressed according to Equation (7):
c i = j = 1 m a i j y j + ε i
where ci is the energy of the i spectrum of the element energy spectrum measured by the Litho Scanner tool, MeV; aij is the standard energy magnitude of the j-th element in the i-th spectrum, MeV; yj is the yield of the j-th element, %; εi is the error, MeV; m is the total number of elements, dimensionless; and n is the total number of spectra, dimensionless.
The yields of different elements can be determined through the weighted least square method [29,30]. As indicated in Equation (8), the yields for each element can be calculated by minimizing R.
R = i = 1 n w i ε i 2 = i = 1 n w i ( c i j = 1 m a i j y j )
The yield of Al, Si, Ca, Fe, K, Na, Mg, S, Ti, and Gd was used to calculate the dry weight of formation elements based on the oxide closure model. The core idea of the oxide closure model is that all minerals in the formation are composed of oxide and carbonate, and the sum of percentage of oxide and carbonate content is 1; the sum of the mass percentage of all elements is also 1 [31]. As shown in Equations (9) and (10), the content of major elements in the rock skeleton can be calculated by the yield of each element and the oxide index. The oxide closure model is used to normalize the oxide and carbonate minerals, which overcomes the problem that it is difficult for instruments to measure the yield of carbon and oxygen [32]. Figure 7 and Figure 8 are the results of element dry weight calculation of Litho Scanner Log in the Fengyun 1 well and Mahu 54 well, respectively.
W i = F y j / s j
1 = F j x j × y j s j
where Wi is the mass percentage of element i, %; F is the closure factor to be determined for each depth point; xj is the oxide index of formation element j; yj is the relative yield of the measured formation element j, %; and sj is the relative detection sensitivity factor of formation element j, g × s.

5. Application and Evaluation of Mineral Inversion

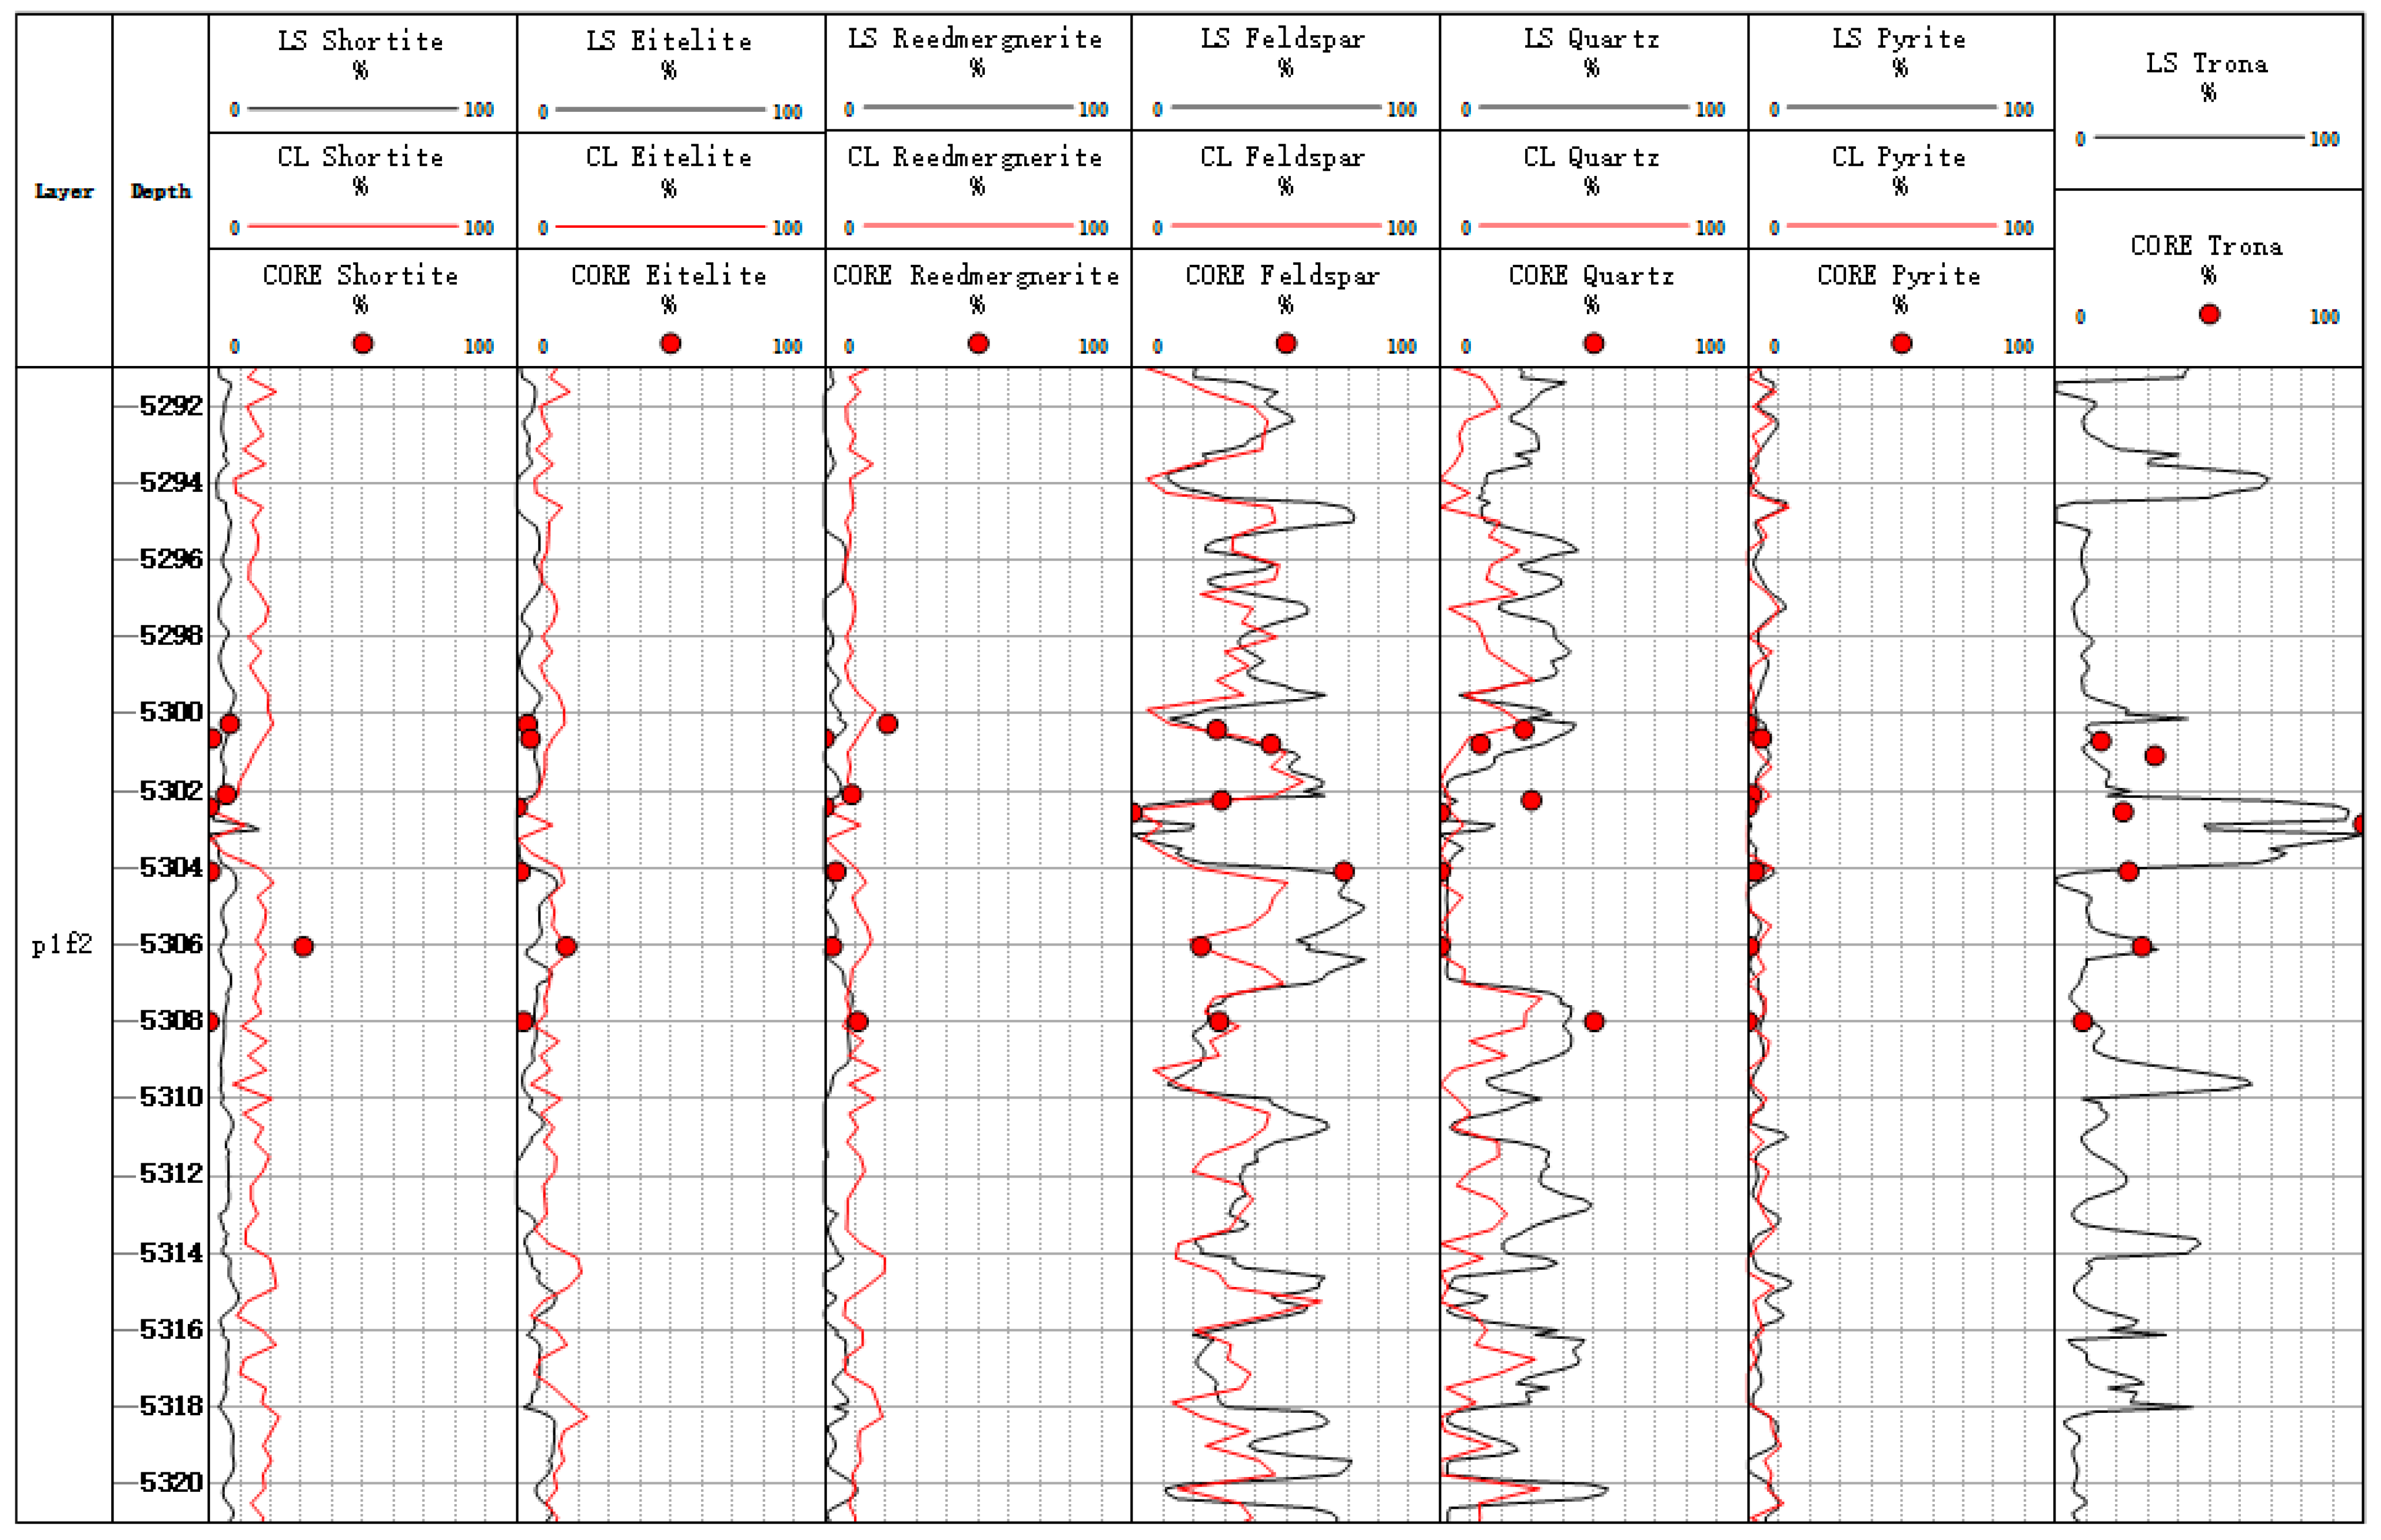
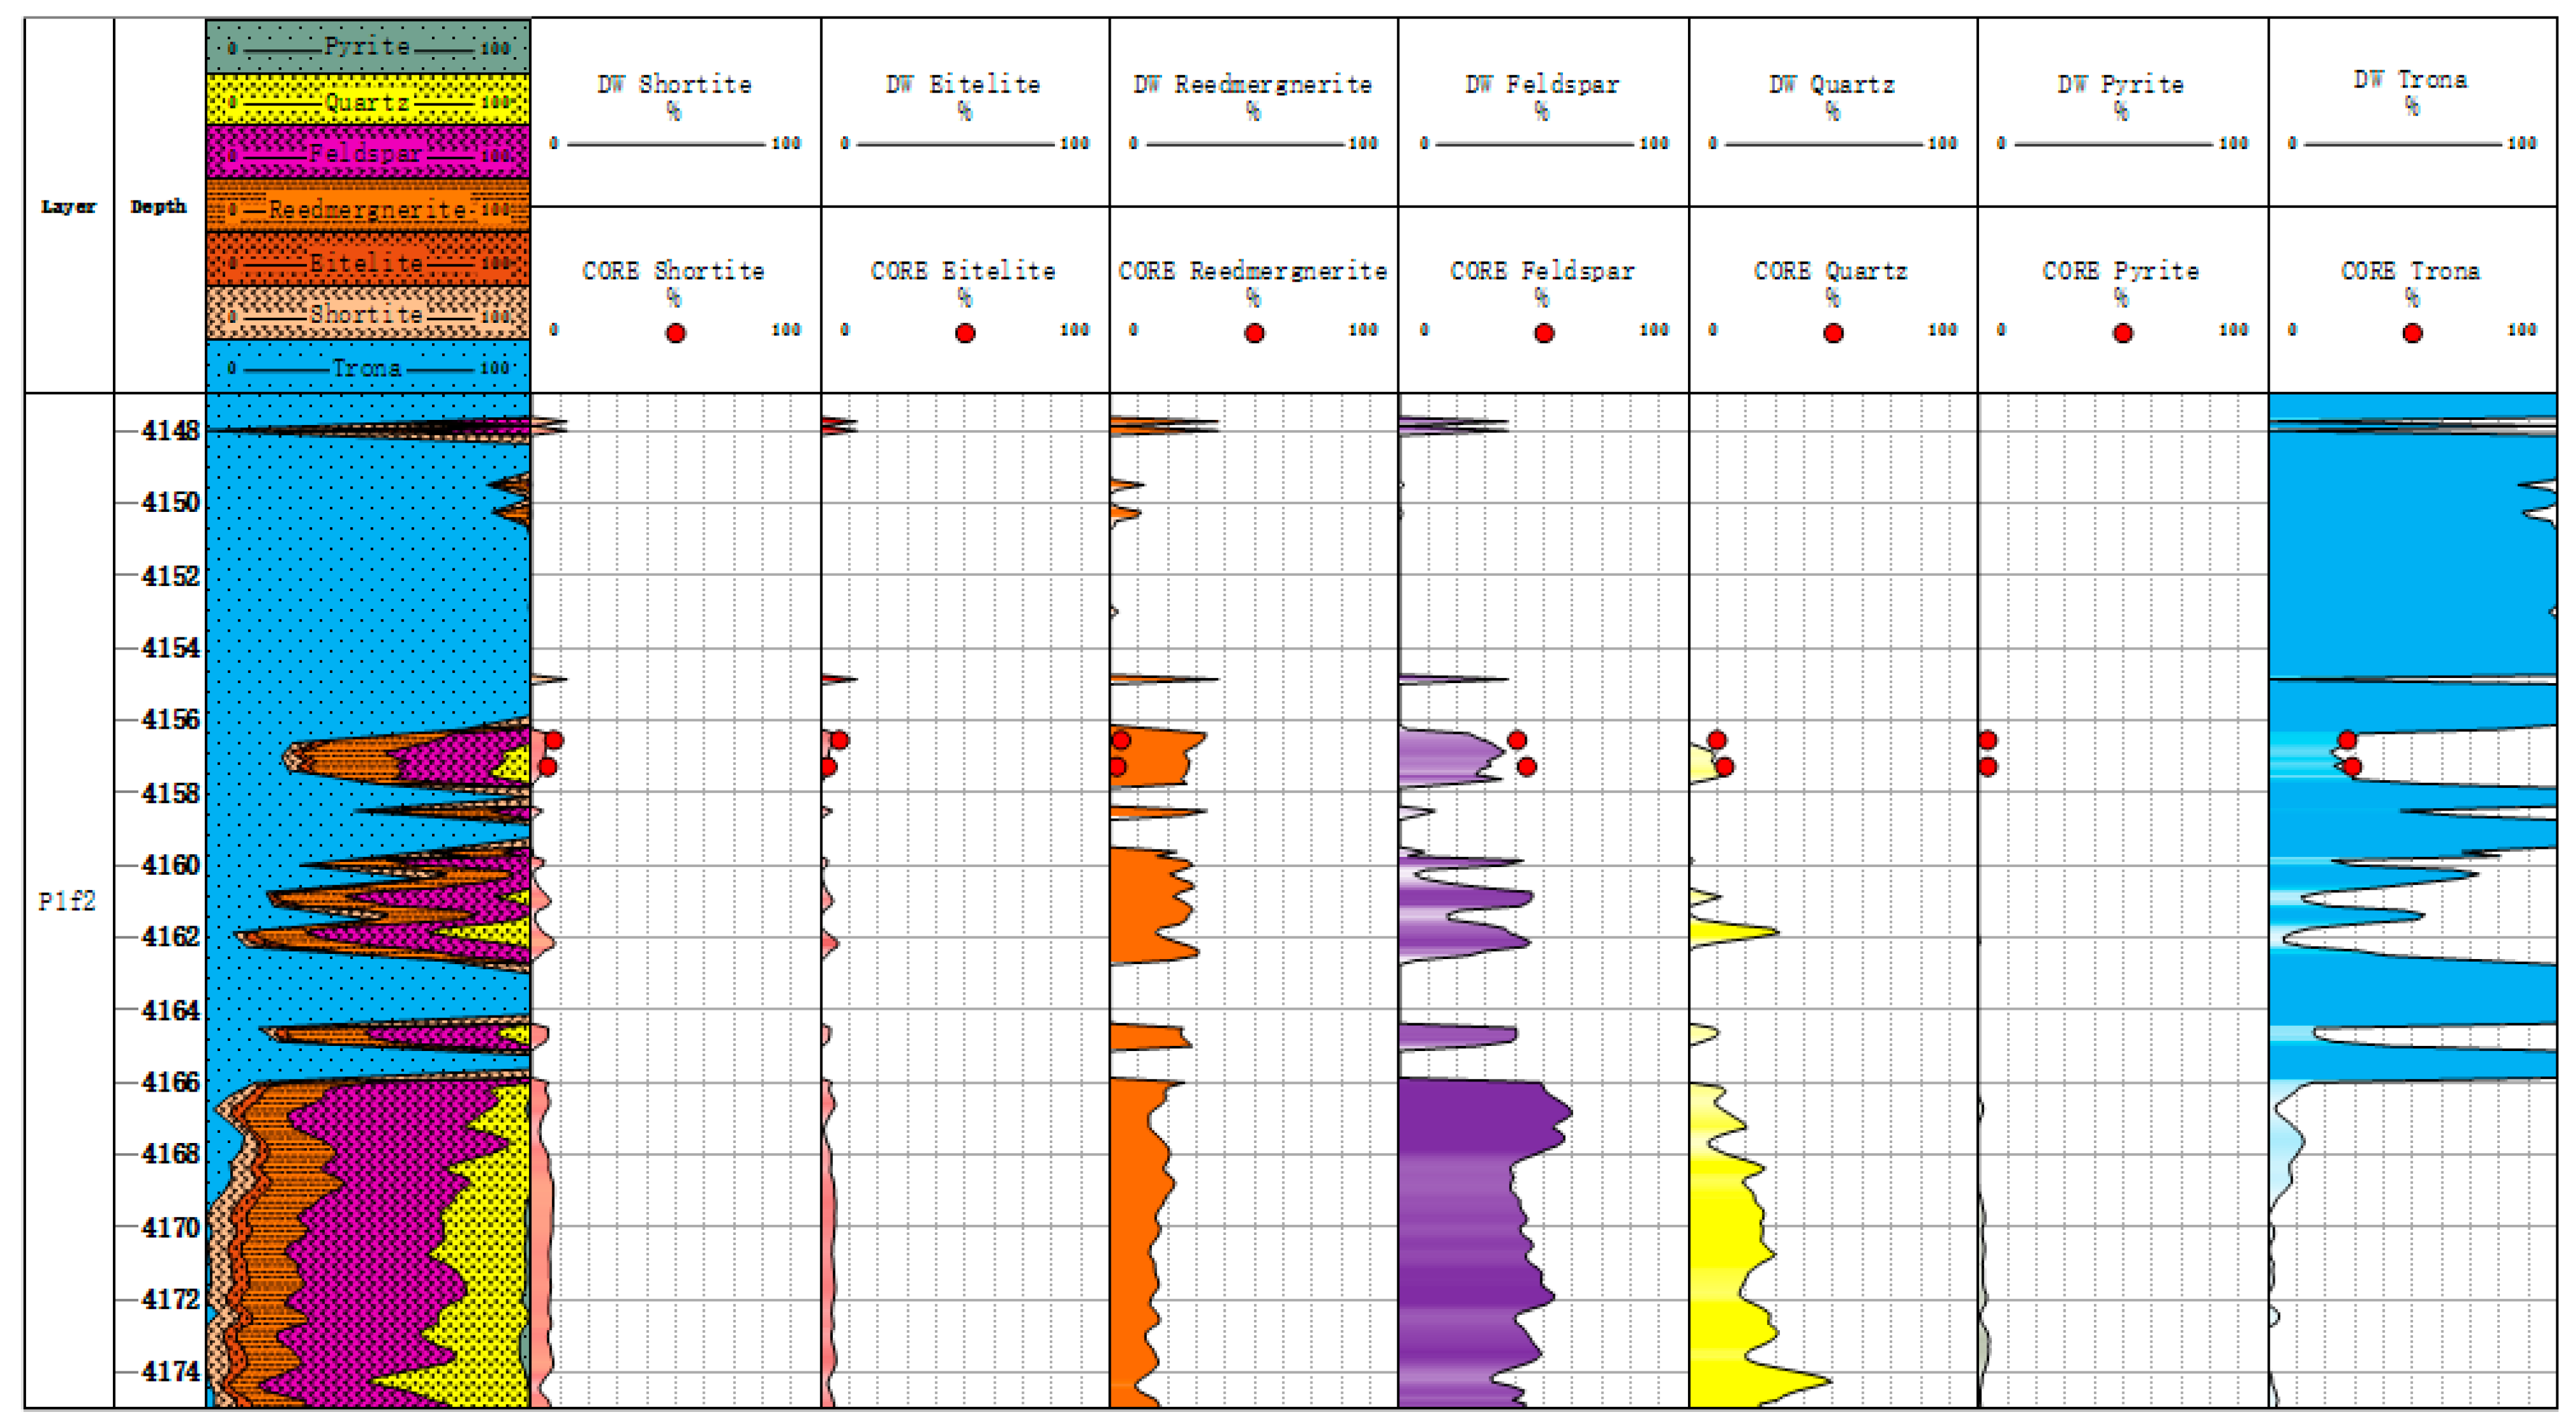
5.1. Litho Scanner Log Mineral Inversion Results

If we compare the mineral inversion results with the core X-ray diffraction experimental results, as shown in Figure 9 and Figure 10, we can see that the third trace is the inverted mineral profile. From the beginning of the th to 10th tracks, they are composed of a shortite component, eitelite component, reedmergnerite component, feldspar component, quartz component, pyrite component, and trona component. This is a gradient color fill, the darker the color the more mineral content. Pink fill channel is shortite; reddish brown fill channel is eitelite; brown fill channel is reedmergnerite; purple fill channel is feldspar; yellow fill channel is quartz; dark green fill channel is pyrite; blue fill channel is trona. The correlation coefficient between the mineral inversion results of Litho Scanner Log and the results of core X-ray diffraction experiment is 0.847. Most of the inversion results have an absolute error of no more than 20% from the core data, with the highest amount of trona among the core minerals with an absolute error of more than 20% (Figure 11). The mineral inversion results have good consistency with the core experiment results.

5.2. Conventional Log Mineral Inversion Results
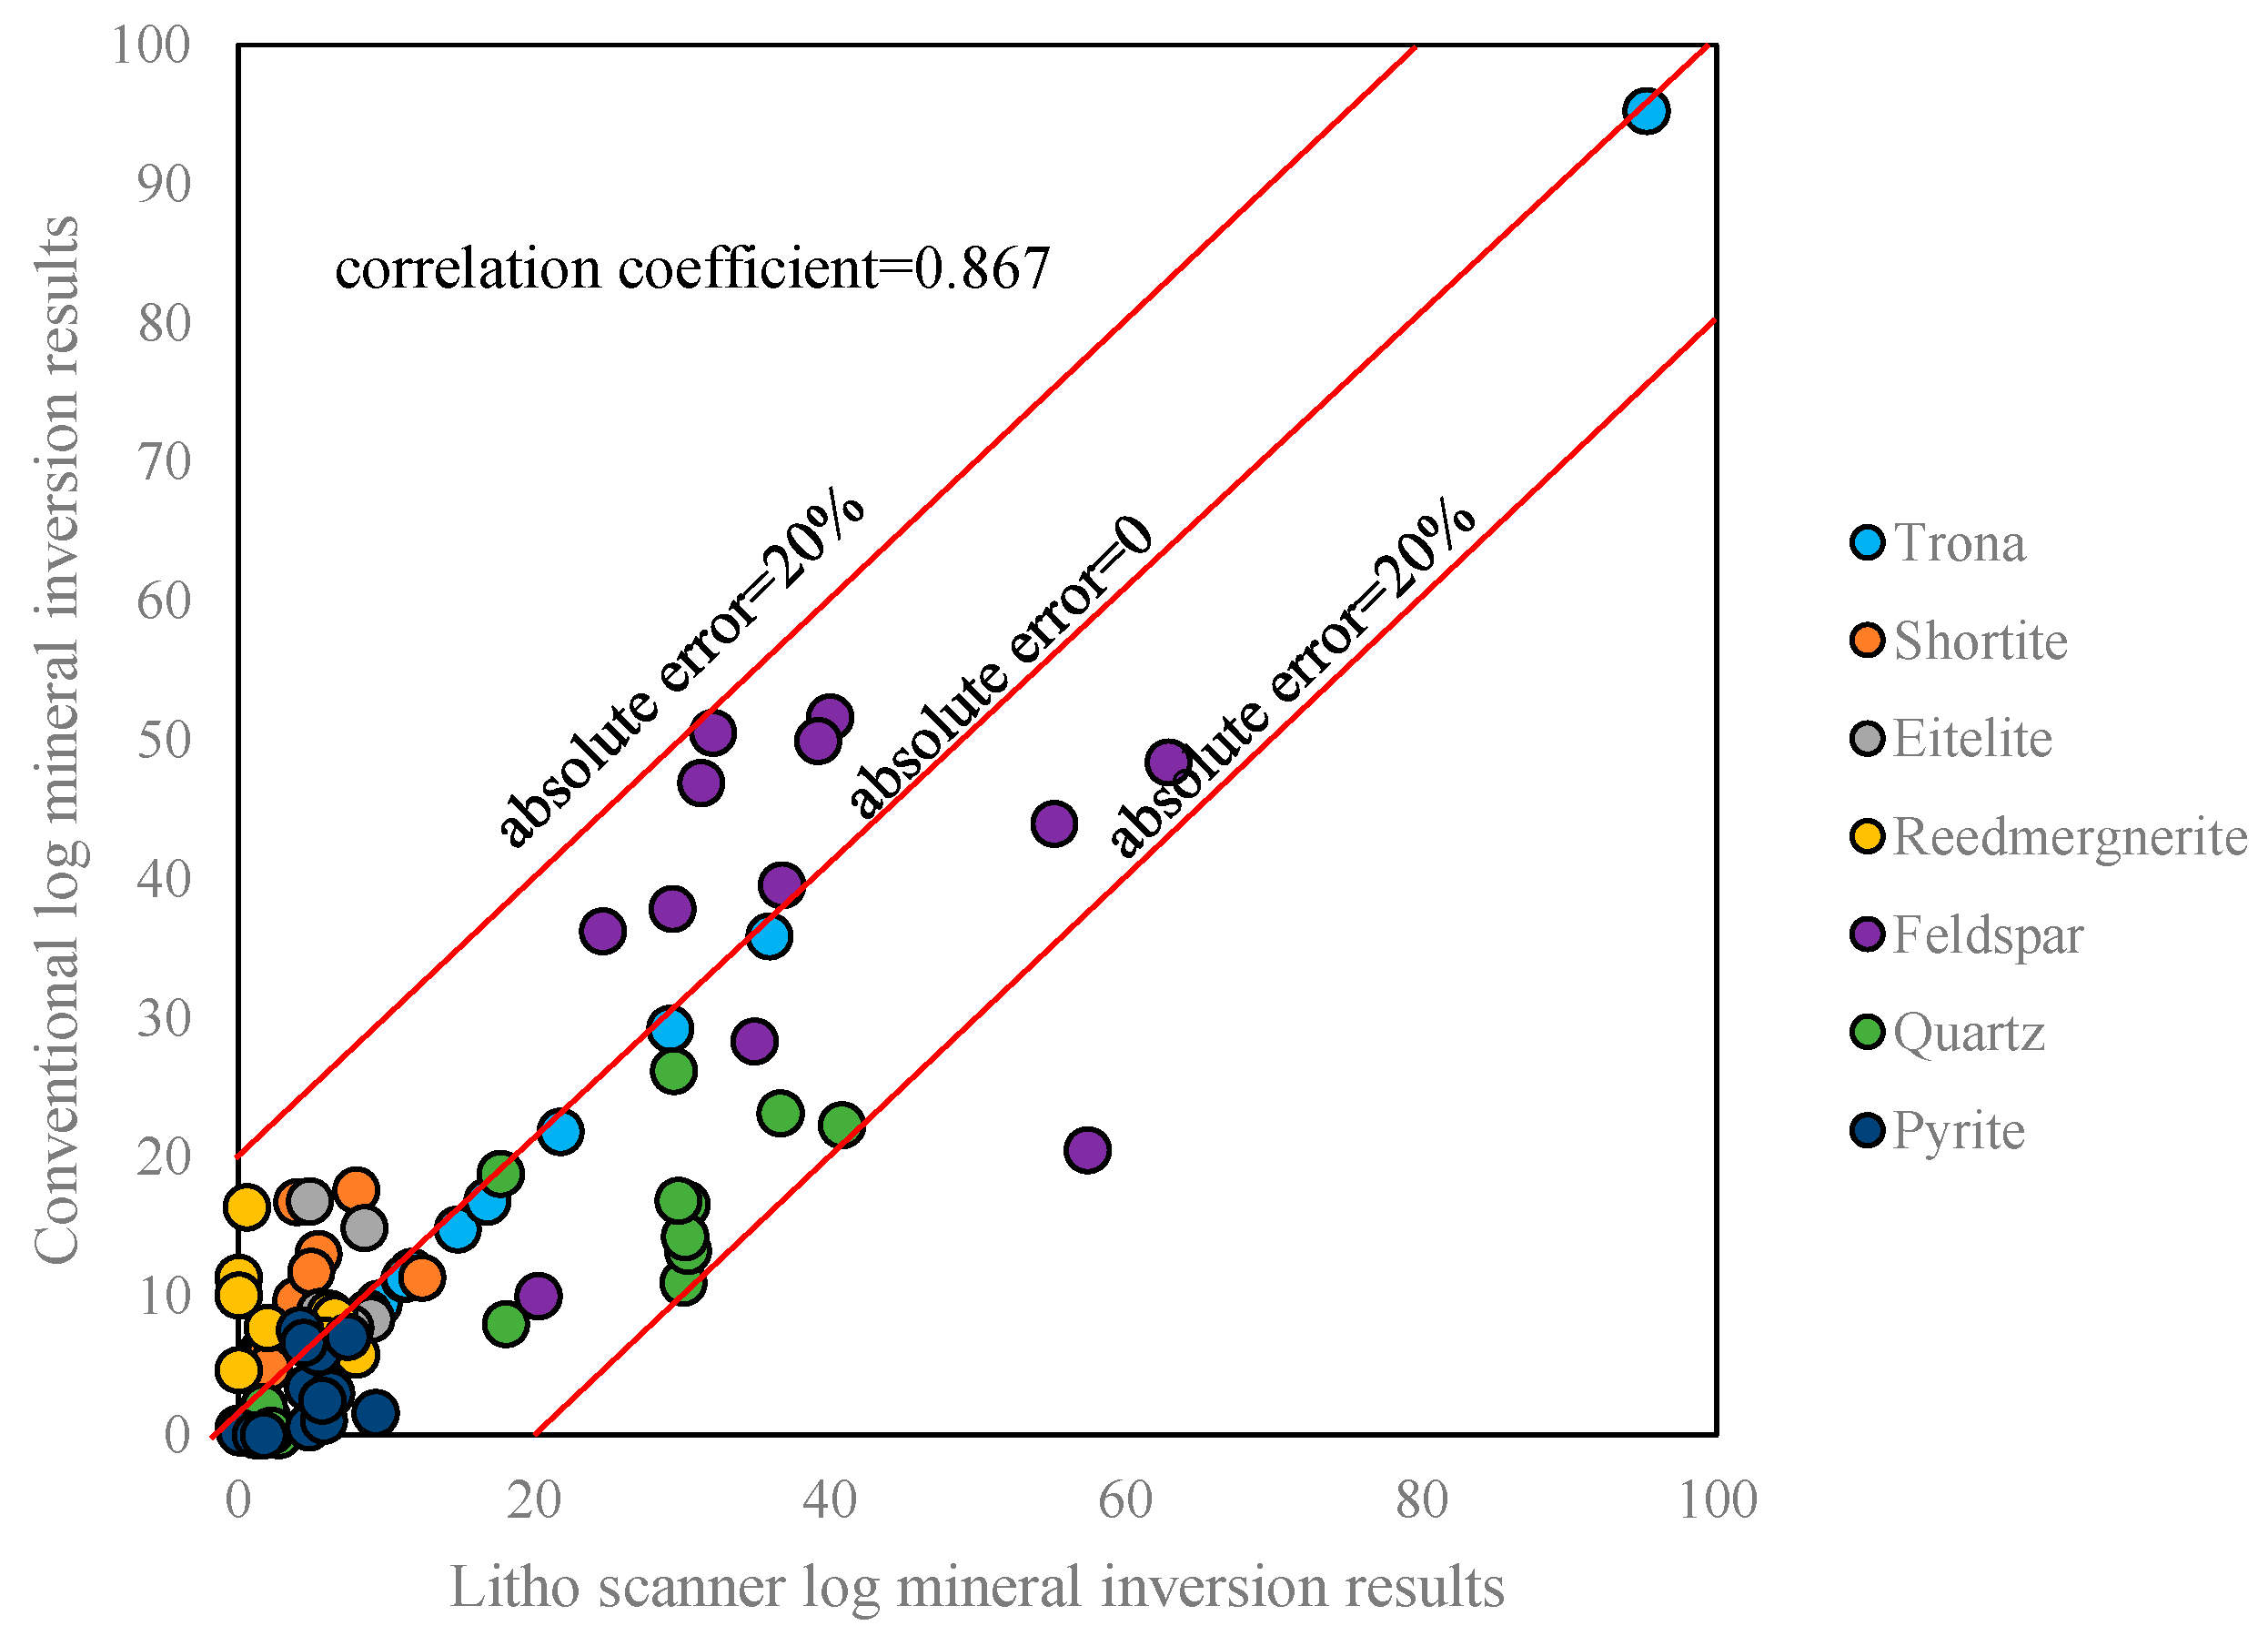
Litho Scanner Log is expensive, and its widespread application will increase exploration costs. Therefore, the mineral inversion results of Litho Scanner Log are calibrated with conventional log data to achieve mineral inversion of alkali-bearing shale oil reservoirs based on conventional log data. We improved the rock volume physical model of conventional log by adding shortite, eitelite, reedmergnerite, and trona to the rock volume physical model and established a rock volume physical model of alkali-bearing ore based on conventional log data.
We then selected density curve, neutron porosity curve, acoustic time difference curve, natural gamma curve, deep resistivity curve, and flushing resistivity curve for mineral inversion of alkali-bearing shale oil reservoirs. By using the principle of the least squares method and combining the above combination model for mineral inversion, the mineral inversion of alkali-bearing shale oil reservoirs using conventional log data was achieved. The selected mineral log parameters in this article are shown in Table 2.
We can compare the inversion results of the conventional log and Litho Scanner Log. Figure 12 and Figure 13 show the conventional log mineral inversion maps of Well Fengyun 1 and Well Mahu 54, respectively. The 3th-to-7th traces, respectively, show the contents of shortite, eitelite, reedmergnerite, feldspar, quartz, pyrite, and trona (with LS being the inversion results of Litho Scanning Log and CL being the inversion results of conventional log). The correlation coefficient between the Litho Scanner Log mineral inversion results and the conventional logging mineral inversion results is 0.867. The absolute errors between the Litho Scanner Log and conventional log inversion results for all minerals except feldspar are less than 20%, and the absolute error between the Litho Scanner Log and conventional log inversion results for feldspar exceeds 20% in only one core (Figure 14). Conventional log and Litho Scanner Log mineral inversion results are in good agreement.
As shown in Figure 15 and Figure 16, the conventional log mineral inversion method is applied to actual well data for processing, achieving the inversion of shale oil reservoir minerals using conventional log data. In the figure, the 3th section is a mineral profile; and the 4th-to-10th tracks compare the mineral inversion results with the core X-ray diffraction results, which include the content of shortite, eitelite, reedmergnerite, feldspar, quartz, pyrite, and trona. We can compare the mineral inversion results with the core X-ray diffraction experimental results. As is shown in Table 3, the correlation coefficient between the conventional logging mineral inversion results and the results of core X-ray diffraction experiments is 0.793. The average absolute error of trona and feldspar is 14.5% and 11%. Except for trona and feldspar, the average absolute error of other minerals is less than 10%, which has a high coincidence rate and meets the needs of fine log interpretation.

6. Discussion

6.1. Comparison of Research Methods

At present, the research on alkaline minerals mainly focuses on qualitative research, while quantitative research has not made great progress. The research methods are mainly thin slice analysis, scanning electron microscopy, X-ray diffraction experiment, and electron probe method. Thin slice analysis and scanning electron microscopy can observe the morphology and diagenesis of alkaline minerals such as dissolution and cementation. Although these methods can accurately identify alkaline minerals qualitatively, they cannot quantitatively evaluate alkaline minerals. An X-ray diffraction experiment and the electron probe method can quantitatively calculate the content of alkaline minerals through a spectral analysis and the content of elements in the sample, but these methods are only limited to the analysis of experimental samples and cannot be applied to the quantitative evaluation of alkaline minerals in the whole well interval.
In the log evaluation of alkaline minerals, formations with high alkaline mineral content exhibit higher virgin zone resistivity and lower flush zone resistivity characteristics. Previous studies have quantitatively calculated the content of trona by utilizing the ratio of virgin zone resistivity to flush zone resistivity. However, this method is only applicable to the quantitative assessment of trona. Therefore, this study, in conjunction with the quantitative evaluation method for trona, utilized Litho Scanner Log and conventional well log data as a basis to quantitatively assess other alkaline minerals (such as shortite, eitelite, and reedmergnerite). Leveraging the characteristic elements of alkaline minerals and employing the least squares method, a combination model was established (Reedmergnerite Model, Eitelite Model, Shortite Model, and Torna Model). Through the combined computation of these models, a quantitative assessment of alkaline minerals was achieved.

6.2. Research Significance

Some wells in the Fengcheng Formation of Mahu Sag, Junggar Basin, China, have been drilled into the center of alkaline lakes, where alkaline minerals are highly developed. These minerals, being easily soluble, pose a risk of blockage in actual production engineering, significantly impeding development progress. During the oil testing process in the Fengcheng Formation, industrial oil flow was achieved. The oil-producing interval primarily comprises the shale oil interval between the layers of alkaline minerals. Alkaline minerals themselves represent an important industrial resource with substantial development value. Hence, there is a need for a quantitative evaluation of the alkaline mineral content. The research outcomes of this paper will contribute to breakthroughs in oil and gas exploration in the Fengcheng Formation of the Mahu Depression and establish a foundation for the enhancement of production extraction technology in alkaline mineral reservoirs in subsequent phases.

7. Conclusions

(1) Fengcheng Formation in Mahu Sag, China, is an alkali-lacustrine facies deposit, which develops a large number of sodium-rich alkaline minerals, which have a significant impact on the accurate evaluation of mineral content in this area. Combined with the results of core X-ray diffraction experiments, the alkaline minerals of the Fengcheng Formation in the Mahu Depression were classified into four groups according to their chemical element compositions: trona minerals (trona and soda ash), eitelite minerals (eitelite and northupite), shortite minerals (shortite, gaylussite, and calcium water alkali), and silicate borate minerals (reedmergnerite). The trona content is the highest among alkaline minerals.
(2) Previous studies on alkaline minerals were mainly qualitative, and quantitative studies on alkaline minerals have not yet made much progress. For the alkaline-bearing shale oil reservoir in the Fengcheng Formation, Mahu Sag, improvements have been made to the existing rock volume physical model. Trona, shortite, eitelite, and reedmergnerite have been incorporated into the rock volume physical model to establish a model suitable for the alkaline-bearing shale oil reservoir. Leveraging Litho Scanner Log and considering the characteristic elements of minerals, models for shortite (feldspar, quartz, pyrite, and shortite), eitelite (feldspar, quartz, pyrite, and eitelite), and reedmergnerite (feldspar, quartz, pyrite, and reedmergnerite) were established. The ratio of virgin zone resistivity to flush zone resistivity was utilized to calculate the content of trona. Finally, the mineral content was determined through a combination model method, forming a comprehensive set of mineral inversion methods for shale oil reservoirs containing alkali ores.
(3) Litho Scanner Log is expensive, and its popularity is low, so utilizing Litho Scanner Log mineral inversion results to scale conventional log mineral inversion results to promote region-wide application is difficult. Based on the improved petrophysical volume model, the density curve, neutron porosity curve, acoustic slowness log, natural gamma curve, virgin zone resistivity curve, and flush zone resistivity curve were selected to invert the mineral content of alkali-bearing shale oil reservoir. Using the principle of the least square method and combined with the method of the combined model, the inversion of mineral in alkaline shale oil reservoir from conventional log data was realized. The inversion results are in good agreement with those of the core X-ray diffraction test.

Author Contributions

L.Z., investigation, methodology, project administration, supervision, and writing—original draft; R.M., project administration; X.D., supervision; Z.F., methodology; J.C., investigation; X.Z., methodology; C.F., investigation and writing—review and editing. All authors have read and agreed to the published version of the manuscript.

Funding

The research was supported by the Natural Science Foundation of Xinjiang Uygur Autonomous Region (No. 2021D01E22), the Innovative Outstanding Young Talents of Karamay, the Innovative Environmental Construction Plan (Innovative Talents) of Science and Technology Planning project of Karamay (No. 20212022hjcxrc0033), and the National Natural Science Foundation of China (Nos. 42004089 and 42364007).

Data Availability Statement

Data will be made available upon request.

Acknowledgments

All the authors would like to thank the reviewers and editors for their thoughtful comments that greatly improved the manuscript.

Conflicts of Interest

Rui Mao was employed by PetroChina Xinjiang Oilfield Company. Xili Deng was employed by PetroChina. The remaining authors declare that the research was conducted in the absence of any commercial or financial relationships that could be construed as a potential conflict of interest.

References

  1. Zhang, Z.; Yuan, X.; Wang, M.; Zhou, C.; Yong, T.; Chen, X.; Lin, M.; Cheng, D. Alkaline-lacustrine deposition and paleoenvironmental evolution in Permian Fengcheng Formation at the Mahu sag, Junggar Basin, NW China. Pet. Explor. Dev. 2018, 45, 1036–1049. [Google Scholar] [CrossRef]
  2. Yu, Z.K. Alkaline Lake Diagenesis and Its Influence on Oil and Gas of the Permian Fengcheng Formation in the Mahu Depression, Junggar Basin, China; Chang’an University: Xi’an, China, 2022. [Google Scholar]
  3. Radtke, R.J.; Lorente, M.; Adolph, B.; Berheide, M.; Fricke, S.; Grau, J.; Stoller, C. A new capture and inelastic spectroscopy tool takes geochemical logging to the next level. In SPWLA Annual Logging Symposium; SPWLA: Houston, TX, USA, 2012; p. 103. [Google Scholar]
  4. Zhang, Y.; Wang, G.; Song, L.; Bao, M.; Huang, Y.; Lai, J.; Wang, S.; Huang, L. Logging identification method of shale lithofacies: A study of Fengcheng Formation in Mahu Sag, Junggar Basin. Prog. Geophys. 2023, 38, 393–408. [Google Scholar]
  5. Freedman, R.; Herron, S.; Anand, V.; Herron, M.; May, D.; Rose, D. New method for determining mineralogy and matrix properties from elemental chemistry measured by gamma ray spectroscopy logging tools. SPE Reserv. Eval. Eng. 2015, 18, 599–608. [Google Scholar] [CrossRef]
  6. Yu, K.; Cao, Y.; Qiu, L.; Sun, P.; Yang, Y.; Qu, C.; Wan, M. Characteristics of alkaline layer cycles and origin of the Lower Permian Fengcheng Formation in Mahu sag, Junggar Basin. J. Palaeogeogr. 2016, 18, 1012–1029. [Google Scholar]
  7. Jiang, F.; Hu, M.; Hu, T.; LYU, J.; Huang, L.; Liu, C.; Jiang, Z.; Huang, R.; Zhang, C.; Wu, G.; et al. Controlling factors and models of shale oil enrichment in Lower Permian Fengcheng Formation, Mahu Sag, Junggar Basin, NW China. Pet. Explor. Dev. 2023, 50, 812–825. [Google Scholar] [CrossRef]
  8. Tang, Y.; Zheng, M.; Wang, X.; Wang, T.; Xie, Z.; Qin, Z.; Hei, C.; Cheng, H.; Gao, Y.; Tao, H. Sedimentary paleoenvironment of source rocks of Fengcheng Formation in Mahu Sag of Jungar Basin. Nat. Gas Geosci. 2022, 33, 677–692. [Google Scholar]
  9. Eslinger, E.; Boyle, F. Building a multi-well model for partitioning spectroscopy log elements into minerals using core mineralogy for calibration. In SPWLA Annual Logging Symposium; SPWLA: Houston, TX, USA, 2013; p. SPWLA-2013-HH. [Google Scholar]
  10. Li, Z.; Xiong, W.; Wang, B.; Song, Z.; Song, M.; Sun, Z.; Yu, H.; Zhou, J.; Wu, X. Fine-grained sedimentary characteristics and evolution model of Permian Fengcheng Formation in Hashan area, Junggar Basin. Pet. Geol. Exp. 2023, 45, 693–704. [Google Scholar]
  11. Cao, J.; Lei, D.; Li, Y.; Tang, Y.; Chang, Q. Ancient high-quality alkaline lacustrine source rocks discovered in the Lower Permian Fengcheng Formation, Junggar Basin. Acta Pet. Sin. 2015, 36, 781. [Google Scholar]
  12. Mao, R.; Shen, Z.; Zhang, H.; Chen, S.; Fan, H. Lithology Identification for Diamictite Based on Lithology Scan Logging: A Case Study on Fengcheng Formation, Mahu Sag. Xinjiang Pet. Geol. 2022, 43, 743. [Google Scholar]
  13. Yang, F.; Meng, X.; Wang, X.; Yu, P.; Shao, G.; Chen, H. Micro-Pore characteristics and influencing factors of Fengcheng Formation shale in well Maye-1. Xinjiang Pet. Geol. 2022, 43, 1. [Google Scholar]
  14. Guo, P.; Bai, S.Y.; Li, C.Z.; Lei, H.Y.; Xu, W.L.; Zhang, X.T.; Wen, H.G. Formation of authigenic quartz and feldspars in the Fengcheng Formation of the Mahu sag, Junggar basin, and their reservoir modification significance. Acta Geol. Sin. 2023, 97, 2311–2331. [Google Scholar]
  15. Wang, R.; Tao, W.; You, X.; Zhu, T.; Qian, Y.; Liu, Z.; Wan, M. Petrographic characteristics and quantitative comprehensive evaluation of shale oil reservoirs in Permian Fengcheng Formation, Mahu sag. Acta Pet. Sin. 2023, 44, 1085. [Google Scholar]
  16. Jiang, Y.; Wen, H.; Qi, L.; Zhang, X.; Li, Y. Salt minerals and their genesis of the Permian Fengcheng Formation in Urho area, Junggar Basin. J. Mineral. Petrol. 2012, 32, 105–114. [Google Scholar]
  17. Tian, X.; Zhang, Y.; Zhuo, Q.; Yu, Z.; Guo, S. Tight oil charging characteristics of the Lower Permian Fengcheng Formation in Mahu sag, Junggar Basin: Evidence from fluid inclusions in alkaline minerals. Acta Pet. Sin. 2019, 40, 646. [Google Scholar]
  18. Zhao, Y.; Guo, P.; Lu, Z.; Zheng, R.; Chang, H.; Wang, G.; Wei, Y.; Wen, H. Genesis of Reedmergnerite in the Lower Permian Fengcheng Formation of the Junggar Basin, NE China. Acta Sedimentol. Sin. 2020, 38, 966–979. [Google Scholar]
  19. Herron, M.M. Mineralogy from geochemical well logging. Clays Clay Miner. 1986, 34, 204–213. [Google Scholar] [CrossRef]
  20. Herron, M.M.; Herron, S.L.; Grau, J.A.; Seleznev, N.V.; Phillips, J.; El Sheriff, A.; Farag, S.; Horkowtiz, J.P.; Neville, T.J.; Hsu, K. Real-Time Petrophysical Analysis in Siliciclastics from the Integration of Spectroscopy and Triple-Combo Logging; SPE: Rome, Italy, 2002. [Google Scholar]
  21. Fan, Y.F.; An, J.X.; Yue, A.Z.; Zhang, G.J.; Ying, H.J.; He, B. Evaluation of Shale Oil Reservoir Based on Formation Element Logging. Well Logging Technol. 2022, 46, 563–571. [Google Scholar]
  22. Schlumberger. ECS Elemental Capture Spectroscopy Sonde; Schlumberger: Houston, TX, USA, 2006; pp. 1–6. [Google Scholar]
  23. Schlumberger. Litho Scanner Brochure; Schlumberger: Houston, TX, USA, 2017; pp. 1–11. [Google Scholar]
  24. Liao, D. Interpretation and application of ECS logging data in shale formations. Pet. Drill. Tech. 1900, 43, 102–107. [Google Scholar]
  25. She, G.; Chen, B.; Zhu, H.B.; Xu, Y.F.; Zhou, X.G.; Yu, N. Reliability and Application Effects Evaluation of FEM Formation Element Logging Tool. Well Logging Technol. 2020, 44, 233–240. [Google Scholar]
  26. Mao, R.; Zhao, L.; Shen, Z.; Luo, X.; Chen, S.; Feng, C. Characteristics of Alkaline Minerals and Loggng Evaluation of Trona in Fengcheng formation of Mahu Sag. Xinjiang Pet. Geol. 2023, 44, 667–673. [Google Scholar]
  27. Alameedy, U. Accurate petrophysical interpretation of carbonate using the elemental capture spectroscopy (ECS). Iraqi J. Chem. Pet. Eng. 2023, 24, 125–131. [Google Scholar] [CrossRef]
  28. Jacobson, L.A.; Wyatt, D.F. Elemental yields and complex lithology analysis from the pulsed spectral gamma log. Log Anal. 1996, 37, 50–61. [Google Scholar]
  29. Kho, D.; Al-Awadi, M.; Acharya, M. Application of magnesium yield measurement from elemental capture spectroscopy tool in formation evaluation of northern Kuwait fields. In SPWLA Annual Logging Symposium; SPWLA: Houston, TX, USA, 2009. [Google Scholar]
  30. Yan, P.; Yue, X.; Kou, X.; Hu, G.; Yin, Q.; Chang, J.; Lai, F. Application of LithoScanner Logging Technology in CO2 Geological Storage Injection Well. IOP Conf. Ser. Earth Environ. Sci. 2021, 781, 022095. [Google Scholar] [CrossRef]
  31. Guo, W.; Shen, Q.Z.; Songyi, H. Application of LithoScanner Logging Technology in Qinghai Oilfield. Well Logging Technol. 2015, 39, 213–216. [Google Scholar]
  32. Mei, J.; Zou, C.; Yuan, Y.; You, T.; Li, J. Application of LithoScanner logging technology in Zhejiang oilfield. Inn. Mong. Petrochem. Ind. 2015, 20, 98–101. [Google Scholar]
Figure 1. Structural position and stratigraphic column of the Mahu Sag.
Processes 12 00105 g001
Figure 2. Mineral types and content of Fengcheng Formation in Mahu Sag.
Processes 12 00105 g002
Figure 3. Microscopic characteristics of alkaline minerals from Fengcheng Formation in Mahu Sag. (a) Trona dissolution, Feng 26 well, 3304.1m. (b) Microscopic characteristics of shortite, Maye 2 well, 4771.4 m. (c) Microscopic characteristics of eitelite, Fengnan 5 well, 3534.5 m. (d) Microscopic characteristics of reedmergnerite, Aike 1 well, 5477.6 m.
Processes 12 00105 g003
Figure 4. Schematic diagram of rock volume physical model: (a) conventional reservoir rock volume physical model and (b) physical model of rock volume in alkali-bearing shale oil reservoirs.
Processes 12 00105 g004
Figure 5. Comparison of calculation flowcharts of mineral association models.
Processes 12 00105 g005
Figure 6. Prediction model for trona content.
Processes 12 00105 g006
Figure 7. Dry weight diagram of elements in Well Fengyun 1.
Processes 12 00105 g007
Figure 8. Dry weight diagram of elements in Well Mahu 54.
Processes 12 00105 g008
Figure 9. Mineral content map of Well Fengyun 1.
Processes 12 00105 g009
Figure 10. Mineral content map of Well Mahu 54.
Processes 12 00105 g010
Figure 11. Comparison of mineral inversion and core X-ray diffraction experiments.
Processes 12 00105 g011
Figure 12. Inversion map of conventional log minerals in Well Fengyun 1.
Processes 12 00105 g012
Figure 13. Mineral inversion map of conventional log in Well Mahu 54.
Processes 12 00105 g013
Figure 14. Comparison of mineral inversion results from conventional log and Litho Scanner Log.
Processes 12 00105 g014
Figure 15. Comparison between mineral content inversion results and XRD experimental results of Well Xiayun 1.
Processes 12 00105 g015
Figure 16. Comparison of mineral content inversion results and XRD experimental results in Well Maye 2.
Processes 12 00105 g016
Table 1. Response coefficients of mineral components.
AL
Weight Fraction
(Ibf/Ibf)
Ca
Weight Fraction
(Ibf/Ibf)
Fe
Weight Fraction
(Ibf/Ibf)
Mg
Weight Fraction
(Ibf/Ibf)
K
Weight Fraction
(Ibf/Ibf)
Si
Weight Fraction
(Ibf/Ibf)
S
Weight Fraction
(Ibf/Ibf)
Quartz0.00000.00000.00000.00000.00000.46750.0000
Feldspar0.09900.00100.00100.00100.05100.30000.0000
Pyrite0.00000.00000.46550.00000.00000.00000.5345
Shortite0.00000.26140.00000.00000.00000.00000.0000
Eitelite0.00000.00000.00000.09600.00000.00000.0000
Reedmergnerite0.00000.00000.00000.00000.00000.34170.0000
Table 2. Response coefficients of the conventional mineral log.
Bulk Density (g/cm3)Neutron Porosity (v/v)Compressional Slowness (us/ft)UI GR (gAPI)
Quartz2.65−0.035630
Feldspar2.570.0260170
Pyrite4.99−0.03390
Shortite2.630.11532
Eitelite2.460.305330
Reedmergnerite2.740.18605
Table 3. Absolute error analysis table.
Sample NumberTronaShortiteEiteliteReedmergneriteFeldsparQuartzPyrite
Inversion Content/%Core Content/%Inversion Content/%Core Content/%Inversion Content/%Core Content/%Inversion Content/%Core Content
/%
Inversion Content/%Core Content/%Inversion Content/%Core Content/%Inversion Content/%Core Content/%
17.715.112.18.09.36.97.617.934.628.428.923.70.00.0
20.010.912.22.710.417.77.121.533.923.534.023.62.50.0
30.011.412.25.210.412.26.520.232.623.338.827.73.70.0
464.1100.05.10.02.80.05.10.020.80.02.10.00.00.0
563.2100.05.30.05.20.05.30.020.20.00.80.00.00.0
637.7100.08.90.07.90.08.90.030.40.06.10.00.00.0
717.168.311.90.611.74.610.314.834.68.314.23.40.30.0
825.836.94.42.81.83.58.615.044.131.015.310.80.00.0
971.091.63.50.01.90.14.15.118.63.10.70.10.00.0
1094.6100.00.80.00.80.00.80.03.10.00.00.00.00.0
1132.724.29.63.69.69.110.053.641.38.60.00.00.01.0
1213.415.911.40.08.61.08.160.436.414.122.08.50.10.0
1333.213.27.71.75.50.67.823.033.242.912.516.20.02.4
14100.0100.00.00.00.00.00.00.00.00.00.00.00.00.0
1527.727.56.27.84.76.632.13.829.140.70.09.70.23.2
1623.529.25.15.83.22.327.12.430.744.010.312.40.13.3
Average38.252.87.32.45.94.09.314.827.716.811.68.50.40.6
Average absolute error14.54.91.85.511.03.10.2
Disclaimer/Publisher’s Note: The statements, opinions and data contained in all publications are solely those of the individual author(s) and contributor(s) and not of MDPI and/or the editor(s). MDPI and/or the editor(s) disclaim responsibility for any injury to people or property resulting from any ideas, methods, instructions or products referred to in the content.

