Article

Total Organic Carbon Logging Evaluation of Shale Hydrocarbon Source Rocks in the Shan 1 Section of the Sulige Gas Field, Ordos Basin, China

1
School of Petroleum Engineering, Xi’an Shiyou University, Xi’an 710065, China
2
Key Laboratory of Special Stimulation Technology for Oil and Gas Fields in Shaanxi Province, Xi’an 710065, China
3
No.11 Oil Production Plant, Changqing Oilfield Company, PetroChina, Qingyang 745000, China
*
Author to whom correspondence should be addressed.
Processes 2023, 11(11), 3214; https://doi.org/10.3390/pr11113214
Submission received: 10 October 2023 / Revised: 9 November 2023 / Accepted: 10 November 2023 / Published: 11 November 2023

Abstract

:
The mass fraction of total organic carbon (TOC) is one of the key indicators for evaluating the hydrocarbon generation potential of shale source rocks. Experimental measurements to evaluate the TOC content require significant cost and time. Furthermore, the experimental data are often fragmented and may not provide an accurate depiction of the source rocks throughout the entire block. To solve the above problems, this paper proposes to use the combination of conventional logging data and experimental data after an in-depth study of the geophysical characteristics of hydrocarbon source rocks in the Ordos Basin. A quantitative model between logging data and source rocks is established, and then the continuous distribution value of the TOC content in the hydrocarbon source rock interval is calculated. Firstly, the mud shale formation of the Permian–Shanxi Formation in the Upper Paleozoic, located in the Jingbian area of the Ordos Basin, is selected as the research target using the “Jinqiang method”. The model is constructed by selecting appropriate logging curves (acoustic time difference logging, resistivity logging, and density logging) and experimental results based on the response relationship between logging data and TOC data. This method provides more accurate and comprehensive data for source rock studies, combining experimental sampling to contribute to a better evaluation of TOC in source rock. The shale hydrocarbon source rock logging data from 10 wells are selected, and the model is used to realize the full-well section of the logging data to find the hydrocarbon source rock TOC, which is compared with the TOC data from the experimental core tested at a sampling point. The results demonstrate that the model is highly effective and accurate, with a mere 2.7% percentage error observed across 185 sample data points. This method greatly improves the accuracy and completeness of TOC evaluation compared with the results of previous studies and provides a guide for subsequent TOC logging evaluation of source rocks in other areas. With the study in this paper, continuous TOC values of source rocks are obtained, discarding the TOC values representing the whole set of hydrocarbon source rocks with a limited number of sample averages. This method can reflect the contribution of the layers with high and low organic matter abundance, and the calculated reserves are more accurate. By utilizing the measured TOC values of the study area to invert the model to find the parameters, this study contributes to the decision-making of hydrocarbon exploration in domestic and international basins.

1. Introduction

With the rapid development of unconventional oil and gas exploration and development worldwide, the evaluation of shale reservoirs, including shale gas reservoirs and shale oil reservoirs, has received increasing attention from scientists. TOC mass fraction is one of the key indicators for evaluating the hydrocarbon-generating capacity of source rocks and mud shale oil and gas reservoirs, as well as source rocks for emerging energy resources such as gas hydrates [1,2,3]. TOC and richness exert control on the volumes of liquid and gaseous hydrocarbons generated [4]. The most direct and accurate method for TOC evaluation is using a geochemical analysis of samples with experimental techniques. However, due to the extensive scale, high costs, and prolonged duration of experimental measurements, the resulting data are often fragmented and incomplete, and may inherently fail to provide a comprehensive representation of the source rocks within a study region due to these logistical and cost-based limitations [5]. To obtain TOC for core analysis, samples are usually taken at regular intervals during the drilling process. As a result, the TOC values obtained are not continuous, and applying these discrete TOC values to the evaluation of the entire hydrocarbon source rock can generate large errors that affect the accuracy of the hydrocarbon source rock evaluation results [6]. There is a clear correlation between the abundance of organic matter in the hydrocarbon source rocks and various logging parameters. This is because the organic material in the source rock is relatively abundant and exhibits basic characteristics such as high natural gamma, high acoustic time, high resistivity, and low-density values on the logging curves [7,8]. In addition, these logging parameters have high longitudinal resolution and can provide a good prediction of the TOC curve of hydrocarbon source rocks in a single well, which can fill the gap in the evaluation of TOC in experimental measurements [9,10].
The well logs related to organic matter include density (DEN), resistivity (RT), gamma ray (GR), neutron (CNL), and acoustic time difference logging (AC). Previous studies showed that only when DEN, AC, and TOC were related, they could have better prediction accuracy [11,12]. Beers [13], Swanson [14], and others were the first to propose the relationship between organic matter content in source rocks and rock radioactivity, laying the foundation for evaluating TOC content using logging data. The ΔlogR method is suitable for calculating the TOC content of carbonate and clastic rocks, as proposed by Passey et al. [15]. In 1990, Passey suggested that the organic carbon content could be calculated at different stages of maturity. The method essentially involves superimposing the AC and RT curves to determine the ΔlogR value and then calculating the TOC value. However, this method has a large error due to the artificial determination of the lithological baseline, is cumbersome to use, and considers fewer logging curves. Based on the Passey method, Jin Qiang modified the original formula and developed a series of TOC calculation formulas that can provide different calculation parameters based on different study areas. The Jinqiang method [16] we named has been refined and optimized based on the original Passey method, which considers the DEN recording curve and uses the joint inversion of AC, RT, and DEN curves to accurately derive the TOC content.
Mendelson et al. [17] suggested utilizing natural GR logging to evaluate TOC content. To calculate the TOC content of rocks, Kamali and Mirshady [18] proposed an approach using a neural network technique.
There is a certain amount of regional variability and adaptability in the implementation of the above methods [18]. The combination of logging data and experimental data is commonly used to establish a quantitative model related to the source rock and logging data. Subsequently, it allows for the calculation of the continuous distribution of organic carbon content in the hydrocarbon source rock interval. This approach addresses the limitations of laboratory sampling and provides more accurate and comprehensive data for source rock studies. In this paper, based on the Jinqiang method, the mud shale layer of the Upper Paleozoic Permian Shanxi Formation in the Jingbian area of the Ordos Basin is selected as the object of study. A quantitative model is established by utilizing the response relationship between logging data and TOC data and selecting accurate logging curves with the experimental results. Shale source rock logging data from 10 wells are selected to find the continuously distributed TOC data of the Shan 1 section, and the calculated data are validated with good results. The methodology of this study is instructive not only for shale oil and gas development in the Sulige field but also for the evaluation of TOC logging in conventional and unconventional shale hydrocarbon source rocks in other regions.

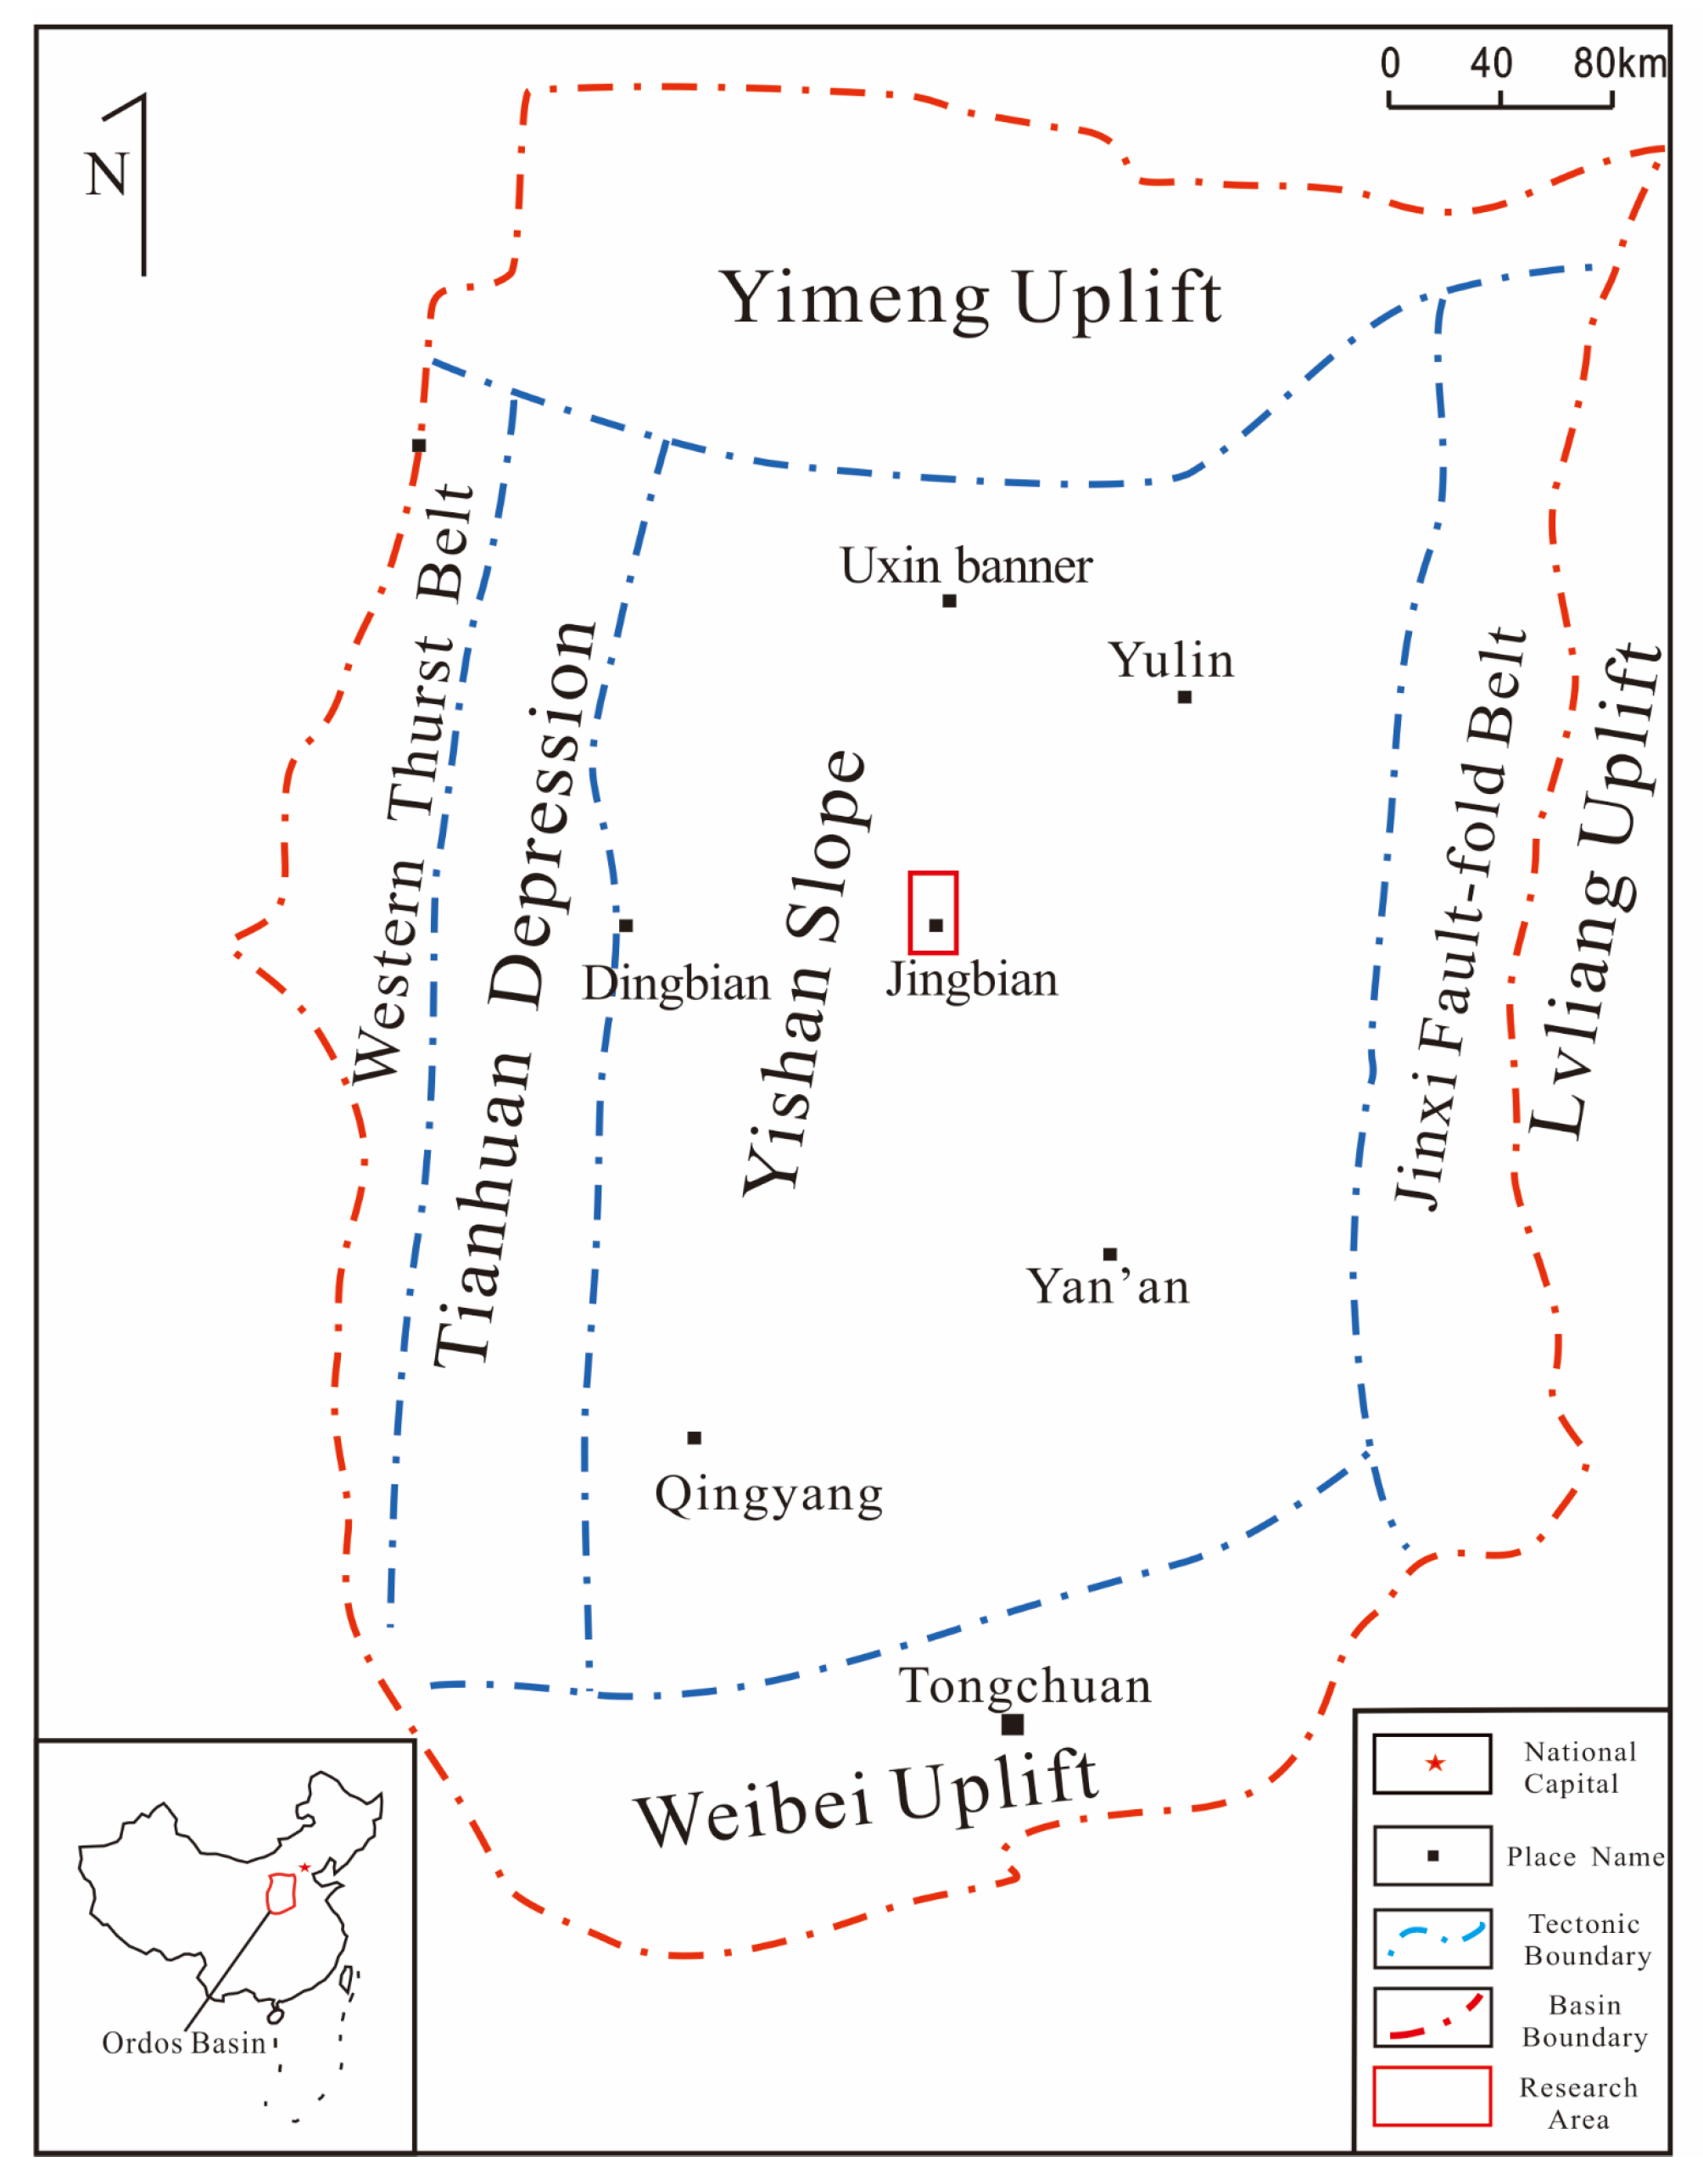
2. Geological Setting

The Ordos Basin is located in the combined zone of the stable zone in eastern China and the active zone in western China, and the basin is bounded by several rifts [19]. The internal stratigraphy is generally gentle, with a dip angle of less than 1°, a tectonic pattern of simple structure, gentle tectonics, stable subsidence, few fractures, and low activity [20]. The basin can be divided into six primary tectonic units: the northern Yimeng uplift, the western thrust belt, the western Tianhuan depression, the central Yishang slope, the southern Weibei uplift, and the eastern Jinxi fault fold belt [21]. The study area is geographically located in the eastern part of the Yishang Slope in the Ordos Basin and covers an area of about 20 km2 (Figure 1) [22]. The overall geological structure is a west-dipping monoclinic structure, and the underlying geological structure pattern is a west-dipping monoclinic structure. The object of study is the mud shale of the Upper Paleozoic Permian Shanxi Formation in the Sulige area, which is a sea–land transitional phase deposit that developed a series of clastic depositions in the environment of the coastal shallow lake–delta front [23,24,25]. The overall evolution of the shale lithology is relatively stable, consisting mainly of gray-black mudstone and dark mudstone [26].
Ordos Basin is rich in natural gas resources, and its natural gas resources account for more than 60% of the total tight gas resources in China. A number of gas fields have been discovered, such as Sulige, Shenmu, Danyudi, Yan’an, and Mili. Among them, the Sulige gas field has been leading China’s natural gas development for 20 years, with an exploration area of about 5 × 10⁴ km2, proven (including basic proven) reserves of over 4.0 × 10¹² m3 by the end of 2022, and cumulative gas production of close to 3000 × 108 m3, with a gas production of more than 300 × 108 m3 by the end of 2022.The main producing layers of the Sulige gas field are the He 8 section and the Shan 1 section [27,28].

3. Samples and Principles

The core and log data were obtained from 13 wells in the mud shale formation of the Upper Paleozoic Permian Shanxi Formation in the Jingbian area of the Ordos Basin. Based on the measurement of logging data (AC, DEN, GR, RT), the TOC values of the cores are measured using continuous sampling (Figure 2).
First, the log curve is a composite response to a physical property of a mass within a certain range around the wellbore. In general, for mudstone, the value of the AC curve decreases with burial depth [29]. In addition, if the formation contains organic material or hydrocarbons, this will cause the value of the formation AC log curve to increase [30]. Mudstones typically exhibit low values in the RT log curve [31]. However, the RT log curve values are higher in organic-rich mudstone formations than in organic-poor formations under the same conditions [32]. In addition, the DEN of hydrocarbon source rocks is lower than the DEN of mudstones that do not contain organic matter, and there are differences in the DEN of layers with organic matter content, so there is a certain functional relationship between the DEN of mudstones and the organic matter content [33]. Additionally, the maturity of the rock can influence the response characteristics of the log curve. Both AC and RT log curve values increase in the mature hydrocarbon source rock section relative to the immature hydrocarbon source rock under the same conditions [34]. When the values of their AC and RT log curves are inversely scaled, the amplitude difference between these two superimposed curves increases. For source rocks of the same maturity, the higher the AC and RT log curve values and the lower the DEN log curve value, the higher the organic matter content, and vice versa [35].
It can be seen that the logging curves contain relevant information that reflects the abundance and maturity of organic matter. Therefore, characteristic logging curves containing this information can be borrowed for inversion, which in turn leads to relevant parameters such as organic matter abundance [12].
The main theoretical basis for the evaluation of hydrocarbon source rocks using logging data is that hydrocarbon source rocks contain a large amount of organic matter and also have special physical properties [36]. In general, a volumetric model of a source rock consists of a rock matrix, solid organic matter, and fluids in the pore space (Figure 3) [37]. Other non-hydrocarbon source rocks consist of both rock matrix and pore fluids. Among hydrocarbon source rocks, there are mature and immature hydrocarbon source rocks. In immature hydrocarbon source rocks, the solid organic matter and rock matrix constitute the solid component of the rock, while the pore space is filled with formation water. In mature source rocks, a portion of the solid organic matter undergoes conversion into hydrocarbons, which are then transported into the pore space [38].
Logging curves show different responses for different formations [39]. For formations containing hydrocarbon source rocks, the logging response is characterized by high radioactivity intensity, low compensated DEN, high AC, high compensated CNL, and high RT [40]. Utilizing the high-resolution characteristics of logging curves to identify and evaluate TOC in hydrocarbon source rocks can reduce the cost of sample testing and quickly obtain the trend in organic carbon content in continuous stratigraphic profiles [41].

4. Building Models (Jinqiang Method)

As early as 1990, Passey et al. [15] used the ΔlogR method to calculate TOC for source rock identification and evaluation, and they were able to calculate organic carbon content values for different maturity conditions. The method focuses on overlapping Rt and AC curves, where RT curves are in logarithmic coordinates and AC curves are in arithmetic coordinates. For fine-grained and non-hydrocarbon source rocks, these two logging curves overlap to represent the baseline, and the difference in magnitude between the two curves is the ΔlgR value. Since TOC is linearly correlated with ∆logR, the quantitative equation for calculating TOC from ∆logR is:
T O C = 10 ( 2.297 0.1688 R o ) Δ lg R
where TOC—calculated organic carbon content, wt.% and Ro—specular body reflectance of the source rocks.
With :   Δ lg R = lg ( R / R b a s e l i n e ) + 0.02 ( Δ t Δ t b a s e l i n e )
where ΔlogR—the difference in magnitude between the AC and Rt curves; R—the measured resistivity value; Rbaseline—the resistivity corresponding to the baseline; Δt—the measured acoustic time difference curve; and Δtbaseline—the acoustic time difference corresponding to the baseline.
If ∆logR is known, the value of TOC can be calculated by simply determining the value of Ro. However, this method does not well reflect the effect of DEN and the GR log curve on TOC, and the parameters for the TOC calculation must be determined in Equation (2). Determining the baseline for both curves is subject to some error and has significant limitations. The ∆logR method is relatively easy to implement but has some drawbacks, and the artificial selection of the baseline introduces a certain amount of error. Therefore, the selected baseline values are not unique, which in turn affects the accuracy of the log curve values corresponding to the selected mudstone baseline.
The Jinqiang method is based on the original Passey method, which considers DEN logging curves and uses a common inversion of the AC, Rt, and DEN curves. The higher the AC and Rt values corresponding to the mudstone, the lower the DEN value and the higher the TOC organic matter content, and vice versa.
Due to the existence of the above problems of Passey’s method, Equation (1) is modified as follows:
T O C = K Δ lg R
where K is a coefficient, which can be obtained by substituting Passey’s method in Equation (3) into Equation (2):
T O C = K lg ( R / R b a s e l i n e ) + 0.02 ( Δ t Δ t b a s e l i n e ) = K lg R + 0.02 K Δ t K ( lg R b a s e l i n e + 0.02 Δ t b a s e l i n e )
Thus, the above equation can be abbreviated as:
T O C = a lg R + b Δ t + c
The logging profiles of the oil shale in the study area are characterized by high GR, high RT, high AC, and low DEN. Based on the laboratory measurements of the core samples, the GR, AC, RT, and DEN of 113 of these samples were selected for regression modeling with the measured TOC at their corresponding depths. The correlation between oil shale-measured TOC versus the logging curve is shown in Figure 4. Among the four independent variables of the relationship curve, the DEN curve has the highest correlation with TOC with a correlation coefficient R2 of 0.569. This is followed by the RT curve with a correlation coefficient R2 of 0.262, and the AC and GR correlation coefficients R2 of 0.171 and 0.149, respectively, with TOC.
This is also because high-quality source rocks are characterized by high RT values, high AC values, and low DEN values. The DEN of the organic matter in the mud shale in this area ranges from 2.02 to 2.45 g/cm3, and the DEN of the clay skeleton in the surrounding matrix ranges from 2.31 to 2.42 g/cm3. The DEN of organic-rich shale is lower than that of mud shale, and increasing the organic content decreases the DEN of the shale. Therefore, the TOC content is inversely related to the DEN. Therefore, a DEN correction was made by changing the formula to:
T O C = ( a lg R + b Δ t + c ) / D
where D—density logging value.

5. Inverse Fitting

The TOC data of the stratigraphy in the core section of the study area were obtained using laboratory testing. The TOC was then corrected for depth to match the AC, RT, and DEN of the corresponding wellbore and depth, as shown in Table 1 below. In Table 1, three wells were selected, and 16 sampling points were identified at various depths for the TOC value and the AC, RT, and DEN logging curve measurements.
Using Equation (6), the data in Table 1 were fitted to obtain the following data.
The regression coefficients are a = 26.105619; b = −0.067237; and c = −24.321207.
The residual variance is Sremained = 41.426315; the regression variance is Sregression = 228.829861; and the total variance is Sgeneral = 270.256176.
The F-test result is F(2,13) = 35.904571 < f(2,13,0.050000) = 3.805565 significant.
The complex correlation coefficient is Rcorrelation = 0.920171.
Finally, the values of the coefficients a, b, and c obtained above were substituted into Equation (6), which in turn led to the formula for obtaining the TOC of the Shan 1 section of the Sulige gas field based on the logging data for resistivity R, acoustic time difference Δt, and lithologic density D:
T O C = [ 26.1 lg R + ( 0.067 ) Δ t + ( 24.32 ) ] / D
Three wells in the study area in Table 1 were selected as test wells, and the TOC values calculated using the Jinqiang method were compared with the measured values of 16 samples, and the results are shown in Figure 5.
Based on Figure 5 and the complex correlation coefficient of R2 = 0.8723, it can be concluded that the fitting effect is very good. In addition, the accuracy of the model is high, indicating that using the Jinqiang method to predict the TOC value in the study area is feasible.

6. Evaluation of TOC in the Sulige Gas Field Using Logging Data

6.1. Single Well Evaluation

The first well is AB49-25 (Figure 6). The depth of the Shanxi Formation of this well is 3230–3310 m. The Shan 1 section is divided by a coal seam, and above the coal seam is the Shan 1 section, so the study section of the Shan 1 of this well is 3231–3299 m. This well is analyzed by sampling the data every 2 m. Since the logging data are affected by the borehole, when using the logging data, the influence of the logging data due to the borehole and the sandstone must be accounted for.
TOC data for this well was calculated using the Jinqiang method, as shown in Table 2.
A radargram analysis of the TOC data of the well is performed, and 25 effective TOC data points are extracted from the well excluding the borehole and sandstone. The average value of effective TOC is 3.39 wt.% with a range of 0.17 wt.% to 7.8 wt.%. This study shows that the organic matter abundance of the shale source rock reservoirs in the Shan1 section is high [42,43]. Among them, an analysis of the radar plot in Figure 7 shows that there are six data points below 2 wt.% and 19 data points above 2 wt.% and up to 9.99 wt.%.

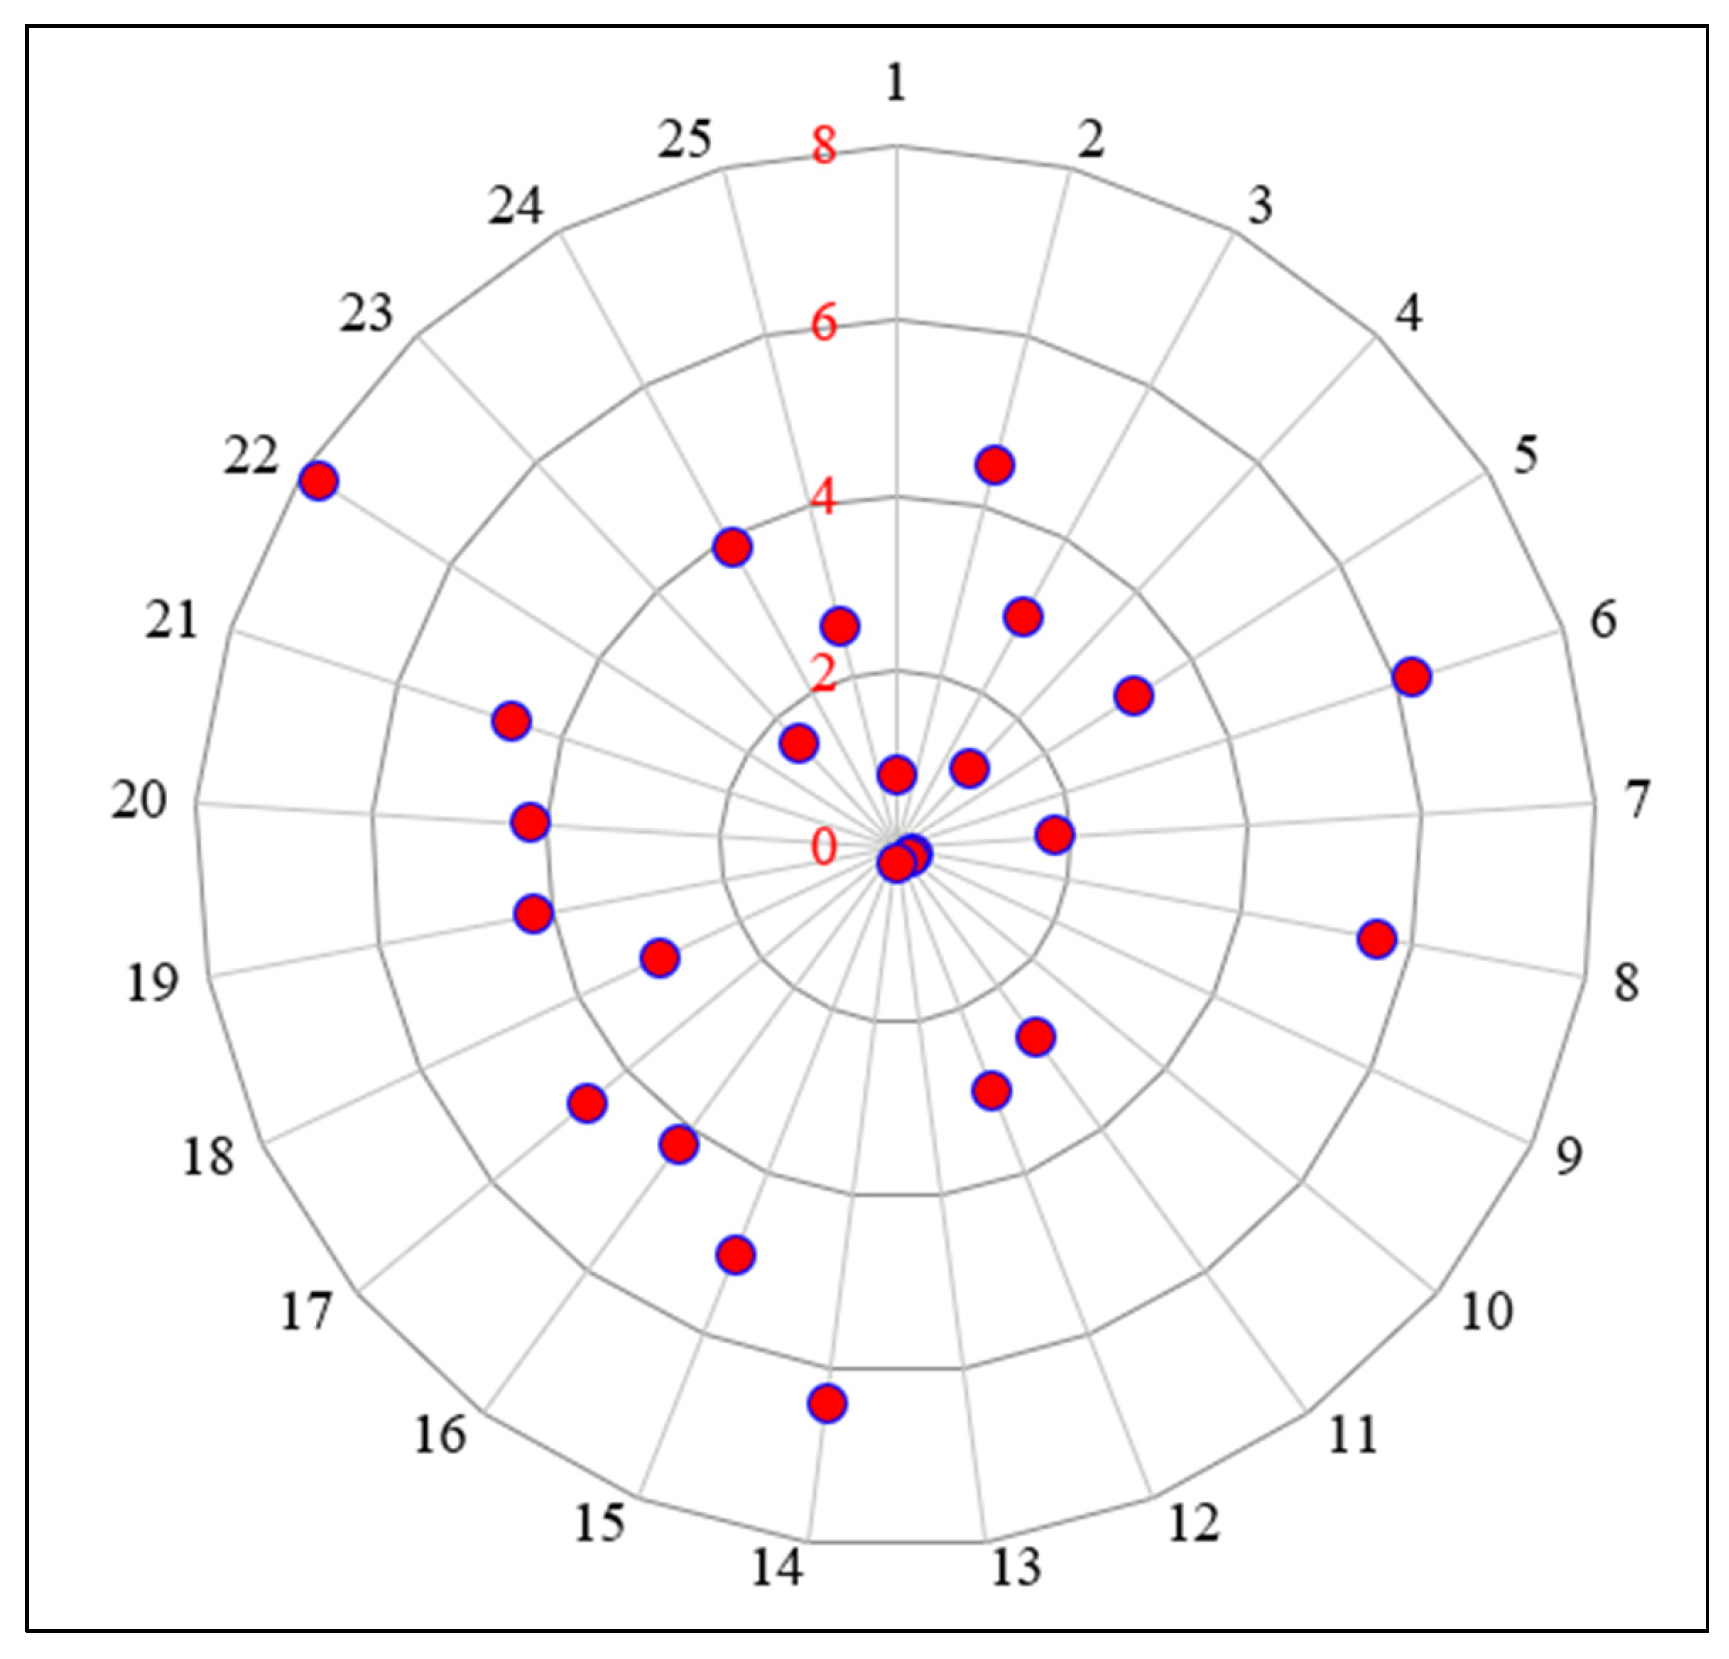
6.2. Multi-Well Evaluation

In accordance with method 5.1, 10 wells were selected to analyze the logging data, and the core test results of the corresponding layers were selected for verification. The results are shown in Table 3.
Based on the above table, a total of 185 data sample points are analyzed, and the results show that the TOC of the hydrocarbon source rocks in the Shan 1 section of the Sulige gas field is distributed in the range of 0 wt.% to 8.4 wt.%. The average value of the TOC of the sample points is 3 wt.%. The percent error between the values obtained using the core experiment and the logging calculation is less than 10%, suggesting that the logging calculation can be used to effectively classify the oil-generating potential of the reservoir.

7. Classification of Oil-Generation Potential in Hydrocarbon Source Rock Reservoirs

The organic carbon content obtained from the experiment is the residual organic carbon percentage. Since the organic carbon converted into hydrocarbons is very limited, the organic carbon represents the oil-generating material conditions. Organic carbon oil-generating potential is generally divided into five levels according to Table 4.
The 185 valid sample points calculated in Table 3 are analyzed in pie charts, according to Table 4, regarding the organic carbon content that divides mudstone and carbonate oil-generation potential.
Figure 8 shows the oil-generation potential of the hydrocarbon source rocks in the Shan 1 section of the Sulige gas field. It can be seen that 8% of the hydrocarbon source rocks have poor oil-generation potential, 8% of the hydrocarbon source rocks have medium oil-generation potential, 20% of the hydrocarbon source rocks have good oil-generation potential, 31% of the hydrocarbon source rocks have very good oil-generation potential, and 33% of the hydrocarbon source rocks have excellent oil-generation potential. In general, the hydrocarbon source rocks in the Shan 1 section of the Sulige gas field are very good and high-quality hydrocarbon source rocks as a whole.

8. Conclusions

(1) Using the method of combining logging information and experimental data, a quantitative model between logging information and hydrocarbon source rocks is established to calculate the continuous distribution value of organic carbon content in hydrocarbon source rock sections. This method can make up for the shortcomings of laboratory sampling and realize the evaluation of the whole section of well logging for the TOC of source rocks.
(2) In this paper, based on the principle of the Jinqiang method, the analysis and collation of the logging data of 10 wells, with a total of 185 valid data sample points, calculated that the TOC was distributed in the range of 0 wt.% to 8.4 wt.%, with an average value of 3 wt.%. The percent error between the values obtained from the experimental core measurements and the logging calculations was less than 10%. This suggests that the TOC value’s relative accuracy calculated using the Jinqiang method is high and can meet TOC logging evaluation requirements.
(3) By analyzing the oil-generation potential of the hydrocarbon source rocks in the study area, it is concluded that the hydrocarbon source rocks in the Shan 1 section of the Sulige gas field are very good and high-quality hydrocarbon source rocks as a whole.
(4) The methodology of this study is not only instructive for the development of shale oil and gas in the Sulige gas field but also for the evaluation of TOC logging of conventional and unconventional shale hydrocarbon source rocks in other regions.
(5) The TOC evaluation model developed in this paper has good generalizability to source rocks in other regions because the important parameters in the model are based on the logging curves of the region. The TOC value of each layer is evaluated comprehensively, which is more applicable than the average TOC value of the whole layer represented by the experimental measurement. It is also very helpful for reserve calculation. Future research on TOC evaluation should focus on improving the accuracy and applicability of the evaluation, such as finding other logging curves that are more relevant to TOC, in order to come up with a calculation model that is more in line with the actual situation.

Author Contributions

Writing—original draft: T.W.; writing—review and editing: T.W. and B.X.; methodology: B.X. and T.S.; validation: T.S. and Y.C.; formal analysis: Y.C. and L.D.; supervision: H.D. All authors have read and agreed to the published version of the manuscript.

Funding

This research received no external funding.

Data Availability Statement

We state that the data are unavailable due to privacy or ethical restrictions of the company and university.

Conflicts of Interest

All authors declare that the research was conducted in the absence of any commercial or financial relationships that could be construed as a potential conflict of interest.

References

  1. Burton, Z.F.M.; Moldowan, J.M.; Magoon, L.B.; Sykes, R.; Graham, S.A. Interpretation of source rock depositional environment and age from seep oil, east coast of New Zealand. Int. J. Earth Sci. 2019, 108, 1079–1091. [Google Scholar] [CrossRef]
  2. Handhal, A.M.; Al-Abadi, A.M.; Chafeet, H.E.; Ismail, M.J. Prediction of total organic carbon at Rumaila oil field, Southern Iraq using conventional well logs and machine learning algorithms. Mar. Pet. Geol. 2020, 116, 104347. [Google Scholar] [CrossRef]
  3. Burton, Z.; Dafov, L.N. Testing the sediment organic contents required for biogenic gas hydrate formation: Insights from synthetic 3-D basin and hydrocarbon system modelling. Fuels 2022, 3, 33. [Google Scholar] [CrossRef]
  4. Burton, Z.F.M. Sediment Organic Contents Required for Gas Hydrate Formation: A Survey of Published Basin and Hydrocarbon System Models. Fuels 2022, 3, 35. [Google Scholar] [CrossRef]
  5. Langford, F.F.; Blanc-Valleron, M.M. Interpreting Rock-Eval pyrolysis data using graphs of pyrolizable hydrocarbons vs. total organic carbon. Am. Assoc. Pet. Geol. Bull. 1990, 74, 799–804. [Google Scholar]
  6. Liu, Z.; Meng, Q.; Dong, Q.; Zhu, J.; Guo, W.; Ye, S.; Liu, R.; Jia, J. Characteristics and resource potential of oil shale in China. Oil Shale 2017, 34, 15. [Google Scholar] [CrossRef]
  7. Luffel, D.L.; Guidry, F.K.; Curtis, J.B. Evaluation of Devonian shale withnew core and log analysis-methods. J. Pet. 1992, 44, 1192–1197. [Google Scholar]
  8. Wang, G.; Zhu, Z.; Zhu, G. Logging identification and evaluation of Cambrian-Ordovician source rocks in syneclise of Tarim basin. Pet. Explor. Dev. 2002, 29, 50–52. [Google Scholar]
  9. Lohr, S.; Baruch, E.T.; Hall, P.A.; Kennedy, M.J. Is organic pore development in gas shales influenced by the primary porosity and structure of thermally immature organic matter. Org. Geochem. 2015, 87, 119–132. [Google Scholar] [CrossRef]
  10. Mahmoud, A.A.; Elkatatny, S.; Mahmoud, M.; Abouelresh, M.; Abdulraheem, A.; Ali, A. Determination of the total organic carbon (TOC) based on conventional well logs using artificial neural network. Int. J. Coal Geol. 2017, 179, 72–80. [Google Scholar] [CrossRef]
  11. He, T.H.; Li, W.H.; Lu, S.F.; Yang, E.Q.; Jing, T.T.; Ying, J.F.; Zhu, P.F.; Wang, X.Z.; Pan, W.Q.; Zhang, B.S.; et al. Quantitatively unmixing method for complex mixed oil based on its fractions carbon isotopes: A case from the Tarim Basin, NW China. Pet. Sci. 2023, 20, 102–113. [Google Scholar] [CrossRef]
  12. Wang, H.; Wu, W.; Chen, T.; Dong, X.; Wang, G. An improved neural network for TOC, S1 and S2 estimation based on conventional well logs. J. Pet. Sci. Eng. 2019, 176, 664–678. [Google Scholar] [CrossRef]
  13. Roland, F. Beers. Radioactivity and Organic Content of Some Paleozoic Shales. AAPG Bull. 1945, 29, 1–22. [Google Scholar]
  14. Swanson, V.E. Oil Yield and Uranium Content of Black Shales; United States Geological Survey: Washington, DC, USA, 1960. [Google Scholar]
  15. Passey, Q.R.; Creaney, S.; Kulla, J.B.; Moretti, F.J.; Stroud, J.D. A Practical Model for Organic Richness from Porosity and Resistivity Logs. AAPG Bull. 1990, 74, 1777–1794. [Google Scholar]
  16. Zhu, G.; Jin, Q.; Zhang, L. Using Log Information to Analyze the Geochemical Characteristics of Source Rocks in Jiyang Depression. Well Logging Technol. 2003, 27, 104–109, 146. [Google Scholar]
  17. Mendelzon, J.D.; Nafi Toksoz, M. Source Rock Characterization Using Multivariate Analysis of Log Data. In Proceedings of the SPWLA 26th Annual Logging Symposium, Dallas, TX, USA, 17–20 June 1985. [Google Scholar]
  18. Kamali, M.R.; Mirshady, A.A. Total organic carbon content determined from well logs using ΔLogR and Neuro Fuzzy techniques. J. Pet. Sci. Eng. 2004, 45, 141–148. [Google Scholar] [CrossRef]
  19. He, X.; Chen, S.; Hu, C.; Zhang, H.; Mou, F.; Dai, L.; Lu, Y.; Fu, X.; Han, M. Pore Structure Change in the Continental Shale Oil Reservoir and Its Main Influencing Factors: A Case Study of the Chang 7 Member in the Ordos Basin. Processes 2023, 11, 2314. [Google Scholar] [CrossRef]
  20. Chen, R.; Wang, F.; Li, Z.; Evans, N.; Chen, H. Detrital zircon geochronology of the Permian Lower Shihezi Formation, northern Ordos Basin, China: Time constraints for closing of the Palaeo-Asian Ocean. Geol. Mag. 2022, 159, 1601–1620. [Google Scholar] [CrossRef]
  21. Song, L.-J.; Wang, Z.-Z. Late Triassic tectonic stress field of the southwestern Ordos Basin and its tectonic implications: Insights from finite-element numerical simulations. Geosphere 2023, 19, 770–781. [Google Scholar] [CrossRef]
  22. Zhu, H.; Chen, K.; Liu, K.; He, S. A sequence stratigraphic model for reservoir sand-body distribution in the Lower Permian Shanxi Formation in the Ordos Basin, northern China. Mar. Pet. Geol. 2008, 25, 731–743. [Google Scholar] [CrossRef]
  23. Zheng, W.; Hu, X.; Chen, S.; Liu, J.; Jia, C. Characteristics of sedimentary evolution in the Upper Paleozoic Daniudi Gasfield, Ordos Basin. Acta Sedimentol. Sin. 2015, 33, 306–313. [Google Scholar]
  24. Greb, S.F.; Chesnut Jr, D.R. Lower and lower Middle Pennsylvanian fluvial to estuarine deposition, central Appalachian basin: Effects of eustasy, tectonics, and climate. Geol. Soc. Am. Bull. 1996, 108, 303–317. [Google Scholar] [CrossRef]
  25. Burton, Z.F.; McHargue, T.; Kremer, C.H.; Bloch, R.B.; Gooley, J.T.; Jaikla, C.; Harrington, J.; Graham, S.A. Peak Cenozoic warmth enabled deep-sea sand deposition. Sci. Rep. 2023, 13, 1276. [Google Scholar] [CrossRef]
  26. Chen, Z.; Li, X.; Chen, H.; Duan, Z.; Qiu, Z.; Zhou, X.; Hou, Y. The Characteristics of Lithofacies and Depositional Model of Fine-Grained Sedimentary Rocks in the Ordos Basin, China. Energies 2023, 16, 2390. [Google Scholar] [CrossRef]
  27. Meng, D.W.; Jia, A.L.; Ji, G.; He, D.B. Water and gas distribution and its controlling factors of large scale tight sand gas fields: A case study of western Sulige gas field, Ordos Basin, NW China. Pet. Explor. Dev. 2016, 43, 663–671. [Google Scholar] [CrossRef]
  28. Mou, C.G.; Hu, Z.J.; Bai, J.W.; Zhang, H.J. The causes and prevention of gas hydrate measures in Sulige gasfield. Petrochem. Ind. Appl. 2009, 28, 41–45. [Google Scholar]
  29. Elkatatny, S. A self-adaptive artificial neural network technique to predict total organic carbon (TOC) based on well logs. Arab. J. Sci. Eng. 2019, 44, 6127–6137. [Google Scholar] [CrossRef]
  30. Kilian, L. The impact of the shale oil revolution on US oil and gasoline prices. Rev. Environ. Econ. Policy 2016, 10, 185–205. [Google Scholar] [CrossRef]
  31. Pang, X.; Chen, Z.; Lerche, I. Uncertainty analysis and the relative contributions of geological factors for the Qingshankou source rocks in the North Songliao Basin, northeastern China. Nonrenew. Resour. 1977, 6, 263–271. [Google Scholar] [CrossRef]
  32. Tan, M.; Liu, Q.; Zhang, S. A dynamic adaptive radial basis function approach for total organic carbon content prediction in organic shale. Geophysics 2013, 78, D445–D459. [Google Scholar] [CrossRef]
  33. Zhu, L.; Zhang, C.; Zhang, C.; Wei, Y.; Zhou, X.; Cheng, Y.; Huang, Y.; Zhang, L. Prediction of total organic carbon content in shale reservoir based on a new integrated hybrid neural network and conventional well logging curves. J. Geophys. Eng. 2018, 15, 1050–1061. [Google Scholar] [CrossRef]
  34. Wang, J.-X.; Sun, P.-C.; Liu, Z.-J.; Xu, Y.-B.; Li, L. Evaluation of oil shale resources based on geochemistry and logging in Tuanyushan, Qaidam Basin, Northwest China. Oil Shale 2020, 37, 188–206. [Google Scholar] [CrossRef]
  35. Herrson, S.; Letendre, I.; Dufour, M. Source rock evaluation by sonic log and seismic velocity analysis in parts of upper Assam Basin, India. Org. Geochem. 1995, 23, 871–879. [Google Scholar]
  36. Chen, Z.; Jiang, C. A revised method for organic porosity estimation using Rock-Eval pyrolysis data, example from Duvernay Shale in the Western Canada Sedimentary Basin. AAPG Bull. 2016, 100, 405–422. [Google Scholar] [CrossRef]
  37. Liu, R.; Guo, S.; Wang, J. TOC calculation model of source rocks: Case study from Taiyuan-Shanxi formations in Ordos Basin. Nat. Gas Geosci. 2020, 31, 1628–1636. [Google Scholar]
  38. Guo, Q.; Jiang, S.; Wang, J.; Zhou, Q.; Gao, Y.; Ye, L.; Yin, J. Prediction of hydrocarbon source rock distribution using logging curves: A case study of Es32 source rock in Nanpu Sag, Huanghua depression, Bohai Bay Basin. Front. Earth Sci. 2023, 10, 1097806. [Google Scholar] [CrossRef]
  39. Kang, H.Q. Controlling factors of hydrocarbon source rock development in the Madingo Formation of the Lower Congo Basin and its control on hydrocarbon formation. China Offshore Oil Gas 2021, 33, 11–24. [Google Scholar]
  40. Hou, Z.P.; Pang, X.Q.; Ouyang, X.C.; Zhang, B.; Shen, W.; Guo, F.; Wang, W. Upper limit of maturity for hydrocarbon generation in carbonate source rocks in the Tarim Basin Platform, China. Arab. J. Geosci. 2015, 8, 2497–2514. [Google Scholar]
  41. Huang, W.B.; Hersi, O.S.; Lu, S.F.; Deng, S. Quantitative modelling of hydrocarbon expulsion and quality grading of tight oil lacustrine source rocks: Case study of Qingshankou 1 member, central depression, Southern Songliao Basin, China. Mar. Pet. Geol. 2017, 84, 34–48. [Google Scholar] [CrossRef]
  42. Peters, K.E. Guidelines for evaluating petroleum source rock using programmed pyrolysis. AAPG Bull. 1986, 70, 318–329. [Google Scholar]
  43. Peters, K.E.; Cassa, M.R. Applied source rock geochemistry. In The Petroleum System-From Source Rock to Trap; Magoon, L.B., Dow, W.G., Eds.; AAPG Memoir: Houston, TX, USA, 1994; Volume 60, pp. 93–120. [Google Scholar]
  44. Chen, J.; Chen, J.; Ni, Y.; Fan, M.; Liao, F.; Wei, J.; Han, Y. The origin and source of crude oils in the Jiuxi depression, Jiuquan Basin. Acta Pet. Sin. 2019, 40, 761–776. [Google Scholar]
Figure 1. Highly generalized tectonic map of the Ordos Basin study area.
Processes 11 03214 g001
Figure 2. A105 well mudstone shale stratigraphy. (a) Lithology: gray-brown shale, characteristics: calcareous streaks and vertical microfractures. (b) Lithology: gray-brown shale, characteristics: cracks visible crude oil.
Processes 11 03214 g002
Figure 3. Volume models for hydrocarbon source and non-hydrocarbon source rocks.
Processes 11 03214 g003
Figure 4. (a) The relationship between measured TOC and natural gamma. (b) The relationship between measured TOC and resistivity. (c) The relationship between measured TOC and acoustic time difference. (d) The relationship between measured TOC and density.
Processes 11 03214 g004
Figure 5. Scatter plot of calculated and measured organic carbon content in the Sulige region (Jinqiang method).
Processes 11 03214 g005
Figure 6. Logging curve of well AB49-25.
Processes 11 03214 g006
Figure 7. Radar analysis of TOC values in well AB49-25. The red numbers represent the axes indicating the TOC values (wt.%) of the data points.
Processes 11 03214 g007
Figure 8. The value distribution range of 185 TOC data sample points.
Processes 11 03214 g008
Table 1. TOC laboratory data sample points.
Well NameSectionDepth (m)TOC (wt.%)R (Ω·m)Δt (μs/m)D (g/cm3)
A105Shan 23612.172.8353.692212.1532.662
A105Shan 23615.283.6267.330218.6152.674
A105Shan 23622.732.7858.026221.3852.691
A105Shan 23633.341.7656.962240.0492.426
A148Shan 13694.110.5742.885232.062.570
A148Shan 13713.711.5642.801213.4082.642
A148Shan 13715.112.4157.285224.0282.586
A148Shan 13716.287.49138.482205.4872.238
A148Shan 13722.125.2287.184217.5482.643
A148Shan 13726.354.7185.274223.8452.683
A180Shan 13691.740.8247.813235.4682.553
A180Shan 13694.223.4167.185221.5742.674
A180Shan 13696.713.1264.025223.1532.651
A180Shan 13697.184.8287.115224.2742.648
A180Shan 13700.312.4951.283215.0842.693
A180Shan 13704.422.8687.886209.0352.678
Table 2. Calculated TOC for well AB49-25.
Depth (m)GR (API)AC (μs/m)HLLD (Ω·m)DEN (g/cm3)a × lg (HLLD)
+ b × AC + c
TOC (wt.%)Sandstone or Borehole
3231157.536242.37531.0012.647−1.684−0.636Borehole
3233153.291240.49024.3902.334−4.277−1.832Borehole
3235128.244227.34040.3942.7602.3270.843
3237135.987206.34688.2952.76112.6054.565
323996.138205.56559.4832.6598.1793.076
3241141.975238.56534.7222.706−0.143−0.053Borehole
3243134.064222.13841.5812.7303.0051.101
3245120.587218.62667.3302.6928.7063.234
324797.698200.332121.9952.71216.6746.148
3249118.197218.77146.2222.6794.4311.654
3251105.059198.740100.9182.63314.6315.557
3253141.411234.78935.8622.7370.4770.174
3255152.738239.35032.0722.606−1.096−0.421Borehole
3257149.449240.60837.3282.7330.5400.198
3259128.134224.49960.3722.6707.0742.649
3261132.278208.35758.9022.6877.8802.933
3263152.161233.41436.5022.6470.7700.291
3265109.142218.176140.2202.66417.0536.401
3267155.075227.66723.4112.620−3.879−1.481Borehole
3269120.272220.972106.5512.71213.7525.071
3271142.313310.676192.5222.23714.4286.450Borehole
3273145.433216.70782.6542.68511.1594.156
3275188.066209.11282.9012.57511.7044.545
3277140.628218.64064.8152.7118.2733.052
3279146.027210.23681.6932.72211.4624.211
328181.564204.69172.8752.65810.5403.965Sandstone
328357.245226.46233.4782.5730.2570.100Sandstone
3285135.051215.96284.2732.71711.4294.207
3287149.990230.053102.0992.70412.6574.681
3289111.051211.921192.7102.70421.0797.795
3291159.580254.866259.5572.15921.5679.990Sandstone
3293156.723237.23652.0782.7044.5421.680
3295132.585225.80181.9432.71310.4503.852
329787.386207.33868.5512.6349.6683.671Sandstone
3299118.378208.90553.4182.5656.7352.626
Table 3. Statistical analysis of TOC values.
Well Name<2 wt.%≥2 wt.%Data Range (wt.%)SampleTOC Calculation of Average Values (wt.%)TOC Measured in Core Experiments (wt.%)Absolute Error (%)Percent Error (%)
AB49-256190.174~7.795253.3383.190.1484.368
AB59-065200.236~8.366253.6493.750.1012.768
AB61-048140.234~6.445223.1402.840.39.554
AB61-48490.595~6.656133.3693.160.2096.203
AB66-016130.045~4.509192.6482.530.1184.456
AB70-054100.987~7.270143.9023.770.1323.383
AB68-097110.885~6.471182.3762.380.0040.168
AB43-5780.299~8.157153.2003.130.072.188
AB44-361170.009~5.367182.2212.140.0813.65
AB72-094121.158~4.132182.5292.630.1013.994
Overall analysis621230.009~8.3661853.0422.960.0822.70
Table 4. Organic carbon content classifies mudstone and carbonate oil-generating potential (according to Jianping Chen [44]).
Oil Generating PotentialMudstoneCarbonate
Bad<0.5<0.12
Medium0.5~1.00.12~0.25
Good1.0~2.00.25~0.50
Very good2.0~4.00.50~1.00
Excellent4.0~8.01.00~2.00
Disclaimer/Publisher’s Note: The statements, opinions and data contained in all publications are solely those of the individual author(s) and contributor(s) and not of MDPI and/or the editor(s). MDPI and/or the editor(s) disclaim responsibility for any injury to people or property resulting from any ideas, methods, instructions or products referred to in the content.

