Abstract
Ultra-low permeability argillaceous sandstone reservoirs have become a significant focus for exploration and development. Saturation is a crucial parameter in evaluating such reservoirs. Due to the low porosity, low permeability, complex pore structure, and strong heterogeneity in ultra-low permeability argillaceous sandstone reservoirs, traditional evaluation methods are unable to achieve the required level of interpretation accuracy. To improve the accuracy of gas saturation calculations in ultra-low permeability argillaceous sandstone gas reservoirs, the conductivity characteristics of the ultra-low permeability argillaceous sandstone gas reservoirs in the Huangliu Formation in the Dongfang area, China, were analyzed through rock physics experimental data and geological information. The results revealed the clay content in the study area to range from 6% to 33.4%. Influenced by burial depth and temperature, kaolinite and montmorillonite transform into illite and chlorite, and the cation exchange capacity is not correlated with the clay content. This suggests that the effects of cation-attached conductivity can be ignored. The regional variation in rock electrical parameters is significant. When the lithology coefficient is a = 1, the consolidation index m varies between 1.25 and 1.75. When the lithology coefficient is b = 1, the saturation index n varies between 1.6 and 1.96. Under the influence of high temperature and pressure, the reservoirs in the study area exhibit two distinct characteristics on the capillary pressure curve, fractal dimension, and effective porosity index intersection diagram, (1) In Class I reservoirs, there is a strong correlation between the formation factor and natural gamma, as well as porosity, and a logarithmic relationship between the saturation exponent and the formation factor; and (2) in Class II reservoirs, there is a strong power-law relationship between the formation factor and porosity, as well as a logarithmic relationship between the saturation exponent and formation factor. Based on experimental and logging data, reservoir classification was conducted using core-scale logging and principal component analysis. Additionally, a saturation interpretation model was developed using multivariate regression, based on rock electrical parameters. The actual application results demonstrate that compared to the fixed rock resistivity saturation model, this model has reduced the average absolute error by 5.9%. The calculated values are consistent with the gas saturation analysis of the core at the pure gas section as determined by cable testing sampling. This model meets the requirements of practical production. The study of this interpretation method is of great significance for the formulation of development plans for ultra-low permeability offshore argillaceous sandstone gas reservoirs.
1. Introduction
With the continuous advancement of oil and gas exploration and production technologies, more and more unconventional oil and gas resources are being included in the energy mix. Tight sand gas, as a type of unconventional oil and gas, has become an indispensable part of China’s energy structure [1]. Currently, China’s technically recoverable resources of tight sand gas have reached 11 × 1012 m3 [2]. Particularly, the Huangliu Formation in the Dongfang gas field of the Yinggehai Basin has significant development potential. Compared to conventional sandstone, the low-permeability mudstone in the Huangliu Formation shows significant variations in reservoir characteristics and well logging responses [3]. Its poor physical properties, strong heterogeneity, and complex pore structures present significant challenges for evaluating reservoir parameters.
In oil and gas reservoir exploration and development, saturation is a crucial parameter for evaluating reservoirs and calculating reserves [4]. Obtaining saturation through core experiments is the most effective method. However, due to considering the lengthy development cycle of exploration wells and the actual production costs, the amount of available core data is limited. On the other hand, oilfield logging data are abundant and offers the advantages of strong vertical continuity and high resolution [5]. Therefore, establishing a saturation interpretation model based on the combination of experimental data and logging data is a widely used method. Among the models used to evaluate reservoir saturation using logging data, the Archie equation [6] is the most commonly applied. The key lies in accurately determining the electrical parameters a, b, m, and n. Scholars both domestically and internationally have conducted extensive research on the influencing factors and methods of these four parameters. Wyllie and Gregory [7] believed that the size of the m value is related to the shape of the rock framework particles. Jackson et al. [8], Ransom [9], in addition to the shape of the rock framework particles, m is also influenced by factors such as sorting and grain size. Knight and Endres [10] pointed out that the pore structure of the rock affects m. Based on the analysis of the factors influencing m, Borai [11], Focke and Munn [12], Saha et al. [13], and Mao Zhiqiang [14] proposed different methods for calculating m using macroscopic physical parameters based on different core experimental data. In comparison with the cementation index, the saturation index n is not only affected by the pore structure but also by the fluid distribution in the pores [15,16,17,18,19,20]. Maute et al. [21] proposed a method for calculating the saturation index n using standard resistivity measurements. Aldoleimi [22] established a method for determining the saturation index n based on logging and core data regression. Kumar et al. [23] proposed a method for calculating the saturation index n based on digital core and numerical simulation.
In terms of practical applications, the Archie formula has been proved suitable for pure sandstone reservoirs with high porosity and good permeability. For reservoirs with complex pore structures, such as ultra-low-permeability argillaceous sandstones, non-Archie phenomena may occur in the rock-electricity relationship. To explain the nonlinear characteristics between the conductivity of water-saturated rocks (Co) and the conductivity of formation water (Cw), the concept of mud conductivity is proposed. Patnode and Wyllie [24] were the first to propose an empirical model to describe the additional conductivity of mud. However, the model lacked a theoretical basis and did not consider the influence of mud volume on conductivity. Dewitte [25] suggested that mud was dispersed in the pore space, and the conductivity of rocks resulted from the parallel connection of mud conductivity and sandstone conductivity. The author proposed a binary model that accounted for the mud volume Vsh and mud conductivity Csh. The value of Sw determined from this model is relatively low and can even be negative for high mud-content formations. Simandoux [26] expressed mud additional conductivity as Vsh2·Csh based on experimental results of sandstone–clay mineral mixtures. However, these models only describe the linear growth portion of the straight line component, namely, of Co and Cw at high Cw values. To describe the curved component of Co and Cw at low Cw values, Poupon and Leveaux [27] proposed the Indonesian formula, which is applicable to argillaceous sandstones with low-salinity formation water and high mud content.
The rock cation exchange capacity (Qv) model suggests that the additional conductivity of reservoir rocks is caused by the exchangeable cations in the rocks. Hill and Milburn [28] measured the electrochemical potential and resistivity of over 300 samples of argillaceous sandstone cores with different lithologies under varying formation water salinities. Their experiments revealed that the influence of clay minerals on the electrical properties of reservoir rocks is related to the rock’s cation exchange capacity. The aforementioned previous literature has laid the foundation for the subsequent establishment of cation exchange conductivity models. Following this, Waxman and Smits [29], as well as Waxman and Thomas [30], built upon the results of Hill and Winsauer to establish the well-known Waxman–Smits equation (referred to as the W–S model) through experiments and systematic theoretical analysis. Clavier et al. [31], based on the theory of diffusion double layers, reported that there are no anions in the double layer, and thus proposed a dual water model in which free and bound water in clay are connected in parallel for conductivity. Silva and Bassiouni [32], building upon the W–S model and the dual water model, proposed an improved conductivity model for argillaceous sandstone, also known as the S–B model.
In summary, the traditional Archie formula has significant limitations for low-permeability mudstone reservoirs with complex pore structures. Methods based on pore and conductivity mechanisms are greatly limited in practical application due to challenges in solving various theoretical parameters. As a result, many of these methods remain in the theoretical stage and are difficult to implement in actual production. Therefore, this paper focuses on the Huangliu Formation in the A well area of the Dongfang gas field as the research subject. Through cation exchange experiments, the impact of cation exchange on conductivity laws is investigated, and the reservoir is categorized based on geological data and experimental data, such as mercury injection. Through the use of core-scale logging technology and principal component analysis, a methodology for the continuous classification of reservoirs is implemented. The study focuses on the variation in formation factors and saturation index based on classification, thus avoiding the need to select bond index values. The traditional Archie formula has been enhanced, and a new approach based on the variation in rock electrical parameters and saturation models for different types of reservoirs is proposed, along with logging responses. Compared to traditional saturation models, the accuracy of the model is significantly improved, and it holds particular significance for guiding the exploration and development of such reservoirs.
2. Geological Setting
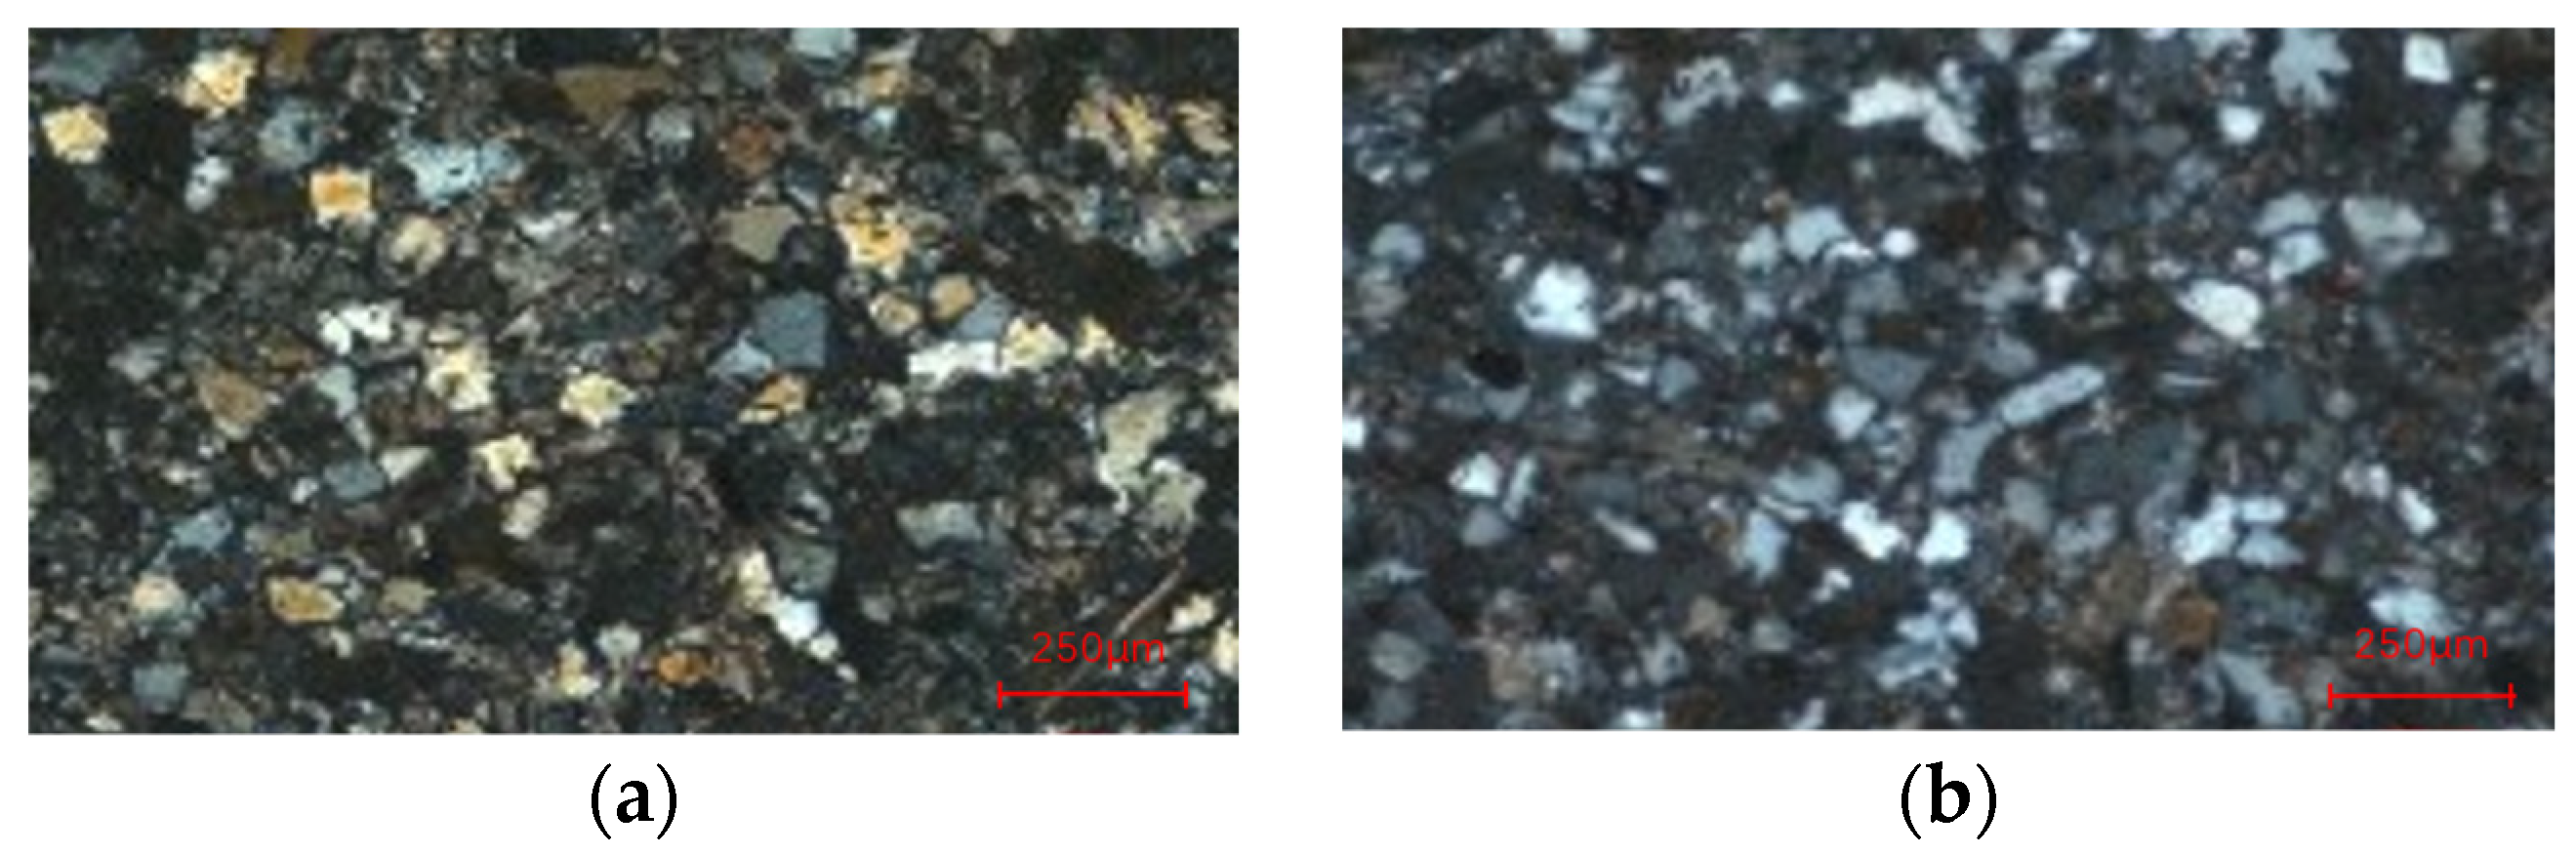
The Yinggehai Basin is situated in the Yinggehai Sea area between the Hainan Province of China and Vietnam, with an overall north–northwest trending distribution. It is a newly developed tectonic-transforming and stretching-type oil and gas basin in the western region of the northern South China Sea continental shelf [33]. It is a young, rapidly subsiding, and deeply sedimented tertiary basin with characteristics of extremely high temperature and pressure, and well-developed mud-bottom structures [34]. The research objective of the Huangliu Formation (N1h) is part of the T40-T30 sequence of the Neogene period [35], as shown in Figure 1, with the A well area being the primary focus of the research. The Dongfang gas field is affected by dual source systems from Hainan Island and Vietnam, leading to significant variations in the spatial layout and reservoir quality of the sedimentary system in the area [36]. As depicted in Figure 2a,b, the thin section data of the target layer in the study area indicate that the predominant lithology consists of siltstone and mudstone siltstone. X-ray diffraction experimental data indicate that the mineral composition of the reservoir in the study area is complex. It is mainly composed of quartz (36.4–87%), orthoclase (1–23.4%), plagioclase (2.9–27%), calcite (1–17%), dolomite (1.1–7%), anhydrite (2–17%), siderite (1–2%), and barite (1–3%), as well as clay minerals (6–33.4%). The rock particle size ranges from 4 to 7.5 φ. There are significant differences in physical properties. Porosity is typically distributed between 11% and 18%, with an average value of 13.8%. Permeability is typically distributed between (0.01–10) × 10−3 μm2, with an average value of 1 × 10⁻³ μm2. Medium-pore and low-permeability to extra-low-permeability reservoirs are the main types. The micro-pore characteristics are significantly different, with pore throats mainly distributed in the range of 0.1–8.0 μm, and the average throat radius mainly distributed in the range of 0.2–3.0 μm, indicating a fine throat level.
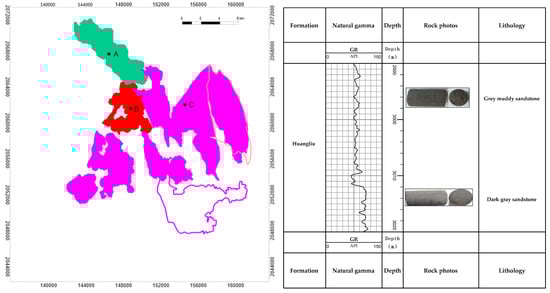
Figure 1.
Geological overview map and core description of the study area: Block A is the research area; Block B is the area for wells 1-14; Block C is the area for well 13-1.
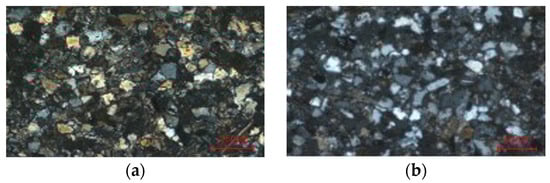
Figure 2.
Characteristics of compaction and cementation in the Huangliu Formation reservoir: (a) Well D14, at a depth of 2948.5 m, consists mainly of siltstone with well-sorted clastic particles, including fine sand and a small amount of mudstone and very fine sand. The sample shows significant compaction, with the spaces between the grains filled with a mud matrix and calcite cement. The rock porosity is extremely low; (b) well D14, at a depth of 2970.5 m, is primarily composed of muddy siltstone with well-sorted clastic particles, including fine sand and some mudstone. The mudstone is formed in layers or bands. The sample shows significant compaction, with point-line contacts between the clastic particles as the main feature. Cementation is relatively weak at this depth, and intergranular pores are more common. The rock has relatively low porosity.
3. Materials and Methods
3.1. Archie Equation for Water Saturation
The Archie equation establishes the relationship between water saturation and formation variables [37]. Based on experiments with pure sandstone, geological factors F and the resistivity exponent I were introduced, as shown in Equations (1) and (2). These equations were combined to derive the classic Archie equation, as shown in Equation (3).
where F is the formation factor, dimensionless; I is the resistance increase coefficient, dimensionless; a and b are coefficients related to lithology, dimensionless; m is the cementation index, dimensionless; n is the saturation exponent, dimensionless; , and are the resistivities of fully saturated formation, formation water, and the rock matrix, respectively, measured in Ω·m; is water saturation, %; is porosity, %.
3.2. Petrophysical Test
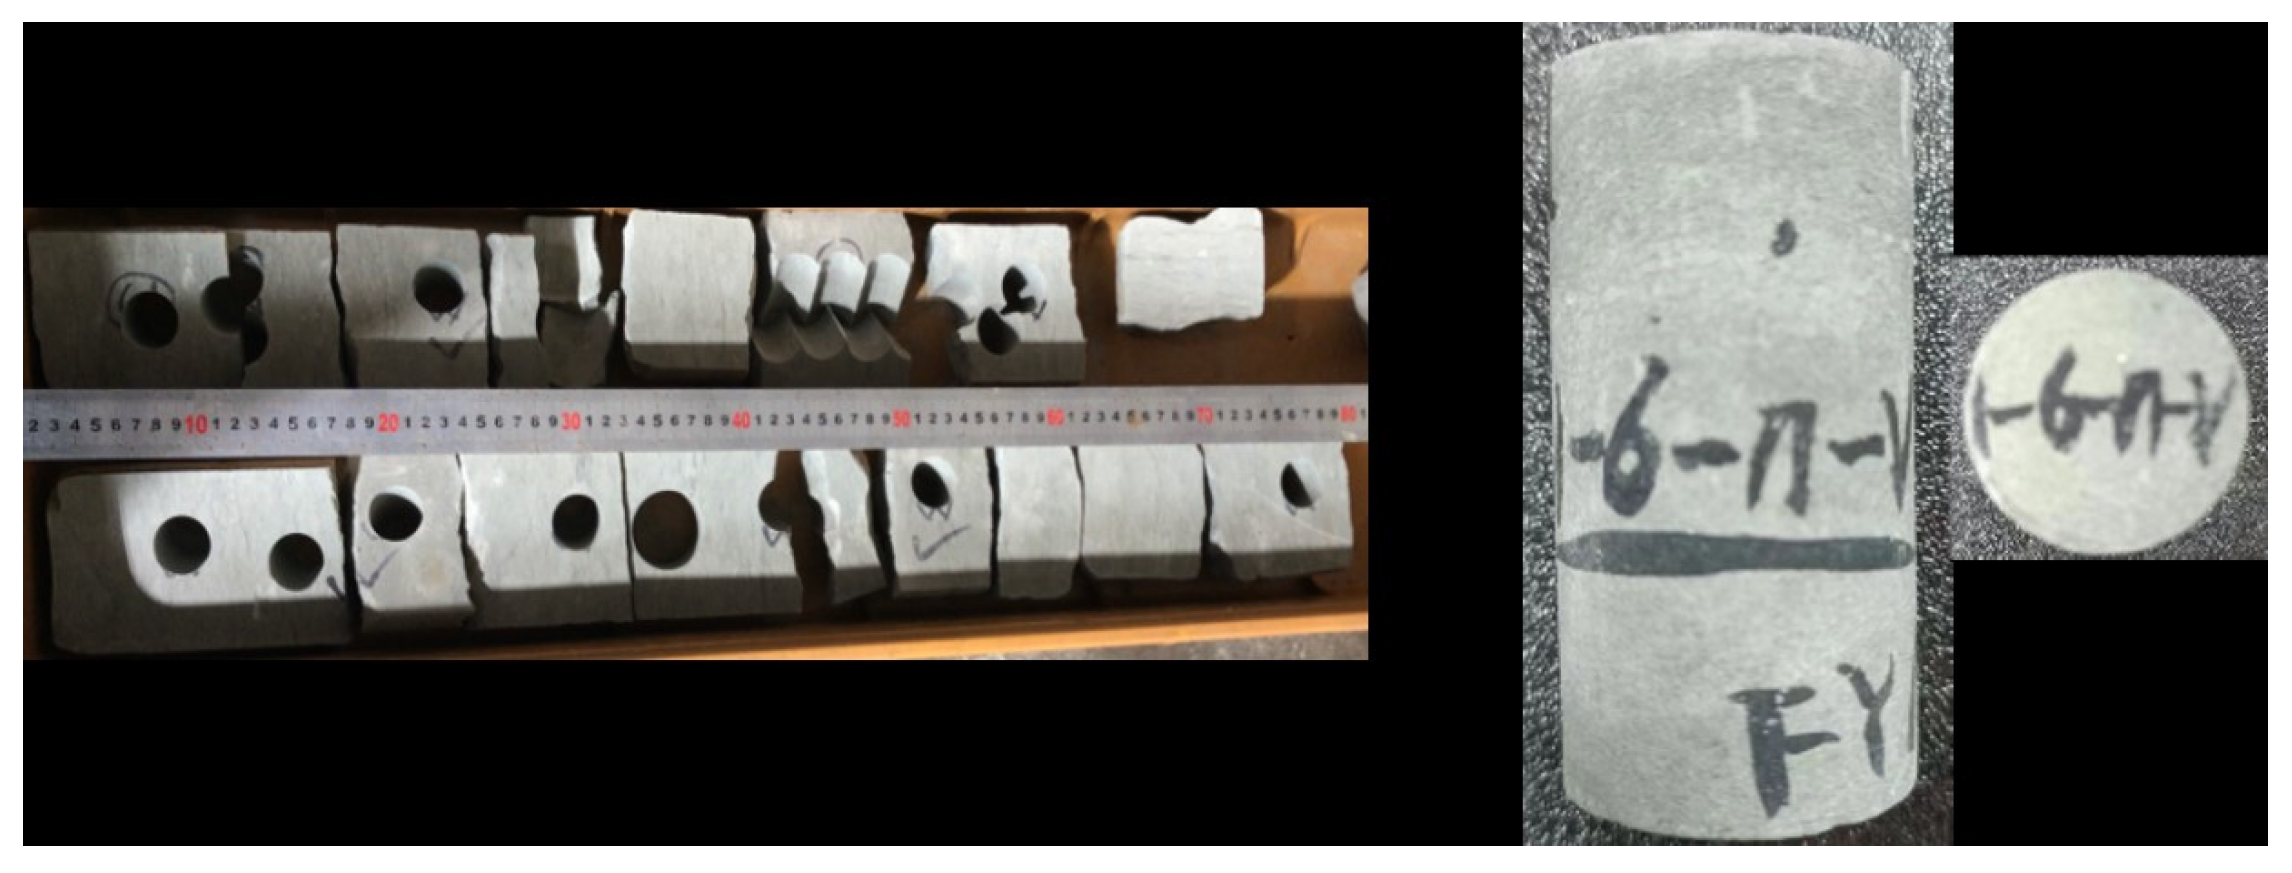
A study was conducted using core and logging data from three wells in the Huangliu Formation of well area A in the eastern gas field of the Yinggehai Basin. Sampling is conducted by drilling and coring. As depicted in Figure 3, after retrieving the core, cylindrical rock samples with a diameter of 2.5 cm and a length of 4.5 cm are drilled at various depths.
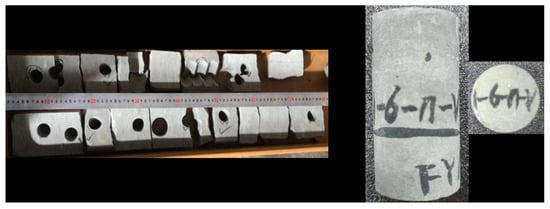
Figure 3.
Photographs of rock samples.
3.2.1. Cation Exchange Capacity Experiment
Six representative samples were uniformly selected from the study area for cation exchange capacity experiments. The cation exchange capacity was calculated as follows:
where CEC represents cation exchange capacity in cmol/kg; c represents the concentration of the hydrochloric acid standard titration solution, mg/L; V is the volume of hydrochloric acid standard titration solution consumed by the titrated sample solution in mL; V0 represents the volume of hydrochloric acid standard titration solution consumed by the blank solution in mL; and m denotes the mass of the oven-dried test liquid in grams.
3.2.2. Rock Electrical Experiment
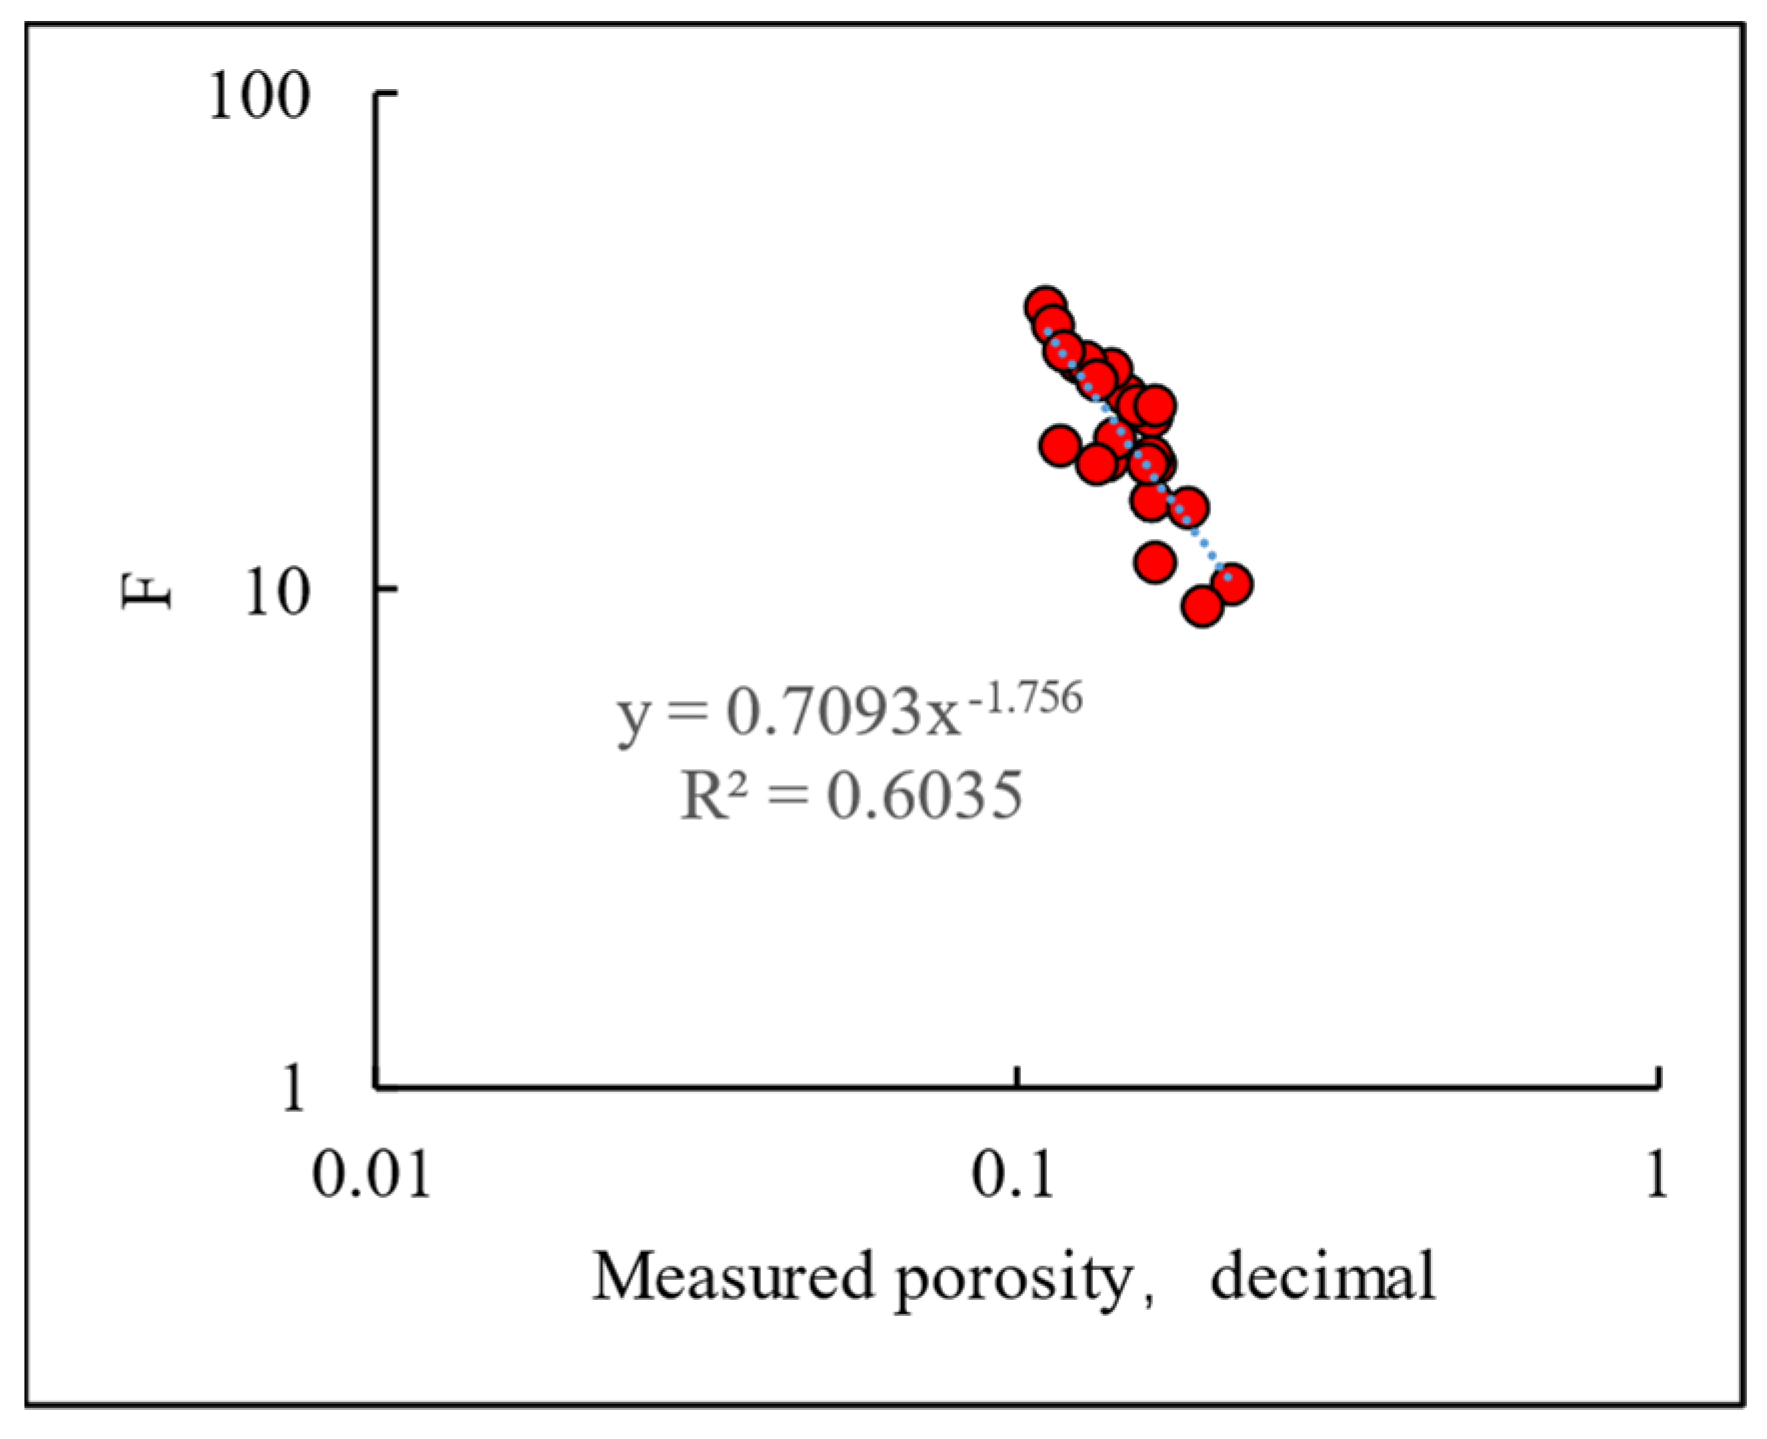
A total of 30 rock samples from three wells in the study area were uniformly selected for resistivity experiments to investigate the relationship between the formation factor and porosity. The experimental instrument used was the SCMS-E type high-temperature and high-pressure rock core multi-parameter measurement system. The experimental conditions included a formation water salinity of 14,000 mg/L, a testing temperature of 110 °C, and a testing pressure of 20 MPa. The experimental data for the formation factor and porosity were fitted using Equation (1).
3.2.3. Capillary Pressure Experiment
The variation in pore structure plays a crucial role in influencing reservoir types, and capillary pressure is primarily influenced by the pore structure of the reservoir, rather than the properties of the fluid. A total of 27 rock cores from this interval were uniformly selected, and a YG-II high-pressure porosimeter was used to measure the capillary pressure of the rock cores in accordance with the Rock Capillary Pressure Measurement [38].
3.2.4. Nuclear Magnetic Resonance Experiment
Rock nuclear magnetic resonance experiment is a non-destructive method used to detect rock structure and composition. It plays a crucial role in the study of rock pore structure, permeability, and the distribution of oil and gas. In addition to conducting capillary pressure experiments, we also performed rock NMR experiments on 27 sets of selected core samples. The instrument used was the MicroMR02-050v NMR tight rock core analyzer, and the measurement principle followed the “Practices For Core Analysis” [39].
The testing equipment is manufactured by Newmay Electronic Technology Co., Ltd. in Chengdu, China.
3.3. Reservoir Classification Method Based on Rock Physics Experiments
In this paper, a new parameter called the effective porosity index was defined based on the experimental results of core nuclear magnetic resonance to better characterize the differences between reservoirs.
where φi represents the bound water porosity measured by nuclear magnetic resonance experiments; φt denotes the total water-filled porosity measured by nuclear magnetic resonance experiments; Swi stands for the bound water saturation; and E represents the effective porosity index.
He Chengzu et al. [40] reported that reservoir rocks exhibit good fractal characteristics within the scale range of 0.2 to 50 μm. Based on fractal geometric principles, the authors derived the following fractal formula for capillary pressure curves:
where Sw is the saturation of the wetting phase in the reservoir, %; Pc is the capillary pressure, MPa; Pmin is the capillary pressure corresponding to the maximum pore size in the reservoir, MPa; and D is the fractal dimension.
The pore space of rocks displays fractal characteristics, and a higher fractal dimension indicates greater reservoir heterogeneity. Various pore spaces exhibit different fractal dimensions as a result of variations in sedimentation and diagenetic processes. Using the fractal dimension and effective porosity index obtained from core experiments, a cross-plot diagram is constructed. Next, the reservoirs in the study area are classified using a cross-plot diagram.
3.4. Reservoir Classification Method Based on Rock Physics Experiments and Well Logging Data
Rock physics experiments are expensive, operationally complex, and time-consuming. Relying solely on core experiments to classify reservoirs may not meet the practical production requirements. Well logging data are relatively easy to obtain, but there are often multiple parameters that influence reservoir characteristics. Conventional cross-plot methods are challenging to use for reservoir classification. Principal Component Analysis (PCA) can effectively enhance reservoir identification speed, reduce spatial dimensions, and decrease data processing requirements by extracting the main components from the original feature curves. Based on the classification from rock physics experiments, this study utilizes IBM SPSS Statistics 26 for principal component analysis to extract two characteristic variables that can reflect reservoir differences and classify the reservoirs.
Principle of Principal Component Analysis
Principal component analysis uses orthogonal transformations to reduce the dimensionality of multivariate parameters, aiming to retain as much information from the original parameters as possible in the resulting principal components. It also aims to provide an accurate description of the original issue or problem. When describing a geological problem using multiple-dimensional well logging parameters, we assume that the geological problem is represented by m characteristic variables, X1, X2, ..., Xm, with interrelationships between the variables. Therefore, using only a single variable cannot fully represent the geological problem. Through principal component analysis, we obtain n new parameters, Y1, Y2, ..., Yn (where n < m), where Yi is a linear combination of X1, X2, ..., Xm. More specifically, Yi = m1 X1 + m2 X2 + ... + mm Xm represents the ith principal component after reducing the dimensionality. By processing the principal components, the original set of m variables is transformed into n variable groups, aiming to achieve dimensionality reduction [41].
Choose the well logging curves that exhibit significant variations in reservoirs as the original variables for principal component analysis. First, standardize the well logging curves and then normalize them according to Equation (8). Next, perform PCA on the normalized data, and use IBM SPSS Statistics 26 software to calculate the eigenvalues of the normalized sample data. Based on the results of principal component analysis, a comprehensive principal component that encapsulates the information from the original variables is extracted, and the expression of this principal component is obtained. The well logging data corresponding to the depth of the capillary pressure experiment, nuclear magnetic resonance experiment, and petrophysical experiment cores is extracted using CIFLog3.0 software and then normalized. The comprehensive principal component’s corresponding values are calculated using the extracted principal component equation.
where y is the normalized value, x is the original value, and xmin and xmax are the minimum and maximum values of the original value, respectively.
4. Results
4.1. Analysis of Rock Physics Test Results
The cation exchange capacity experiment reveals that the pH value of the groundwater in the area is greater than 7. Due to the high temperature and high-pressure effects, the primary conductive clay minerals are illite and chlorite, with contents of 39.5% and 30.5%, respectively. Figure 4 shows the cross-plot between cation exchange capacity and clay content. The figure illustrates that there is no correlation between the cation exchange capacity and clay content. Additionally, the effect of clay-associated conductivity on resistivity can be disregarded.
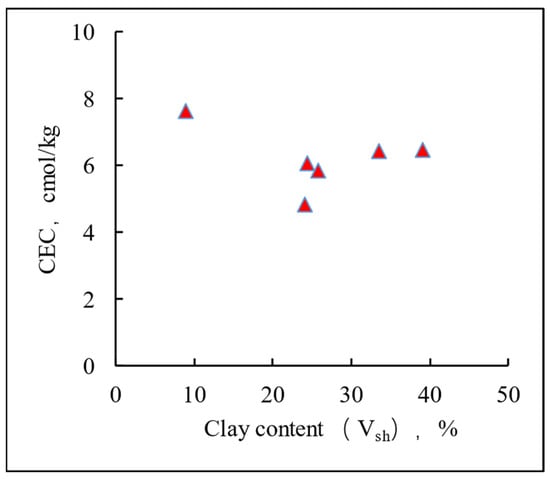
Figure 4.
Intersection plot of clay content and cation exchange capacity.
Upon analyzing the experimental data on rock resistivity, it is concluded that the electrical parameters of the rocks in the study area exhibit a wide range of variations. When a = 1, the cementation exponent m ranges from 1.25 to 1.75, and when b = 1, the saturation exponent n ranges from 1.6 to 1.96. The fitted relationship between formation factors and porosity obtained from the experiment is given by F = 0.7093/φ1.756, with an value of 0.6035. From the intersection plot of core porosity and formation factors in Figure 5, is evident that the correlation between the two variables is not satisfactory. The comprehensive analysis of the variation pattern of formation factors may introduce errors and impact the accuracy of saturation interpretation.

Figure 5.
Cross-plot of core porosity and formation factor F.
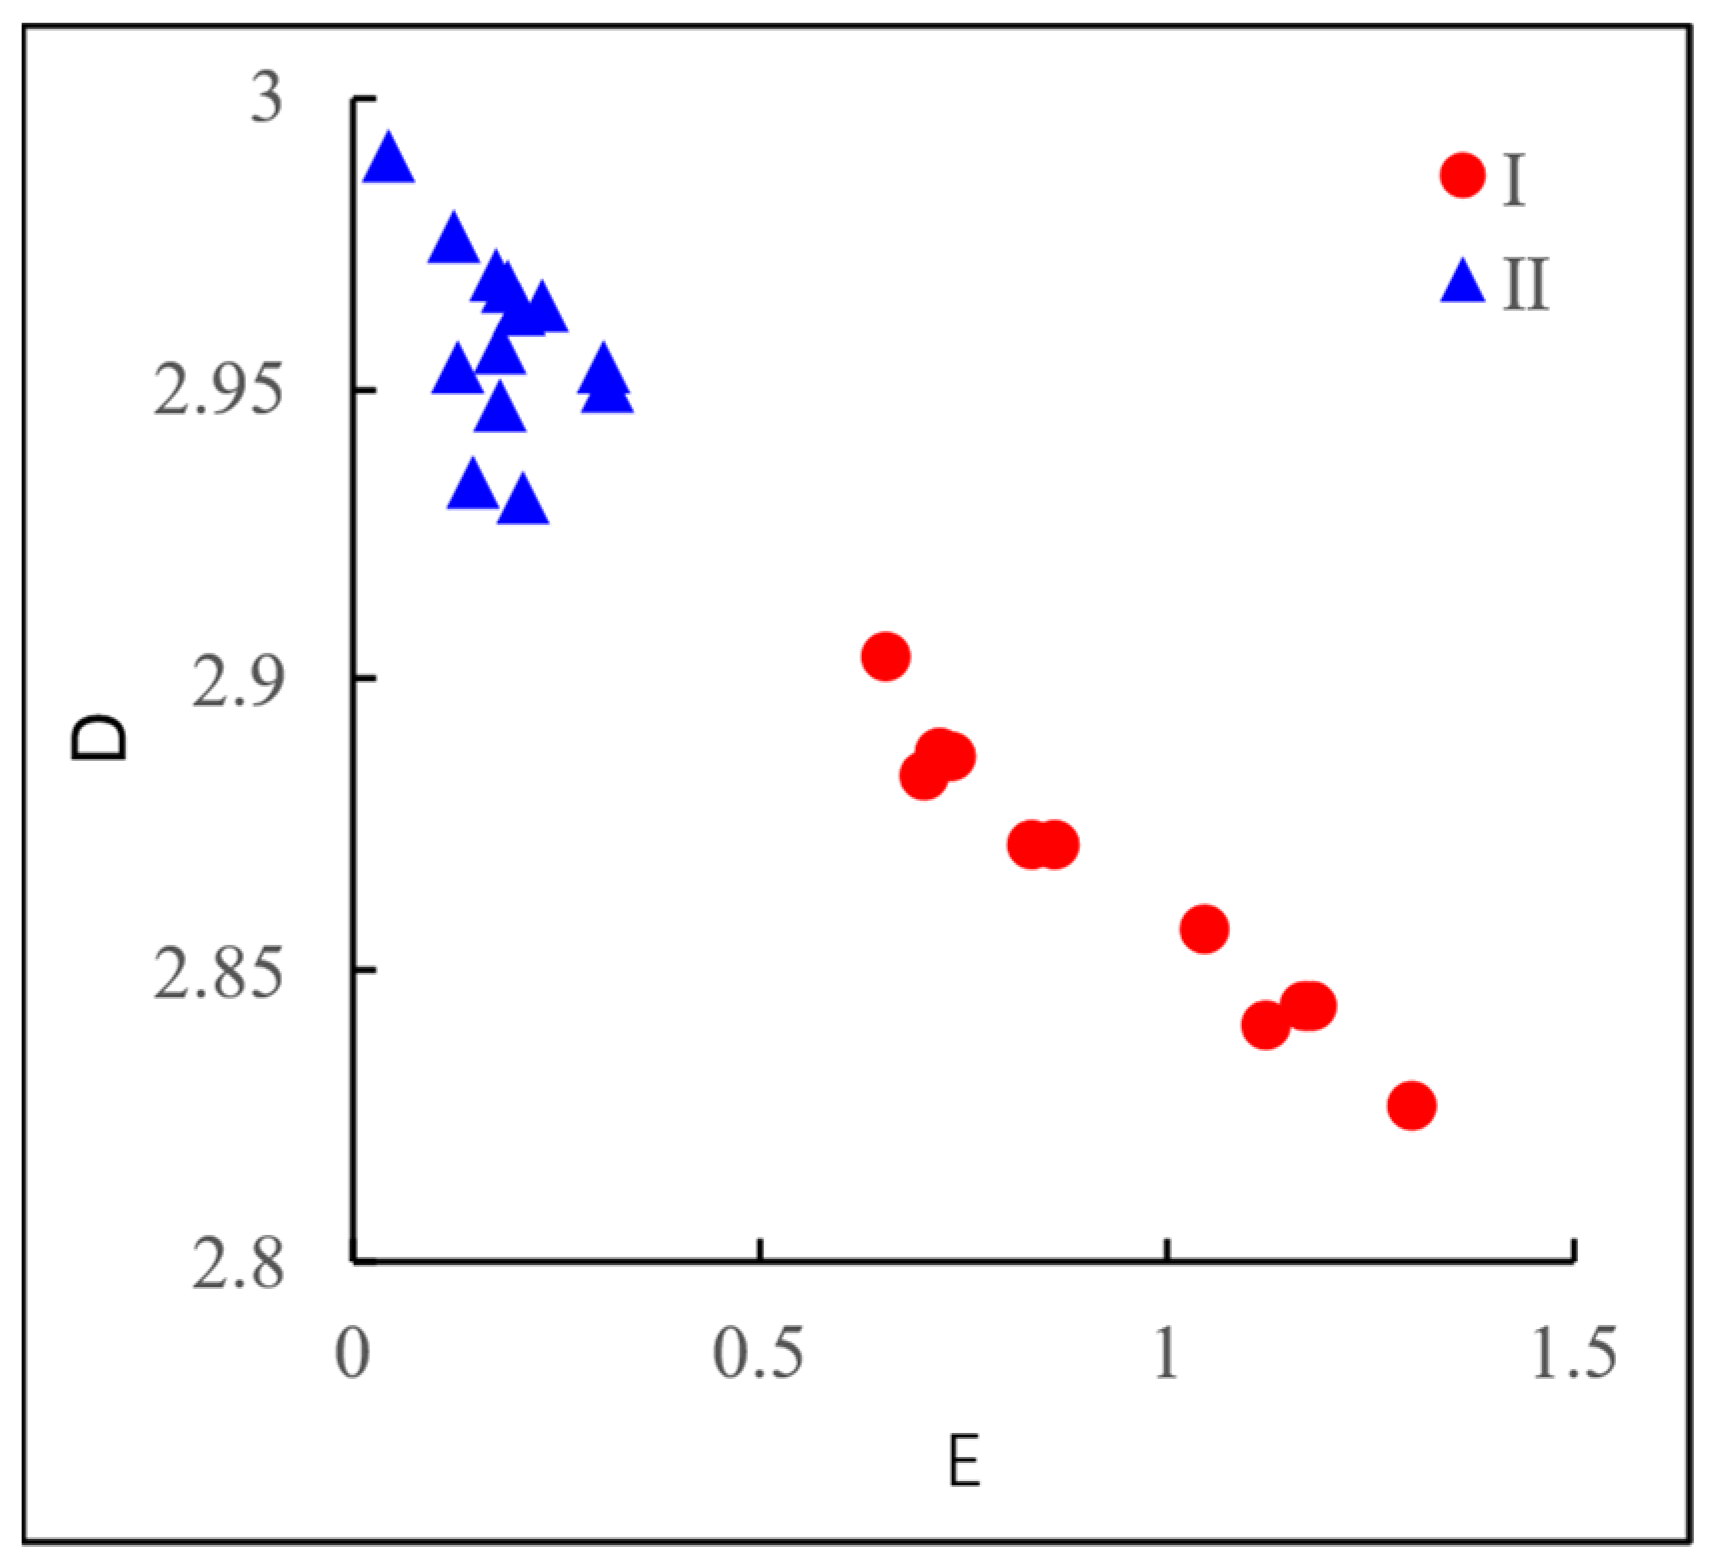
The results of capillary pressure experiments for 27 blocks in the study area are depicted in Figure 6. The Huangliu Formation reservoir in area A of the Dongfang gas field displays two types of morphologies on the capillary pressure curve. As depicted in Figure 7, a cross-plot is created using the fractal dimension and effective porosity index obtained from core experiments. From the cross-plot, it can be observed that there are two distinct types of reservoirs. By integrating the findings of nuclear magnetic resonance and capillary pressure experiments with fractal theory, the reservoir of the Huangliu Formation can be categorized into two main types. These two types of reservoirs exhibit differences in pore structure, with Type I reservoirs having superior pore structures compared to Type II reservoirs. Additionally, Type I reservoirs have superior petrophysical properties compared to Type II reservoirs.
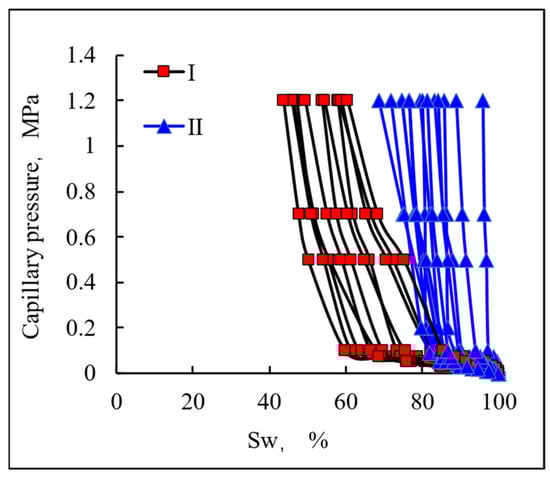
Figure 6.
Capillary pressure curve graph.

Figure 7.
Cross-plot of effective porosity index and fractal dimension.
4.2. Reservoir Classification Results
The well logging data corresponding to the depth of the capillary pressure experiment samples was extracted and is presented in Table 1. There are differences in natural gamma, resistivity, neutron, and density between the two reservoir types. These four influencing factors were utilized as the initial variables for principal component analysis (PCA), and the findings are presented in Table 2. The table indicates that the cumulative contribution rates of the first two principal components are 85.62%, and their eigenvalues exceed 1, suggesting that they can accurately capture the information from the original variables [42]. Therefore, these two uncorrelated new variables can be used to replace the original four variables. By using the score coefficient matrix of each principal component, all principal components can be represented as linear combinations of the original variables.
where GGR, GRT, GDEN, and GCNL represent the normalized values of the natural gamma, resistivity, density, and neutron, respectively.

Table 1.
Comparison of well logging data for two types of reservoirs.
Table 2.
Parameters of the principal component analysis.
The well logging data corresponding to the depth of the capillary pressure experiment and petrophysical experiment core samples has been extracted. The data was normalized using Equation (8), and the corresponding F1 and F2 values were calculated using the derived principal component equations. A scatter plot of F1 and F2 was generated. From Figure 8, it is evident that the principal component analysis method effectively classifies the reservoir types of the rock samples used in the capillary pressure experiment. From Figure 9, it can be seen that this reservoir classification method is well validated in the petrophysical experiment, and the criteria for dividing reservoirs are consistent. In conclusion, the principal component analysis method can effectively classify the two types of reservoirs. Type I reservoirs have F1 values less than −0.22 and F2 values greater than 0.11, whereas Type II reservoirs have F1 values greater than −0.22 and F2 values less than 0.11.
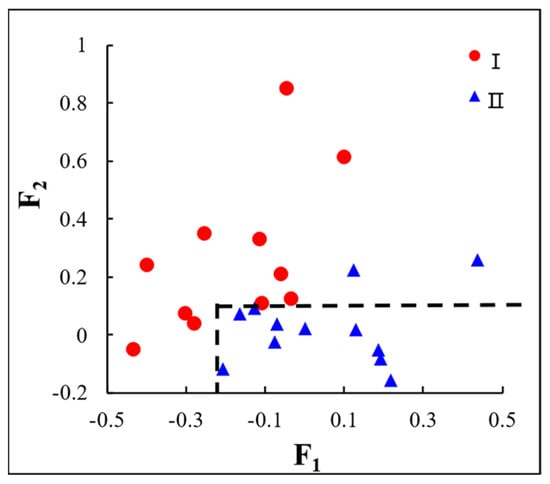
Figure 8.
Cross-plot of principal component analysis results based on the capillary pressure experiment.
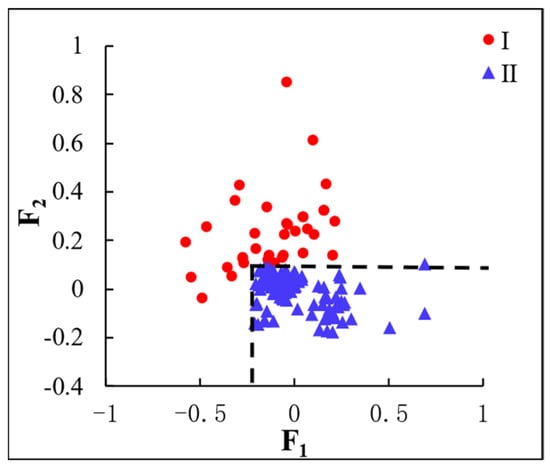
Figure 9.
Cross-plot of principal component analysis results based on the logging data.
4.3. Model Establishment
4.3.1. Geological Factors F
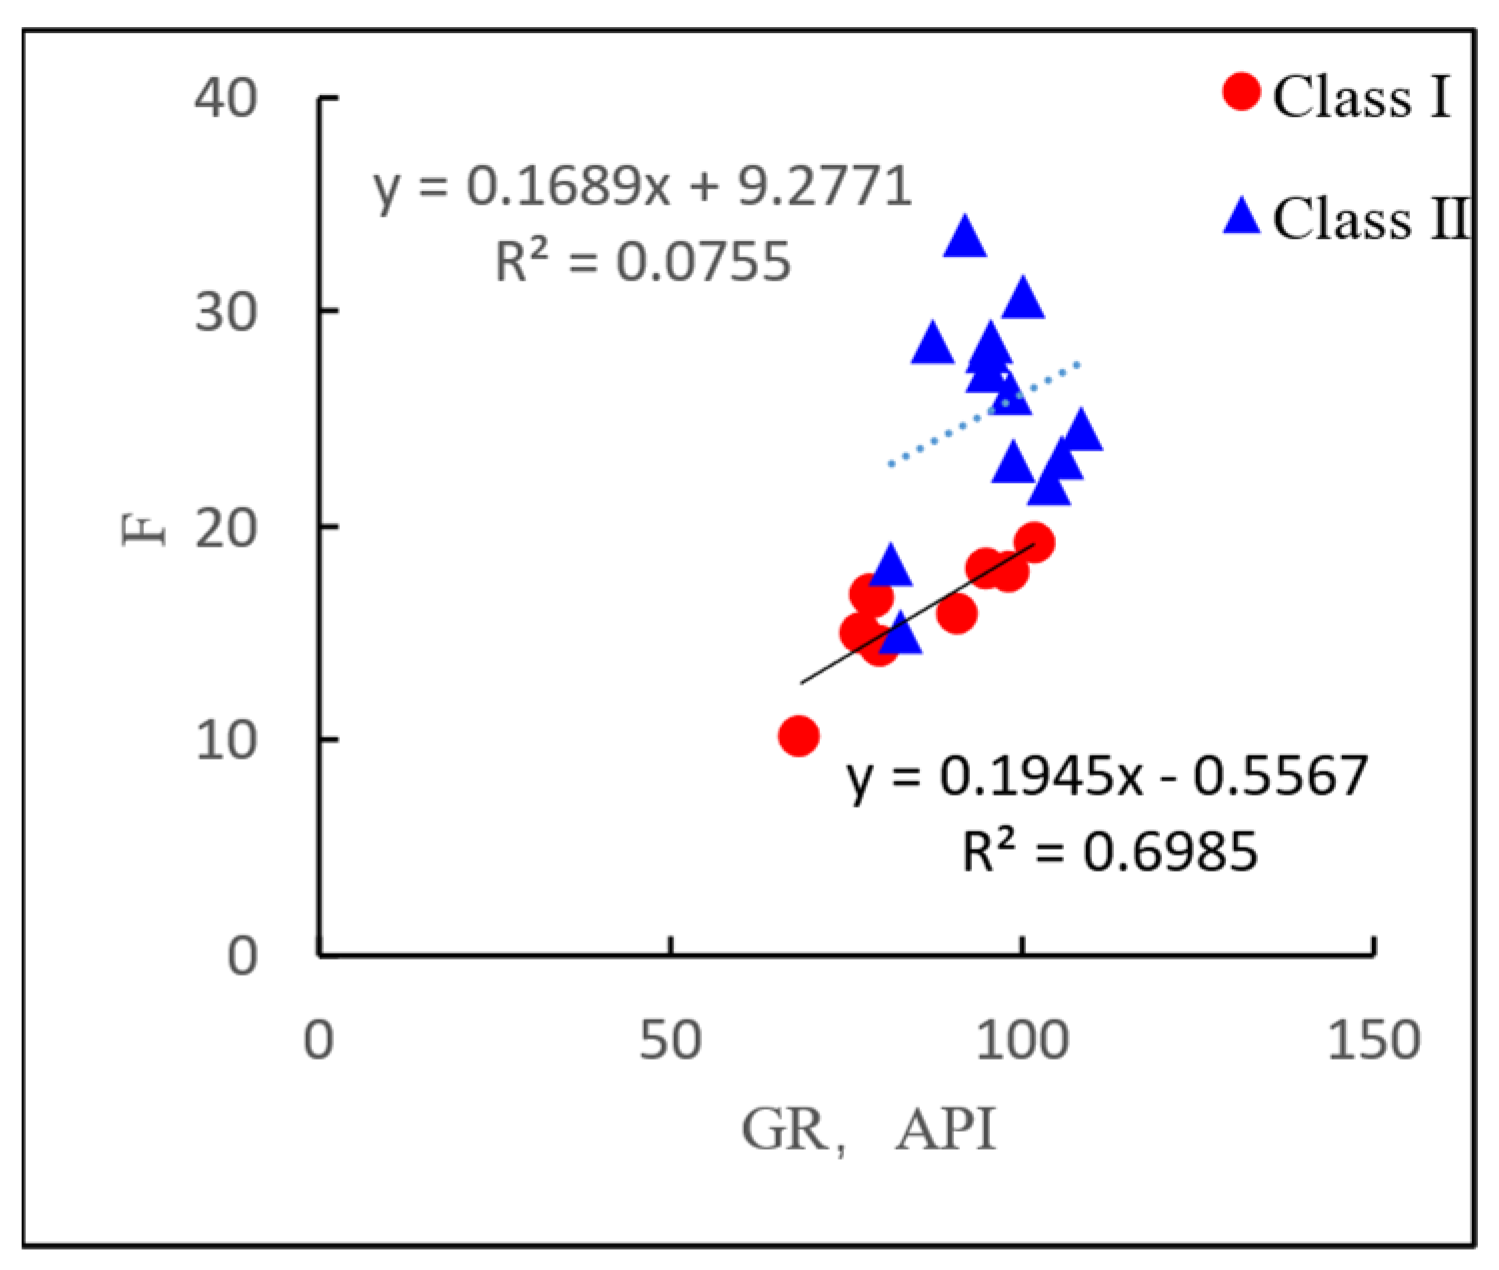
The parameter “a” in the Archie formula is closely related to “m”, and both parameters constrain each other. The variations in “a” and “m” can be determined by geological factor F. Scholars have established the relationship between F and POR based on single-factor analysis [43]. However, the fitting between formation factors and natural gamma in the study area reveals that, as shown in Figure 10, Class I reservoirs exhibit good correlation between F and GR, while Class II reservoirs show no correlation between the two variables. The relationship can be expressed as follows:
where F is the geological factor; and GR is the natural gamma, measured in API units.
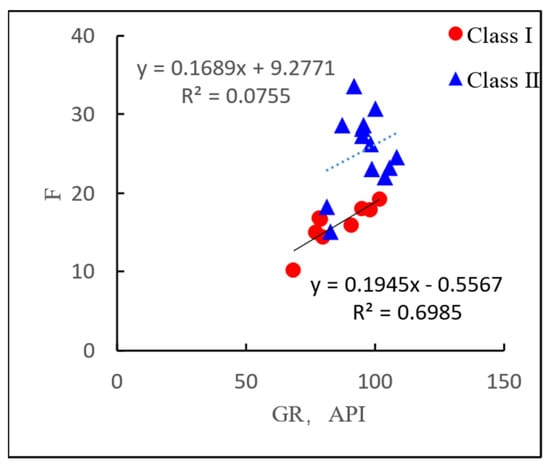
Figure 10.
Intersection diagram of formation factor F and natural gamma GR.
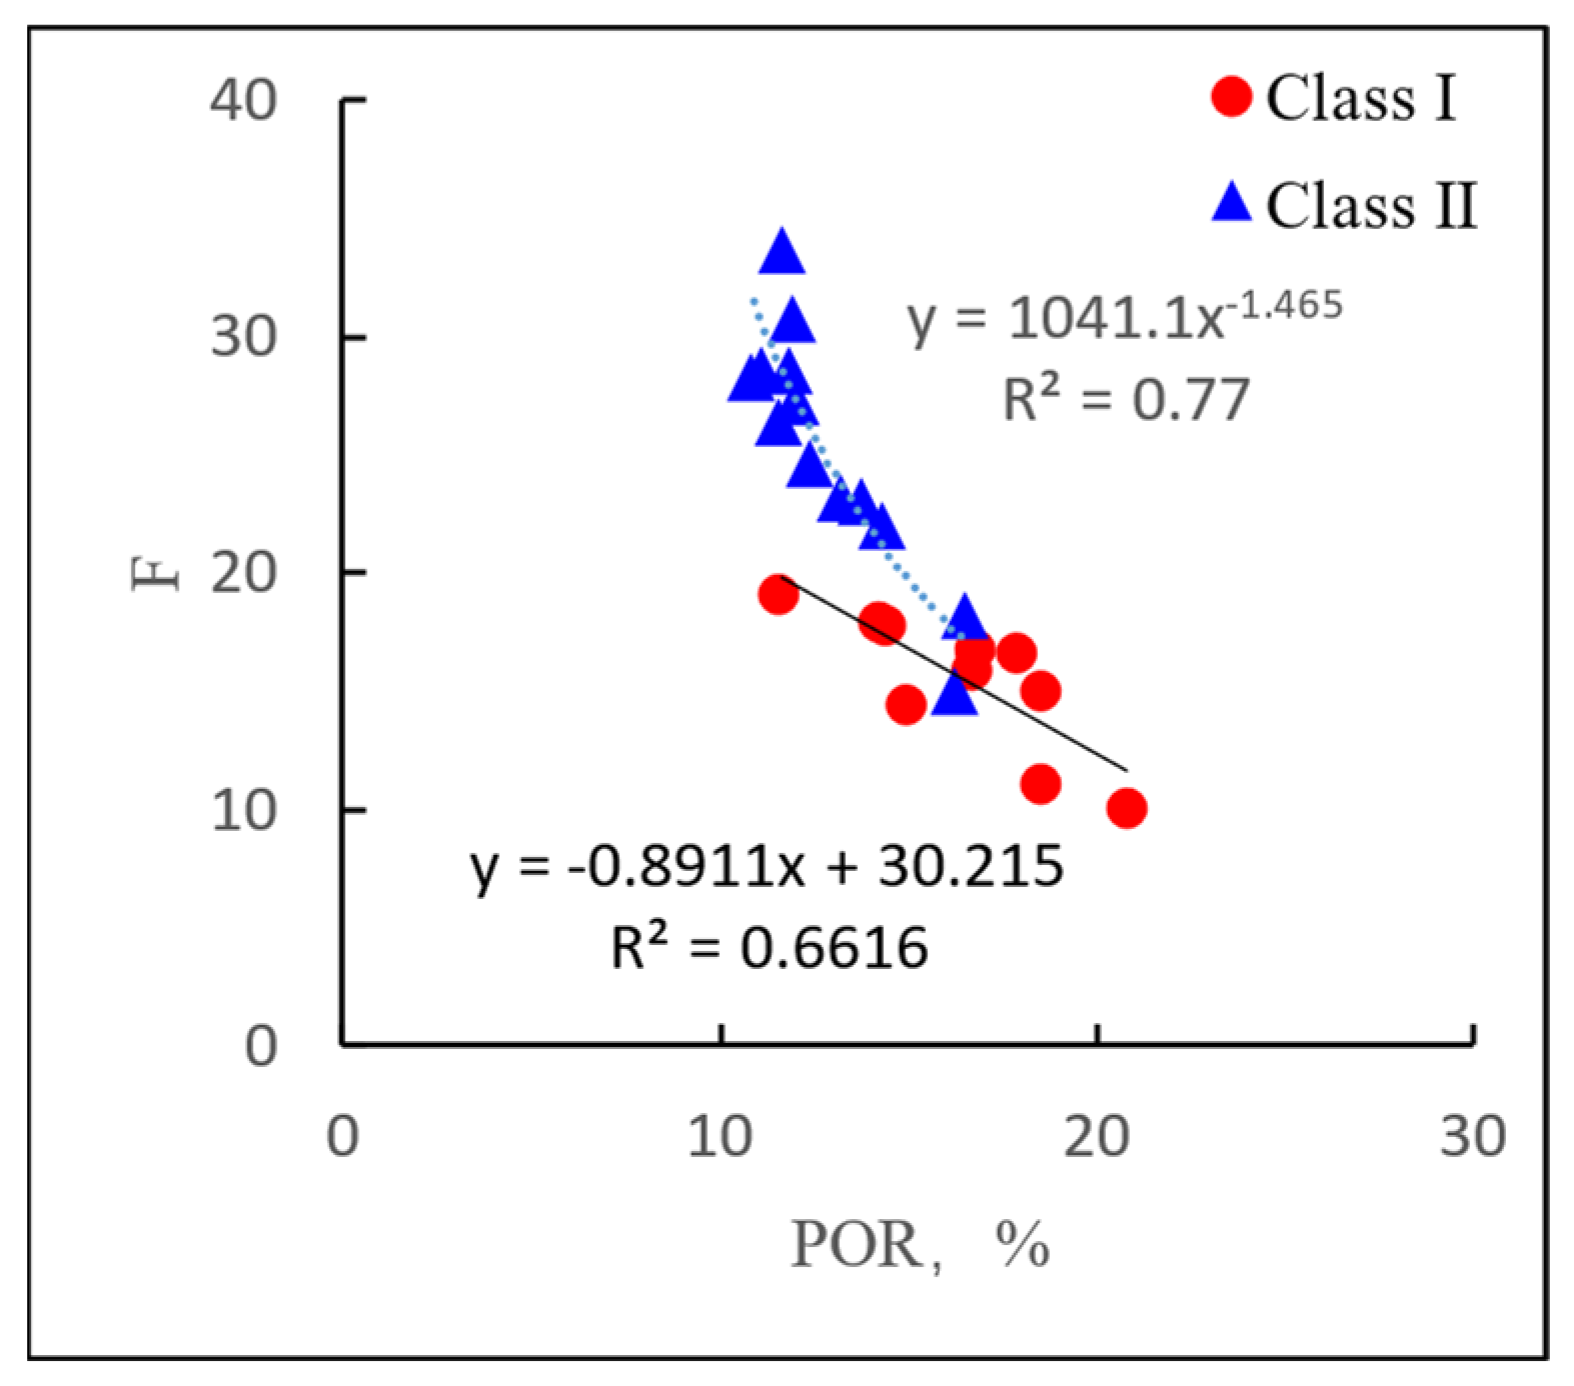
Through the fitting between formation factors and porosity, as shown in Figure 11, it is found that both Class I and Class II reservoirs exhibit good correlation between F and POR, with two distinct trends. The relationship can be expressed as follows:
where F is the geological factor; and POR is porosity (%).

Figure 11.
Intersection diagram of formation factor F and porosity POR.
4.3.2. Saturation Exponent n
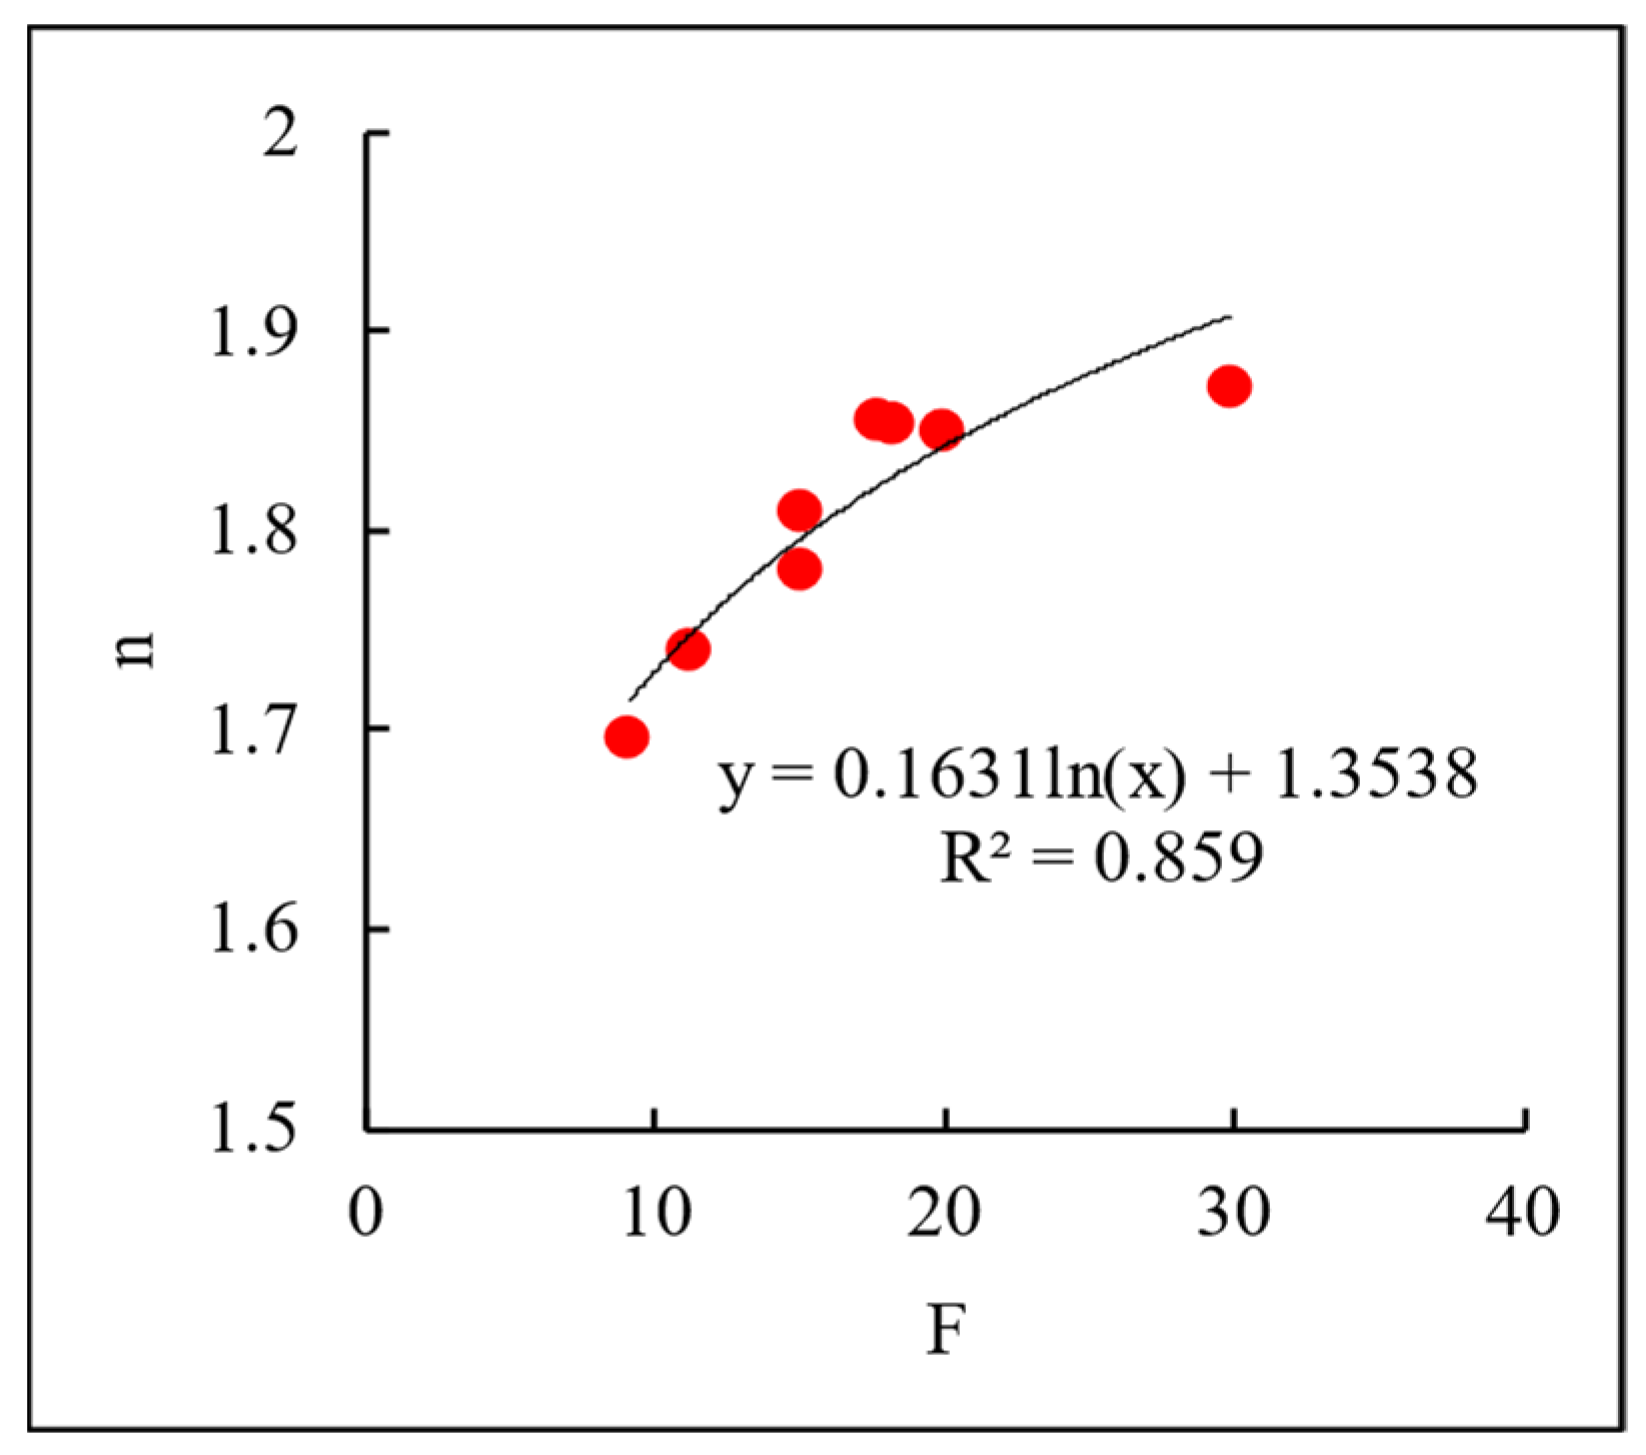
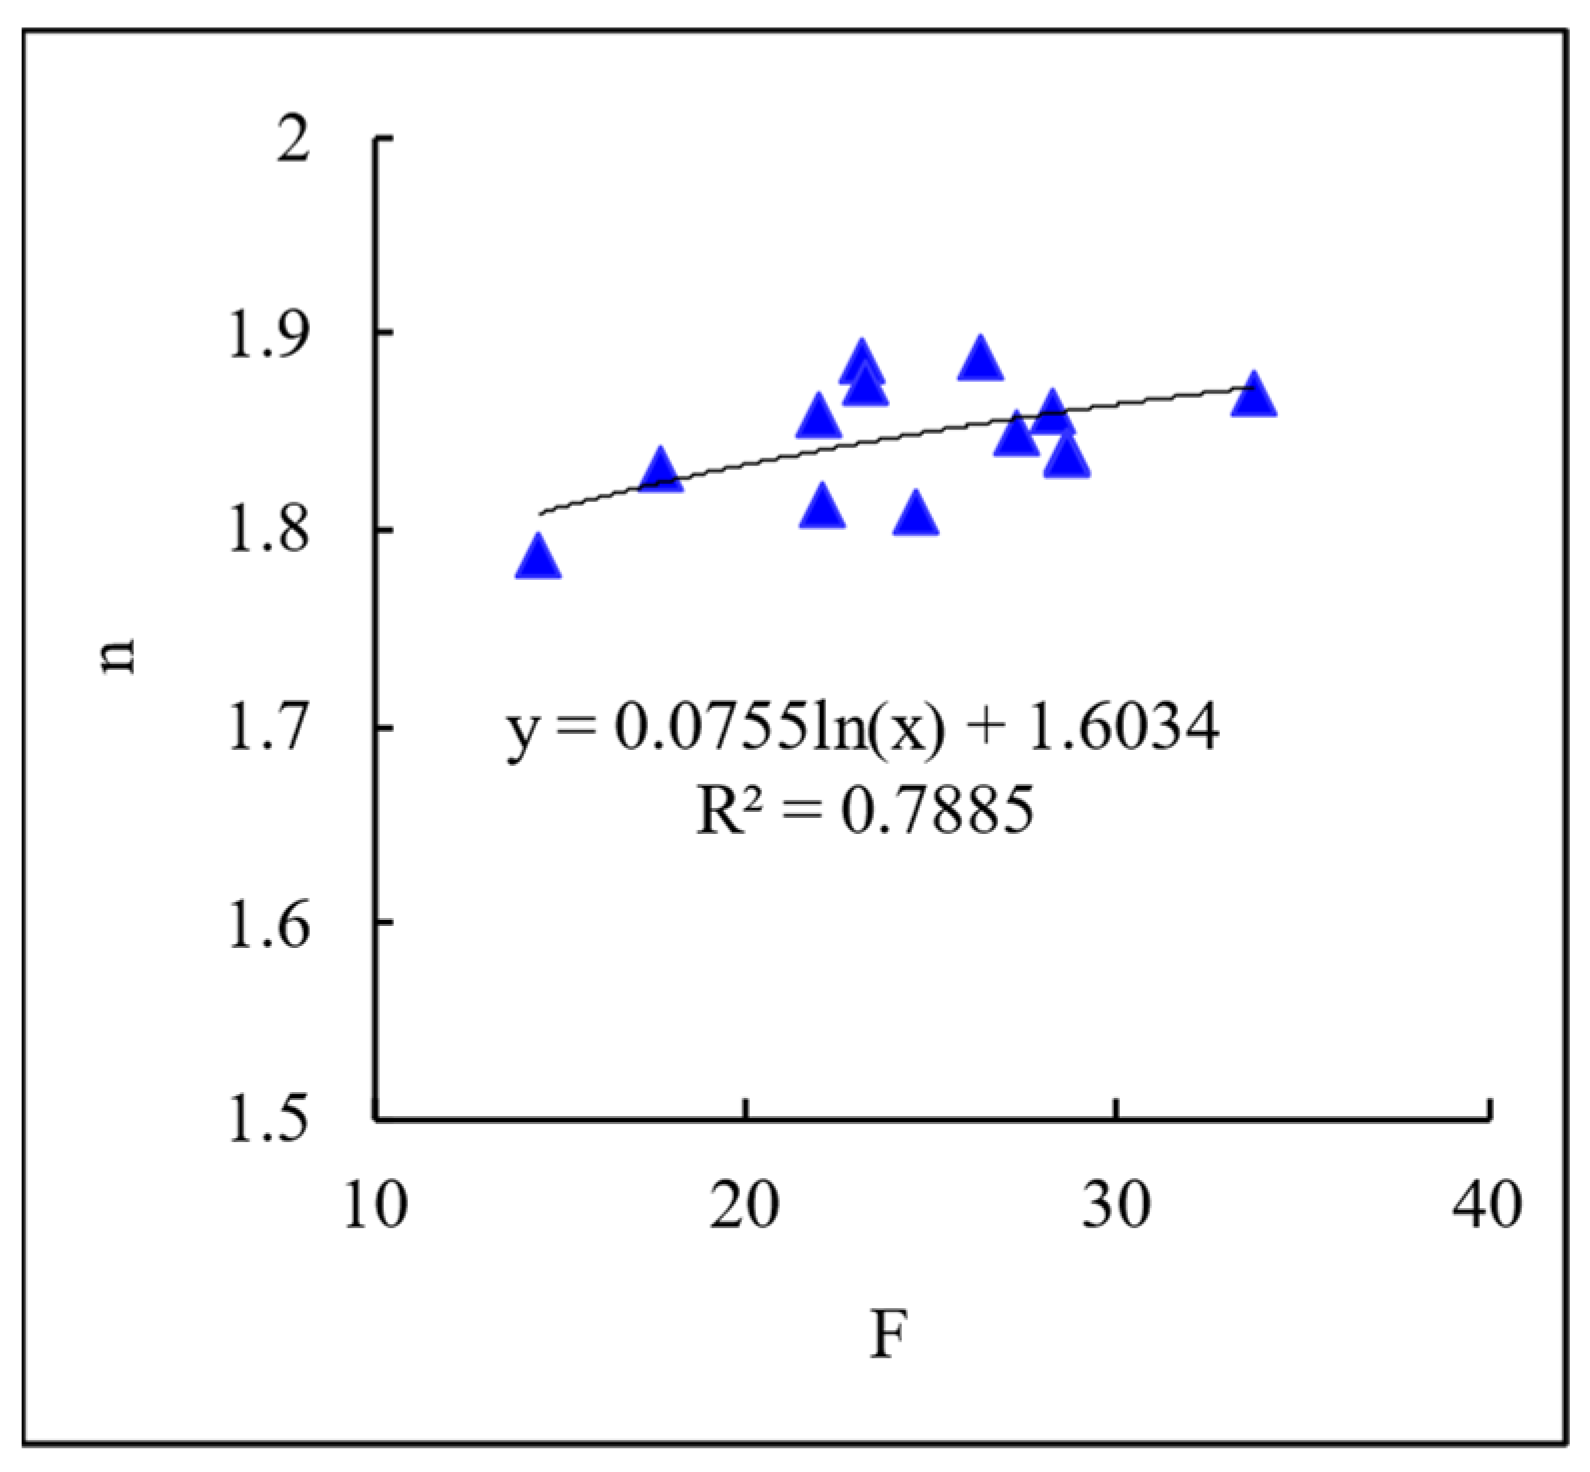
The variation in saturation exponent with formation factor under the condition of forcing b to be 1 is observed, as shown in Figure 12. In Class I reservoirs, the saturation exponent increases with the increase in the formation factor.
where n is the saturation exponent; and F is the geological factor.
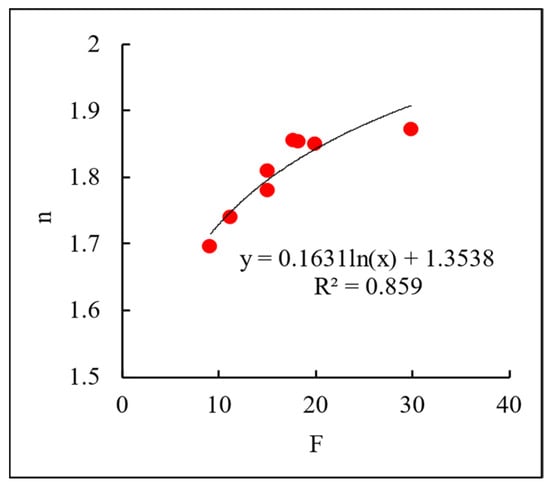
Figure 12.
Intersection diagram of saturation index n and formation factor F.
As shown in Figure 13, in Class II reservoirs, the saturation exponent increases with the increase in the formation factor, but overall, it remains relatively stable with a small variation range.
where n is the saturation exponent; and F is the geological factor.
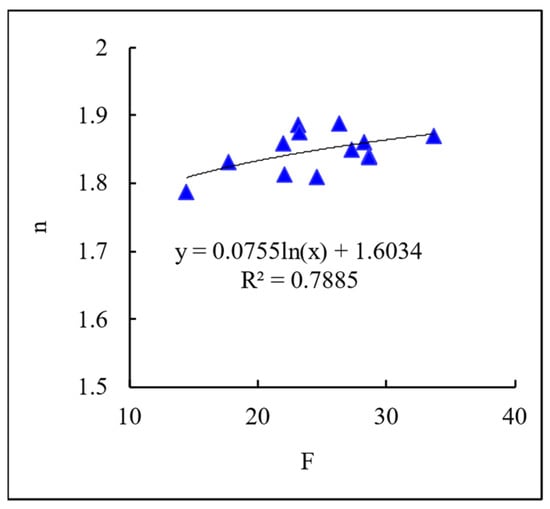
Figure 13.
Intersection diagram of saturation index n and formation factor F.
The above analysis identifies the influencing factors of geological factor F for Type I reservoirs as natural gamma and porosity, while that for Type II reservoirs is porosity. The saturation exponent for both Type I and Type II reservoirs exhibits a strong correlation with the geological factor F. The saturation models of two types of reservoir lithology parameters were established using multiple regression analysis, and the models and their applicable conditions are shown in Table 3.
Table 3.
Summary of saturation models.
4.4. Model Application
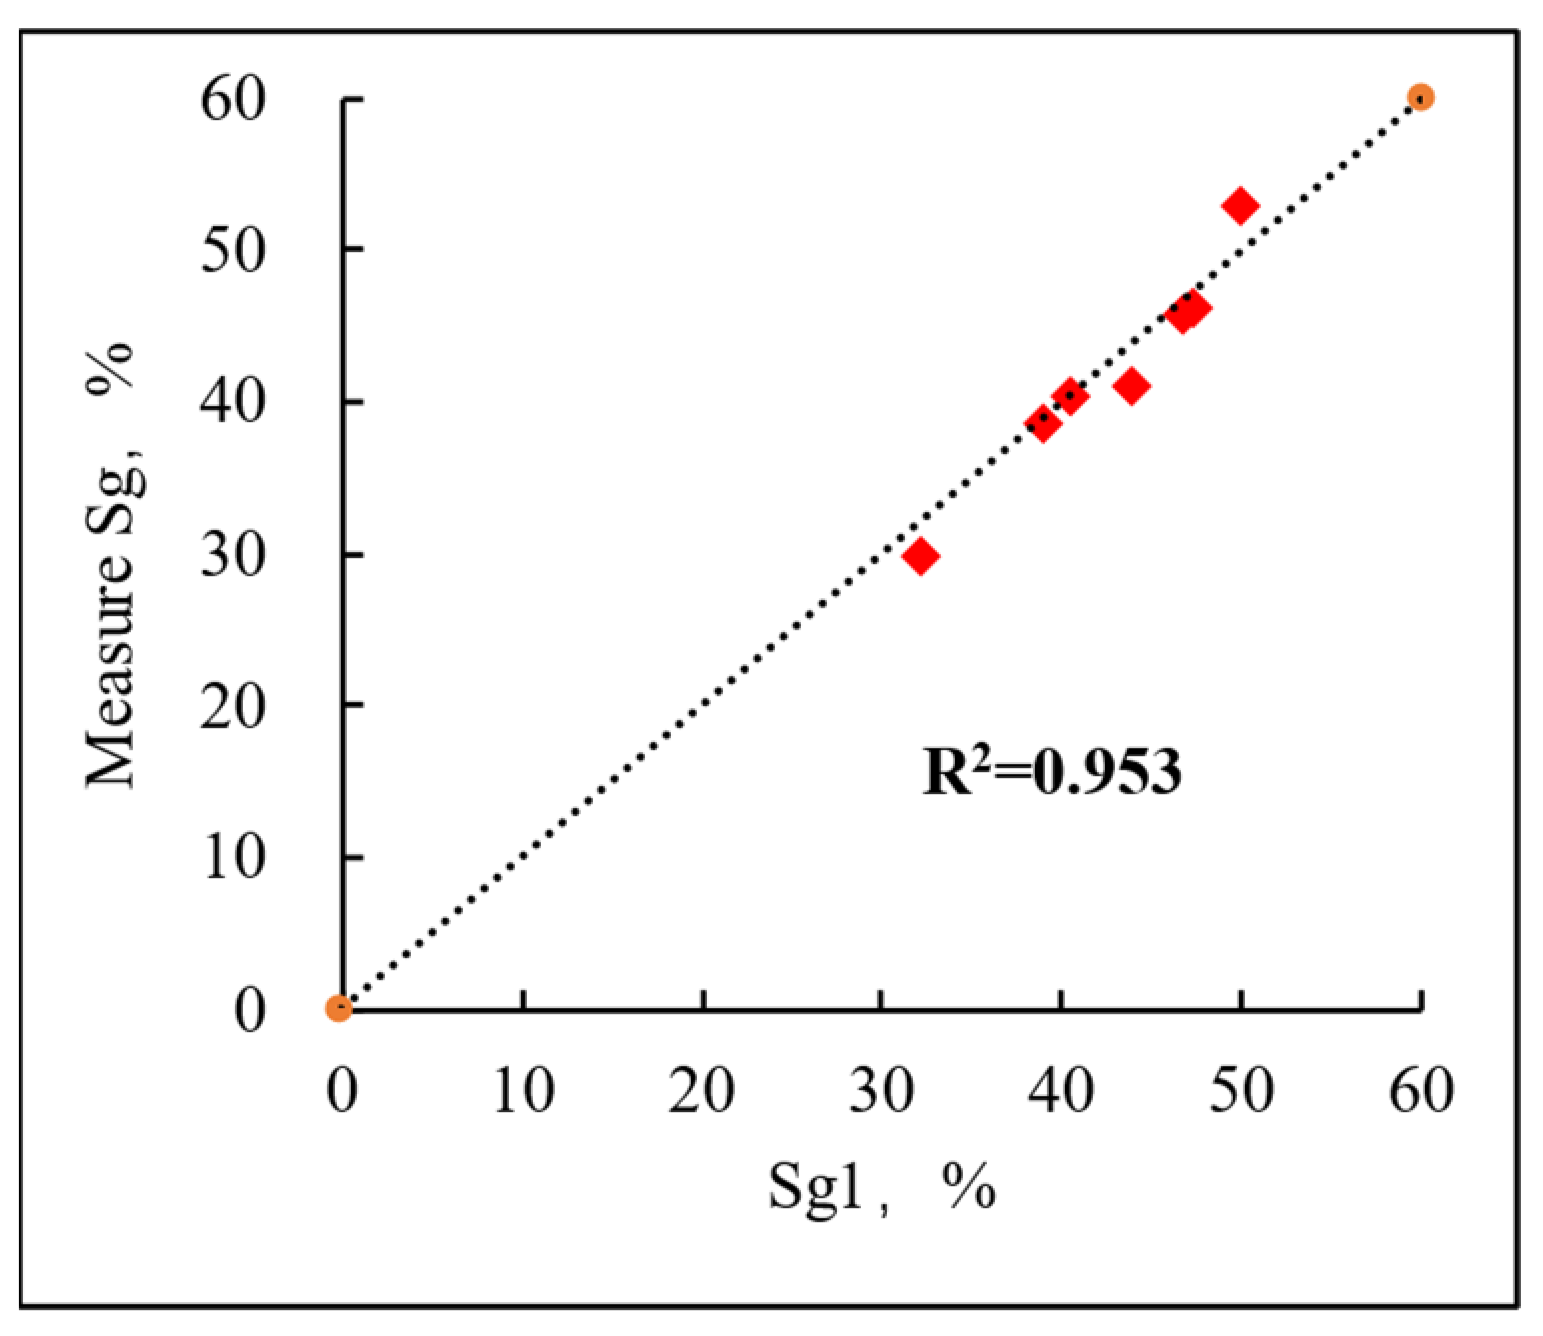
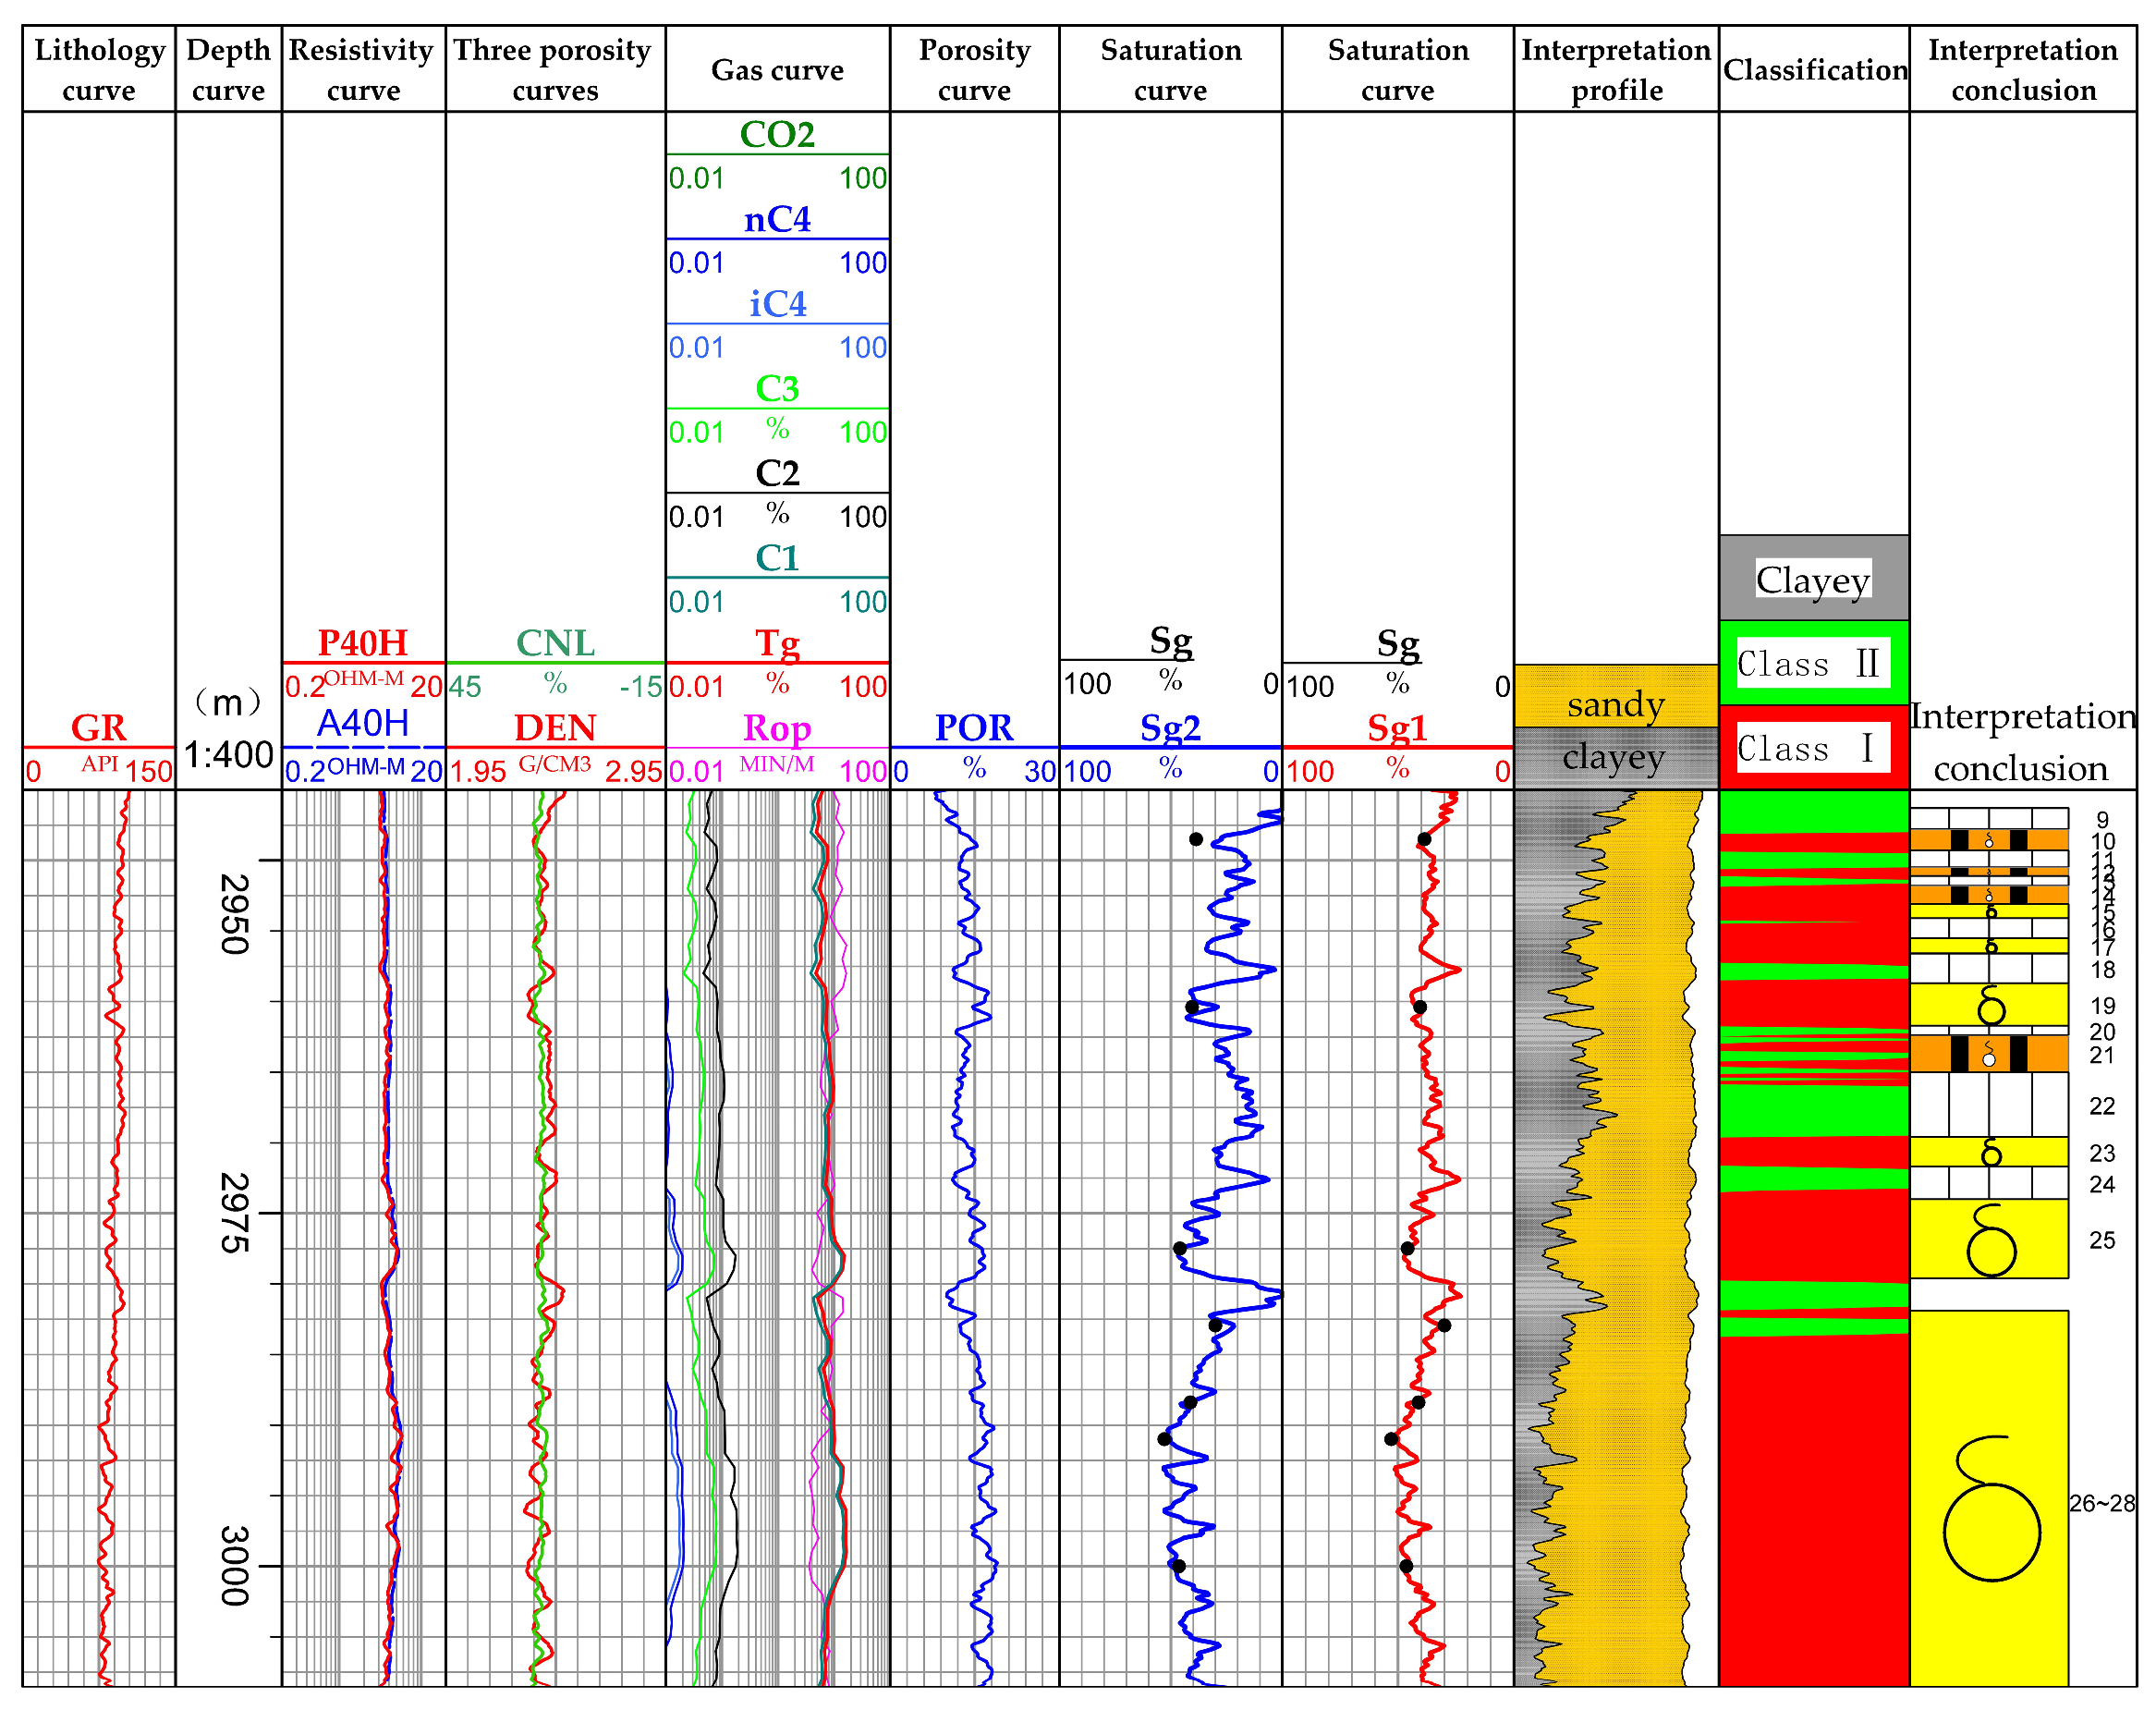
The method described in this article was applied to process actual well data using the CIFLog 3.0 software, and the results are shown in Figure 14. The first trace in Figure 14 represents natural gamma, the second trace shows depth; the third trace shows the deep resistivity (P40H) and shallow resistivity (A40H) curves, respectively; the fourth trace depicts the density and neutron curves, respectively; the fifth trace shows the gas measurement curve; the sixth trace presents the porosity curve; the seventh trace shows the gas saturation (Sg1) calculated by the rock electrical parameters and saturation (Sg) analyzed by the core, respectively; the eighth trace represents the lithology profile; the ninth trace shows the reservoir classification results, where Class I reservoirs have good pore structure and physical properties, while Class II reservoirs have relatively poor physical properties; and the tenth trace reveals the interpretation conclusions. According to the water analysis test data, the resistivity of formation water is approximately 0.13 Ω·m. Figure 15 shows the cross-plot between the gas saturation calculated using the lithology parameter model and the gas saturation analyzed from core data. From Figure 14 and Figure 15, it can be observed that the gas saturation calculated using the lithology parameter model is close to the gas saturation analyzed from core data, with a correlation coefficient of 0.953.
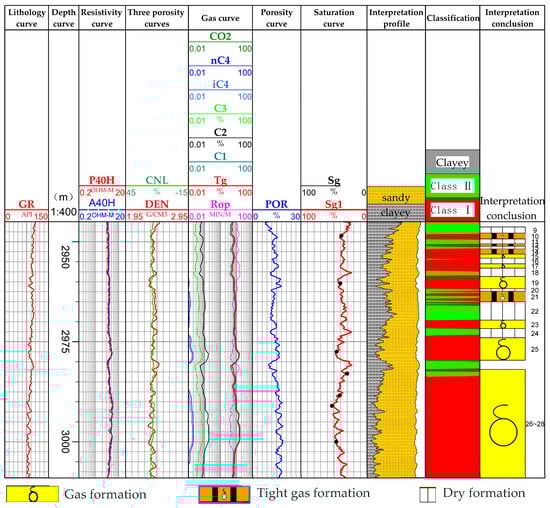
Figure 14.
Log interpretation results of well D14.
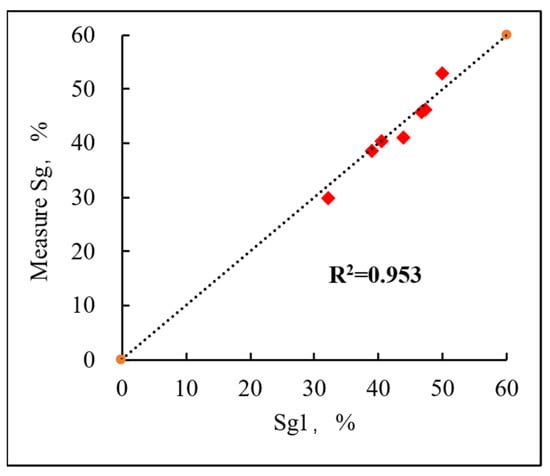
Figure 15.
Cross-plot of calculated gas saturation and core analysis gas saturation.
5. Discussion
5.1. Comparison of Methods
The traditional Archie formula is not well-suited for low porosity and permeability reservoirs with complex pore structures, and it leads to significant errors in calculating saturation when using fixed regional rock electrical parameters are large [44]. The electrical parameters of tight sandstone reservoirs often vary. Lu Junhui et al. [45], Jing Cheng et al. [46], and Li Yuegang et al. [47] developed a variable rock electrical parameter saturation model by analyzing the relationship between the cementation index m and porosity φ, as well as the lithology coefficient a, and the relationship between the saturation index n and the lithology coefficient b, using rock core experimental data analysis. This approach yielded positive results in evaluating the Sulige tight sandstone gas reservoir. However, the ultra-low permeability mudstone reservoirs in the Eastern region have unique characteristics. These include higher temperatures and pressures, weaker diagenetic processes such as compaction and cementation, and complex rock electrical properties. The overall study of the variation in rock electrical parameters cannot fully reflect the true situation of the formation. This paper presents a novel saturation interpretation model that enhances the traditional Archie formula by incorporating the impact of reservoir properties on the electrical parameters of rock. It integrates rock core experimental data and logging data, employs the rock core calibration logging method and principal component analysis to categorize reservoirs, investigates the factors influencing formation factors and saturation index for various reservoir types, eliminates the impact of cementation index, and minimizes calculation errors.
To further demonstrate the effectiveness of the proposed method, we compare it with the widely used fixed rock electrical parameter saturation model. As is show in Figure 16, the gas saturation (Sg2) calculated using the fixed rock electrical parameters is markedly lower than the gas saturation analyzed by the core. Moreover, the results obtained using the lithology-based variable rock electrical parameter saturation interpretation model better reflect the true gas saturation of the formation. Table 4 compares the calculation errors of gas saturation in the core wells of the Eastern Gas Field. Based on the results from three wells and 25 samples, compared to the nuclear magnetic experimental analysis of the gas saturation values at pure gas layers obtained through cable testing, the lithology-based variable rock electrical parameter saturation model outperforms the fixed rock electrical model in terms of accuracy, with an average absolute error reduction of 5.9%. The sampling data from the cable formation testing indicates that at a depth of 2848.5 m in well D14, there is a pure gas layer with sufficient gas content. The original interpretation conclusion suggested a poor gas layer, but the revised interpretation shows a gas layer, which is consistent with the sampling test data.
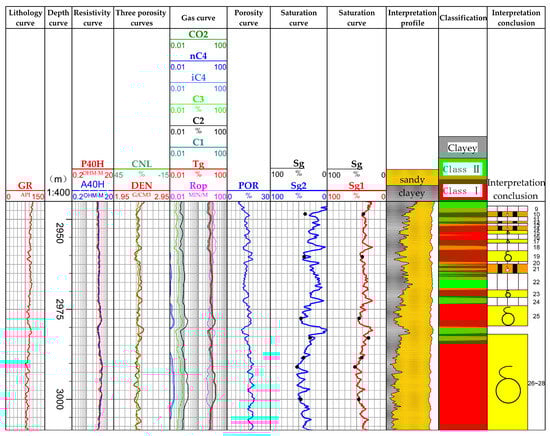
Figure 16.
Comparative plot of the well log interpretation results for well D14.
Table 4.
Comparison of saturation calculation errors in the Dongfang gas field core wells.
5.2. Model Advantages and Disadvantages
In practical applications, the fixed rock electrical parameter saturation model considers relatively limited factors, thus exhibiting strong adaptability and limitations. The proposed variable rock electrical parameter saturation interpretation model fully considers the differences in lithology, mineral composition, and physical properties of the reservoir in the study area. It also analyzes core capillary pressure and nuclear magnetic experiments, selects logging curves that affect reservoir differences, applies principal component analysis to classify reservoirs, and subsequently analyzes the conduction laws of different reservoirs.
Despite its strong performance, the proposed model has certain limitations. It is based on core experiments, and thus it is important to ensure the uniform selection of samples and the reliability of the rock physics experimental results.
6. Conclusions
In this study, we have established a model for interpreting the saturation of rock electrical parameters in the complex pore structures of ultra-low permeability argillaceous sandstone reservoirs in the Eastern Huangliu Formation. Based on the result, the following key conclusions were determined.
(1) In the study area, the mud content is high, yet due to the influence of high temperature, high pressure, and the pH of formation water, kaolinite and montmorillonite are transformed into illite and chlorite. The cation exchange capacity is weak, and the effect of cation attachment conduction can be ignored.
(2) For the ultra-low permeability mudstone reservoirs, the heterogeneity is strong, and the rock conductivity characteristics are extremely complex. The fixed rock electrical parameters obtained from the rock electrical experiments only represent the average response value of rock samples, which cannot fully reflect the conductivity characteristics of different reservoir types. This prevents the comprehensive interpretation of saturation.
(3) Significant differences are observed in the physical properties and complex pore structures in the ultra-low permeability mudstone reservoirs in the study area. The principal component analysis method can classify reservoirs into two categories. The classification criteria for Class I reservoirs are F1 < −0.22 and F2 > 0.11; the classification criteria for Class II reservoirs are F1 ≥ −0.22 and F2 ≤ 0.11. The influencing factors of formation factor F vary with the reservoir type. The influencing factors of formation factor F for Class I reservoirs are natural gamma GR and porosity POR, and the influencing factors of formation factor F for Class II reservoirs are porosity POR. Both types of reservoirs exhibit a strong correlation between saturation index n and formation factor F.
(4) Case studies reveal the ability of the proposed saturation interpretation method based on reservoir classification and variable rock electrical to effectively calculate the changes in the rock electrical parameters for the same reservoir type. The use of actual data from the ultra-low permeability gas reservoir in the eastern gas field confirms that this method yields more accurate saturation calculation results compared to employing fixed rock electrical parameters. The calculated results align better with the core analysis results and can truly reflect the saturation of the ultra-low permeability gas reservoir.
Author Contributions
B.W. (Bao Wang): methodology, writing—original draft preparation, writing—review and editing, Z.W.: methodology, supervision, project administration, B.S.: methodology, visualization, D.T.: resources, Y.W.: resources, B.W. (Bohan Wu): resources, S.L.: resources, J.Z.: methodology. All authors have read and agreed to the published version of the manuscript.
Funding
Thank you for the support from Professor Ming Cai’s National Natural Science Foundation of China for the project titled “Dual-scale acoustic logging evaluation method for fracture effectiveness in tight reservoirs (42104126)” and the China Petroleum Science and Technology Innovation Fund for the project titled “Experimental study on acoustic logging response mechanism of ultra-deep fractured anisotropic formation (2022DQ02-0301)”.
Data Availability Statement
Data are contained within the article.
Conflicts of Interest
Authors Di Tang, Yixiong Wu, Bohan Wu were employed by Hainan Branch of CNOOC Ltd., Jinfeng Zhang was employed by Jiqing Oilfield Operation Area of Xinjiang Oilfield Company. The authors declare that this study received funding from China Petroleum Science and Technology Innovation Fund. The funder was not involved in the study design, collection, analysis, interpretation of data, the writing of this article or the decision to submit it for publication.
References
- Wei, X.S.; Hu, A.P.; Zhao, H.T. New progress in geological understanding of tight sandstone gas. Lithol. Reserv. 2017, 29, 11–20. [Google Scholar]
- Qiu, Z.J.; Deng, S.T. Strategic position of China’s unconventional natural gas. Nat. Gas Ind. 2012, 32, 1–5+117. [Google Scholar]
- Yan, J.P.; Wen, D.N.; Li, Z.Z. Influence and application of low-permeability sandstone pore structure on rock electrical parameters. Nat. Gas Geosci. 2015, 26, 2227–2233. [Google Scholar]
- Qin, R.B.; Li, M.Y.; Yu, J. Fine evaluation of reservoir parameters for tight sandstone gas in the Linxing block based on well logging. Well Logging Technol. 2021, 45, 526–533. [Google Scholar] [CrossRef]
- Guo, J.; Ling, Z.; Xu, X.; Zhao, Y.; Yang, C.; Wei, B.; Zhang, Z.; Zhang, C.; Tang, X.; Chen, T.; et al. Saturation Determination and Fluid Identification in Carbonate Rocks Based on Well Logging Data: A Middle Eastern Case Study. Processes 2023, 11, 1282. [Google Scholar] [CrossRef]
- Archie, G.E. The electrical resistivity log as an aid in determining some reservoir characteristics. Trans. AIME 1942, 146, 54–62. [Google Scholar] [CrossRef]
- Wyllie, M.R.J.; Gregory, A.R. Formation factors of unconsolidated porous media: Influence of particle shape and effect of cementation. Trans. AIME 1953, 198, 103–110. [Google Scholar] [CrossRef]
- Jackson, P.D.; Taylor-Smith, D.; Stanford, P.N. Resistivity porosity particle shape relationships for marine sands. Geophysics 1978, 43, 1250–1268. [Google Scholar] [CrossRef]
- Ransom, R.A. Contribution towards a better understanding of the modified Archie formation resistivity factor relationship. Log Anal. 1984, 25, 7–12. [Google Scholar]
- Knight, R.; Endres, A. An introduction to rock physics principles for near-surface geophysics. SEG Investig. Geophys. 2005, 13, 31–70. [Google Scholar]
- Borai, A.M. A new correlation for the cementation factor in low porosity carbonates. SPE Form. Eval. 1987, 2, 495–499. [Google Scholar] [CrossRef]
- Focke, J.W.; Munn, D. Cementation exponents in middle eastern carbonate reservoirs. SPE Form. Eval. 1987, 2, 155–167. [Google Scholar] [CrossRef]
- Saha, S.; Asquith, G.B.; Drager, L. A new approach to estimating Sw in carbonate reservoirs. Log Anal. 1993, 34, 20–25. [Google Scholar]
- Mao, Z.Q. The Basic Experiments, Theories, and Applied Research on Saturation Logging Interpretation under Reservoir Conditions. Ph.D. Thesis, Research Institute of Petroleum Exploration & Development, China National Petroleum Corporation, Beijing, China, 1995. [Google Scholar]
- Yue, W.Z.; Tao, G.; Zhu, K.Q. Electrical transport characteristics of porous media simulated by a two-dimensional lattice gas automaton. Chin. J. Geophys. 2005, 48, 189–195. [Google Scholar]
- Suman, R.J.; Knight, R.J. Effect of pore structure and wettability on the electrical resistivity of partially saturated rock- a network study. Geophysics 1997, 62, 1151–1162. [Google Scholar] [CrossRef]
- Sharma, M.M.; Garrouch, A.; Dunlop, H.F. Effect of wettability, pore geometry and stress on electrical conduction in fluid saturated rocks. Log Anal. 1991, 32, 511–526. [Google Scholar]
- Kuntz, M.; Mareschal, J.C.; Lavallee, P. Numerical estimation of electrical conductivity in saturated porous media with 2-D lattice gas. Geophysics 2000, 65, 766–772. [Google Scholar] [CrossRef]
- Donaldson, E.C.; Siddiqui, T.K. Relationship between the Archie saturation exponent and wettability. SPE Form. Eval. 1989, 4, 359–362. [Google Scholar] [CrossRef]
- Rasmus, J.C. A summary of the effects of various pore geometries and their wettabilities on measured and in-suit values of cementation and saturation exponents. In Proceedings of the SPWLA 27th Annual Logging Symposium, Houston, TX, USA, 9–13 June 1986. [Google Scholar]
- Maute, R.E.; Lyle, W.D.; Sprunt, E.S. Improved data analysis method of determining Archie parameters from core data. JPT 1992, 44, 103–107. [Google Scholar] [CrossRef]
- Aldoleimi, A.M.; Berta, D. New technique for deriving the resistivity parameters of Archie’s equation from combination of logs and core measurements. In Proceedings of the Middle East Oil Show, Manama, Bahrain, 11–14 March 1989. [Google Scholar]
- Kumar, M.; Senden, T.J.; Sheppard, A.P.; Knackstedt, M.A. Probing the Archie’s exponent under variable saturation conditions. Petrophysics 2011, 52, 124–134. [Google Scholar]
- Patnode, H.W.; Wyllie, M.R.J. The presence of conductivity solids in reservoir rock as a factor in electric log interpretation. Trans. AIME 1950, 201, 43–56. [Google Scholar]
- Dewitte, L. Relations between resistivities and fluid contents of porous rocks. Oil Gas J. 1957, 55, 89–93. [Google Scholar]
- Simandoux, P. Dielectric measurements on porous media: Application to the measurement of water saturation: Study of the behaviour of Argillaceous formations. Rev. Del’Institut Franais Du Pet. 1963, 18, 193–215. [Google Scholar]
- Poupon, A.; Leveaux, J. Evaluation of water saturations in shaly formation. In Proceedings of the SPWLA 12th Annual Logging Symposium, Dallas, TX, USA, 2 May 1971. [Google Scholar]
- Hill, H.J.; Milburn, J.D. Effect of clay and water salinity on electrochemical behavior of reservoir rock. AIME 1956, 207, 65–72. [Google Scholar] [CrossRef]
- Waxman, M.; Smits, L.J.M. Electrical conductivities in oil bearing shaly sand. SPE J. 1968, 42, 107–122. [Google Scholar] [CrossRef]
- Waxman, M.H.; Thomas, E.C. Electrical conductivities in shaly sands: (Ⅰ) the relation between hydrocarbon saturation and resistivity index; (Ⅱ) the temperature coefficient of electrical conductivity. J. Pet. Technol. 1974, 26, 213–225. [Google Scholar] [CrossRef]
- Clavier, C.; Coates, G.; Dumanoir, J. Theory and experimental basis for the dual-water model for interpretation of shaly sands. SPE J. 1977, 24, 153–168. [Google Scholar]
- Silva, P.L.; Bassiouni, Z. Statistical evaluation of the S-B conductivity model for water-bearing shaly formation. Log Anal. 1986, 27, 9–19. [Google Scholar]
- Wang, Y.C.; Liu, P.; Li, G.L. Formation water characteristics of the Dongfang 1-1 gas field in the Yinggehai Basin and its relationship with hydrocarbon preservation. Nat. Gas Explor. Dev. 2010, 33, 19–22+6. [Google Scholar]
- Chen, S.S. Reservoir Evaluation of Huangliu Formation in the Eastern Yinggehai Basin. Master’s Thesis, Chengdu University of Technology, Chengdu, China, 2013. [Google Scholar]
- Huang, Y.T. Characteristics of Shallow Marine Gravity Flow Sedimentation and Geological Modeling of the Huangliu Formation in the Eastern Yinggehai Basin. Ph.D. Thesis, China University of Geosciences, Wuhan, China, 2016. [Google Scholar]
- Wang, C. Provenance Identification of Upper-Middle to Neogene Reservoirs in the Yinggehai Basin: Insights from Detrital Zircon U-Pb Geochronology and Geochemical Constraints. Ph.D. Thesis, Graduate University of Chinese Academy of Sciences, Guangzhou, China, 2016. [Google Scholar]
- Archie, G.E. Electrical resistivity and aid in core analysis interpretation. Bull. AAPG 1947, 31, 350–366. [Google Scholar]
- SY 5346-2005; Rock Capillary Pressure Measurement. China Standard Press: Beijing, China, 2005.
- GB T29172-2012; Practices For Core Analysis. China Standard Press: Beijing, China, 2012.
- He, C.Z.; Hua, M.Q. Fractal geometry description of reservoir pore structure. Oil Gas Geol. 1998, 1, 17–25. [Google Scholar]
- Zhong, Y.H.; Li, R. Application of principal component analysis and least square support vector machine to lithology ldentification. Well Logging Technol. 2009, 33, 425–429. [Google Scholar]
- Lin, X.L. Application of Principal Component Analysis and Support Vector Machine in Lithology Recognition of Conglomerate. Master’s Thesis, Yangtze University, Wuhan, China, 2021. [Google Scholar]
- Luo, S.C.; Cheng, Z.G.; Lin, W.C. Research on saturation model of variable rock-electric parameters for reservoirs with complicated pore structures. Well Logging Technol. 2015, 39, 43–47. [Google Scholar]
- Luo, S.C.; Chen, Z.G.; Tang, B.E. Study on the cementation index m and lithology coefficient a of tight sandstone reservoirs. Complex Hydrocarb. Reserv. 2014, 7, 1–5. [Google Scholar]
- Lu, J.H.; Zhang, X.L.; Yang, Z. Saturation calculation model with variable rock-electrical parameters for tight sandstone reservoirs: A case study of the Shihezi Formation (8th Member) in Western Sulige Gas Field. Geoscience 2022, 36, 1131–1137. [Google Scholar]
- Cheng, J. Studying on the Method of Tight Gas Reservoir Well Log Interpretation of the East Sulige Gas Field. Master’s Thesis, Xi’an Shiyou University, Xi’an, China, 2012. [Google Scholar]
- Li, Y.G.; Lu, Z.Q.; Shi, L.H. On the saturation computation model based on variable rock-electro Parameters. Well Logging Technol. 2015, 39, 181–184+195. [Google Scholar]


Disclaimer/Publisher’s Note: The statements, opinions and data contained in all publications are solely those of the individual author(s) and contributor(s) and not of MDPI and/or the editor(s). MDPI and/or the editor(s) disclaim responsibility for any injury to people or property resulting from any ideas, methods, instructions or products referred to in the content. |
© 2024 by the authors. Licensee MDPI, Basel, Switzerland. This article is an open access article distributed under the terms and conditions of the Creative Commons Attribution (CC BY) license (https://creativecommons.org/licenses/by/4.0/).