
Response of Nitrogen Removal Performance and Microbial Distribution to Seasonal Shock Nutrients Load in a Lakeshore Multicell Constructed Wetland


Abstract
:1. Introduction
2. Materials and Methods
2.1. Sites and MCW System Description
2.2. Sample Collection and Analyses
2.3. Microbial Analyses
2.4. Statistical Analyses
3. Results and Discussion
3.1. Characteristics of Water Quantity and Nitrogen Concentrations in Influent and Effluent
3.1.1. Water Quantity
3.1.2. Nitrogen Concentration
3.2. Seasonal Variation in Design and Operational Parameters
3.2.1. MLR
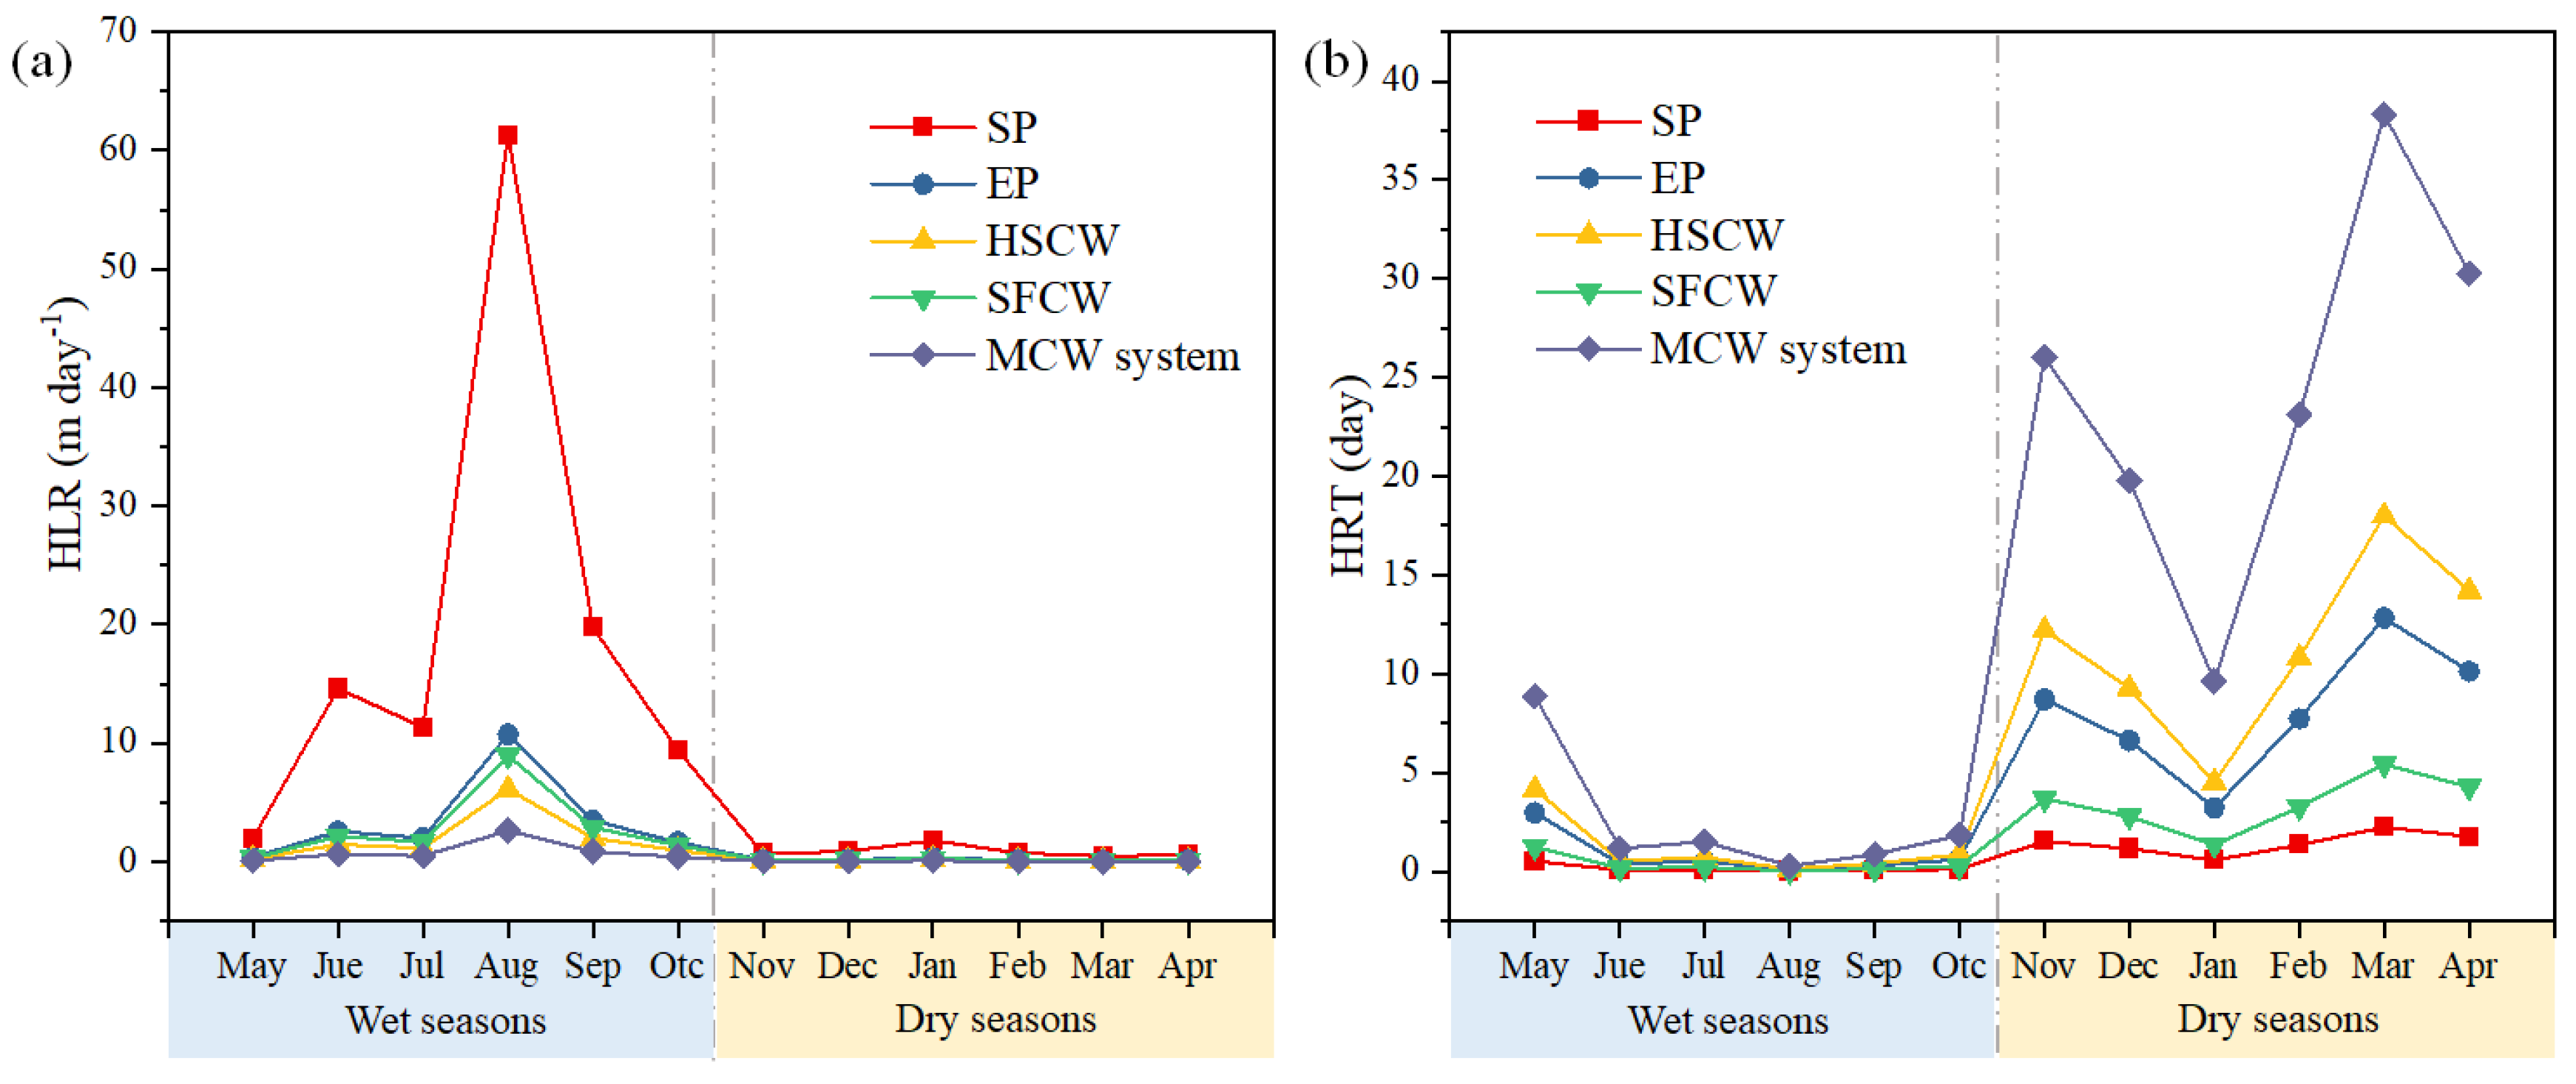
3.2.2. HLR
3.2.3. HRT
3.3. Comparison of Nitrogen Removal Performances
3.3.1. Seasonal nitrogen removal performance of the lakeshore MCW system
3.3.2. Nitrogen Removal Performances of the Various Cells
3.4. Effects of Seasonal Parameters on the Nitrogen Removal
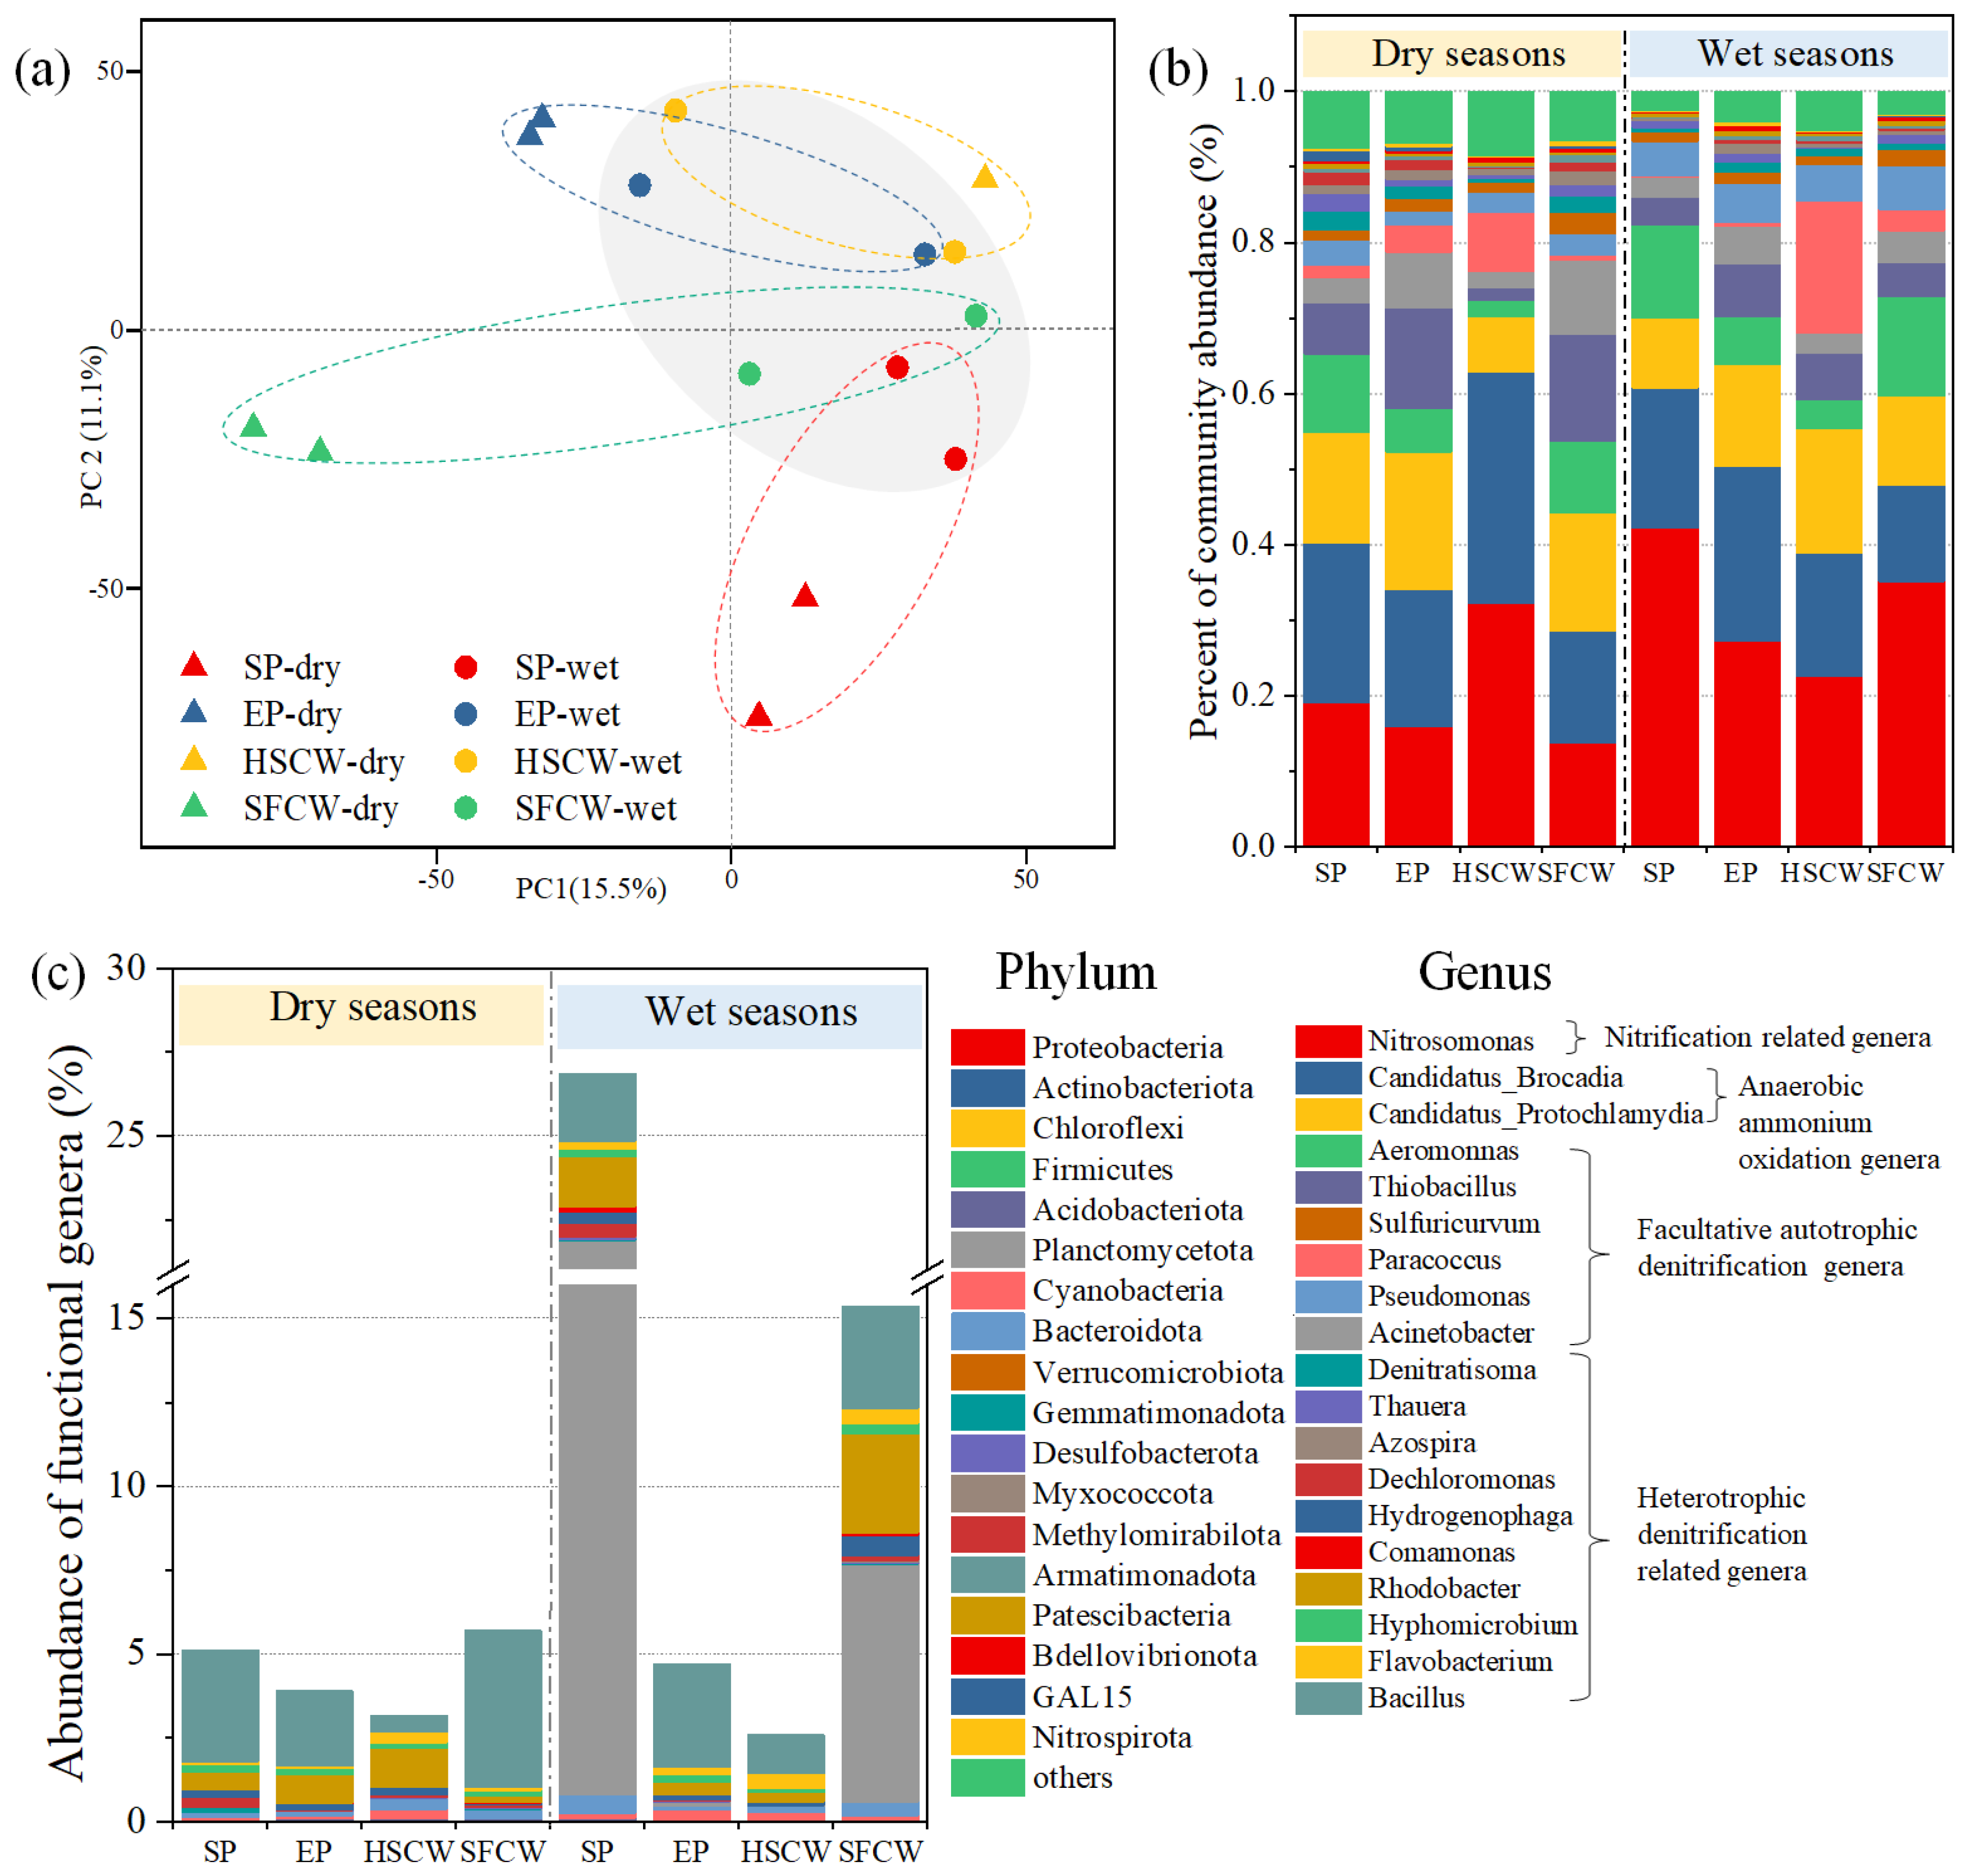
3.5. Spatial and Temporal Variations in Microbial Community
3.6. Effects of Seasonal Parameters on the Microbial Community
3.7. Regulation Suggestion for Lakeshore Multicell Constructed Wetlands
4. Conclusions
Supplementary Materials
Author Contributions
Funding
Data Availability Statement
Conflicts of Interest
References
- Qin, B.; Zhang, Y.; Zhu, G.; Gao, G. Eutrophication control of large shallow lakes in China. Sci. Total Environ. 2023, 881, 163494. [Google Scholar] [CrossRef] [PubMed]
- Wang, J.; Lu, J.; Zhang, Z.; Han, X.; Zhang, C.; Chen, X. Agricultural non-point sources and their effects on chlorophyll-a in a eutrophic lake over three decades (1985–2020). Environ. Sci. Pollut. Res. 2022, 29, 46634–46648. [Google Scholar] [CrossRef] [PubMed]
- Li, D.; Ye, B.; Hou, Z.; Chu, Z.; Zheng, B. Long-term performance and microbial distribution of a filed-scale storing multi-pond constructed wetland with Ottelia acuminata for the treatment of non-point source pollution. J. Clean. Prod. 2020, 262, 121367. [Google Scholar] [CrossRef]
- Cole, L.J.; Stockan, J.; Helliwell, R. Managing riparian buffer strips to optimise ecosystem services: A review. Agric. Ecosyst. Environ. 2020, 296, 106891. [Google Scholar] [CrossRef]
- Walton, C.R.; Zak, D.; Audet, J.; Petersen, R.J.; Lange, J.; Oehmke, C.; Wichtmann, W.; Kreyling, J.; Grygoruk, M.; Jabłońska, E.; et al. Wetland buffer zones for nitrogen and phosphorus retention: Impacts of soil type, hydrology and vegetation. Sci. Total Environ. 2020, 727, 138709. [Google Scholar] [CrossRef] [PubMed]
- Fernandez-Fernandez, M.I.; Vega, P.T.M.D.; Jaramillo-Morán, M.A.; Garrido, M. Hybrid constructed wetland to improve organic matter and nutrient removal. Water 2020, 12, 2023. [Google Scholar] [CrossRef]
- Wang, T.; Xiao, L.; Lu, H.; Lu, S.; Li, J.; Guo, X.; Zhao, X. Nitrogen removal from summer to winter in a field pilot-scale multistage constructed wetland-pond system. J. Environ. Sci. 2022, 111, 249–262. [Google Scholar] [CrossRef]
- Byeon, C.; Nam, B.E. An assessment of the ecological functions of a sustainable structured wetland biotope (SSB). Ecol. Eng. 2020, 145, 105723. [Google Scholar] [CrossRef]
- Li, D.; Chu, Z.; Zeng, Z.; Sima, M.; Huang, M.; Zheng, B. Effects of design parameters, microbial community and nitrogen removal on the field-scale multi-pond constructed wetlands. Sci. Total Environ. 2021, 797, 148989. [Google Scholar] [CrossRef]
- Li, D.; Chu, Z.; Huang, M.; Zheng, B. Multiphasic assessment of effects of design configuration on nutrient removal in storing multiple-pond constructed wetlands. Bioresour. Technol. 2019, 290, 121748. [Google Scholar] [CrossRef]
- Wang, T.; Xiao, L.; Lu, H.; Lu, S.; Zhao, X.; Liu, F. Effect of the influent substrate concentration on nitrogen removal from summer to winter in field pilot-scale multistage constructed wetland–pond systems for treating low-C/N river water. Sustainability 2021, 13, 12456. [Google Scholar] [CrossRef]
- Mendes, L.R. Nitrogen Removal from Agricultural Subsurface Drainage by Surface-Flow Wetlands: Variability. Processes 2021, 9, 156. [Google Scholar] [CrossRef]
- Li, D.; Zheng, B.; Liu, Y.; Chu, Z.; He, Y.; Huang, M. Use of multiple water surface flow constructed wetlands for non-point source water pollution control. Appl. Microbiol. Biotechnol. 2018, 102, 5335–5368. [Google Scholar] [CrossRef] [PubMed]
- Zhao, Y.; Wang, H.; Dong, W.; Chang, Y.; Yan, G.; Chu, Z.; Ling, Y.; Wang, Z.; Fan, T.; Li, C. Nitrogen removal and microbial community for the treatment of rural domestic sewage with low C/N ratio by A/O biofilter with Arundo donax as carbon source and filter media. J. Water Process. Eng. 2020, 37, 101509. [Google Scholar] [CrossRef]
- Chen, D.; Gu, X.; Zhu, W.; He, S.; Wu, F.; Huang, J.; Zhou, W. Denitrification- and anammox-dominant simultaneous nitrification, anammox and denitrification (SNAD) process in subsurface flow constructed wetlands. Bioresour. Technol. 2019, 271, 298–305. [Google Scholar] [CrossRef]
- Song, S.; Wang, B.; Yang, T.; Gu, Y.; Sheng, S.; Zhao, D.; An, S.; Li, A. Performance and Bacteria Communities of a Full-Scale Constructed Wetland Treating the Secondary Effluent after Multi-Years’ Operation. Processes 2023, 11, 1469. [Google Scholar] [CrossRef]
- Erler, D.; Eyre, B.; Davison, L. The contribution of anammox and denitrification to sediment N2 production in a surface flow constructed wetland. Environ. Sci. Technol. 2008, 42, 9144–9150. [Google Scholar] [CrossRef]
- Kabuba, J.; Lephallo, J.; Rutto, H. Comparison of various technologies used to eliminate nitrogen from wastewater: A review. J. Water Process. Eng. 2022, 48, 102885. [Google Scholar] [CrossRef]
- He, K.; Qin, H.; Wang, F.; Ding, W.; Yin, Y. Importance of the Submerged Zone during Dry Periods to Nitrogen Removal in a Bioretention System. Water 2020, 12, 876. [Google Scholar] [CrossRef]
- Lu, S.; Sun, Y.; Lu, B.; Zheng, D.; Xu, S. Change of abundance and correlation of Nitrospira inopinata-like comammox and populations in nitrogen cycle during different seasons. Chemosphere 2020, 241, 125098. [Google Scholar] [CrossRef]
- Zhu, G.; Wang, S.; Wang, W.; Wang, Y.; Zhou, L.; Jiang, B.; Op Den Camp, H.J.M.; Risgaard-Petersen, N.; Schwark, L.; Peng, Y.; et al. Hotspots of anaerobic ammonium oxidation at land–freshwater interfaces. Nat. Geosci. 2013, 6, 103–107. [Google Scholar] [CrossRef]
- Lin, S.; Shen, S.; Zhou, A.; Lyu, H. Sustainable development and environmental restoration in Lake Erhai, China. J. Clean. Prod. 2020, 258, 120758. [Google Scholar] [CrossRef]
- APHA. Standard Methods for the Examination of Water and Wastewater, 22nd ed.; American Public Health Association: Washington, DC, USA, 2012. [Google Scholar]
- Li, D.; Zheng, B.; Chu, Z.; Liu, Y.; Huang, M. Seasonal variations of performance and operation in field-scale storing multipond constructed wetlands for nonpoint source pollution mitigation in a plateau lake basin. Bioresour. Technol. 2019, 280, 295–302. [Google Scholar] [CrossRef] [PubMed]
- Ruan, W.; Cai, H.; Xu, X.; Man, Y.; Wang, R.; Tai, Y.; Chen, Z.; Vymazal, J.; Chen, J.; Yang, Y.; et al. Efficiency and plant indication of nitrogen and phosphorus removal in constructed wetlands: A field-scale study in a frost-free area. Sci. Total Environ. 2021, 799, 149301. [Google Scholar] [CrossRef]
- Ren, Z.; Fu, X.; Zhang, G.; Li, Y.; Qin, Y.; Wang, P.; Liu, X.; Lv, L. Study on performance and mechanism of enhanced low-concentration ammonia nitrogen removal from low-temperature wastewater by iron-loaded biological activated carbon filter. J. Environ. Manag. 2022, 301, 113859. [Google Scholar] [CrossRef] [PubMed]
- Wu, H.; Zhang, J.; Ngo, H.H.; Guo, W.; Hu, Z.; Liang, S.; Fan, J.; Liu, H. A review on the sustainability of constructed wetlands for wastewater treatment: Design and operation. Bioresour. Technol. 2015, 175, 594–601. [Google Scholar] [CrossRef] [PubMed]
- Wu, Y.; Han, R.; Yang, X.; Fang, X.; Chen, X.; Yang, D.; Zhang, R. Correlating microbial community with physicochemical indices and structures of a full-scale integrated constructed wetland system. Appl. Microbiol. Biotechnol. 2016, 100, 6917–6926. [Google Scholar] [CrossRef] [PubMed]
- Sun, H.; Xu, S.; Wu, S.; Wang, R.; Zhuang, G.; Bai, Z.; Deng, Y.; Zhuang, X. Enhancement of facultative anaerobic denitrifying communities by oxygen release from roots of the macrophyte in constructed wetlands. J. Environ. Manag. 2019, 246, 157–163. [Google Scholar] [CrossRef] [PubMed]
- Vinther, F.P. Measured and simulated denitrification activity in a cropped sandy and loamy soil. Biol. Fertil. Soils 1992, 14, 43–48. [Google Scholar] [CrossRef]
- Xue, L.; Ren, H.; Li, S.; Leng, X.; Yao, X. Soil bacterial community structure and co-occurrence pattern during vegetation restoration in karst rocky desertification area. Front. Microbiol. 2017, 8, 2377. [Google Scholar] [CrossRef] [PubMed]
- Verduzo Garibay, M.; Fernández Del Castillo, A.; de Anda, J.; Senés-Guerrero, C.; Gradilla-Hernández, M.S. Structure and activity of microbial communities in response to environmental, operational, and design factors in constructed wetlands. Int. J. Environ. Sci. Technol. 2022, 19, 11587–11612. [Google Scholar] [CrossRef]
- Mobarry, B.K.; Wagner, M.; Urbain, V.; Rittmann, B.E.; Stahl, D.A. Phylogenetic probes for analyzing abundance and spatial organization of nitrifying bacteria. Appl. Environ. Microbiol. 1996, 62, 2156–2162. [Google Scholar] [CrossRef] [PubMed]
- Zhang, J.; Yang, Y.; Zhao, L.; Li, Y.; Xie, S.; Liu, Y. Distribution of sediment bacterial and archaeal communities in plateau freshwater lakes. Appl. Microbiol. Biotechnol. 2015, 99, 3291–3302. [Google Scholar] [CrossRef] [PubMed]
- Pochana, K.; Keller, J.; Lant, P. Model development for simultaneous nitrification and denitrification. Water Sci. Technol. 1999, 39, 235–243. [Google Scholar] [CrossRef]
- Martín, H.G.; Ivanova, N.; Kunin, V.; Warnecke, F.; Barry, K.W.; Mchardy, A.C.; Yeates, C.; He, S.; Salamov, A.A.; Szeto, E.; et al. Metagenomic analysis of two enhanced biological phosphorus removal (EBPR) sludge communities. Nat. Biotechnol. 2006, 24, 1263–1269. [Google Scholar] [CrossRef]
- Wentzel, M.C.; Lotter, L.H.; Loewenthal, R.E. Metabolic behaviour of Acinetobacter spp. in enhanced biological phosphorus removal—A biochemical model. Water SA 1986, 12, 209–224. [Google Scholar]
- Yan, L.; Xie, C.; Xu, X.; Che, S. Effects of revetment type on the spatial distribution of soil nitrification and denitrification in adjacent tidal urban riparian zones. Ecol. Eng. 2019, 132, 65–74. [Google Scholar] [CrossRef]
- Liu, X.; Tiquia, S.M.; Holguin, G.; Wu, L.; Nold, S.C.; Devol, A.H.; Luo, K.; Palumbo, A.V.; Tiedje, J.M.; Zhou, J. Molecular Diversity of Denitrifying Genes in Continental Margin Sediments within the Oxygen-Deficient Zone off the Pacific Coast of Mexico. Appl. Environ. Microbiol. 2003, 69, 3549–3560. [Google Scholar] [CrossRef]
- Middleton, J.A.; de Sosa, L.L.; Martin, B.C.; Jones, D.L.; Gleeson, D.B. Soil microbes of an urban remnant riparian zone have greater potential for N removal than a degraded riparian zone. Environ. Microbiol. 2020, 22, 3302–3314. [Google Scholar] [CrossRef] [PubMed]


| cin (mg L−1) | cout (mg L−1) | RE (%) | MRR (mg m−2 day−1) | MRRv (mg m−3 day−1) | MLR (mg m−2 day−1) | HLR (m day−1) | HRT (day) | ||
|---|---|---|---|---|---|---|---|---|---|
| Wet (n = 6) | TN | 27.30 ± 14.36 | 10.11 ± 8.83 | 65.95 ± 25.01 | 15,741.45 ± 17,419.21 | 21680.63 ± 23991.40 | 846.65 ± 1173.06 | 0.84 ± 0.90 | 2.42 ± 3.20 |
| NO3−-N | 24.43 ± 13.89 | 8.54 ± 8.43 | 68.61 ± 26.41 | 15,088.87 ± 17,337.83 | 20,781.84 ± 23,879.31 | 791.85 ± 1135.34 | |||
| NH4+-N | 0.62 ± 0.49 | 0.21 ± 0.19 | 53.64 ± 30.57 | 295.09 ± 339.01 | 406.43 ± 466.91 | 13.53 ± 14.57 | |||
| Dry (n = 6) | TN | 15.64 ± 4.99 | 9.21 ± 7.63 | 46.22 ± 38.60 | 180.03 ± 108.41 | 247.96 ± 149.32 | 15.60 ± 7.29 | 0.04 ± 0.02 | 24.53 ± 9.71 |
| NO3−-N | 12.72 ± 5.31 | 6.86 ± 7.36 | 49.66 ± 42.61 | 154.41 ± 127.25 | 212.67 ± 175.26 | 11.30 ± 5.35 | |||
| NH4+-N | 0.29 ± 0.10 | 0.15 ± 0.07 | 45.11 ± 25.16 | 5.77 ± 6.33 | 7.95 ± 8.72 | 0.33 ± 0.31 | |||
| Year (n = 12) | TN | 21.47 ± 12.23 | 9.66 ± 8.26 | 56.09 ± 32.68 | 7960.74 ± 14,281.83 | 10,964.30 ± 19,670.30 | 431.12 ± 902.14 | 0.44 ± 0.74 | 13.47 ± 13.45 |
| NO3−-N | 18.58 ± 12.04 | 7.70 ± 7.96 | 59.13 ± 35.22 | 7621.64 ± 14,052.49 | 10,497.25 ± 19,354.43 | 401.57 ± 867.22 | |||
| NH4+-N | 0.45 ± 0.39 | 0.18 ± 0.15 | 49.37 ± 27.06 | 150.43 ± 274.02 | 207.19 ± 377.40 | 6.93 ± 12.00 |
Disclaimer/Publisher’s Note: The statements, opinions and data contained in all publications are solely those of the individual author(s) and contributor(s) and not of MDPI and/or the editor(s). MDPI and/or the editor(s) disclaim responsibility for any injury to people or property resulting from any ideas, methods, instructions or products referred to in the content. |
© 2023 by the authors. Licensee MDPI, Basel, Switzerland. This article is an open access article distributed under the terms and conditions of the Creative Commons Attribution (CC BY) license (https://creativecommons.org/licenses/by/4.0/).
Share and Cite
Yuan, J.; Wang, B.; Hou, Z.; Peng, J.; Li, D.; Chu, Z. Response of Nitrogen Removal Performance and Microbial Distribution to Seasonal Shock Nutrients Load in a Lakeshore Multicell Constructed Wetland. Processes 2023, 11, 2781. https://doi.org/10.3390/pr11092781
Yuan J, Wang B, Hou Z, Peng J, Li D, Chu Z. Response of Nitrogen Removal Performance and Microbial Distribution to Seasonal Shock Nutrients Load in a Lakeshore Multicell Constructed Wetland. Processes. 2023; 11(9):2781. https://doi.org/10.3390/pr11092781
Chicago/Turabian StyleYuan, Jing, Bin Wang, Zeying Hou, Jiayu Peng, Dan Li, and Zhaosheng Chu. 2023. "Response of Nitrogen Removal Performance and Microbial Distribution to Seasonal Shock Nutrients Load in a Lakeshore Multicell Constructed Wetland" Processes 11, no. 9: 2781. https://doi.org/10.3390/pr11092781
APA StyleYuan, J., Wang, B., Hou, Z., Peng, J., Li, D., & Chu, Z. (2023). Response of Nitrogen Removal Performance and Microbial Distribution to Seasonal Shock Nutrients Load in a Lakeshore Multicell Constructed Wetland. Processes, 11(9), 2781. https://doi.org/10.3390/pr11092781