Article

Redox Performance and Optimization of the Chemical Composition of Lanthanum–Strontium–Manganese-Based Perovskite Oxide for Two-Step Thermochemical CO2 Splitting

1
Graduate School of Science and Technology, Niigata University, Niigata 950-2181, Japan
2
Faculty of Engineering, Niigata University, Niigata 950-2181, Japan
*
Author to whom correspondence should be addressed.
Processes 2023, 11(9), 2717; https://doi.org/10.3390/pr11092717
Submission received: 7 August 2023 / Revised: 28 August 2023 / Accepted: 4 September 2023 / Published: 11 September 2023

Abstract

:
The effects of substitution at the A- and B sites on the redox performance of a series of lanthanum–strontium–manganese (LSM)-based perovskite oxides (Z = Ni, Co, and Mg) were studied for application in a two-step thermochemical CO2 splitting cycle to produce liquid fuel from synthesis gas using concentrated solar radiation as the proposed energy source and CO2 recovered from the atmosphere as the prospective chemical source. The redox reactivity, stoichiometry of oxygen/CO production, and optimum chemical composition of Ni-, Co-, and Mg-substituted LSM perovskites were investigated to enhance oxygen/CO productivity. Furthermore, the long-term thermal stabilities and thermochemical repeatabilities of the oxides were evaluated and compared with previous data. The valence changes in the constituent ionic species of the perovskite oxides were studied and evaluated by X-ray photoelectron spectroscopy (XPS) for each step of the thermochemical cycle. From the perspectives of high redox reactivity, stoichiometric oxygen/CO production, and thermally stable repeatability in long-term thermochemical cycling, Ni0.20-, Co0.35-, and Mg0.125-substituted La0.7Sr0.3Mn perovskite oxides are the most promising materials among the LSM perovskite oxides for two-step thermochemical CO2 splitting, showing CO productivities of 387–533 μmol/g and time-averaged CO productivities of 12.9–18.0 μmol/(min·g) compared with those of LSM perovskites reported in the literature.

1. Introduction

Thermochemical cycles employ two or more endothermic and exothermic reactions to dissociate water and/or CO2, requiring lower temperatures compared to the thermolysis processes (H2O → H2 + 1/2O2, CO2 → CO + 1/2O2). The two-step thermochemical cycle generally proceeds via redox reactions:
MOox + heat → MOred + 1/2O2
(endothermic thermal reduction (TR) step)
MOred + CO2 (H2O) → MOox + CO (H2) + heat
(exothermic CO2 splitting (CS) or H2O splitting (WS))
where MOox and MOred correspond to the oxidative and reductive forms of reactive metal oxides [1]. In the first step, the metal oxide is thermally reduced at the high temperatures generated by concentrated solar radiation, releasing oxygen (Equation (1)). In the second step, the reductive form of the metal oxide (MOred) reacts with CO2 (or H2O) to produce CO (or H2), regenerating the initial material (MOox) in Equation (2). Concentrated solar radiation is used as a sustainable thermal energy source to drive the thermochemical cycle, whereas water and CO2 are used as chemical sources. The combination of a thermochemical splitting cycle and renewable solar radiation is a promising solution for producing storable and transportable liquid chemical fuels (e.g., ethanol) using an industrially practical Fischer–Tropsch (FT) process. The two-step thermochemical cycle is simple; however, the temperature required for this process is extremely high. A significant challenge for this cycle is the development of reactive materials that can dissociate CO2 (or H2O) with a high rate and productivity while affording thermally stable performance during repeated cycling. The reactive materials for use in solar-driven thermochemical cycles must satisfy the following conditions: decrease the TR temperature (T < 1400 °C); afford high production of CO (or H2) during the CS (or WS) step; promote fast kinetics of both steps; exhibit superior thermal stability and repeatability with low cost and safety to the environment and humans; and must be prepared from readily available and abundant resources.
All possible candidate materials for use in the two-step thermochemical cycle can be categorized as follows: volatile systems (ZnO/Zn, CdO/Cd, and SnO2/SnO) [2,3,4], non-volatile systems (Fe3O4/FeO, Mn3O4/MnO, and mixed metal oxide) [3,5,6,7,8], nonstoichiometric ceria systems (fluorite-based structures of CeO2/CeO2-δ and substituted -CeO2) [9,10,11,12,13,14], and nonstoichiometric perovskite systems (ABO3/ABO3-δ). In this research field, nonstoichiometric ceria is recognized as a current state-of-the-art redox material, and solar fuel production over 500 cycles has been demonstrated using nonstoichiometric ceria in a solar cavity receiver reactor [15,16]. To date, nonstoichiometric ceria systems are one of the most promising materials for the two-step thermochemical cycle because of their favorable properties, such as long-term thermal stability, high oxygen storage capacity, resistance to sintering, fast kinetics in both steps of the thermochemical cycle, and superior redox reactivity [17,18,19,20]. Other potential candidates for the two-step thermochemical cycle are nonstoichiometric perovskite (ABO3/ABO3-δ) systems with a wide range of oxygen nonstoichiometry (δ). δ governs fuel production through an extensive range of variable nonstoichiometry, which induces the formation of lattice defects (oxygen vacancies) in the crystal structure over various operating conditions. Both cationic sites (A- and B sites) in the crystal structure of perovskite oxides can be substituted to control the oxygen nonstoichiometry, kinetics, and thermodynamic properties over a wide range of chemical compositions. Unlike nonstoichiometric ceria, most perovskite oxides require long duration of the splitting step owing to their slow kinetics compared to the TR step [21]. Thus, either a temperature swing between the TR and splitting steps or an excess CO2 (or H2O) gas flow is generally required to enhance the extent and rate of CO (or H2) production [22].
Exploratory research on perovskite oxides is generally conducted to enhance the O2/CO productivity, optimize the range of reduction and oxidation, and reduce the temperature of the TR step and temperature swings between the steps while improving the kinetics. To improve reaction kinetics of perovskite materials, several studies on material molding to increase the specific surface area of the materials were performed [23,24]. Recently, owing to the improvement in the redox reactivity of both steps, as well as their high thermal durability and reliability, the possibility of ionic substitution in the crystal structure and nonstoichiometric perovskite systems have drawn the attention of the scientific community. Previous studies have extensively studied the effects of ion substitution in several perovskites with La or Sr at the A site and Mn at the B site for the CO2 (or H2O) thermochemical cycle [25,26,27,28,29,30,31,32,33,34,35,36,37,38,39,40,41,42,43,44,45,46,47]. The results of test conditions and O2 and CO (or H2) productivities for the perovskites related to the present study are summarized in Table 1. As shown in Table 1, most investigations on thermochemical CO2 splitting have been implemented using a thermogravimetric reactor. There were some limited partial substitutions in the A- or B sites of perovskite oxides [48,49,50]. In addition, the difference in the test conditions complicates the comparison with the literature data. Recently, the chemical composition of perovskites has been explored based on computational chemistry using density functional theory [51,52]. Insight into the redox performance based on computational chemistry enables the prediction of the optimum chemical composition and redox performance of perovskites in the thermochemical cycle. However, validation of these insights using extensive experimental data is required. Extensive experimental analysis of the substitution strategy can complement and support the theoretical data for controlling redox performance and selecting the chemical composition and structure of perovskites.
Recently, the authors reported that Ni, Co, and Mg substitutions at the B site in a series of LaSrMn-based perovskites (La0.7Sr0.3Mn0.9X0.1O3 (X = Mg, Al, Cr, Fe, Co, Ni, Cu, and Ga)) enhanced the productivity and rate of CO production and maintained stoichiometric production (CO/O2 = 2) with high thermal durability over 50 cycles [53]. Based on the screening test, Mg, Co, and Ni substitutions were selected in the current study to improve the O2 and CO productivities and production behavior of the respective steps in the CO2 thermochemical cycle using LSM perovskites by identifying the optimum chemical composition by A- and B-site substitution and to evaluate the redox performance in comparison with previous literature. In terms of the productivity and repeatability of O2 and CO release, the time-relevant production behavior of the respective steps and chemical compositions of the A- and B sites of La1−xSrxMn1−yZyO3 (Z = Ni, Co, or Mg) were experimentally investigated, evaluated, and optimized for the thermochemical cycle. Moreover, the optimal samples for achieving repeatability, reliability of oxygen and CO production, and thermal stability were examined using long-term redox tests. To study and evaluate the role of the substituted ions in the thermochemical cycle, the best-performing samples were analyzed by XPS and compared with nonsubstituted LSM. Finally, the CO productivities per gram of material and the duration of the CS step were compared with the literature data. This result shows that the Co35%- and Ni20%-substituted LSMs afforded the highest level of CO production among the LSM-based perovskites, which has never been previously reported.

2. Materials and Methods

2.1. Material Preparation

La1−xSrxMn1−yZyO3 (Z = Ni, Co, or Mg) perovskite oxides (LSxMZy) were synthesized using a modified Pechini method [54]. The chemical compositions and sample names of the synthesized materials are listed in Table 1. The following reagents were used to prepare the LSxMZy samples: La(NO3)3·6H2O (Wako, 99.9% purity), Sr(NO3)2 (Wako, ≥98.0% purity), Mn(NO3)3·6H2O (Wako, ≥98.0% purity), Mg(NO3)2·6H2O (Wako, ≥98.0% purity), Co(NO3)2·6H2O (Kanto Chemical, ≥98% purity), Ni(NO3)3·6H2O (Wako, 99.9% purity), citric acid (Wako, ≥98.0% purity), and ethylene glycol (Wako, ≥99.5% purity). The metal cations, citric acid, and ethylene glycol were dissolved in distilled water in a molar ratio of 1:5:5. These solutions were stirred and heated at 80 °C for 1 h in an oil bath, and then heated at 170 °C to evaporate the water and form a gel. The obtained gel was dried at 300 °C for 5 h in an electric oven. The resulting precursor was pulverized using a mortar and pestle and calcined at 1200 °C for 8 h. Finally, powder-like LSxMZy samples were prepared. For comparison, cerium oxide (High Purity Chemicals, Saitama, Japan, 99.9% purity) was prepared to evaluate its redox performance.

2.2. Characterization of Samples

Powder X-ray diffraction (XRD) analysis was performed using a Bruker D2 PHASER with Cu-Kα radiation (λ = 0.15418 nm, 30 kV–10 mA) at room temperature to identify the crystallographic phase of the as-prepared samples and the samples after the redox performance test. Powder diffraction data were collected in the 2θ range of 20°–80° with a step interval of 0.02° and a recording time of 1 s. The crystalline phases were identified by comparison with standard reference databases (Inorganic Crystal Structure Database (ICSD) and Crystallography Open Database (COD)). Rietveld refinement was performed using the whole-pattern fitting (WPF) method in the FullProf package to evaluate the space groups, crystal systems, and lattice parameters of the LSxMZy samples. Scanning electron microscopy (SEM, JCM-6000, JEOL, Tokyo, Japan) with an acceleration voltage of 15 kV was used to observe the morphology and grain size of the powder samples before and after the long-term repeatability tests.

2.3. Redox Reactivity of Samples

The redox reactivity of the LSxMZy samples was evaluated by analyzing the oxygen (O2)/carbon monoxide (CO) productivity and production rates of O2 and CO for the two-step thermochemical CO2 splitting cycling. Reactivity was examined using a thermogravimetric (TG) reactor (NETZSCH STA2500 Regulus, weight resolution of 0.03 μg, temperature resolution of 0.3 K) equipped with a type S thermocouple (temperature resolution of ±0.0025 × |t| °C) for the TR and subsequent exothermic CS steps of the sample. The influences (general drift and amount of sample) of the thermogravimetric reactor used in this study on the redox reactivity were described and discussed in detail in our previous study [53]. The redox performance of the samples was evaluated using the following procedure: approximately 50 mg of the sample was packed into a platinum pan and placed on the balance of the reactor. First, 99.999% high-purity nitrogen gas at a flow rate of 100 cm3/min at standard state (unit of sccm) was passed through the reactor for 75 min at a flow rate of 100 cm3/min to purge residual gases in the reactor. To eliminate adsorbed gaseous species on the surface of the sample, the sample was preliminarily heated at 300 °C for 0.5 h at a rate of 50 K/min while purging with nitrogen gas. The sample was subjected to the TR step at 1400 °C for 1.5 h to thermally release oxygen from the sample. The sample temperature was monitored using an S-type thermocouple in contact with the bottom of the platinum pan. The sample was cooled to 1000–1200 °C at a rate of 20 K/min under N2 flow. The purge gas was switched to a gas mixture with an N2 flow rate of 50 sccm and a CO2 flow rate of 50 sccm to perform the CS step. The samples were maintained at the temperature for 0.5 h in the reactor to complete the CS step. The TR and CS steps of the thermochemical cycle were repeated thrice. The weight changes of the samples were recorded as a function of time to observe the fractional extent of the TR and CS steps during the thermochemical cycle.
The long-term thermal stability and repeatability of the samples were evaluated using the following procedures. The TR step was performed at 1400 °C at an N2 flow rate of 100 sccm for 10 min, and the subsequent CS step was conducted at 1200 °C at a gas mixture flow rate of 100 sccm (CO2 50% and N2 50%) for 15 min. The TR and CS steps were repeated 50 times to evaluate the repeatability of the O2 release and CO production. The O2 and CO productivities per unit sample weight (nO2 and nCO [mol/g]) were calculated using the molar weight of the oxygen atom (MO [g/mol]), the weight change of the sample ( m T R , m C S [g]) during the TR and CS steps, and initial weight of the sample (ms [g]). The weight changes of the samples during the TR and CS steps were calculated from the weight decreases and increases, respectively. The O2 and CO production rates per unit weight (rO2 and rCO [mol/(min·g)]) were calculated from the time derivative ( d m d t ) of weight m [g] at time t = t, as shown in Equations (3)–(6).
n O 2 = m T R 2   ×   M O   ×   m s
n C O = m C S M O   ×   m s
r O 2 = d m d t 2   ×   M O   ×   m s
r C O = d m d t M O   ×   m s
X-ray photoelectron spectroscopy (XPS) was performed using a Quantum 2000 instrument (ULVAC-PHI. Inc., Kanagawa, Japan) with an Al anode (Al-Kα, 25 W (15 kV, 1.67 mA), hν = 1486.6 eV) to evaluate the valence states of the elements. For energy calibration of the XPS spectrum, the peaks were normalized relative to the C1s peak of adventitious carbon at a binding energy of 284.8 eV. The Gaussian function for peak fitting, Shirley method [55] for the baseline, and Savitzky–Golay method [56] for data smoothing were used to analyze the XPS data.
CO2-to-CO conversion ratio [%] was calculated as a function of the duration of the CS step as follows:
X C O 2 = 0 t r C O d t · m s 0 t F C O 2 d t
where F C O 2 is the flow rate of CO2 during the CS step. The results for the best samples were compared with those of cerium oxide.

3. Results and Discussion

3.1. Thermochemical Redox Performance of La0.7Sr0.3 Mn1−yZyO3 (Z = Ni, Co, and Mg)

The chemical compositions, lattice parameters, space groups, and crystal systems of all prepared samples of La1−xSrxMn1−yZyO3 (LSxMZy) are listed in 
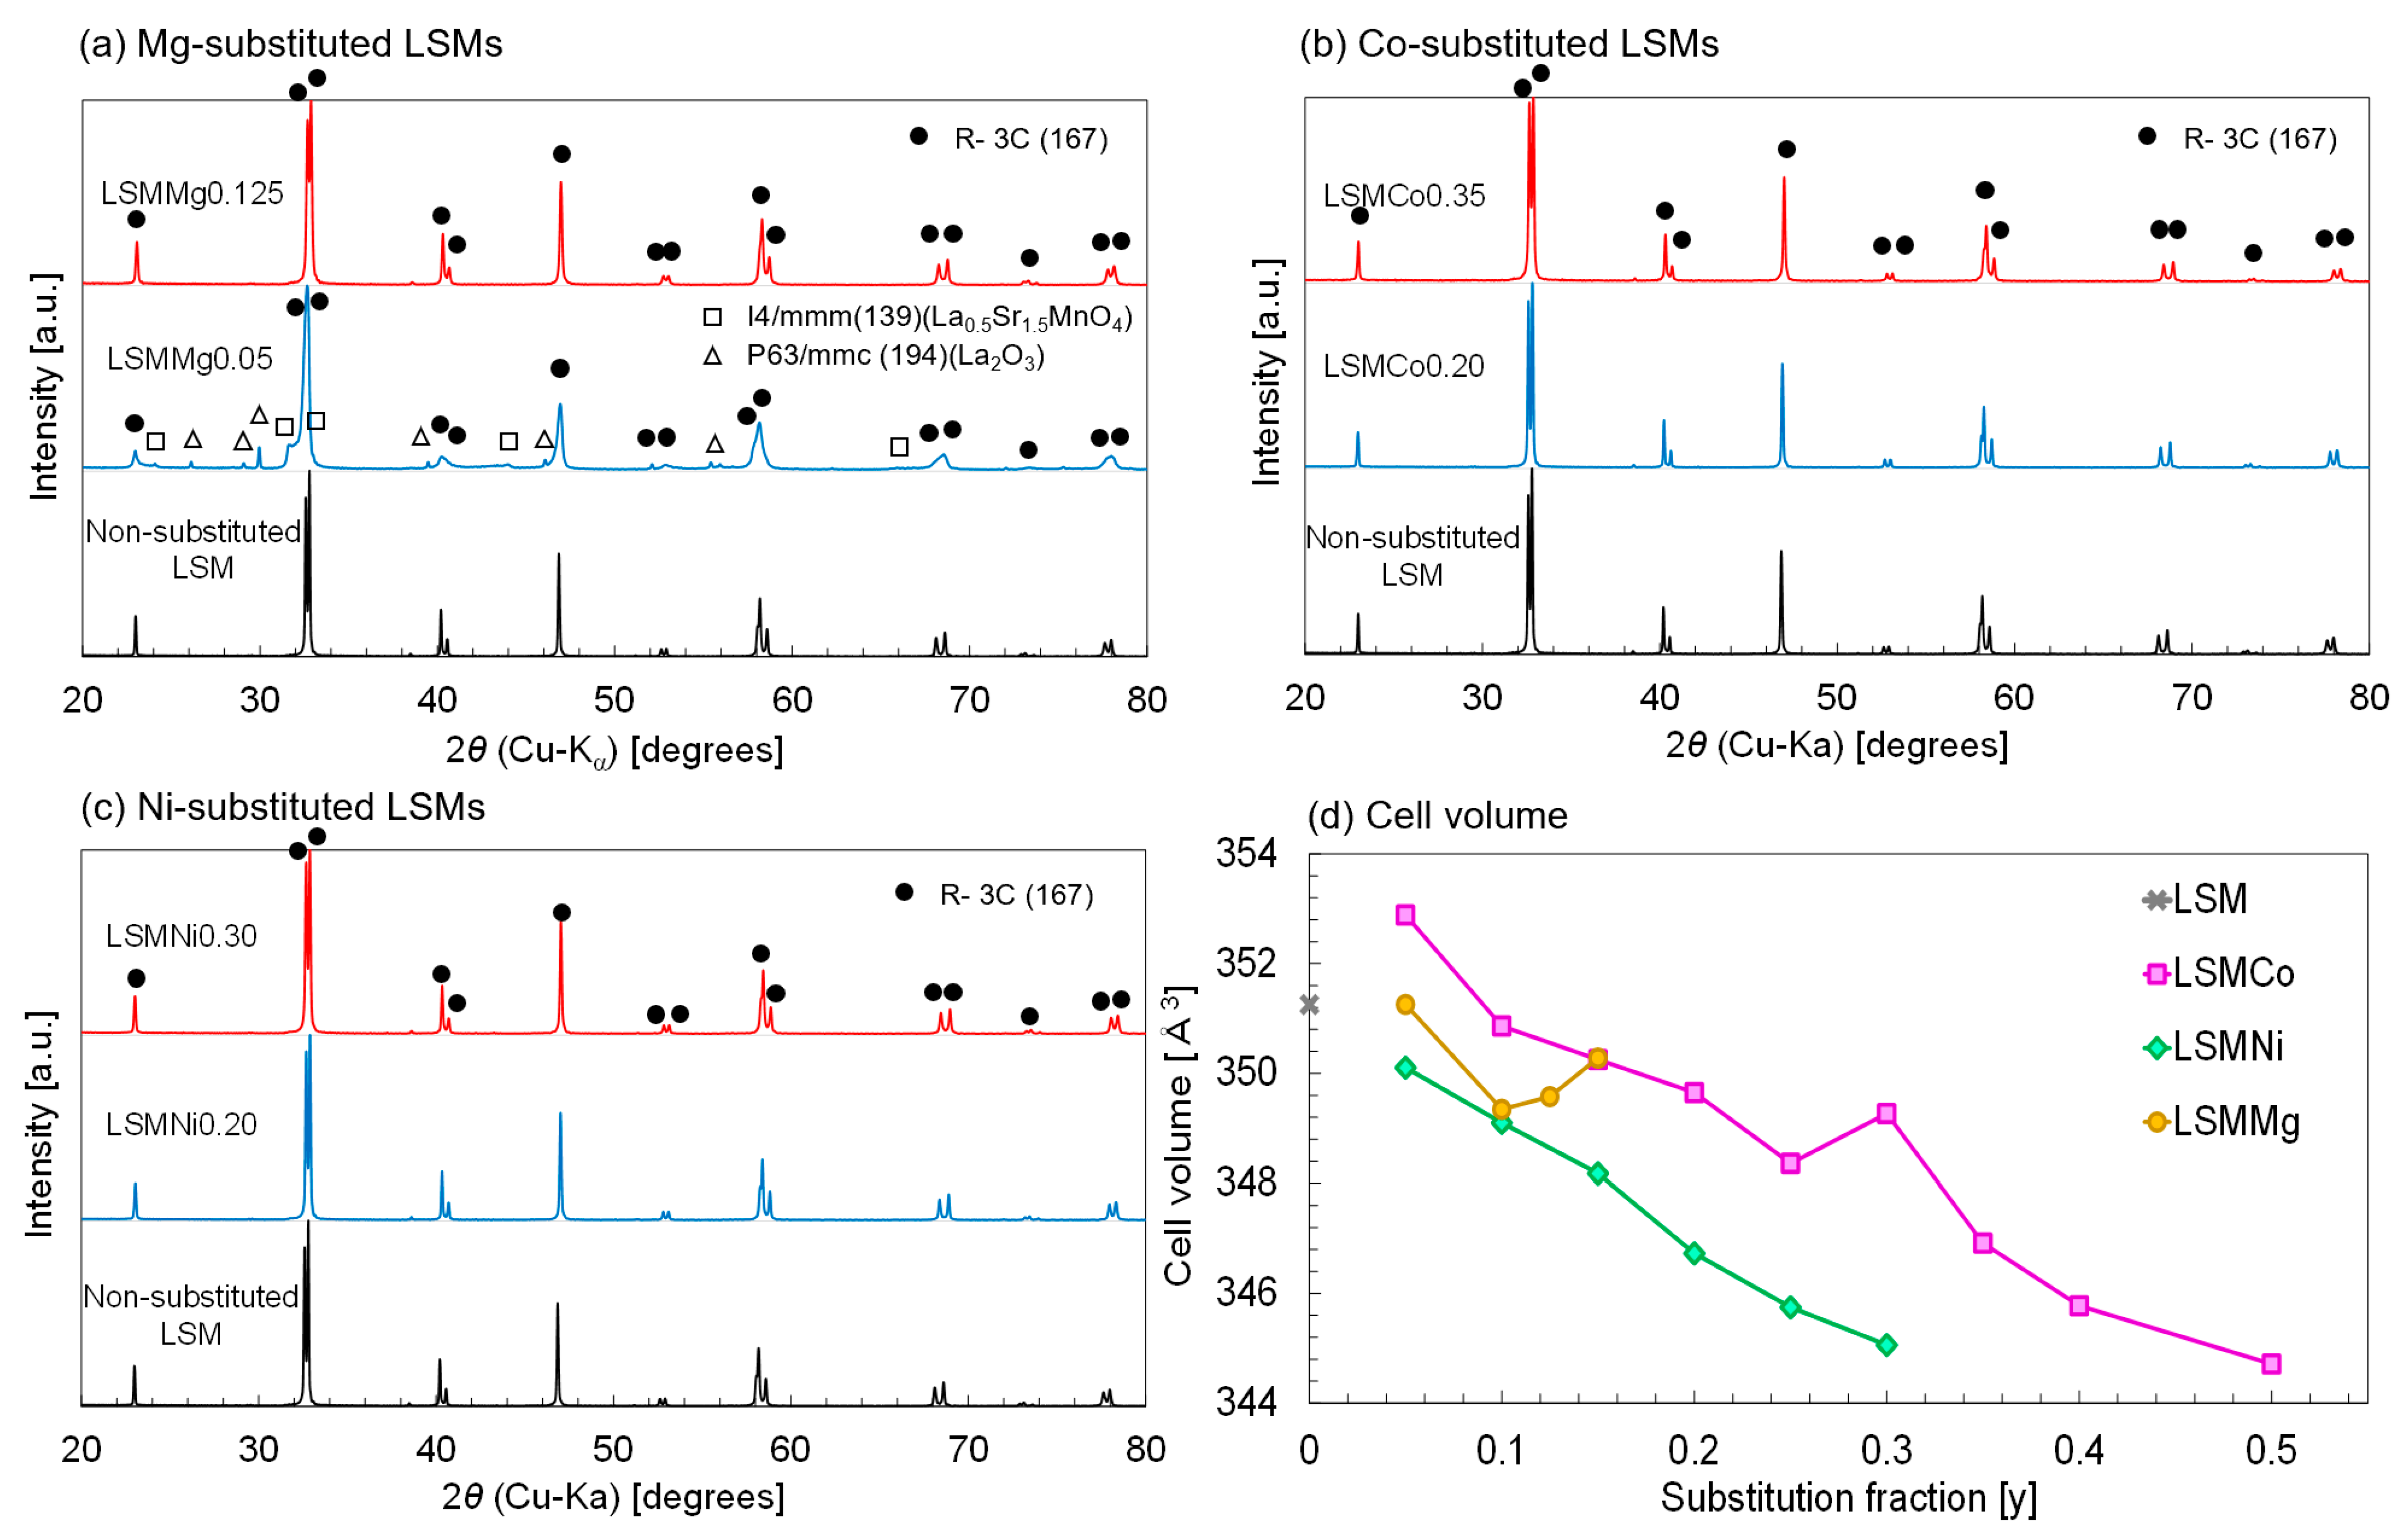
Table 2. Almost all the prepared samples comprised a single solid phase indexed to the trigonal unit cell (space group R-3c (167)), whereas the LSMMg0.05 sample was composed of three solid phases, including a main phase with space group R-3c (167). Figure 1 shows the XRD patterns of (a) Mg-, (b) Co-, and (c) Ni-substituted LSMs at room temperature in the evaluated 2θ range. As shown in Figure 1a, the XRD pattern of LSMMg0.125 is identical to that of the crystalline phase, and the peaks are indexed to the reference La0.7Sr0.3Mn0.85Mg0.15O3 (ICSD code: 258933). This result indicates that Mg ions were incorporated into the B site of the crystal structure and formed a solid solution without byproducts. However, the pattern of LSMMg0.05 showed that some Mg ions were substituted at the A site of the crystal structure (La0.67Sr0.28Mg0.05MnO3 (ICSD code:254217)), resulting in the observation of the La2O3 phase (COD data number:2002286) and La0.5Sr1.5MnO4 (COD data number:1008251). As shown in Figure 1b,c, the patterns of the Co and Ni-substituted LSMs are in good agreement with those of the nonsubstituted LSM. These results indicate that Co and Ni ions were substituted into the B site of the crystal structure as a solid solution within the substitution fraction range. To verify the formation of a solid solution in the substituted LSM samples, the cell parameters of all prepared samples were determined by Rietveld refinement, and the cell volume of the samples was calculated based on the crystal structure.
Figure 1d shows the relationship between the estimated cell volume and the substitution fraction (y) of La0.7Sr0.3Mn1-yZyO3 (Z = Mg, Ni, and Co). In the series of Ni-substituted LSMs, the cell volume decreased as the substitution fraction increased, resulting in an almost linear downward trend. One primary reason for this downtrend is the intermediate value of the ionic radius of trivalent Mn (Mn3+:0.65 Å, six coordination by O2− ion at the high spin) between the ionic radius of divalent and trivalent Ni (Ni2+:0.70 Å, Ni3+:0.60 Å, six coordination by O2− ion in the high spin state) [57] in the B site of the crystal structure. These results indicate that trivalent Ni ions, together with bivalent Ni ions, were incorporated into the B site of the Ni-substituted LSMs as the substitution fraction increased. Another possibility is that the average valence of the Mn ions in the B site increased as the fraction of Ni substitution increased, inducing a decrease in the cell volume. For the Co-substituted LSMs series (Figure 1d), the cell volume of the LSMCo0.05 sample was higher than that of the nonsubstituted LSM. These results indicated that divalent Co ions (ionic radius of Co2: 0.735 Å, six coordinated by O2− ions in the high-spin state) [57] were incorporated into the B site of the Co-substituted LSMs. As the fraction of Co substitution increased, the cell volume decreased in the fraction range of y = 0.1–0.5. The resulting downtrend indicates that divalent, trivalent, or tetravalent Co ions (ionic radius of Co3+: 0.61 Å, Co4+: 0.53 Å, six coordination by O2− ion in the high spin state) [57] are incorporated into the B site instead of Mn ions. The different tendency at y = 0.3 may be owing to the irregular change in the fraction of multivalent ions (Co2+/Co3/Co4) in the LSMCo0.30 sample. For the Mg-substituted LSMs series (Figure 1d), the cell volume of the LSMMg0.10 sample was smaller than that of the nonsubstituted LSM. Because the ionic radius of divalent Mg ions (Mg2+: 0.720 Å, six coordination by O2− ion) [57] is larger than that of Mn3+ ions, the average valence of the Mn ions at the B site increases at y = 0.10. When the substitution fraction in the Mg-substituted LSM series (y = 0.10–0.15) was increased, the cell volume monotonically increased. The results indicate that the average valence of the Mn ions decreased at the B site of the Mg-substituted LSMs. Therefore, maintaining charge valence in the crystal structure is difficult with Mg substitution at y > 0.15. These results indicate that all the samples, except LSMMg0.05, were successfully prepared as a solid solution of the single-crystalline phase of La0.7Sr0.3Mn1−yZyO3 without impurities.
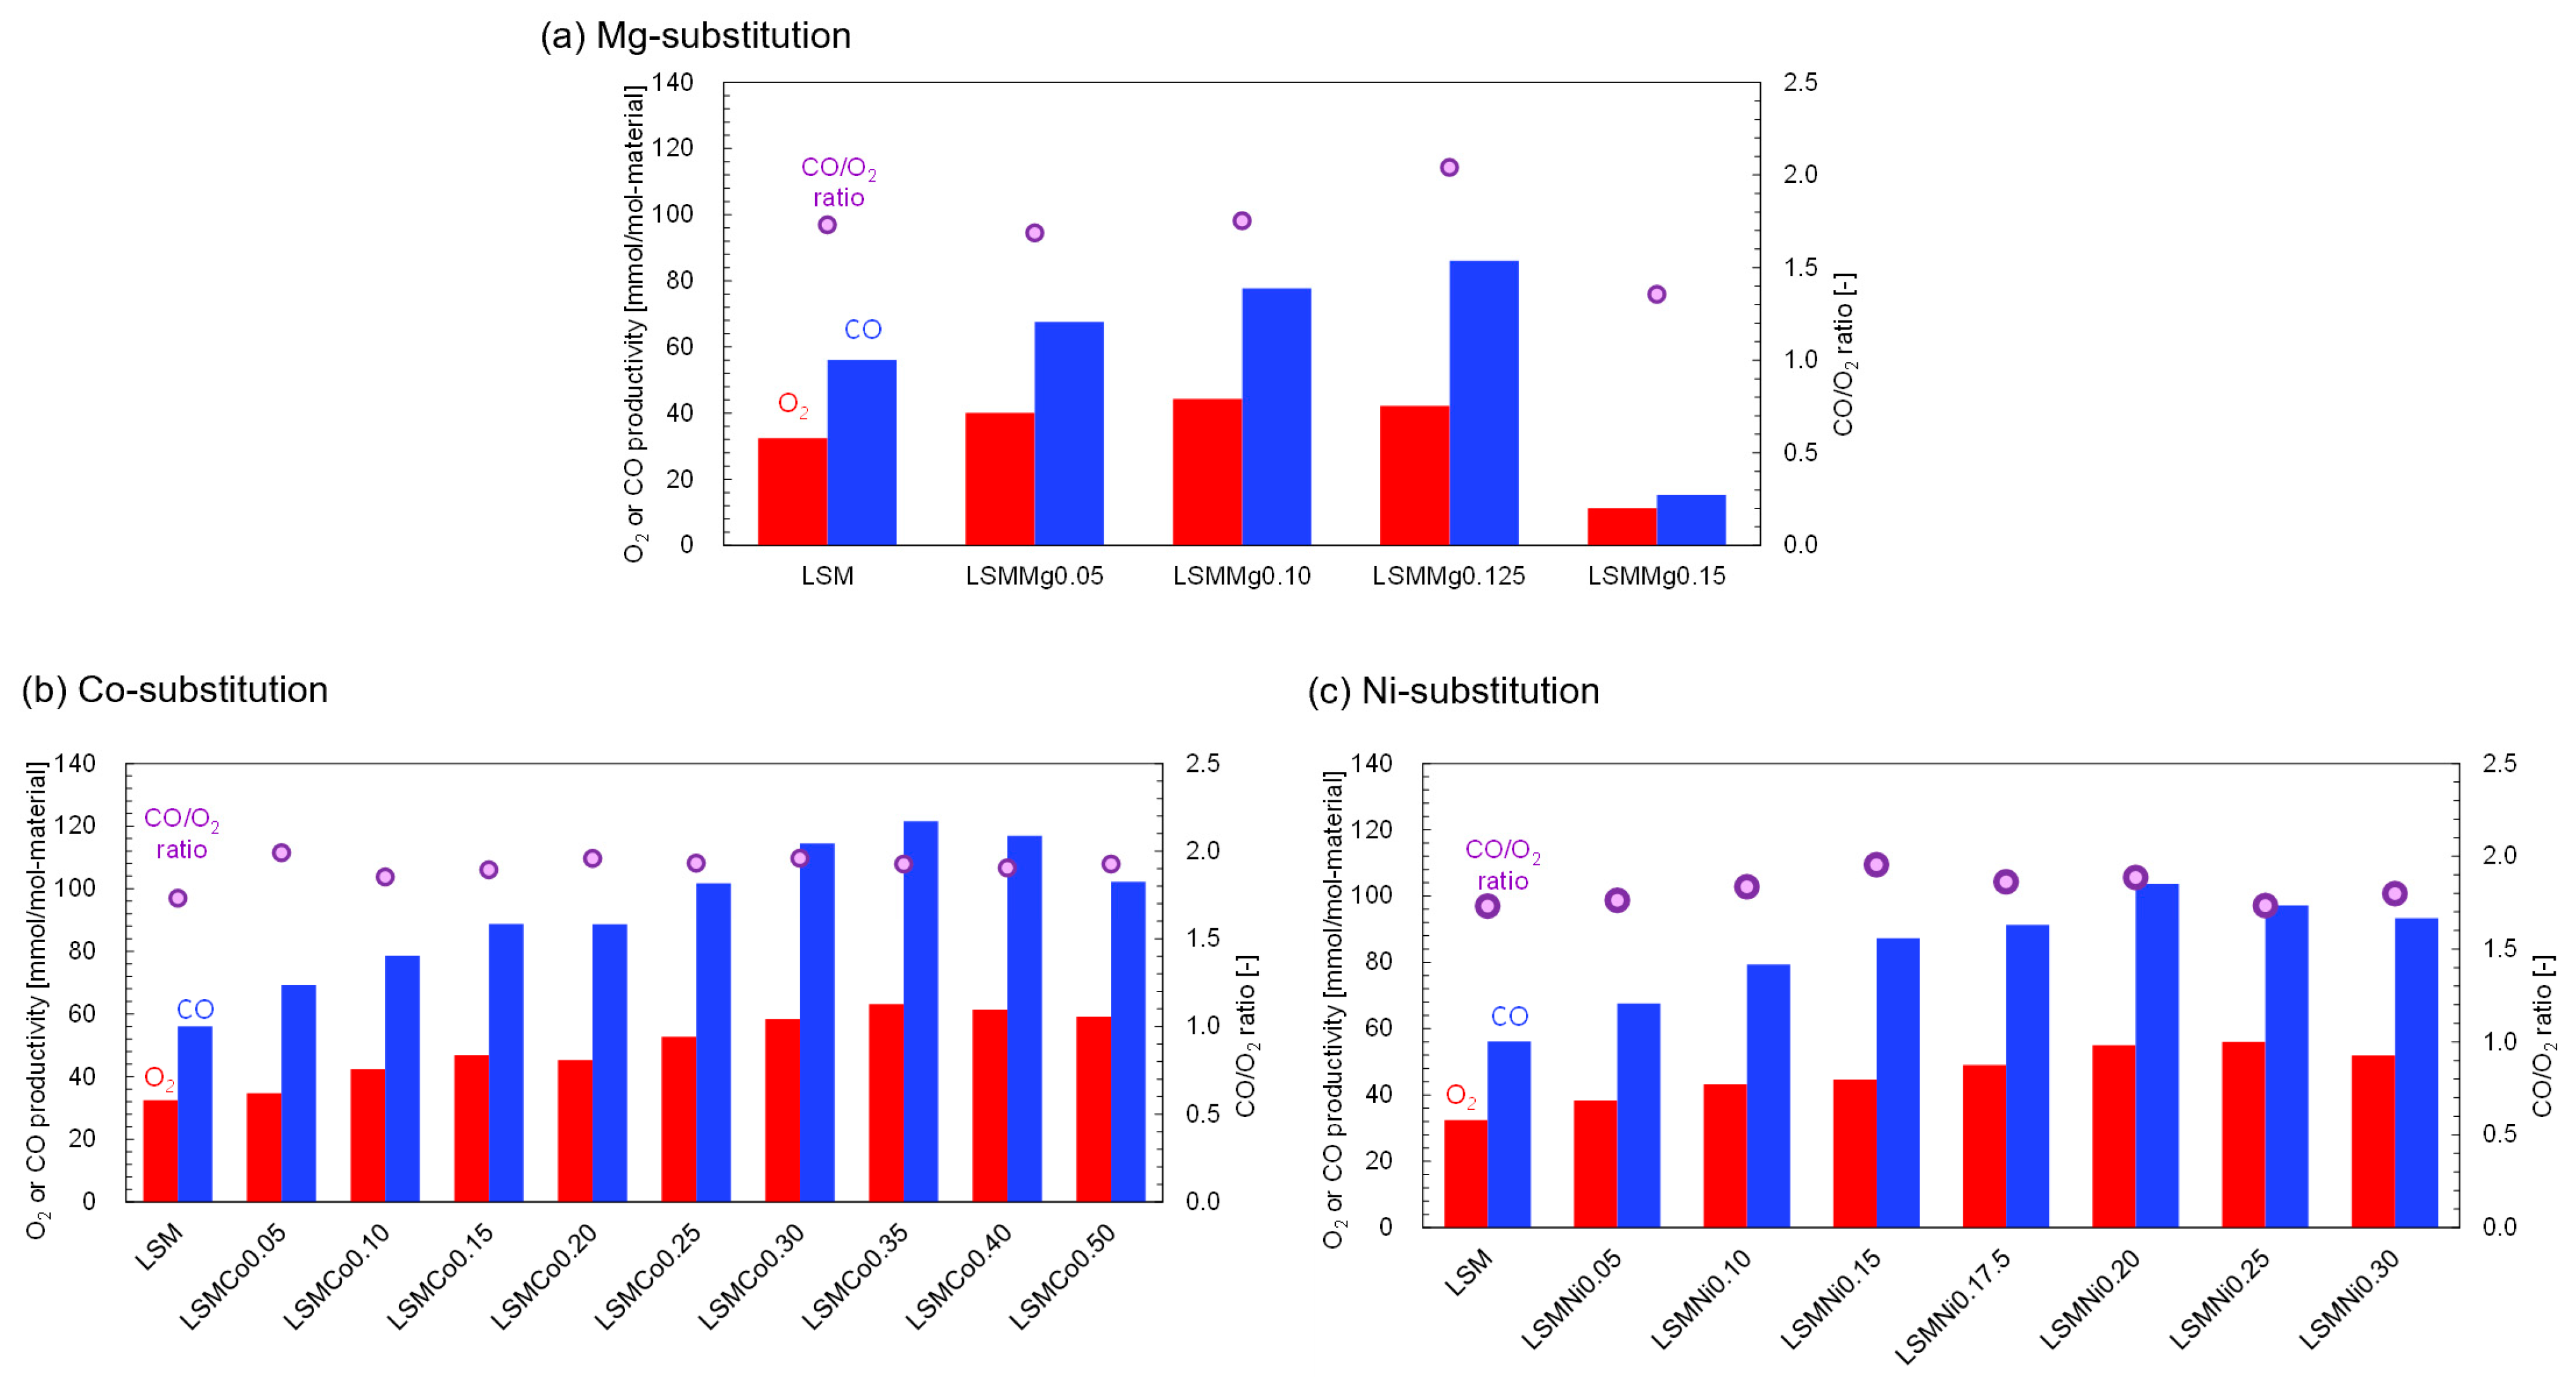
Figure 2 shows the average O2 and CO productivities of Ni-, Co-, and Mg-substituted LSMs. Each productivity value was estimated based on the extent of the weight change. The average productivity was calculated from the second and third runs of the two-step thermochemical CO2 splitting cycling. The value from the first run was excluded from the calculation because the data may have been affected by the sample preparation process. For comparison, nonsubstituted LSM was also evaluated to verify the impact of partial substitution at the B site. As shown in Figure 2a, the O2 productivity of the Mg-substituted LSMs increased with increasing substitution fraction (y) and reached a maximum value of 44.3 mmol/mol-material at y = 0.10 (LSMMg0.10). The CO productivity also increased with the substitution fraction and was maximal (86.1 mmol/mol-material) at y = 0.125 (LSMMg0.125). These results indicate that the partial substitution of Mg at the B site of LSM enhances the O2 and CO productivities. The CO/O2 (CO/O2 = 2.04) value at y = 0.125 is approximately equal to the stoichiometric ratio. The results in Figure 2a indicate that, from the viewpoint of productivity, LSMMg0.125 can provide stable and reproducible O2 and CO production with maximal redox performance. The results obtained for the Co-substituted LSM perovskites are shown in Figure 2b. Maximum O2 and CO productivities were obtained at y = 0.350 and CO/O2 = 1.93. For the Ni-substituted LSM perovskites (Figure 2c), the O2 and CO productivities were maximized at y = 0.200, with CO/O2 = 1.89. These results indicate that the partial substitution of the B site for all ion species (Mg, Co, and Ni) improved the O2 and CO productivities while maintaining stoichiometric reactivity. The most suitable chemical composition depends on the substitution species used.
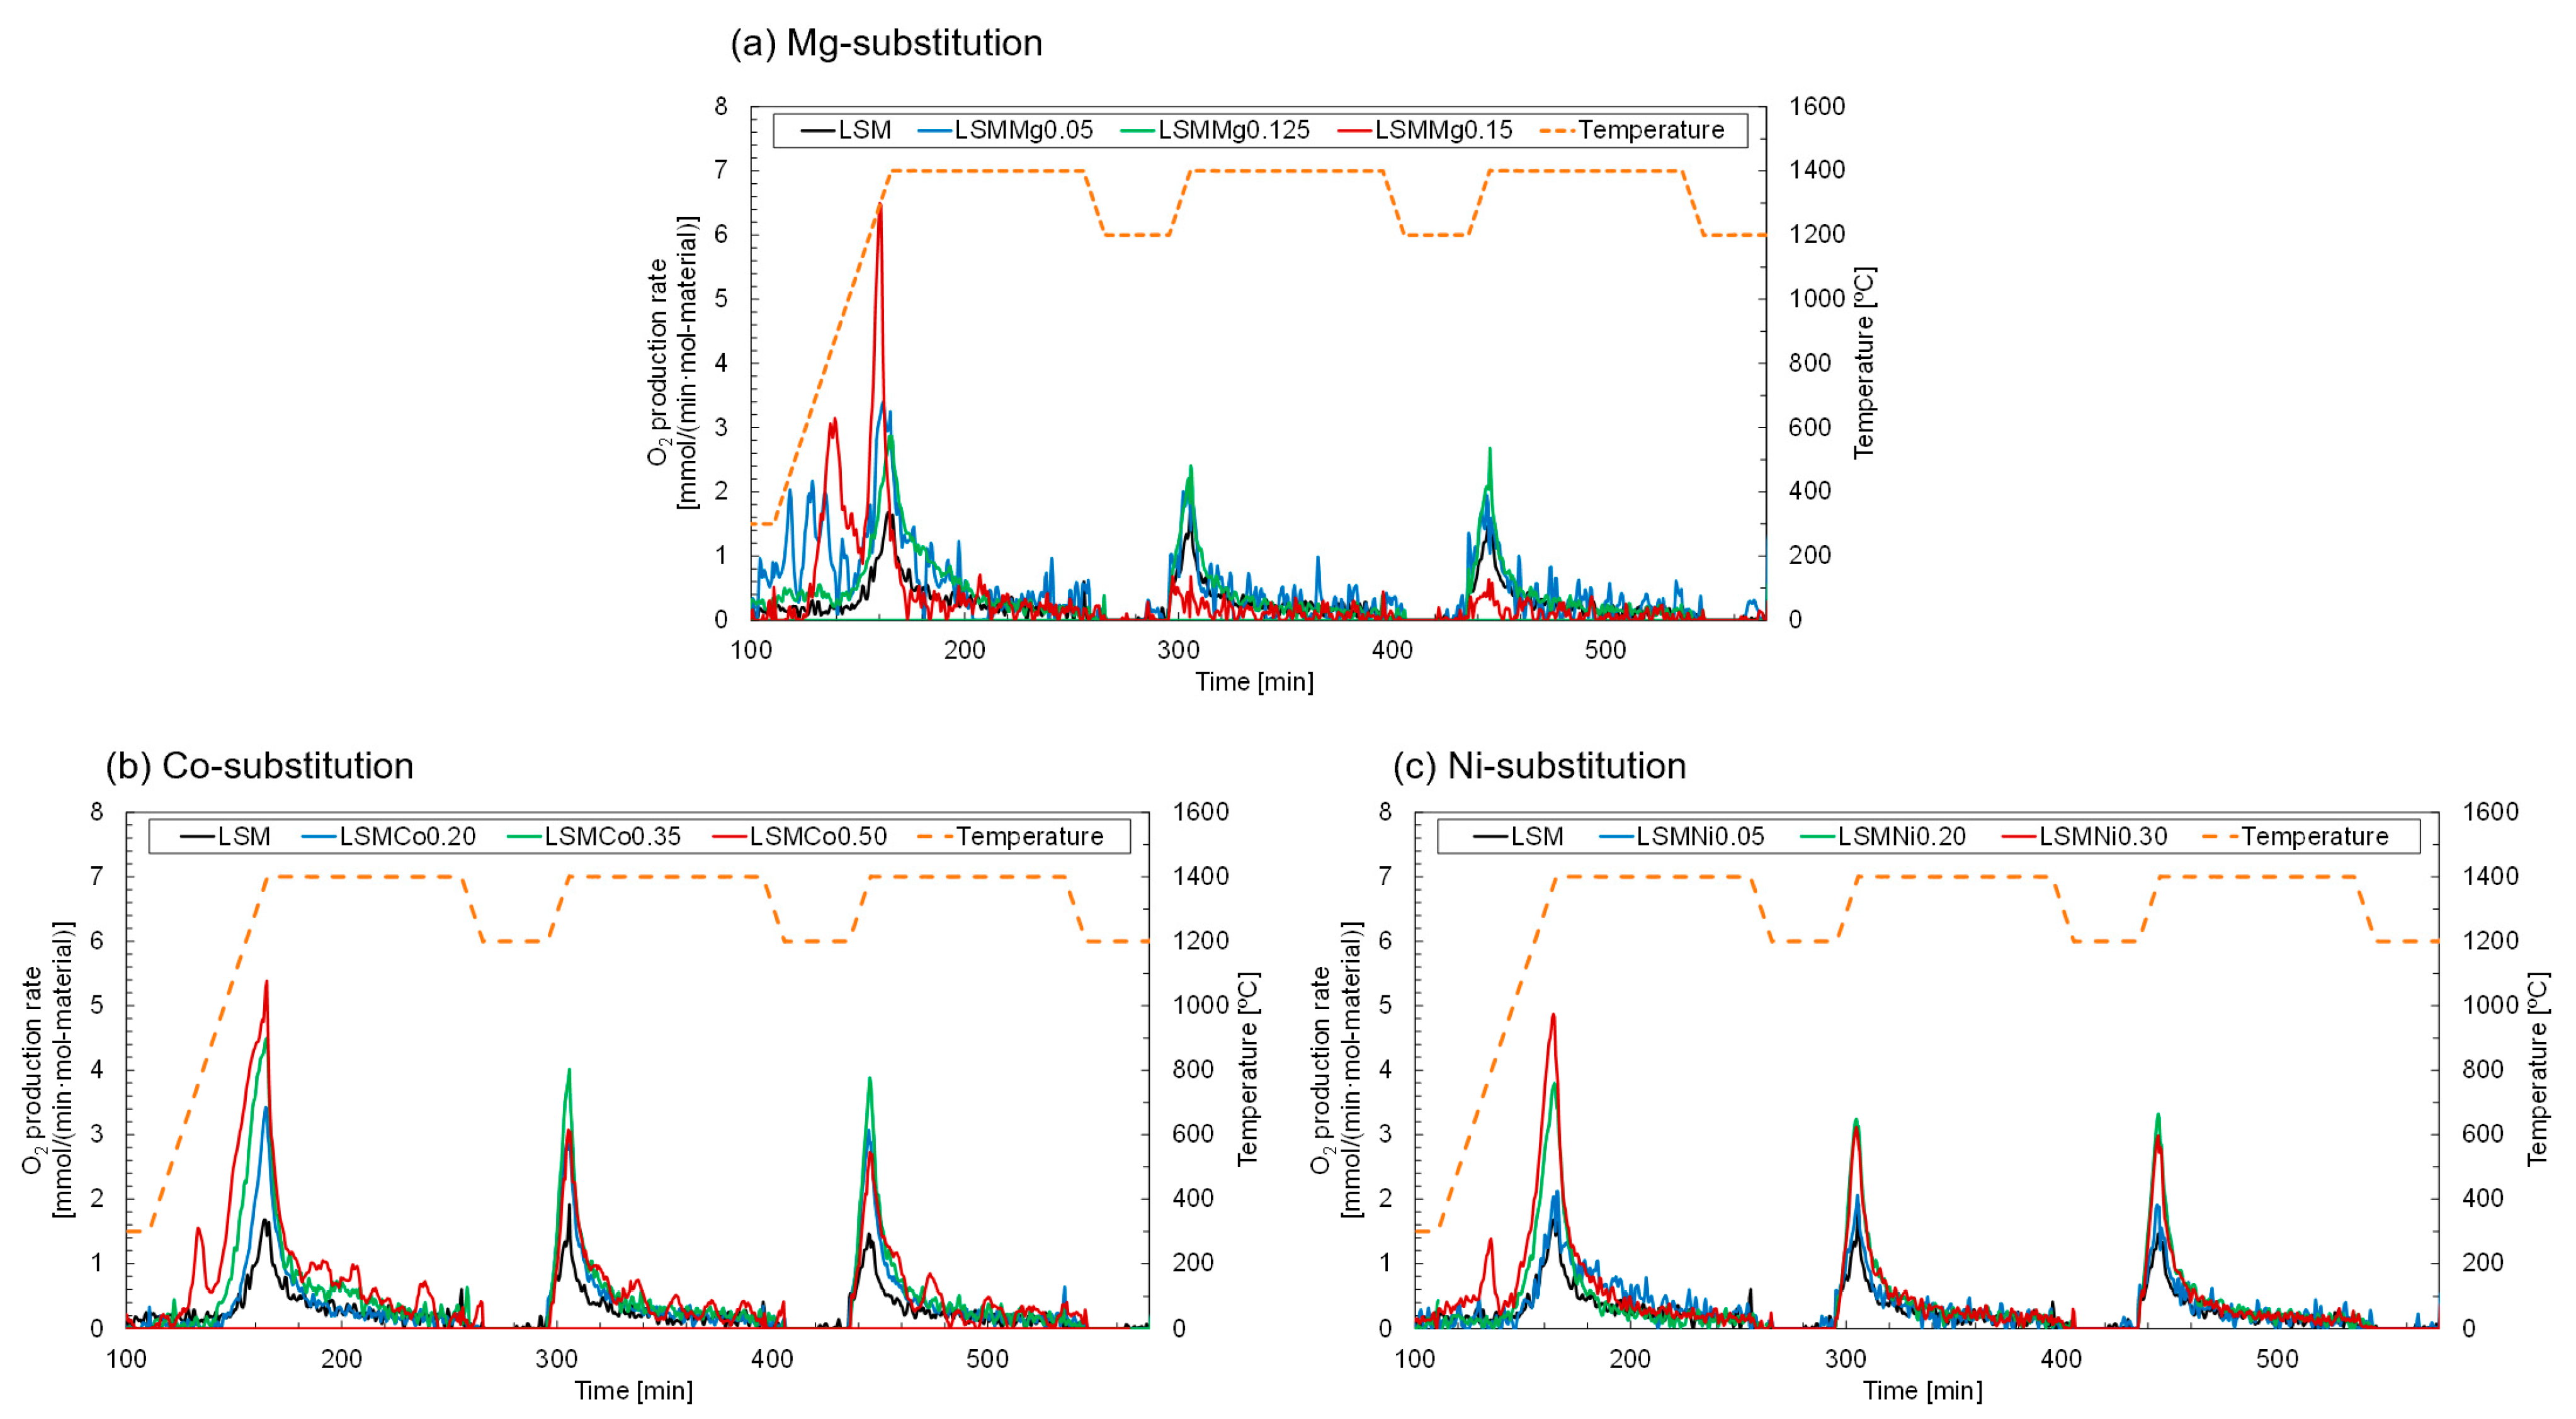
Figure 3 shows the O2 production profiles of the Ni, Co, and Mg-substituted LSMs during the TR step in the first to third runs. As a reference, the results obtained with the non-substituted LSM are shown in the figure. In all runs, the production rate of O2 reached a maximum value when the sample was heated at a temperature of 1400 °C. Figure 3a shows that LSMMg0.125 (green curve) afforded stable and repeatable O2 production without degradation during thermochemical cycling, unlike the other Mg-substituted samples. The O2 production of LSMMg0.150 (red curve) was poor and lower than that of the nonsubstituted LSM. Figure 3b shows the O2 production profiles of LSMCo0.20 (blue curve), LSMCo0.35 (green curve), and LSMCo0.50 (red curve). LSMCo0.35 exhibited the most stable and highest O2 production among the Co-substituted LSMs, whereas, with LSMCo0.50, the peak rate of O2 production declined with an increase in the number of runs of thermochemical cycling. The O2 production profiles of the Ni-substituted LSM are shown in Figure 3c. LSMNi 0.20 (green curve) demonstrated a stable and reproducible O2 production profile throughout the second and third runs and exhibited the highest peak rates of O2 production.
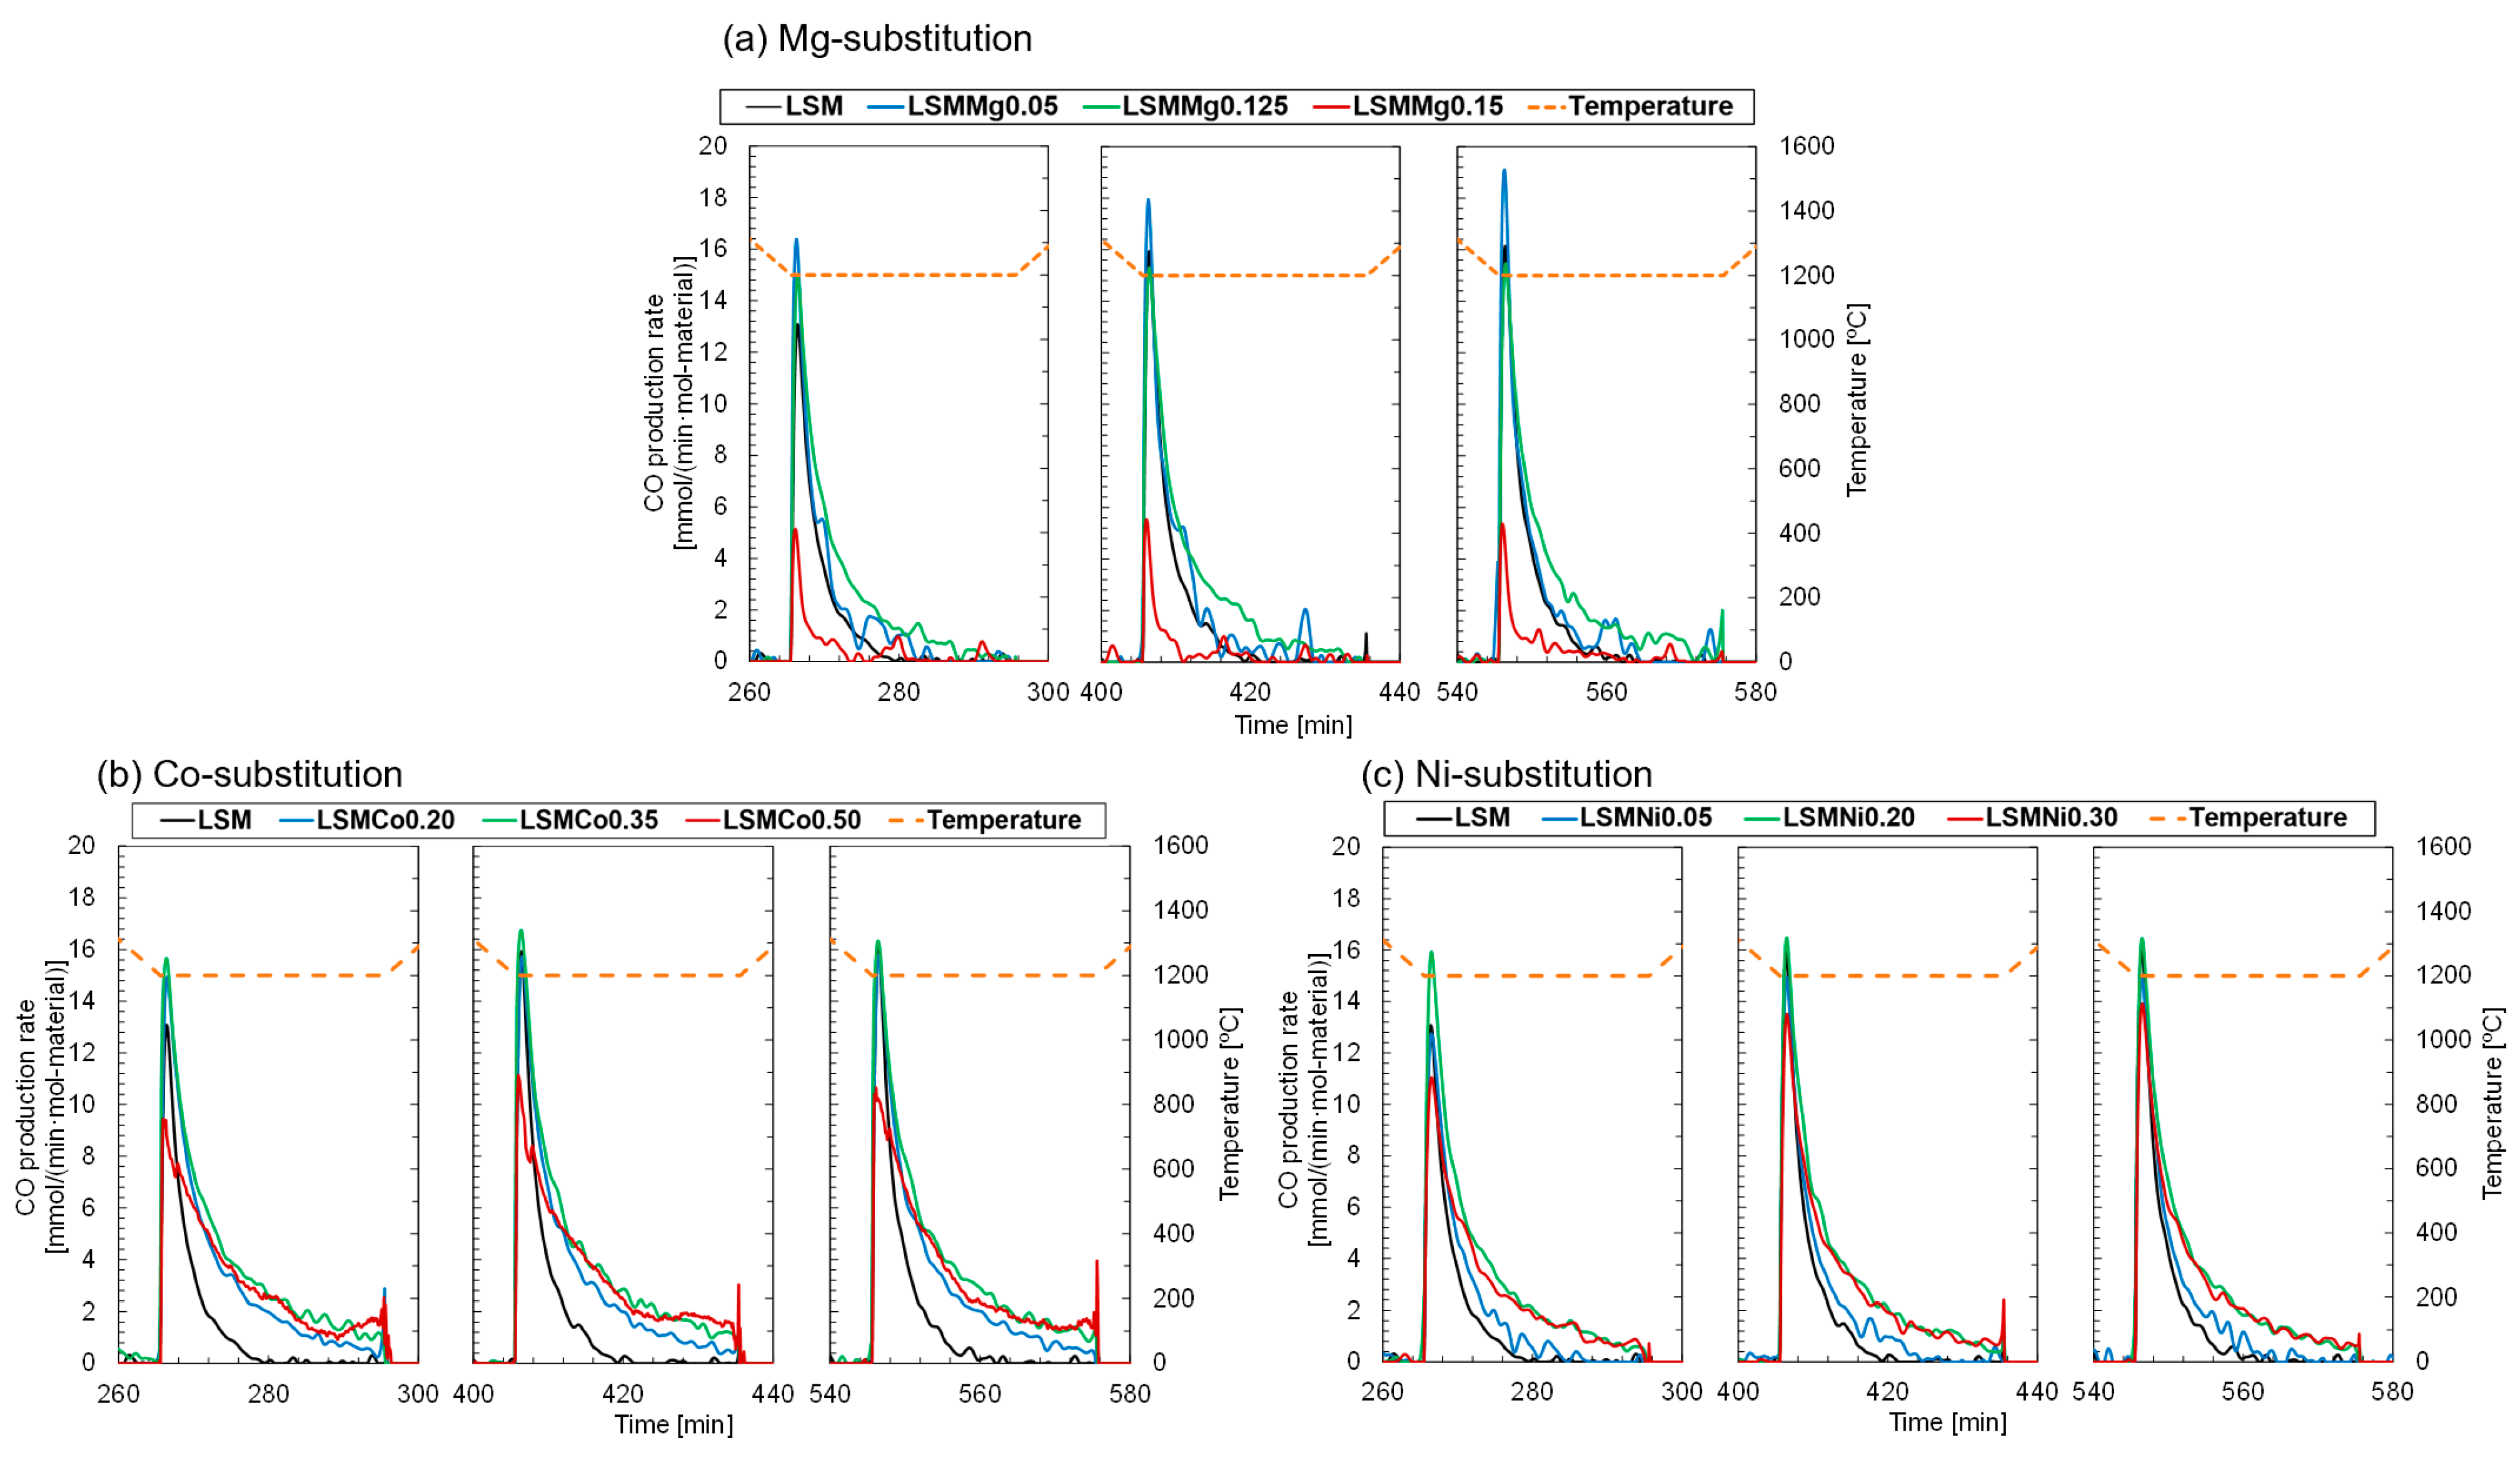
Figure 4a shows the CO production profiles of the Mg-substituted LSMs series during the subsequent CS steps in the first to third runs. For all the Mg-substituted samples, CO production was immediately initiated at the target temperature under a gas mixture of N2 and CO2 flow. The peak rate of CO production for LSMMg0.05 was higher in all runs compared to that of the nonsubstituted LSM but decreased for LSMMg0.15. The results for the Co-substituted LSMs series are shown in Figure 4b. The peak rate of CO production for LSMCo0.35 reached the maximum value but decreased for the samples with 40–50% substitution. One main reason for the improvement in the CO productivity with Co-substitution (Figure 2b) is that the duration of CO production is extended for all substitution levels compared to the case with nonsubstitution. For the Ni-substituted LSMs series (Figure 4c), the peak CO production rate was higher with 5–20% substitution but decreased with 25–35% substitution. Prolonged duration of CO production was observed for all the Ni-substituted LSMs series. These results indicate that the Co- and Ni-substituted LSMs demonstrate higher O2 and CO productivities and superior gas releasing profiles compared to the nonsubstituted LSM. Notably, from the viewpoint of the release behavior and productivity of O2 and CO in the thermochemical cycle, the LSMCo0.35 and LSMNi0.20 samples are promising materials among the substituted LSMs series investigated in this study.
The superior CO release behavior of Co- and Ni-substituted LSMs enables an increase in solar-to-fuel efficiency under the same reaction conditions due to the enhancement of cycle-averaged and time-averaged CO productivity. As another approach for improvement in solar-to-fuel efficiency, a reticulated porous ceramic structure [23] or nanostructuring methods [24] with higher specific surface area were investigated in the literature.

3.2. Repeatability and Thermal Durability of LSMCo0.35 and LSMNi0.20 in Continuous Multiple Cycling of Thermochemical Two-Step CO2 Splitting

In this section, the repeatability and thermal durability of the promising LSMCo0.35 and LSMNi0.20 samples are examined and evaluated. 
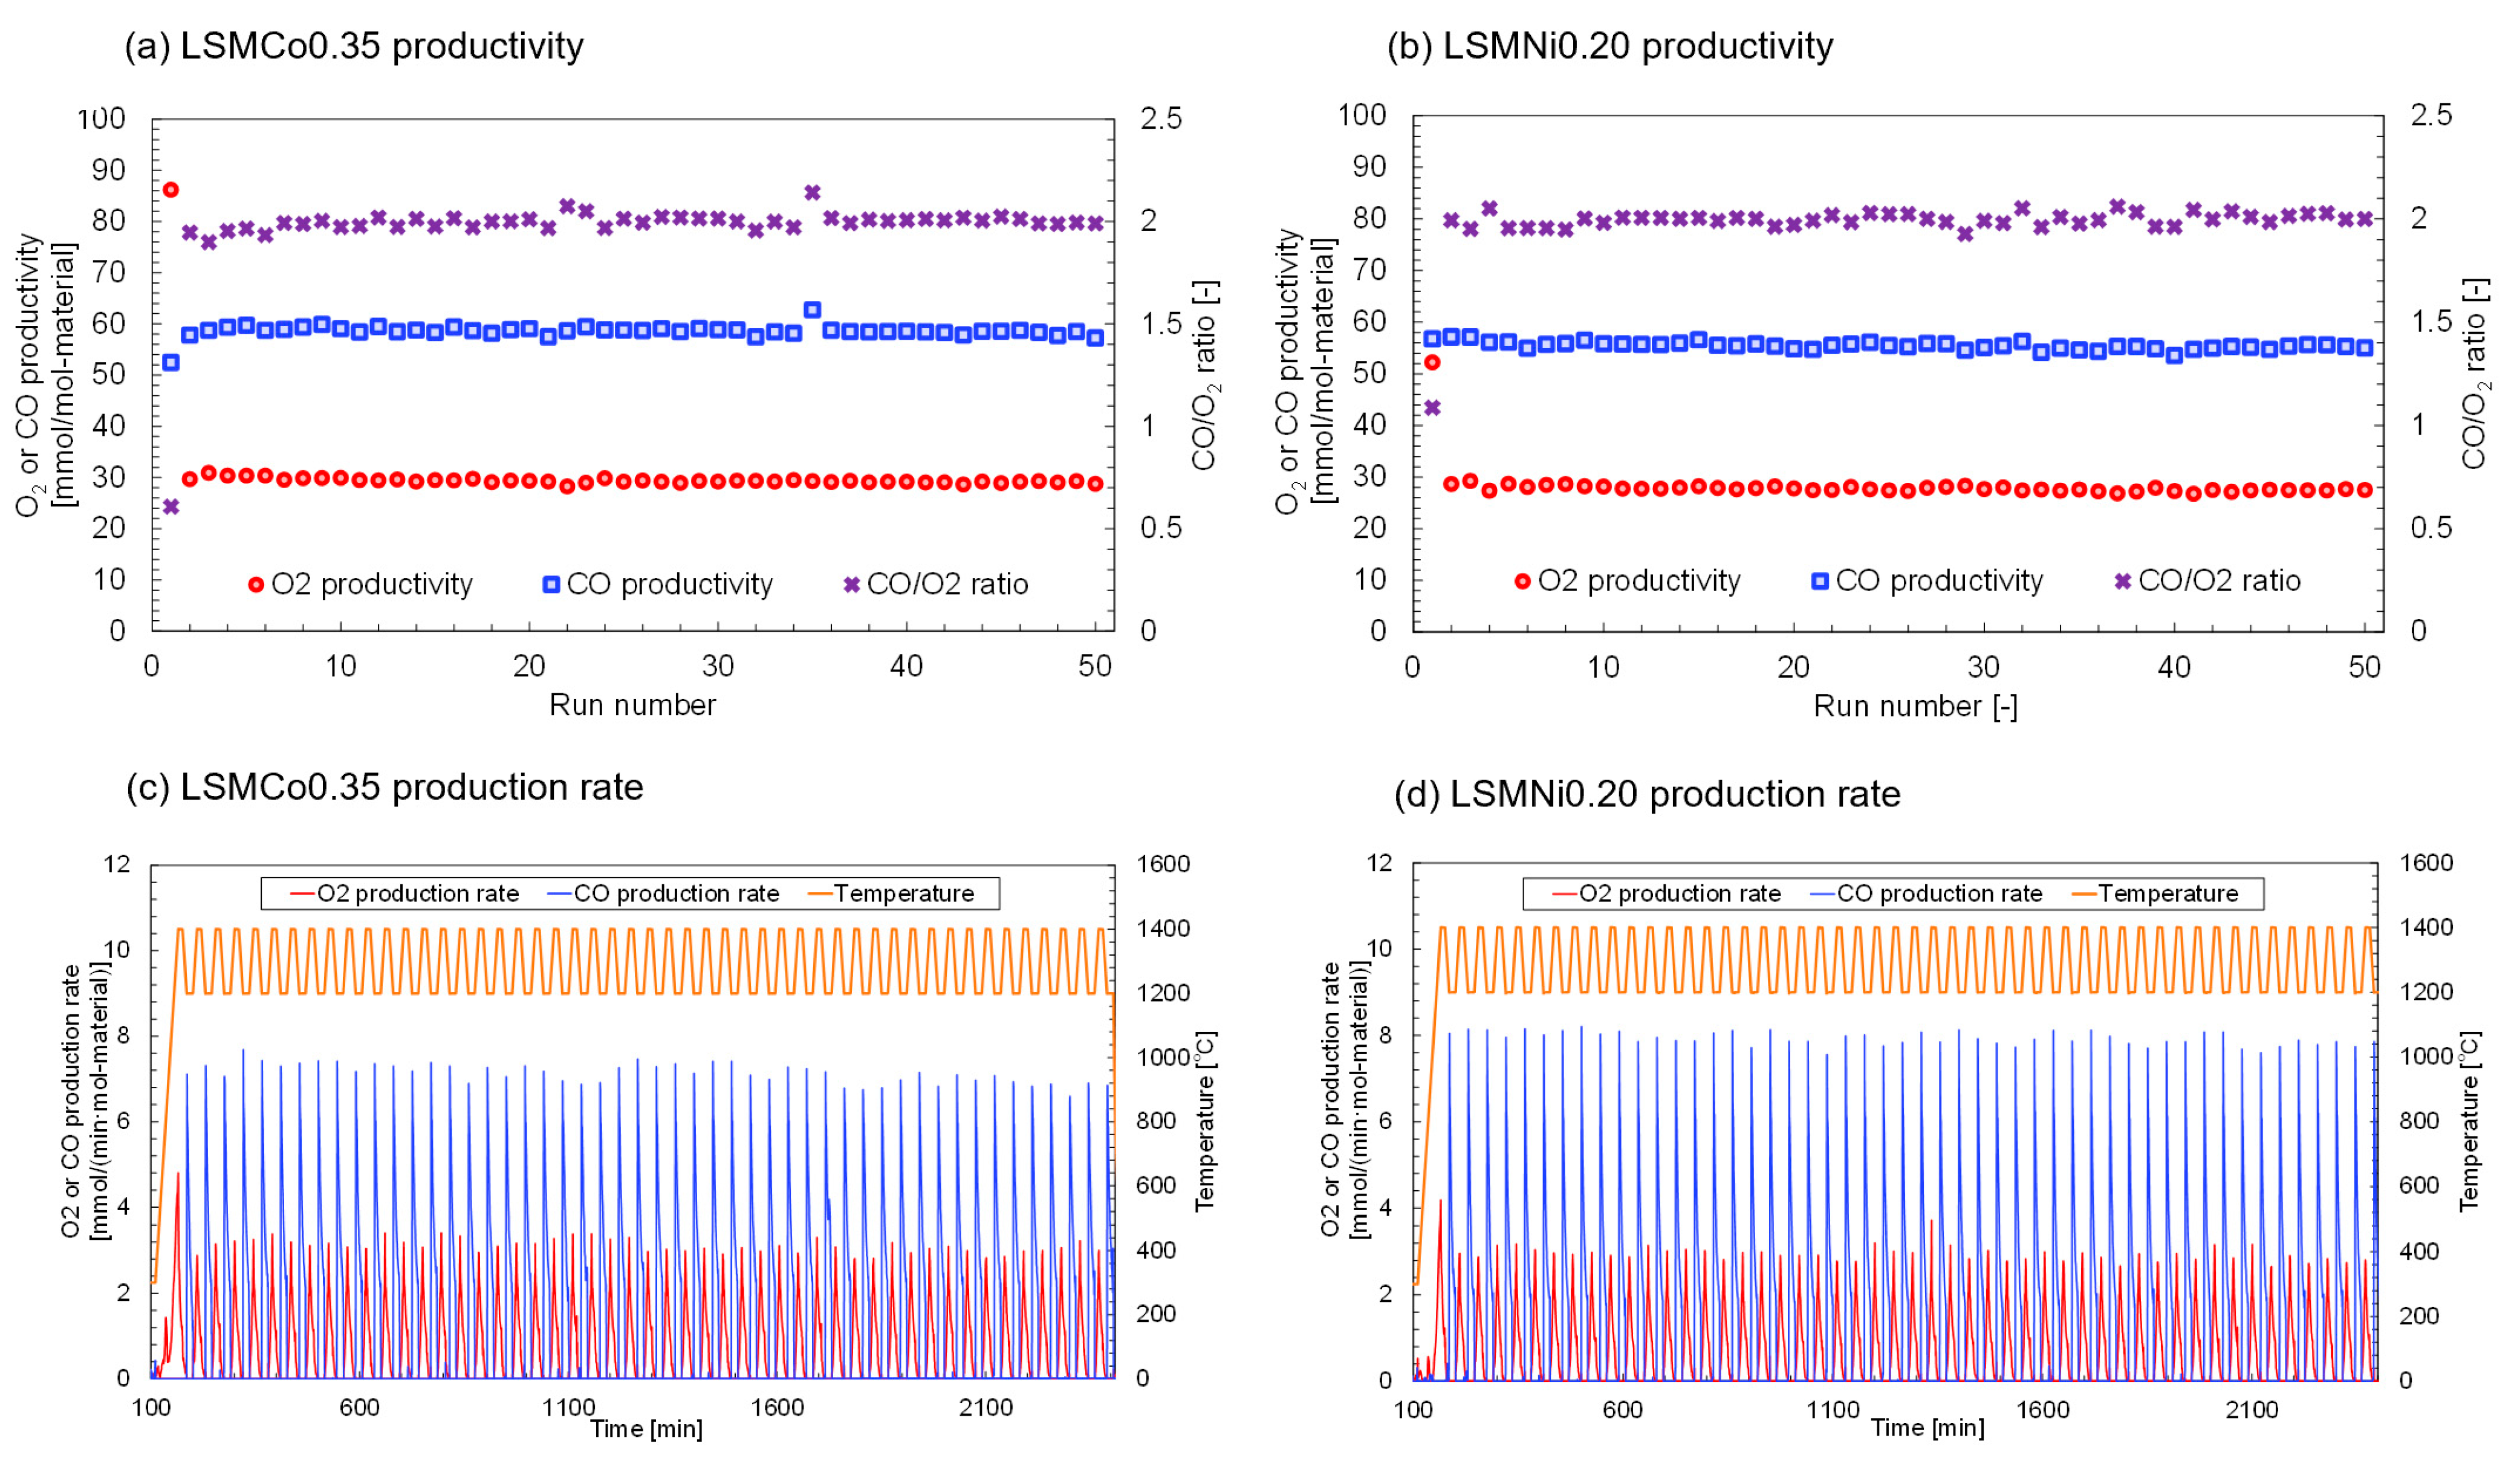
Figure 5 shows the O2 and CO productivities in the long-term continuous test for the thermochemical two-step CO2 splitting cycling using LSMCo0.35 and LSMNi0.20. To monitor and evaluate the stoichiometric reactivity of the samples in each run, the CO/O2 ratio was calculated and plotted in the figure. The results of the first run may include nonreproducible effects of the sample and reactor preparations (adsorption of moisture and gaseous species on the surface of the sample and crucible in the thermogravimetric reactor, and volatile/combustible contaminations). Thus, the results of the second–fiftieth runs were evaluated to estimate thermal durability and stability. As shown in Figure 5a, the decline fraction of CO productivity during the continuous thermochemical cycling was 1.0%. Thus, O2 and CO production were maintained at the same level without degradation, significant effusion, or vaporization of the sample over 50 continuous runs. These results indicate that LSMCo0.35 is thermally durable during long-term thermochemical cycling at high temperatures and undergoes reproducible redox reactions. In the case of LSMNi0.20 (Figure 5b), the decline fraction of CO productivity was estimated to be 3.7%. The LSMNi0.20 and LSMCo0.35 samples showed stable and reproducible O2 and CO productivity over multiple continuous cycles while maintaining stoichiometric reactivity. The production rates of O2 and CO were determined for the LSMCo0.35 (Figure 5c) and LSMNi0.20 (Figure 5d) samples. Both the samples exhibited stable and reproducible O
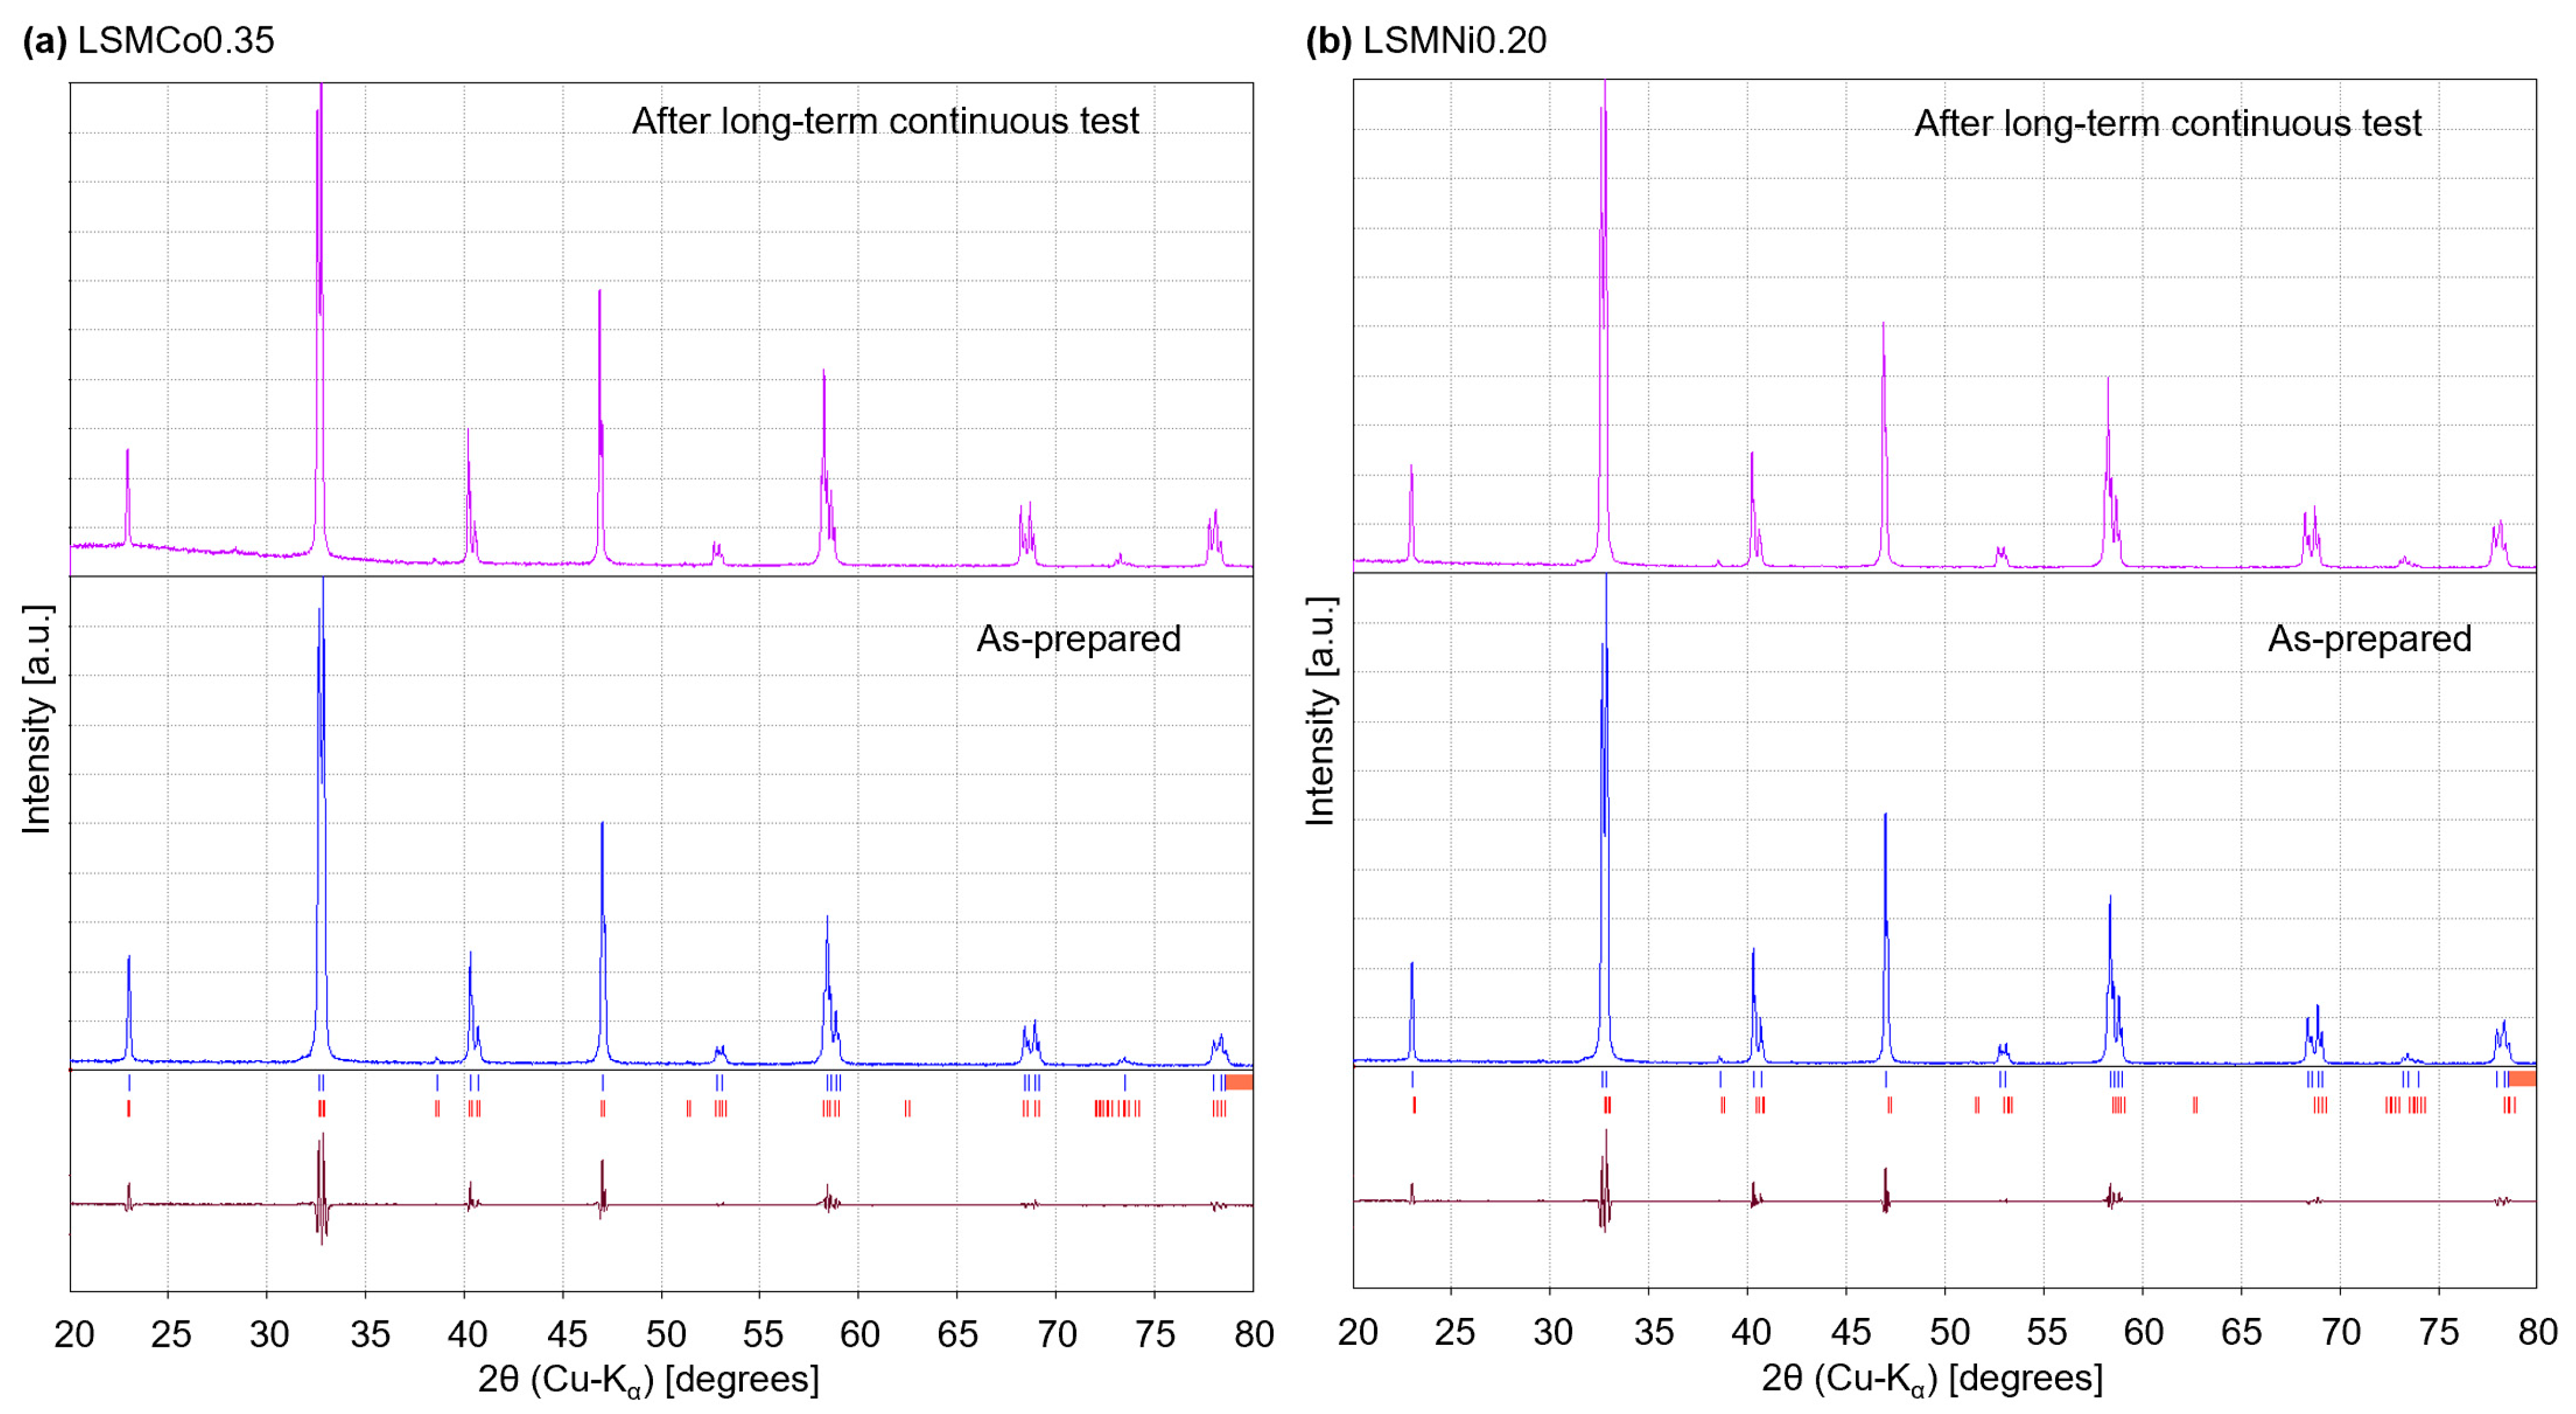
2 and CO release profiles during continuous thermochemical cycling. The crystallographic phases of LSMCo0.35 and LSMNi0.20 samples were observed and compared to analyze the crystal structure and morphology. Figure 6 shows the XRD patterns of the samples obtained before and after continuous testing. The peak positions of the sample after the test were the same as those of the as-prepared sample and corresponded to the same crystalline phases (red vertical bars below the XRD pattern). No secondary phases or phase separation were observed in either pattern, indicating that the LSMCo0.35 and LSMNi0.20 samples underwent repeatable and thermally durable thermochemical cycling without crystal structure degradation. 
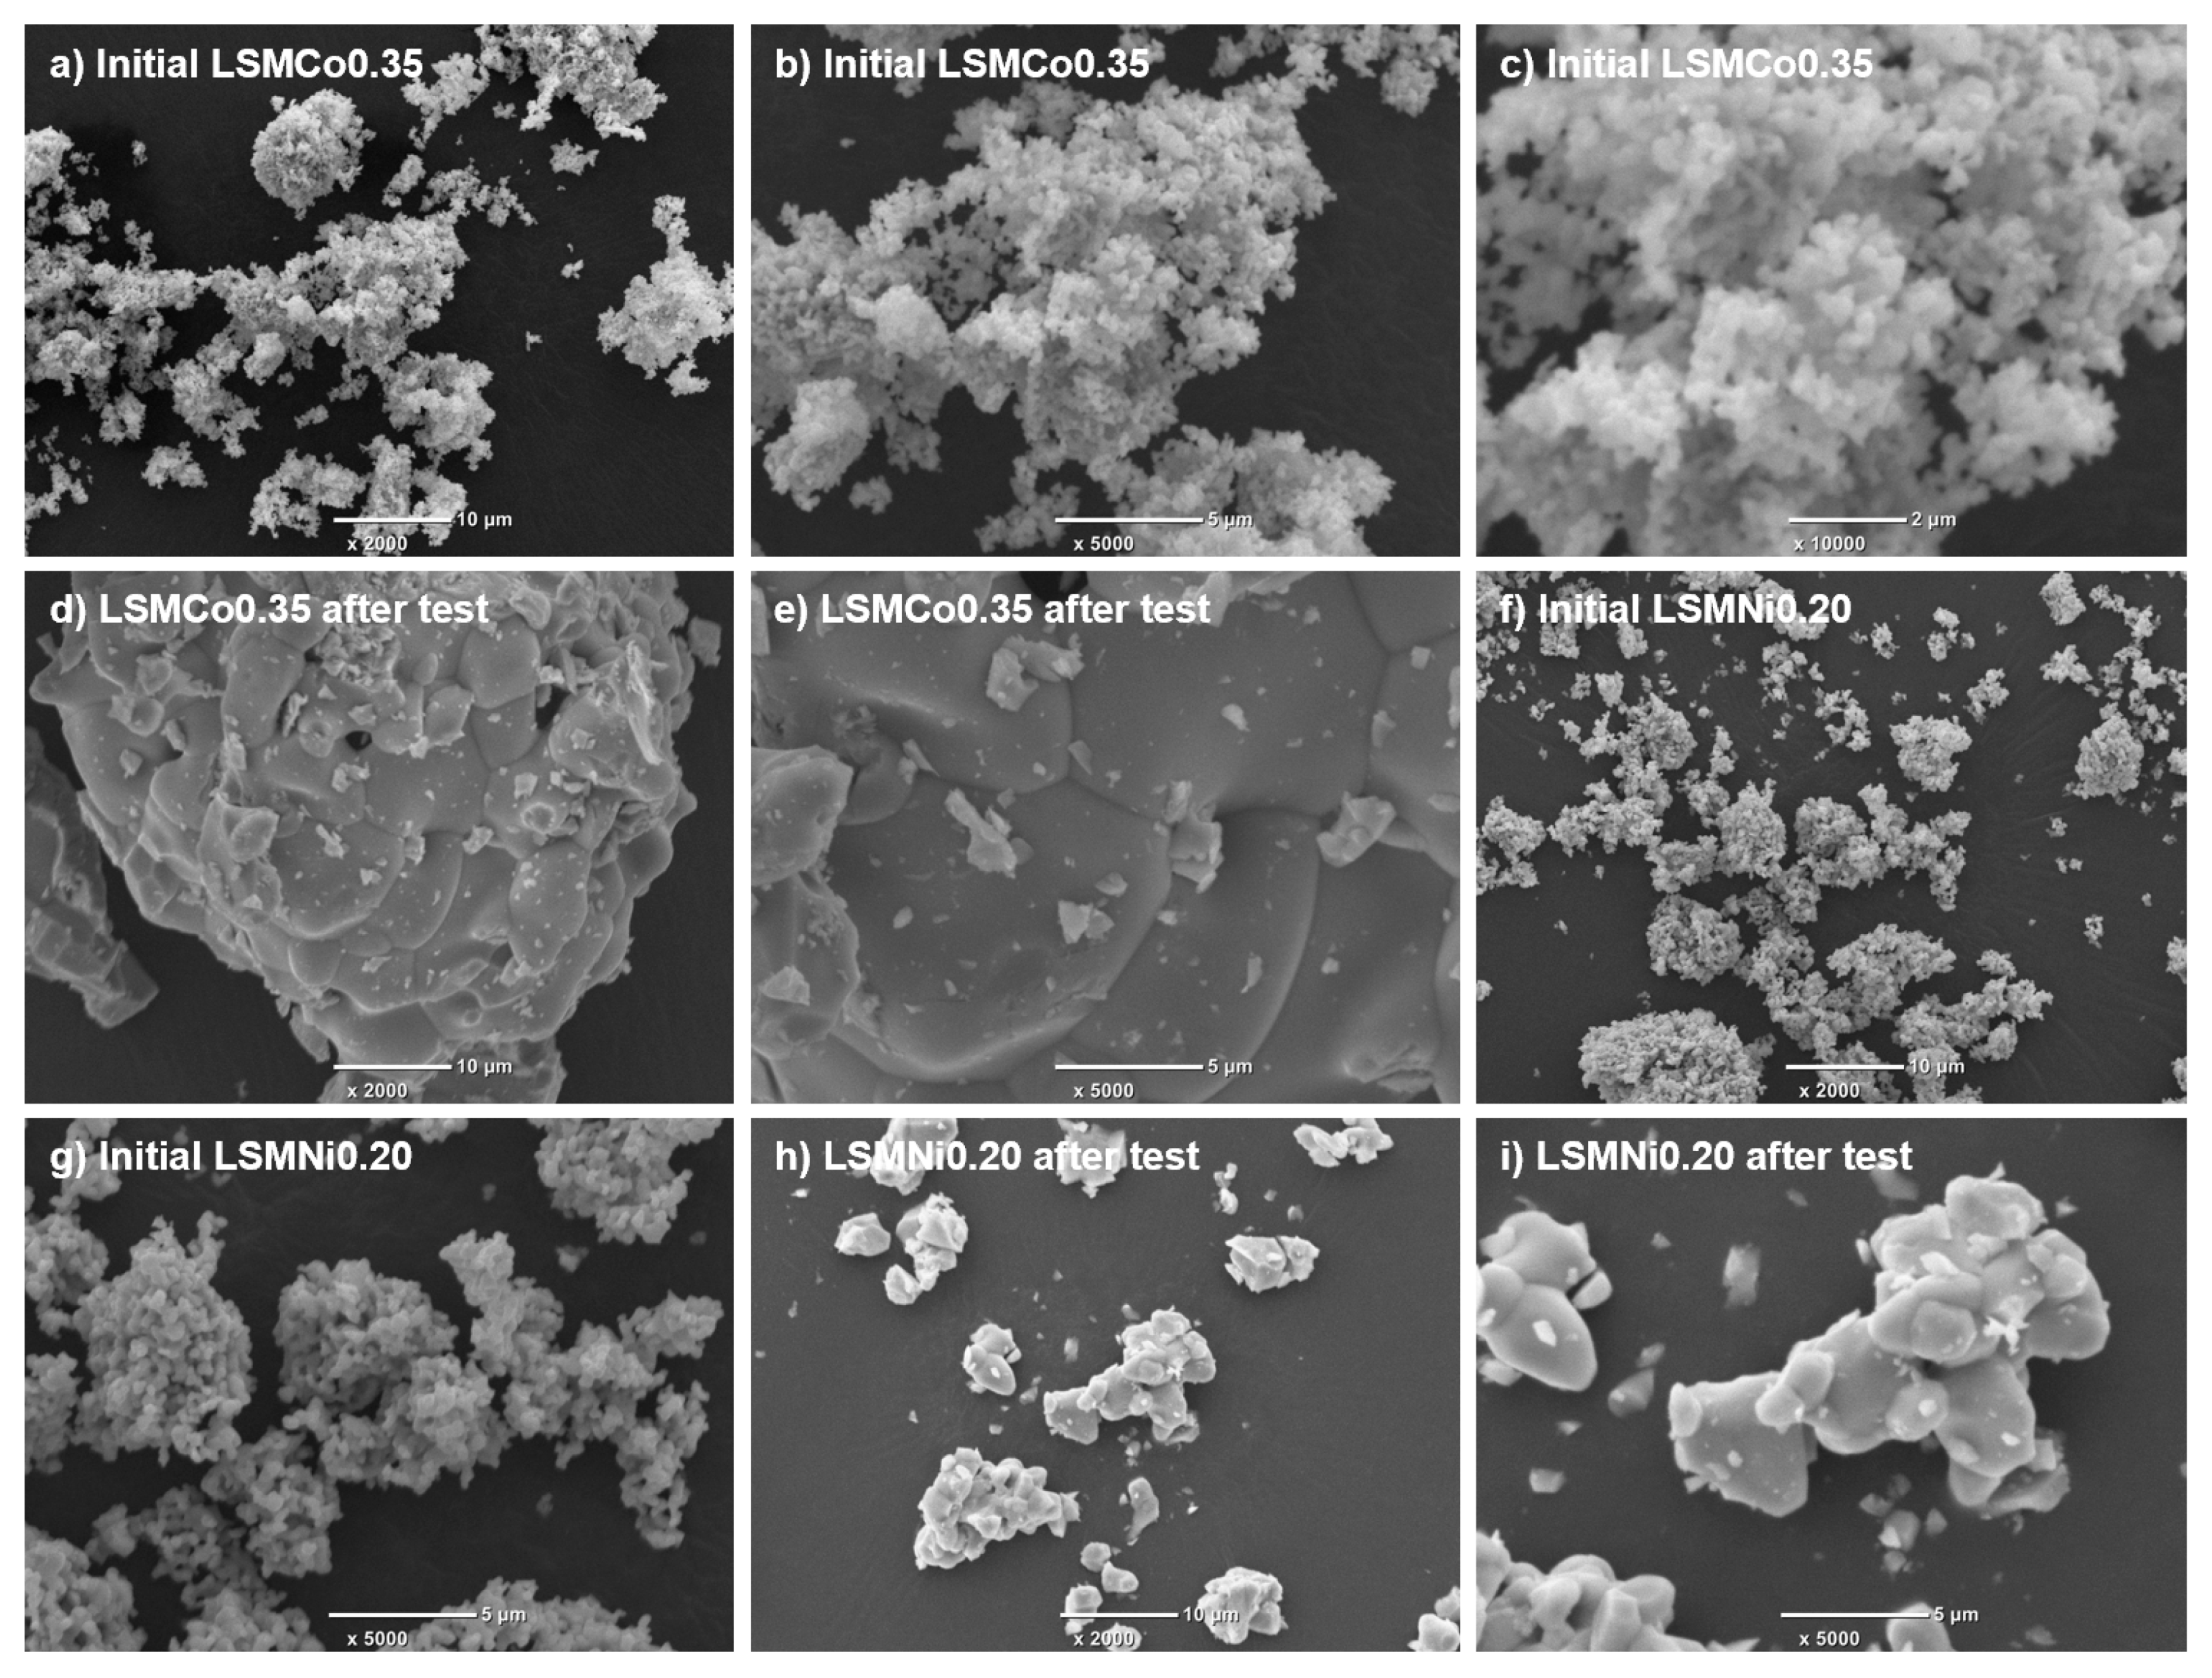
Figure 7 shows secondary electron image (SEI) micrographs of LSMCo0.35 (Figure 7a–e) and LSMNi0.20 (Figure 7f–i). For the as-prepared LSMCo0.35 sample (Figure 7a–c), the particle size was 0.1–0.2 µm, and agglomerations of the non-porous fine particles appeared. After the long-term test (Figure 7d,e), a coagulated mass composed of coarse particles with sizes of 2–10 µm was observed. Thus, the as-prepared samples were severely sintered at high temperatures during the continuous testing. For the as-prepared LSMNi0.20 sample (Figure 7f,g), the particle size was 0.2–0.5 µm, and agglomerations of particles were apparent. After the long-term test (Figure 7h,i), the observed coagulated mass was smaller than that of LSMCo0.35. These results indicate that Ni substitution may reduce the agglomeration of the LSM particles subjected to high temperatures during continuous testing. Both LSMCo0.35 and LSMNi0.20 were sintered at high temperatures during the continuous testing. However, the decline fractions remained at low values, and a multivalence state of Co and Ni existed in the crystal lattice of LSMCo0.35 and LSMNi0.20. Thus, it may be caused by the enhancement of oxygen transfer in the crystal lattice by Co and Ni substitution.

3.3. Impact of La/Sr Substitution Fraction in a Site on the Redox Activity of Substituted LSM

In this section, we evaluate the impact of the La/Sr substitution fraction (x) in the A site of the substituted LSM on the O2 and CO productivities during thermochemical cycling. LSMNi0.20, in which the chemical composition of the B site was fixed, was selected as the representative LSM sample. The A-site-substituted samples (La1−xSrxMn0.8Ni0.2O3) were subjected to the TR step at 1400 °C for 90 min. Subsequently, the CS step was performed at 1000 °C for 30 min. 
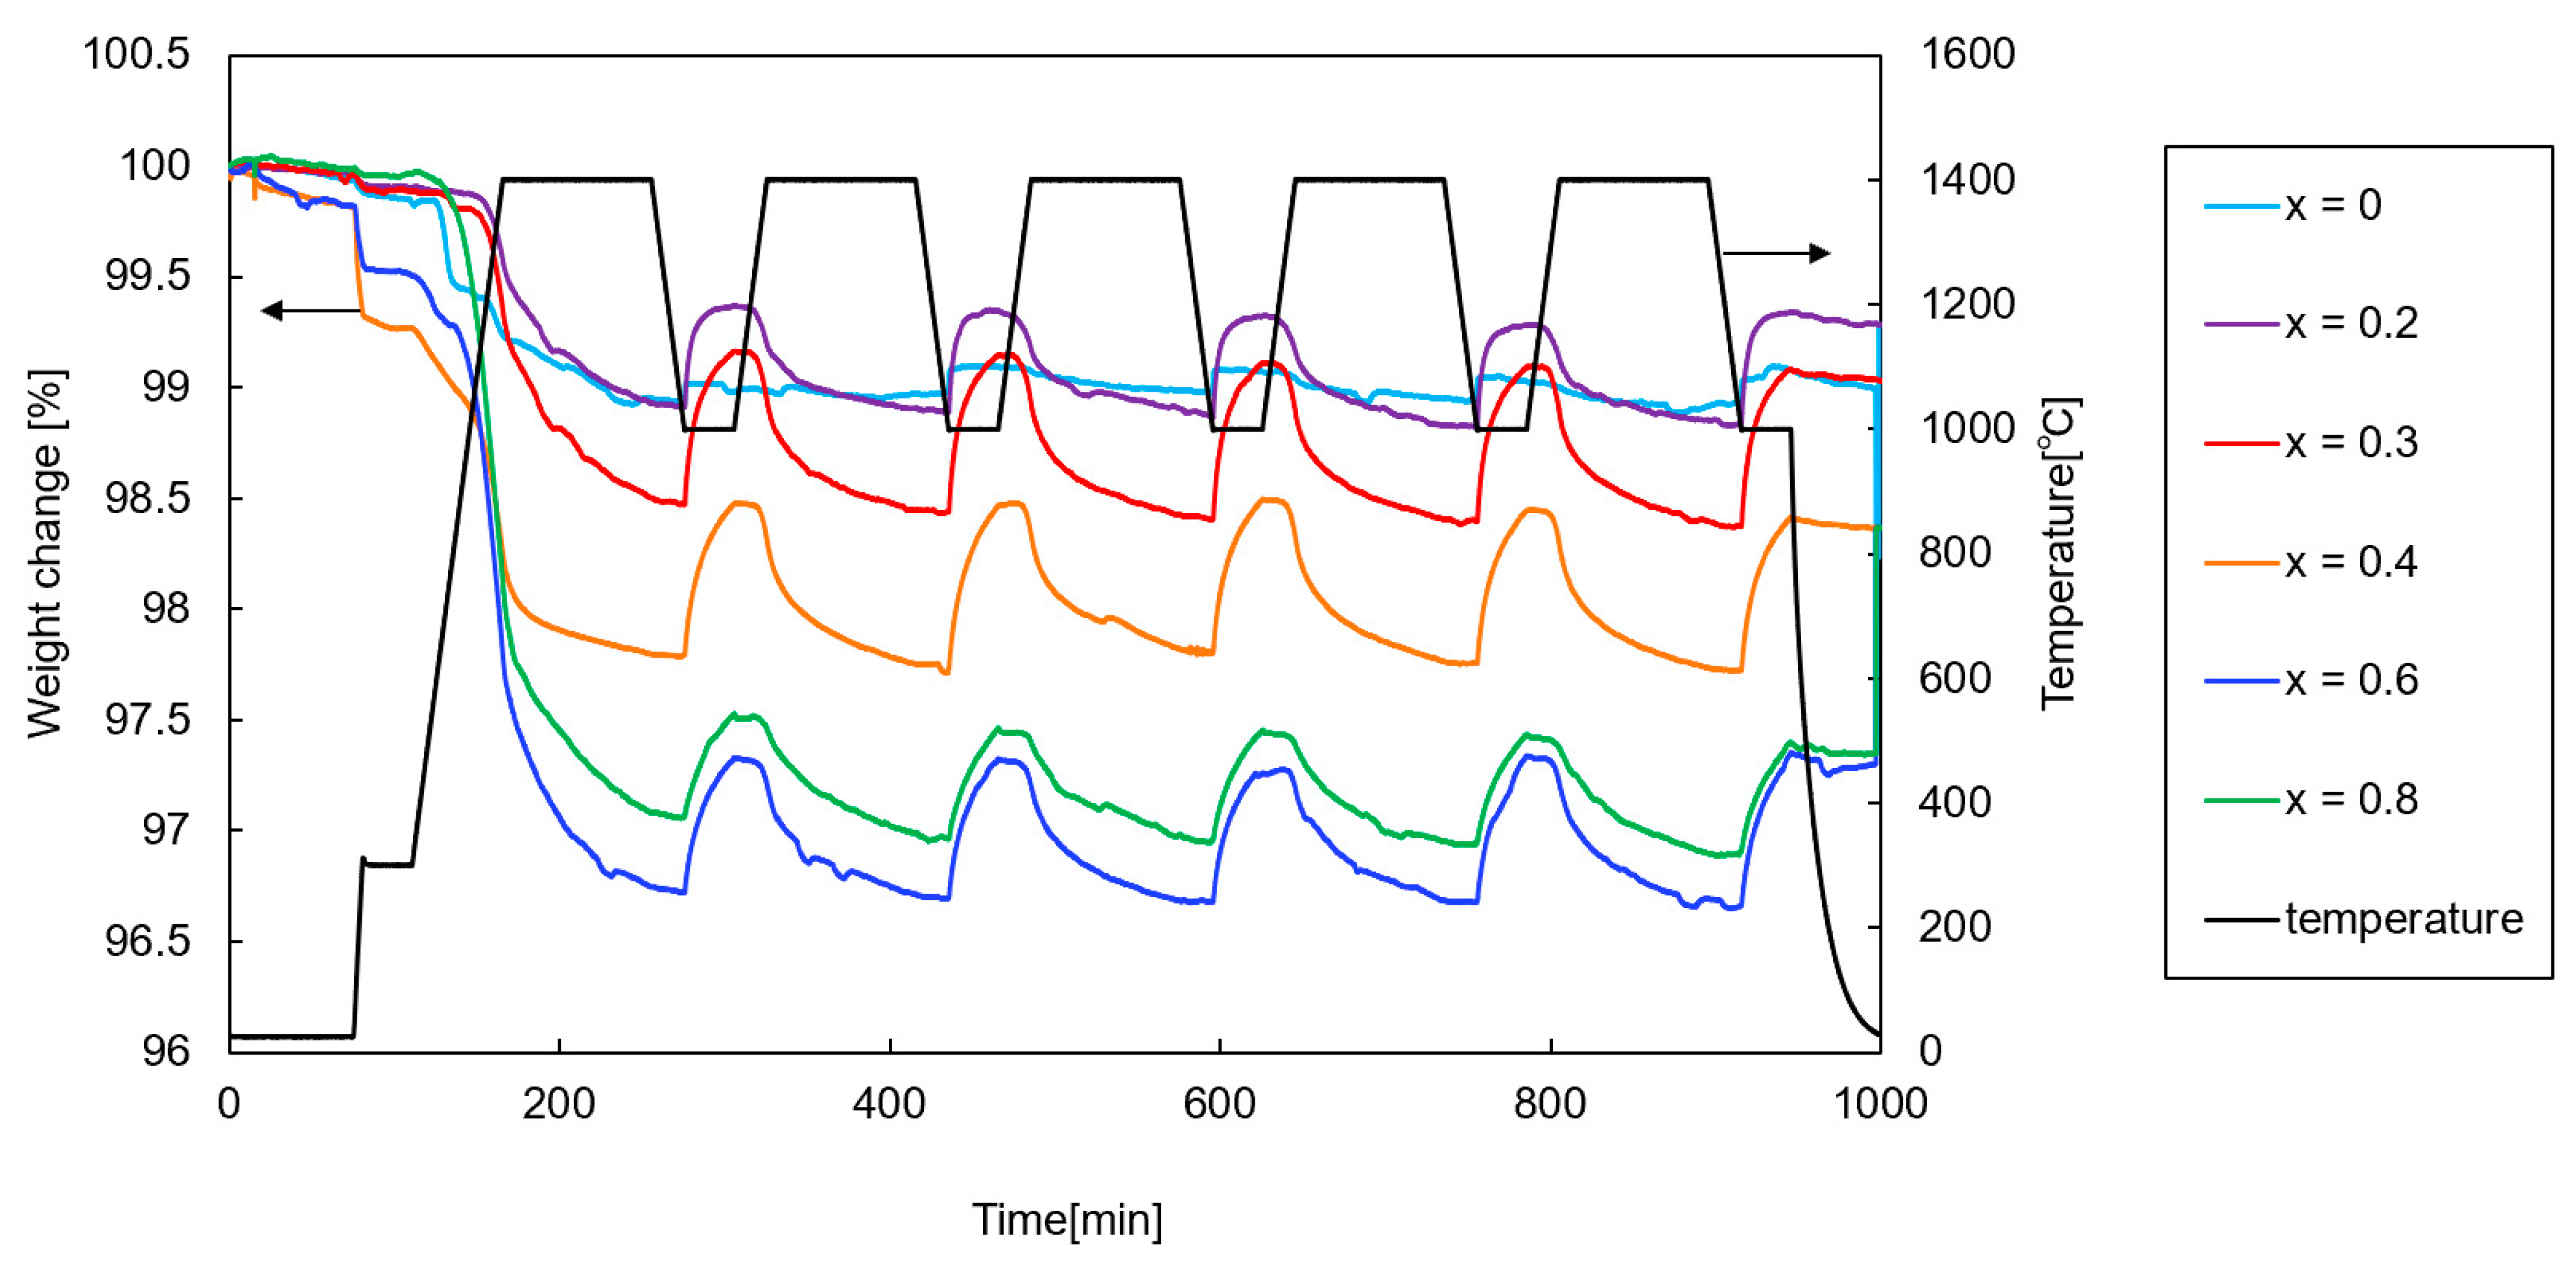
Figure 8 shows the weight change profiles of the samples (x = 0–0.8) during the thermochemical cycling (first–fifth runs). Except for the first run, repeatable and reproducible profiles were observed for all the samples. 
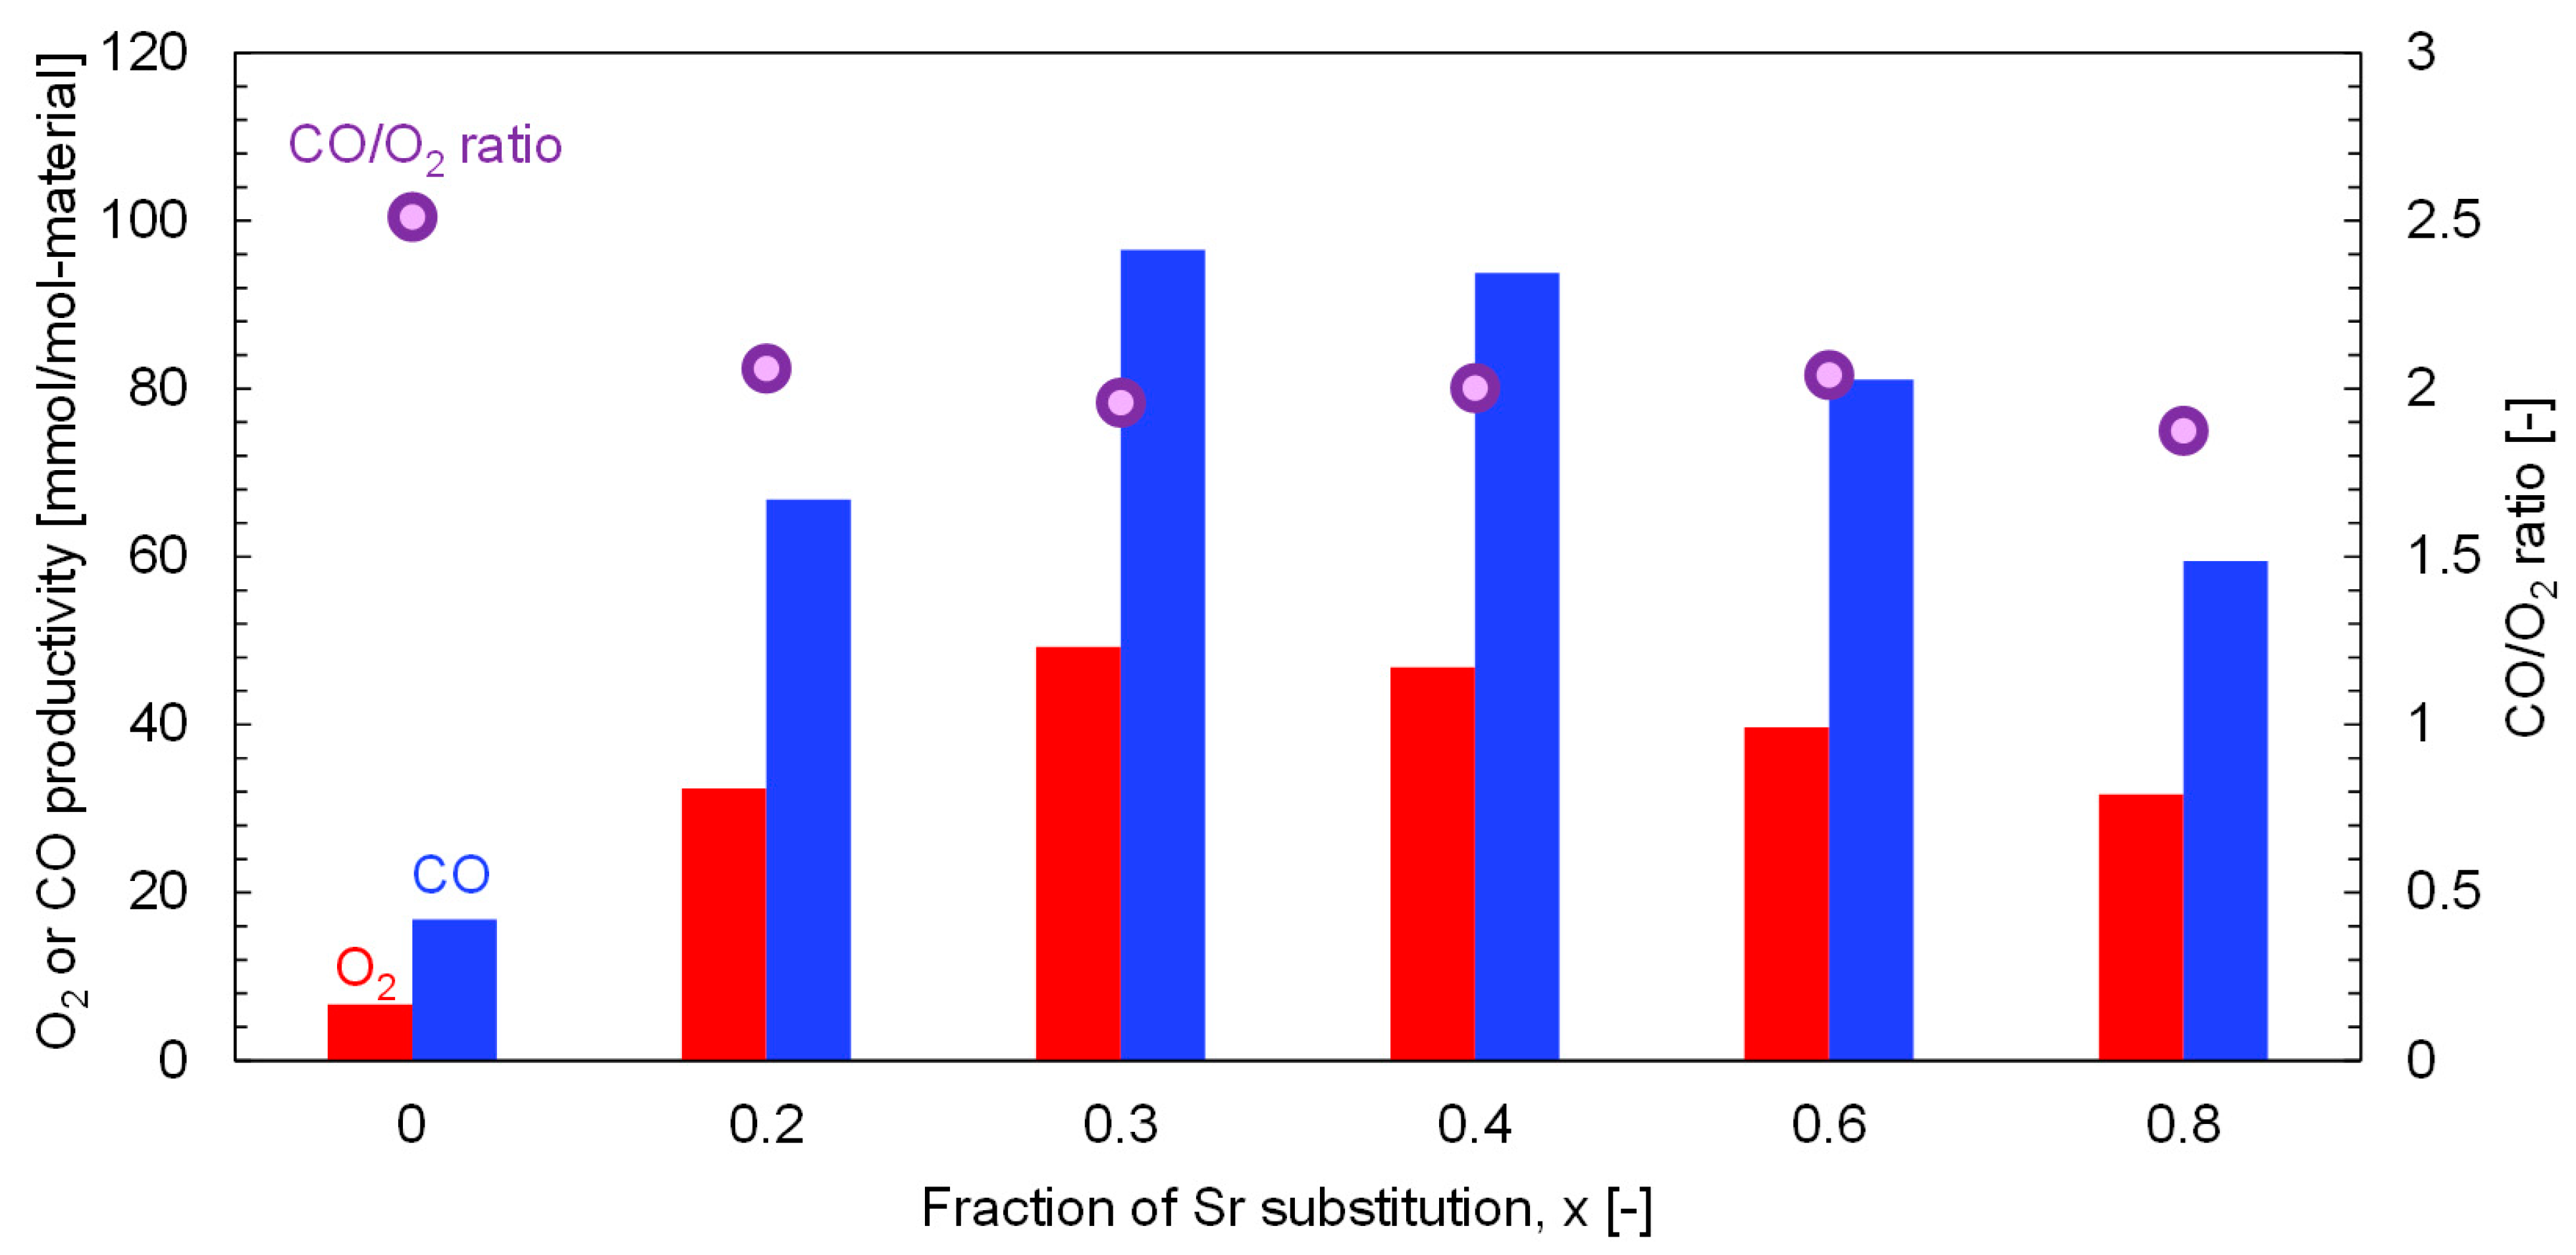
Figure 9 shows the O2 and CO productivities and the CO/O2 ratios for various x values. The O2 and CO productivities reached their highest values of 49.3 and 96.5 mmol/mol-material at x = 0.3. In addition, the O2/CO ratio of 1.95 at x = 0.3 means that the two-step thermochemical CO2 splitting proceeds stoichiometrically, retaining the greatest productivity among all x fractions. To optimize the chemical composition of the A site and maximize the redox reactivity, La0.7Sr0.3Mn0.8Ni0.2O3 is a feasible chemical composition for the thermochemical two-step CO2 splitting cycle.
The impact of the La/Sr fraction on the O2 and CO productivities of the Ni-substituted LSM indicates the following two possibilities: (1) an initial increase in the substitution fraction (x = 0–0.4) leads to an increase in the number of lattice defects (vacancies) in the crystal structure. The results indicated that the O2 productivity was enhanced owing to the improved oxygen mobility in the crystal structure at high temperatures in both steps. However, (2) not all vacancies induced by Sr substitution are available for the redox reaction in the thermochemical cycle (x = 0.4–0.8). The XRD patterns of the as-prepared samples (La1−xSrxMn0.8Ni0.2O3) are shown in Figures S1–S6 in the Supplementary Information. The space group and crystal structure of the identified phases are presented in Table 3. The experimental findings revealed that the crystal structure (cubic system) of the primary phase in samples with a high degree of substitution (x = 0.6 and 0.8) was different from that of a trigonal system with less substitution (x = 0–0.4). This result indicates that the excess vacancies are accommodated in the trigonal system as x increases (x = 0–0.4). However, the phase transition stabilizes the crystal structure by accommodating excess vacancies when the value of x increases further (x = 0.6–0.8). Consequently, the acceptable number of vacancies in the cubic system may decrease compared to that in the trigonal system. The space groups and crystal structures of the samples obtained after the redox tests are listed in Table 4. Phase separation was observed at chemical compositions of x = 0.6 and 0.8. These results indicated that they were thermally or chemically unstable during thermochemical cycling. The threshold value of a stable crystal structure without phase transition and separation before and after thermochemical cycling was approximately x = 0.5.

3.4. XPS Analysis of Nonsubstituted-, Ni-, and Co-Substituted LSMs

The changes in the valence states of the constituent ionic species in the substituted LSMs were analyzed and evaluated to elucidate the functions of each ionic species in each step of the two-step thermochemical CO2 splitting. LSMNi0.20 and LSMCo0.35 were selected as the samples with the highest reactivity among the substituted LSMs series tested in the present study. Nonsubstituted LSM was analyzed and compared. Figure 10a shows the La 3d3/2 X-ray photoelectron spectra with peak deconvolutions for nonsubstituted LSM. Triplet peaks centered at 850.57, 853.03, and 854.99 eV are observed for the as-prepared sample. No evident changes in the peak positions and areas were observed for the samples obtained after the TR and subsequent CS steps in the two-step thermochemical cycle. The results indicate that the La valence in the nonsubstituted LSM did not vary at each step of the thermochemical cycle. Figure 10b shows the Mn 2p3/2 spectrum with peak deconvolution for nonsubstituted LSM. For the as-prepared sample, the Mn 2p3/2 spectrum was decomposed into triplet peaks (Mn2+ = 640.67 eV, Mn3+ = 641.80 eV, and Mn4+ 643.53 eV). The average Mn valences were estimated from the peak areas corresponding to the Mn2+/Mn3+/Mn4+ species. The estimated average valences of Mn in the nonsubstituted LSM are listed in Table 5. The variation in the average valence of Mn indicates that the Mn ions at the B site of the nonsubstituted LSM are responsible for the redox reaction in the thermochemical cycle.
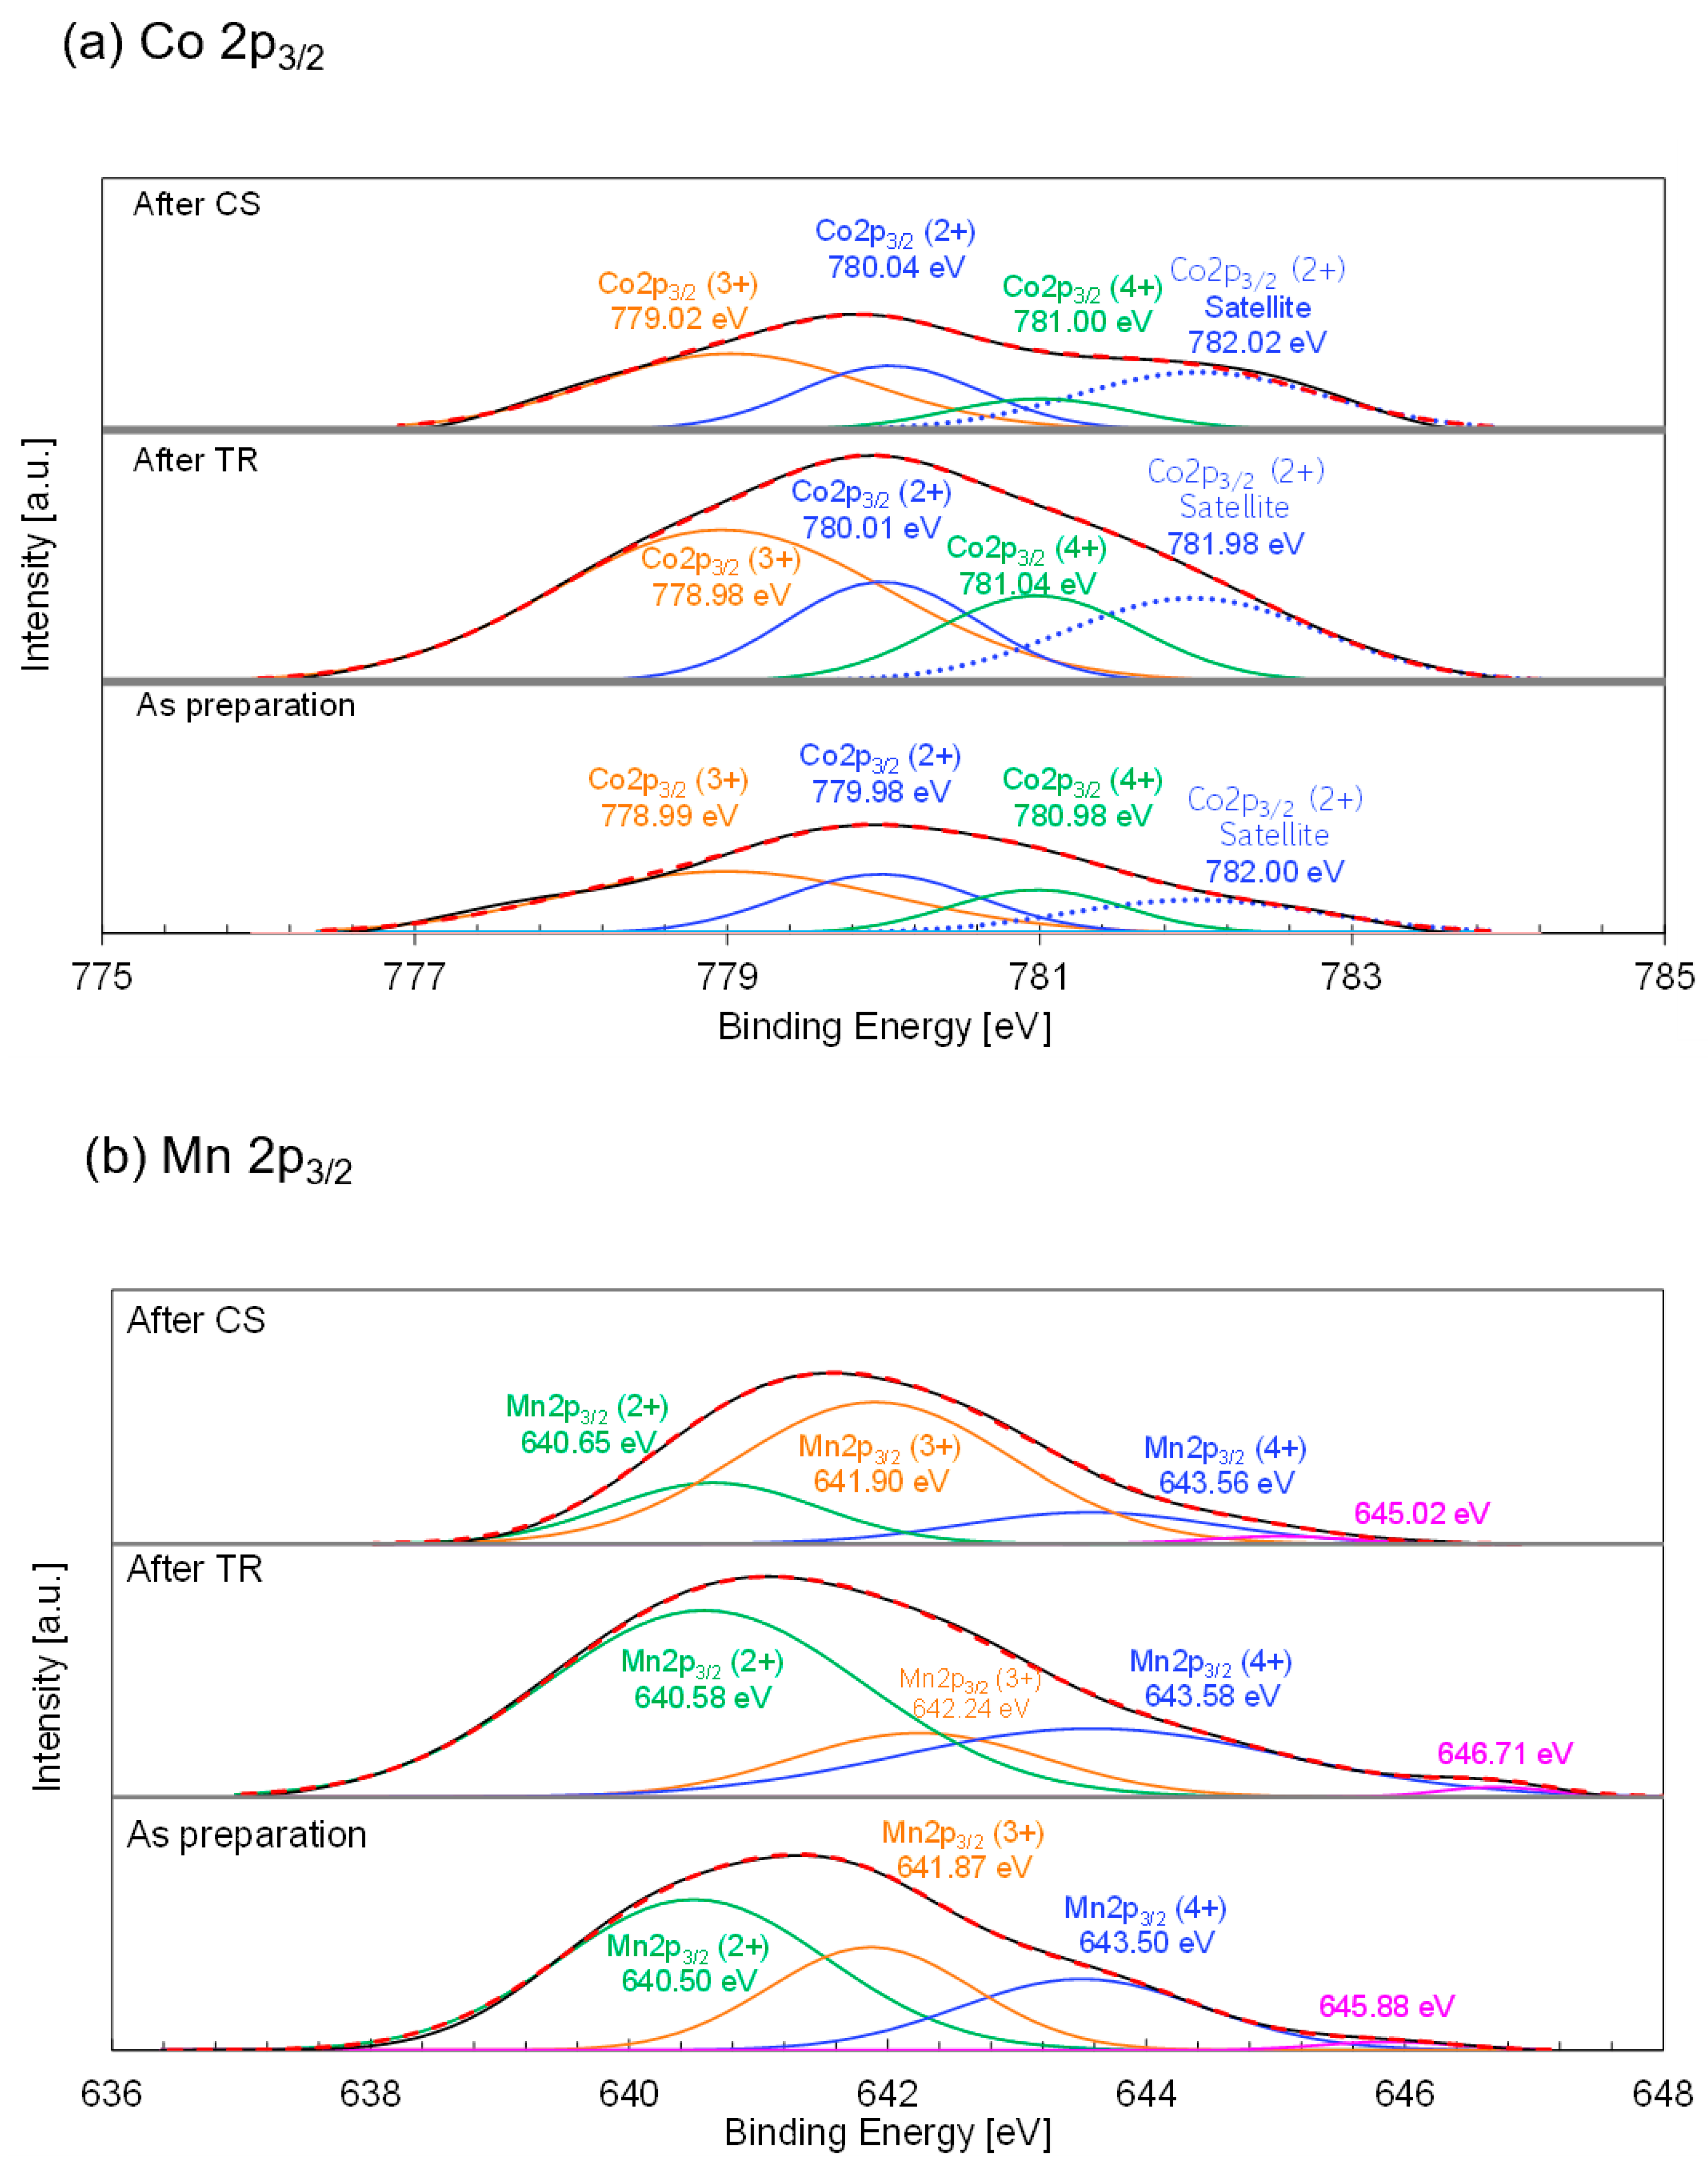
The deconvoluted Co 2p3/2 and Mn 2p3/2 XPS profiles of the LSMCo0.35 sample are shown in Figure 11. The Co 2p3/2 XPS profile of the as-prepared sample fitted the quadruplet peaks centered at 778.99, 779.98, 780.98, and 782.00 eV, respectively (Figure 11a). Each peak centered at 778.99 and 779.98 eV corresponded to the Co3+ and Co2+ signal, respectively. According to the literature [58], the XPS profile of Co3O4 shows a peak centered at 779.6 eV, assigned to trivalent cobalt, whereas the peaks centered at 780.1 (strongest), 782.1, 785.5, and 786.5 eV were attributed to bivalent cobalt. The XPS results of LiCoO2 showed a peak centered at 779.6 eV in the Co 2p3/2 spectrum, attributed to trivalent cobalt. This value agrees with the previously reported data [59], in which the peak centered at 781 eV in the Co 2p3/2 spectrum of Li0.66CoO2 was attributed to tetravalent cobalt. This value corresponds to the current results (tetravalent cobalt). Finally, it was proposed that the other peak-centered redox reaction occurred in LSMCo0.35 during the thermochemical two-step process. In contrast, 782.00 eV corresponded to the satellite peak of the Co2+ signal. Figure 11b shows the deconvoluted Mn 2p3/2 XPS profile of LSMCo0.35. The triplet peaks at 640.50, 641.87, and 643.50 eV for the as-prepared sample were attributed to Mn2+, Mn3+, and Mn4+, respectively. The binding energy peaks of the as-prepared samples agreed with those reported in the literature [60,61,62]. The valence states of the Mn and Co ions in the LSMCo0.35 sample were calculated and estimated from the peak positions and areas of the signals for the Mn and Co ions. As shown in Table 6, the valence states of Mn decreased after the TR step, indicating the release of oxygen from the sample, and increased after the subsequent CS step owing to oxygen absorption via CO2 splitting. The Mn 2p3/2 XPS data indicate that the valence states of the Mn ions contributed to the redox reaction in LSMCo0.35 during the thermochemical two-step process. In contrast to the variation in the valence of Mn, the valence states of Co (Table 7) either did not change in either step or changed negligibly, the change having no relation to the redox reaction. These results indicate that the Co ions at the B site of the LSMCo0.35 sample may promote the redox reaction of Mn ions in the thermochemical cycle. Compared to the valence change of the Mn ions in the nonsubstituted sample, the valence change increased in the LSMCo0.35 sample. The result of the LSMCo0.35 sample agreed well with the result of the 10%Mg-substituted sample without a valence change in Mg in a previous study [53].
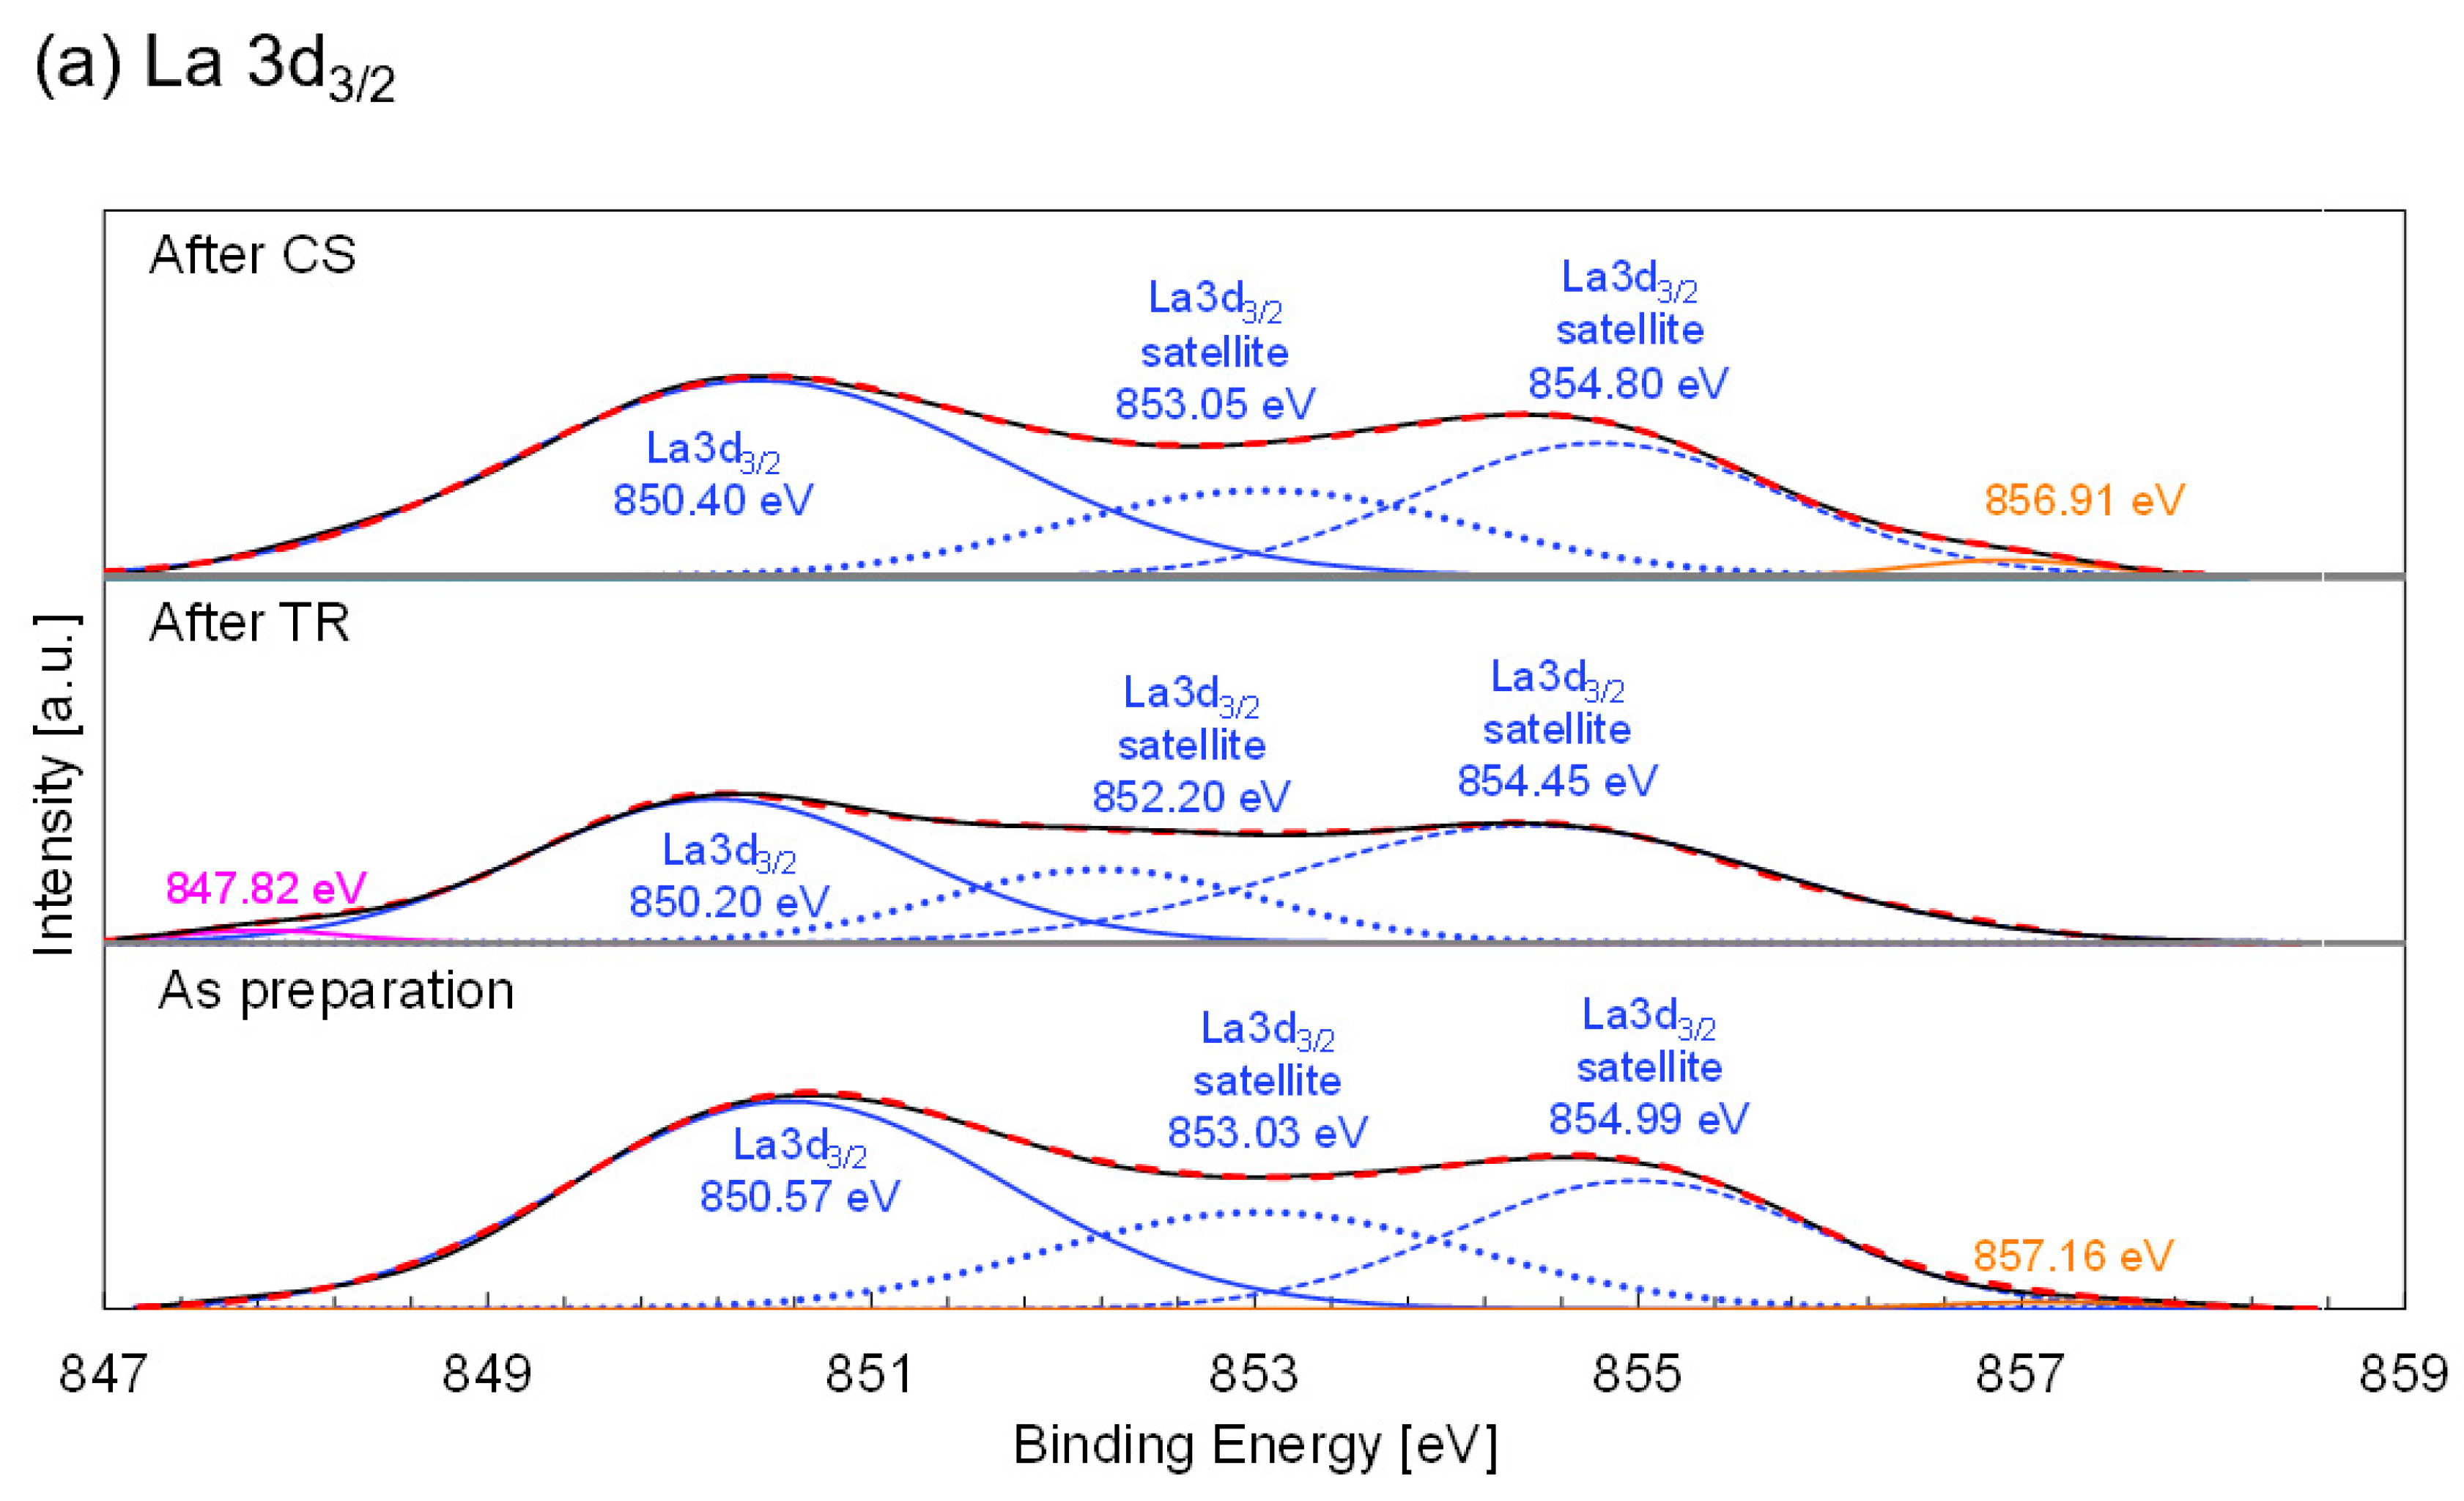
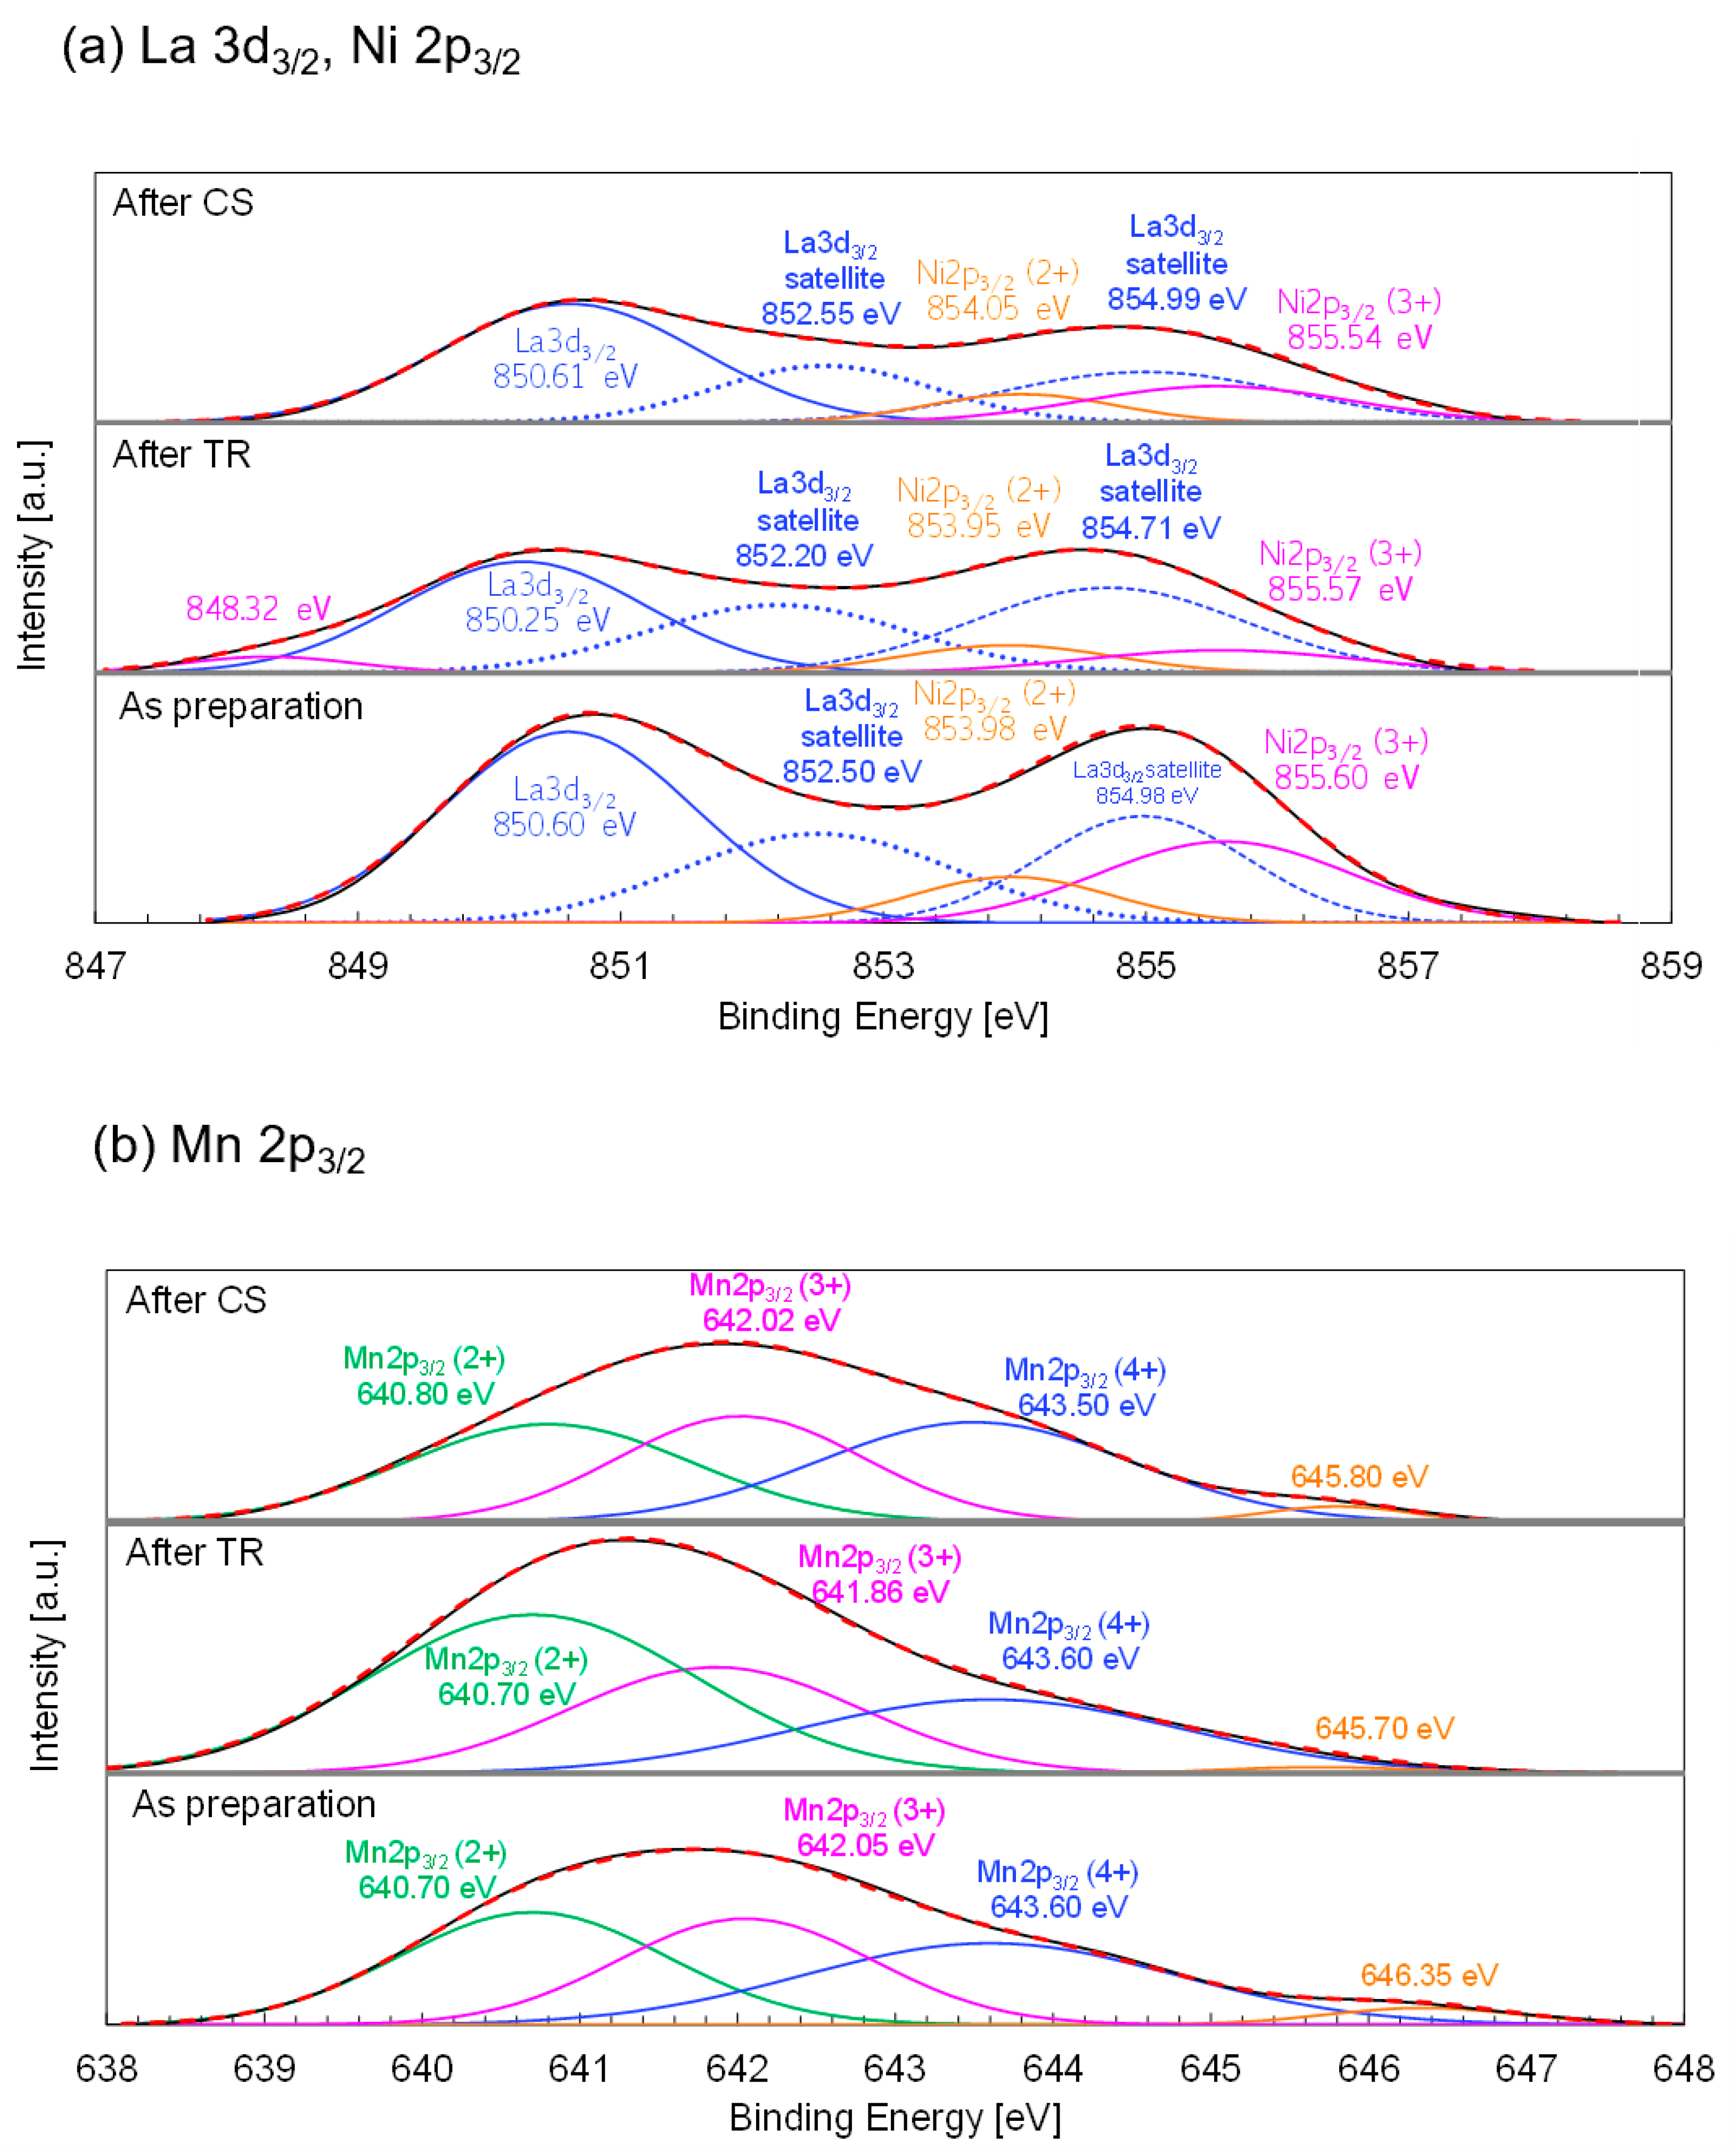
Figure 12a shows the deconvoluted La 3d3/2 and Ni 2P3/2 X-ray photoelectron spectra of the as-prepared LSMNi0.20 after TR and after subsequent CS steps in the thermochemical cycle. For the as-prepared LSMNi0.20, the triplet peaks centered at 850.60, 852.50, and 854.98 eV can be assigned to the La 3d3/2 main and satellite peaks. Triplet La 3d3/2 peaks have previously been reported for LaFexO3-δ (0.7 ≤ x ≤ 1.3) perovskites [63]. According to the literature, the main peak in the La 3d3/2 spectrum appears at a binding energy of ~850 eV, whereas satellite peaks are present between 850 and 855 eV. These results are in agreement with those of the current study. Thus, the La 3d3/2 XPS data indicate that lanthanum ions were present in trivalent form in the as-prepared LSMNi0.20. The binding energies of the main and satellite peaks in the La 3d3/2 region were not significantly different for the as-prepared LSMNi0.20 and samples obtained after the TR and subsequent CS steps. These results indicate that the valence state of La did not change during either step of the thermochemical cycle. For the double perovskite Nd2NiMnO6, the Ni 2p XPS profile shows the most prominent peak in the vicinity of 850–860 eV [64]. The Ni 2p3/2 peak appeared at lower binding energies and higher intensities than the Ni 2p1/2 peak [65]. The Ni 2p3/2 peaks for the La0.8Sr0.2Mn1−xNixO3 nanoparticles were observed together with the La 3d3/2 peaks, and the former were separated into doublet peaks centered at ~854 and 855.5 eV. The low and high binding energies correspond to the divalent and trivalent ions. The peak position of the doublet did not change with Ni substitution levels of 20% or 40% [66]. In the case of the porous Ni (II) hydroxide nanosheets supported on carbon paper [65], doublet peaks due to divalent and trivalent Ni appeared at low and high binding energies, respectively, in the Ni 2p3/2 spectra. As shown in Figure 12a, the Ni 2p3/2 XPS profile of the as-prepared LSMNi0.20 shows doublet peaks centered at 853.98 and 855.60 eV. The low and high binding energies correspond to the divalent and trivalent ions. These peak positions are in good agreement with those reported previously [66]. The results in Figure 12a indicate that the as-prepared LSMNi0.20 contained trivalent and divalent Ni ionic species at the B site of the perovskite. For the samples obtained after the TR and subsequent CS steps, negligible differences (853.95–854.05 eV for Ni2 and 855.54–855.60 eV for Ni3+) in the binding energies were observed. The corresponding Ni valences were calculated from the peak areas of the Ni2+ and Ni3+ curves. The results are summarized in Table 8. The estimated average values of Ni valence were 2.70, 2.51, and 2.40 for the as-prepared sample and samples obtained after the TR and CS steps. The variations in the Ni valences did not change for either step or remained limited without being related to the redox reaction. 
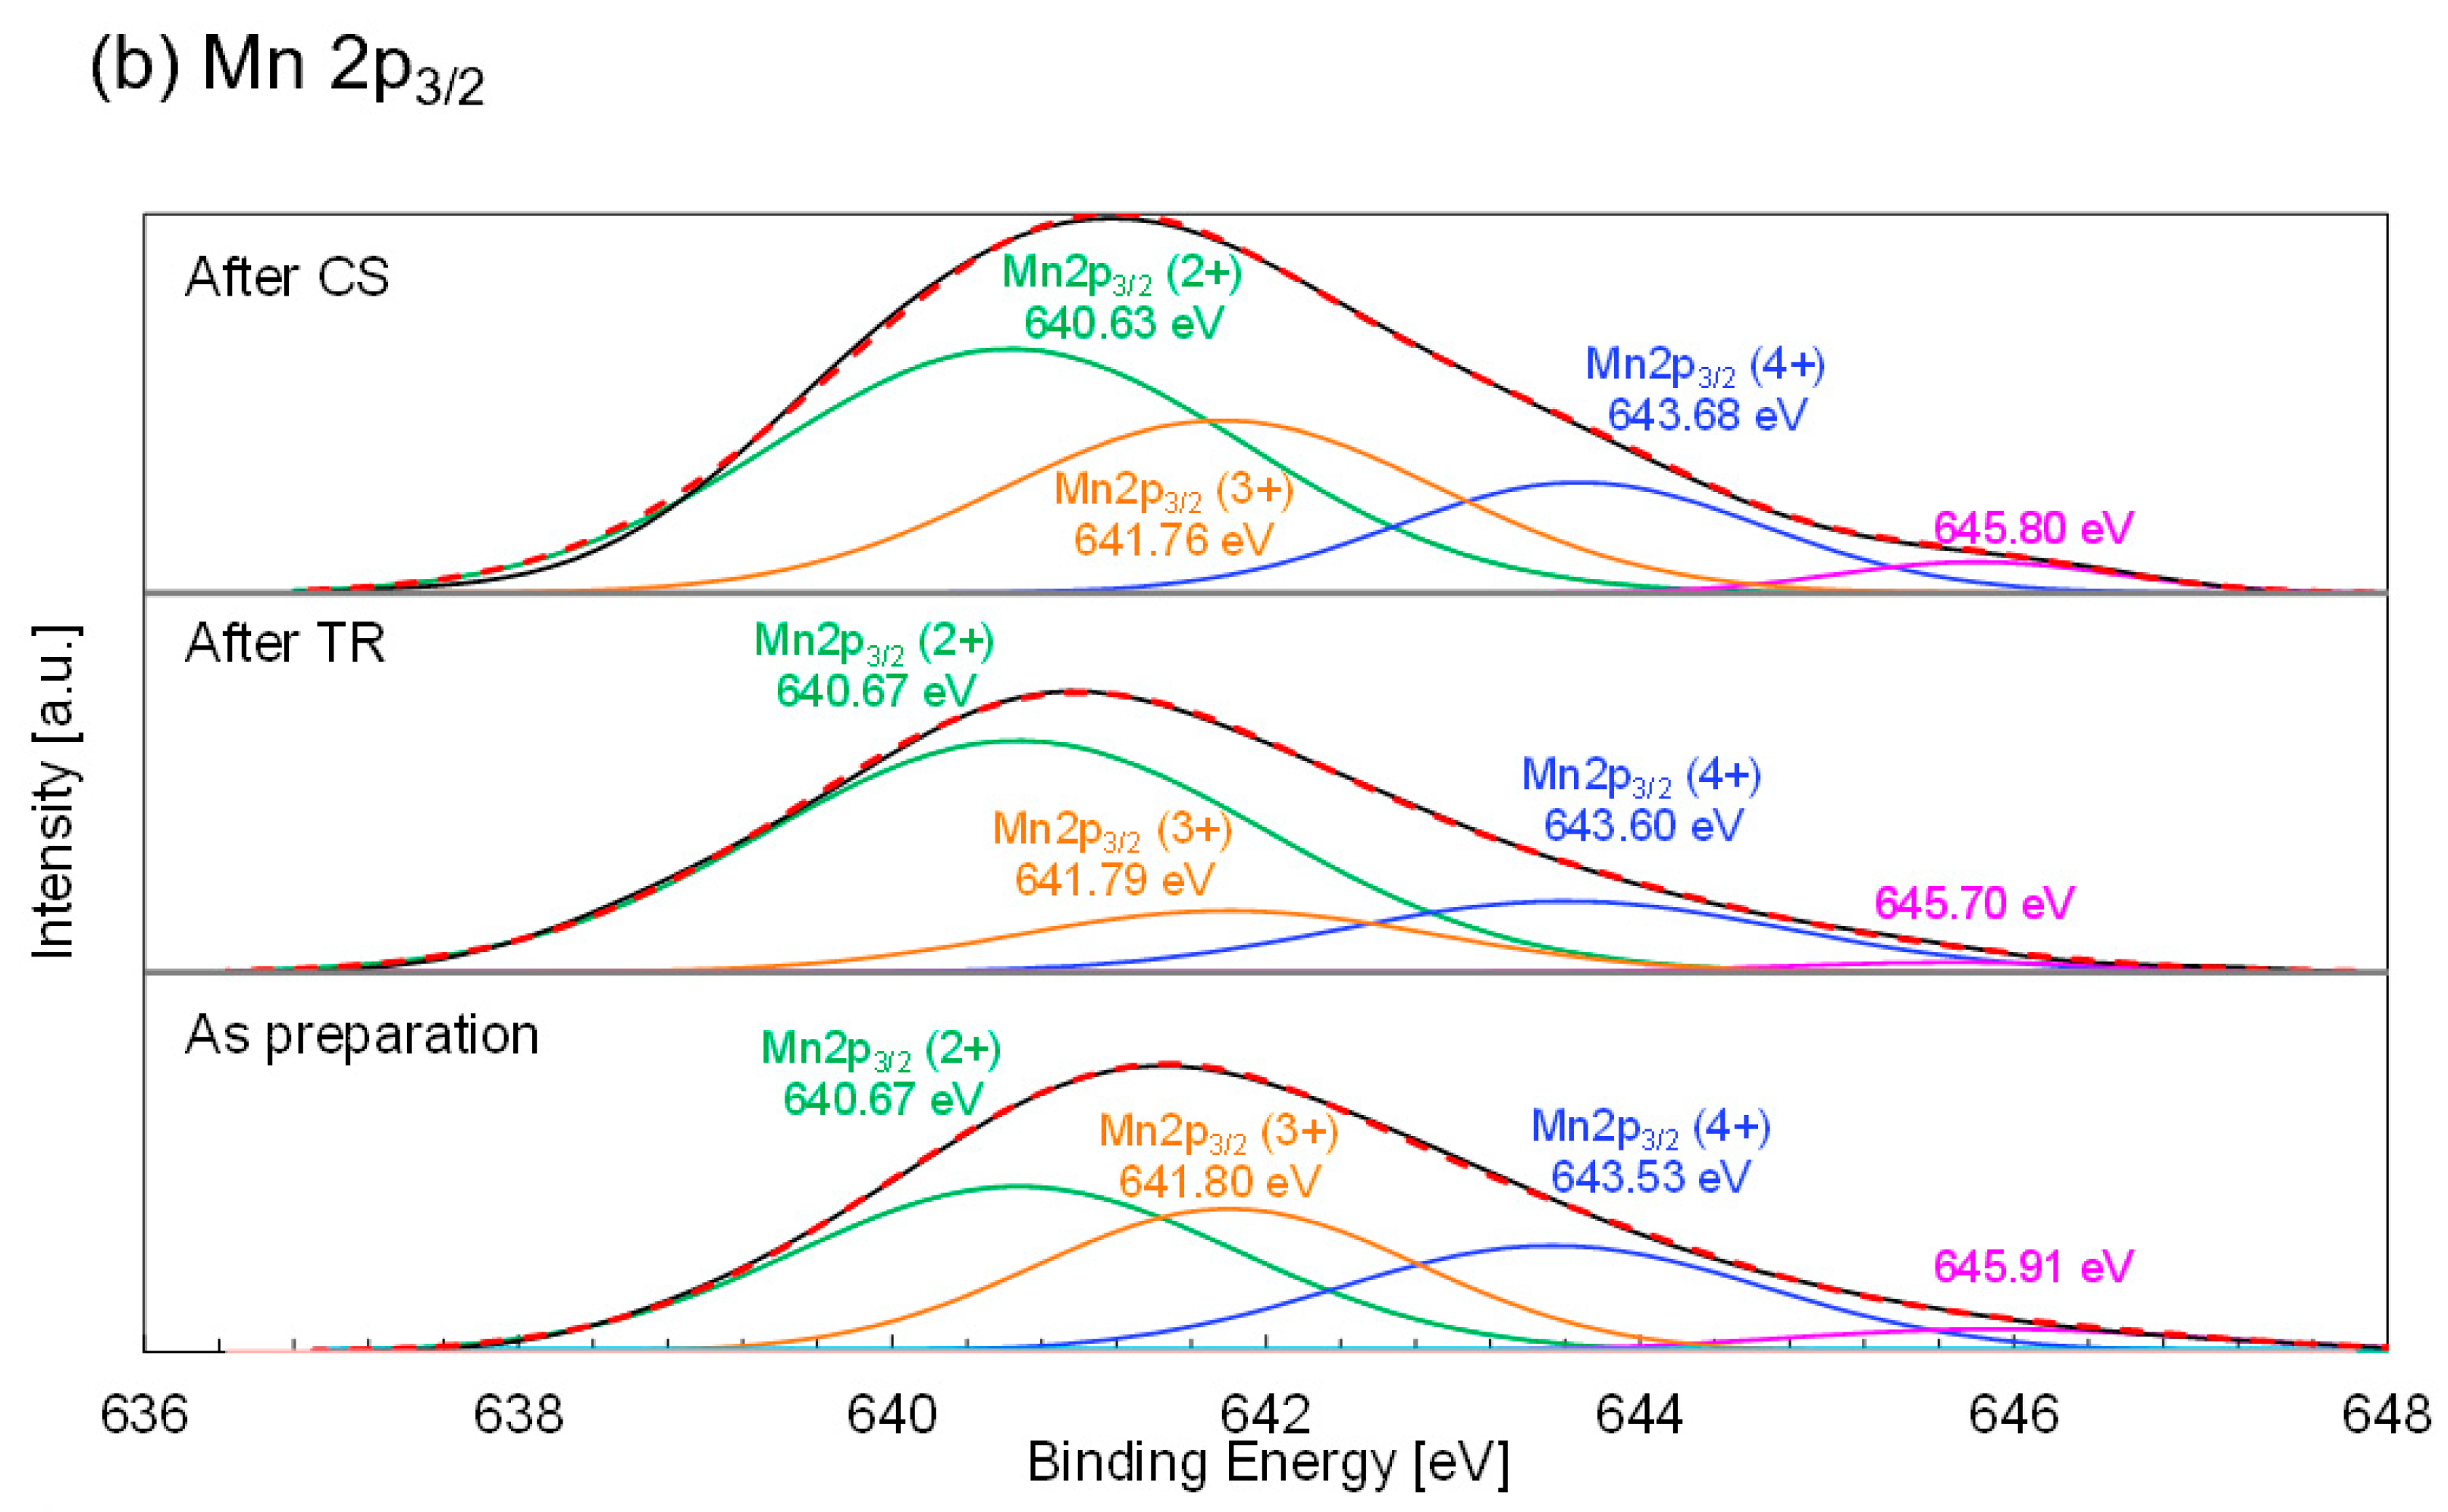
Figure 12b shows the Mn 2p3/2 spectra with peak deconvolutions of the as-prepared samples and those obtained after each step. The peak positions obtained for the as-prepared samples were within the range of previously reported peak position variations and were in good agreement with the data for the La0.8Sr0.2Mn1-xNixO3 perovskite [66] with similar crystal structures and chemical compositions. The positions and areas of the peaks corresponding to the Mn2+/Mn3+/Mn4+ species are summarized in Table 9. The corresponding Mn valences were estimated based on the peak areas. The estimated Mn2+, Mn3+, and Mn4+ fractions for the as-prepared samples were 34.0%, 31.7%, and 34.3%, respectively, and the average Mn valence was identical to the stoichiometric value of 3.00+. As shown in Table 9, the average Mn valences of the samples obtained after the TR and CS steps were 2.73+ and 3.06+, respectively. The variations in Mn valences can be used to describe the redox reaction in two-step thermochemical cycling. Notably, the average Mn valence returns to its initial value, suggesting that the sample undergoes continuous stoichiometric cycling without degradation.

3.5. Comparison of Mg, Ni, and Co-Substituted LSMs with Previous Literature

The CO2-to-CO conversions and CO productivities of LSMNi0.20, LSMCo0.35, and LSMMg0.125 were compared with those of cerium oxide and previously reported congeners. The weight change profiles of cerium oxide during thermochemical cycling are shown in Figure S7 of the Supplementary Information. The O2 and CO productivities are summarized in Table S1. 
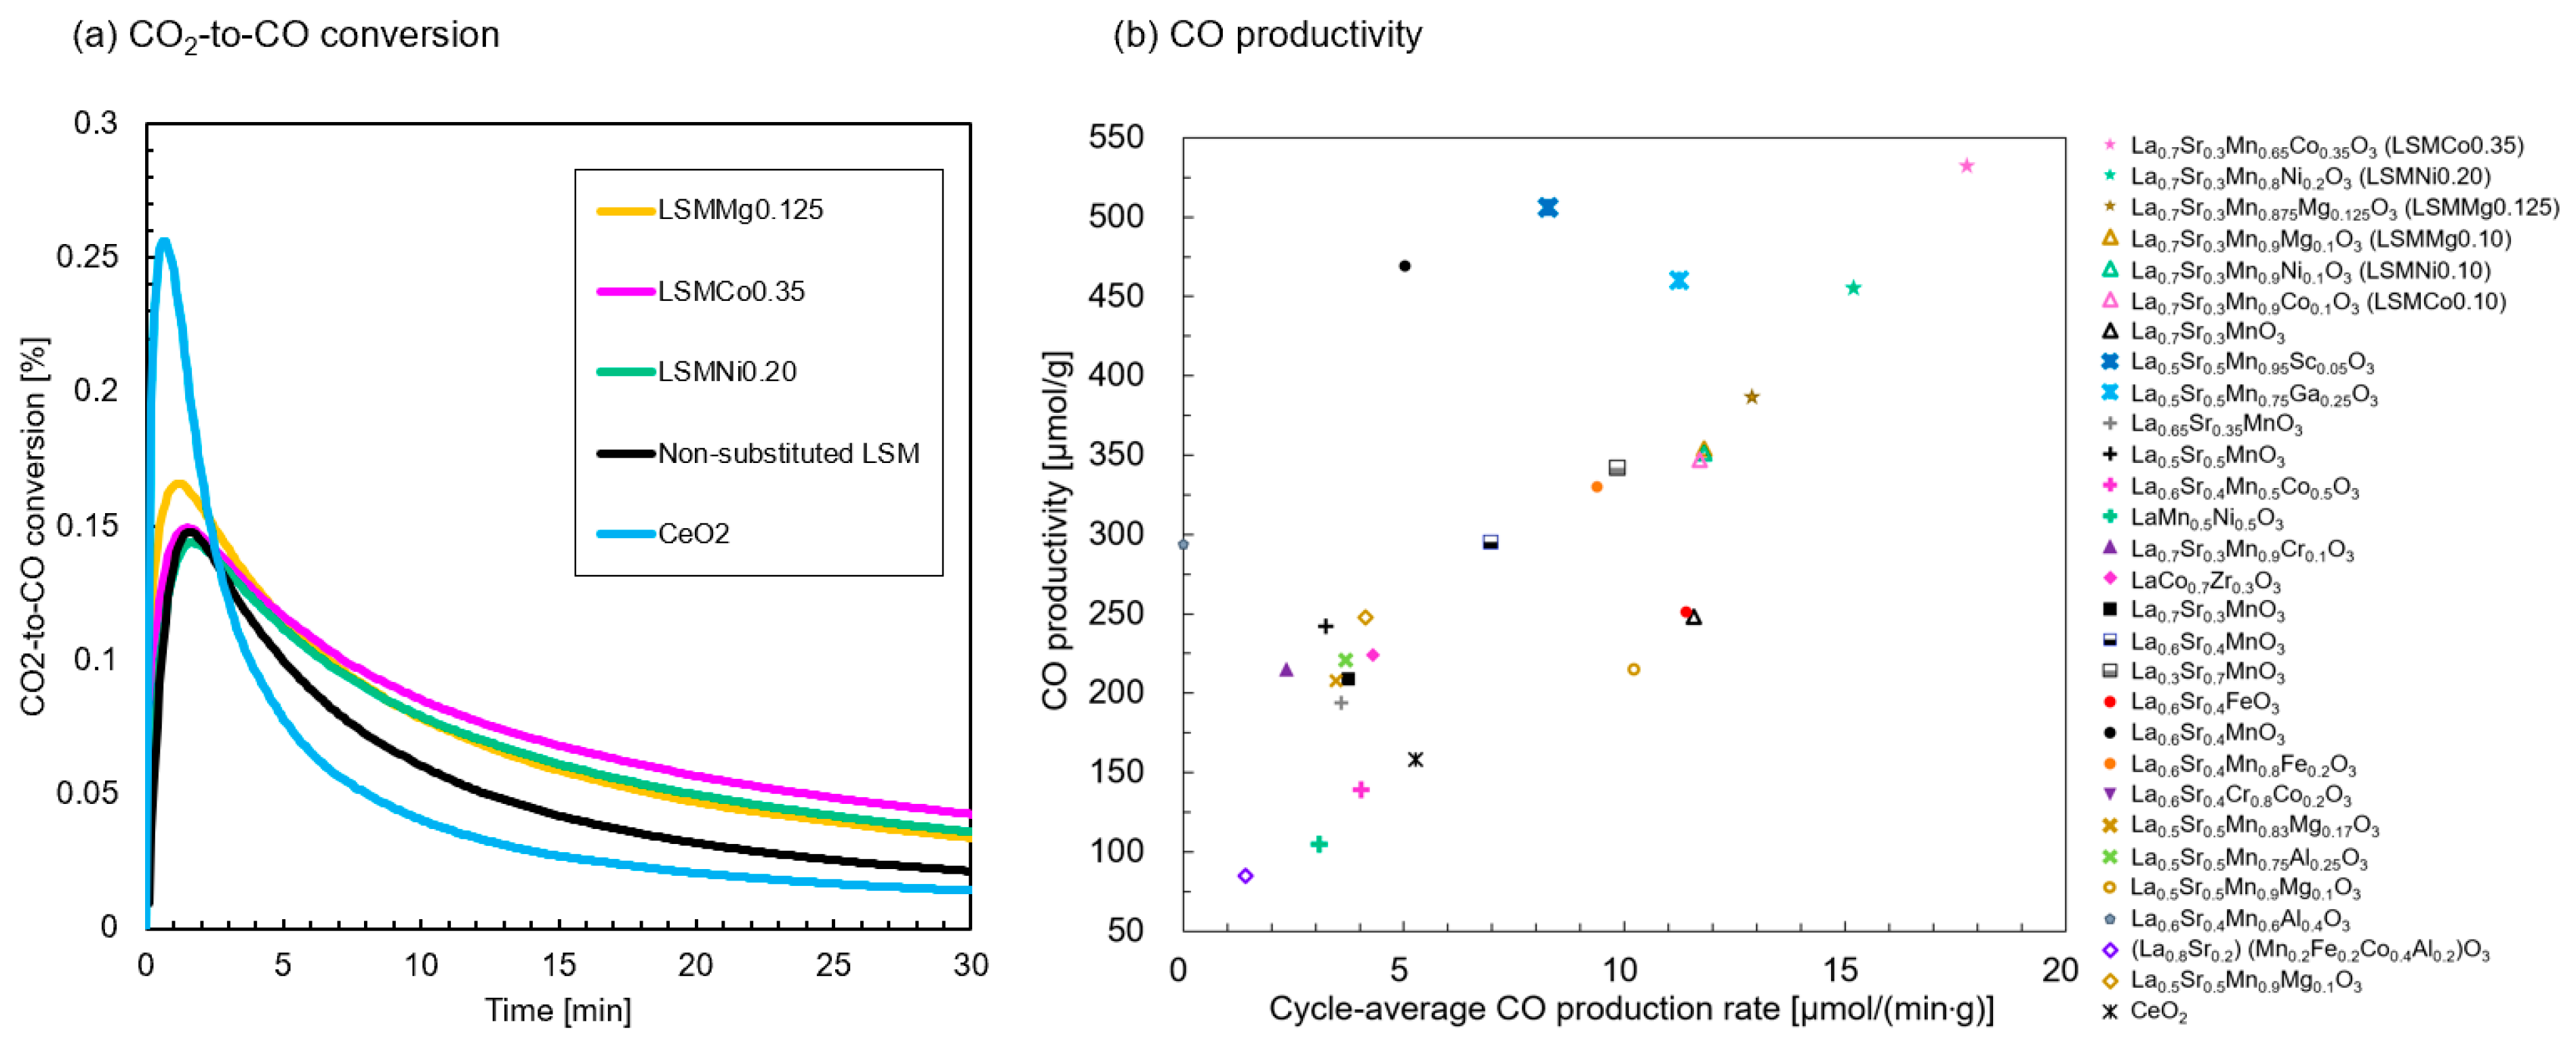
Figure 13a shows the time variations in CO2-to-CO conversion ( X C O 2 ) of the tested samples. The results for the nonsubstituted sample and cerium oxide are also shown for comparison. The peak value of X C O 2 for the LSMMg0.125 sample was ~0.17%, which was higher than that of the nonsubstituted sample but less than that of cerium oxide. However, the values of X C O 2 after 30 min of the CS step for the three samples were enhanced compared with those of the nonsubstituted sample and cerium oxide. This is owing to the extended duration of CO production. Figure 13b shows the CO productivities per gram of material and average value per duration. Previous data on the thermochemical two-step CO2 splitting using LSM-based perovskites in a thermogravimetric reactor have been cited from the literature [29,31,32,33,36,39,40,41,45,47,53,67]. The best-performing samples in this study ranked at the highest level of both CO productivities compared to the reported substituted LSMs, where LSMCo0.35 exhibited the maximum CO productivity (533 μmol/g material) among the reported LSM perovskites. Compared to the authors’ previous results marked with a triangle (LSMMg0.10, LSMCo0.10, and LSMNi0.10) [53], obtained under the same test conditions using the same methods and devices, the CO productivity of LSMCo0.35 was ~1.5 times higher. Other perovskite materials that are not LSM series, Sm0.6Ca0.4Mn0.8Al0.20O3 [68], Sr0.6Ce0.4Mn0.8Al0.2O3 [69], and Sm0.6Sr0.4MnO3 [70], were studied for the thermochemical two-step CO2 splitting cycle. A comparison with previous literature data can be biased by the test equipment, test conditions (reaction time, temperature in both steps, gas flow rates, and concentrations), morphological features of the samples, configuration of the samples, passing gases (inert gas and CO2), and whether the gas flow directly contacts the surface of the sample or indirectly reacts with the sample mounted in the crucible. The thermogravimetric reactor measures the weight change of the sample under various atmospheres during the thermochemical two-step CO2 splitting cycle and estimates the O2 and CO productivities. However, some reactors directly measure O2 and CO gases using gas chromatography and gas analysis [34,45]. When the test results from the thermogravimetric reactor contain anything other than oxygen release/absorption based on the reaction mechanism (Equations (1) and (2)), the results should be evaluated and compared with literature data.

4. Conclusions

The redox performances of lanthanum/strontium–manganese-based perovskite oxides La1−xSrxMn1−yZyO3 (Z = Ni, Co, or Mg) were studied for a two-step thermochemical CO2 splitting cycle to produce liquid fuel from syngas. Based on the analysis of the stoichiometry of oxygen/CO production and chemical composition at the A- and B sites, La0.7Sr0.3Mn0.8Ni0.20O3 and La0.7Sr0.3Mn0.65Co0.35O3 are the most promising materials for enhancing oxygen/CO productivity among the LSM perovskite oxides that have been studied for two-step thermochemical CO2 splitting. Especially, La0.7Sr0.3Mn0.65Co0.35O3 exhibited CO productivity of 533 μmol/g on the redox reactivity tests, and this result is 2.15 times higher than that of nonsubstituted La0.7Sr0.3MnO3 (248 μmol/g) in the same reaction conditions. In addition, both samples showed stable and reproducible O2 and CO release profiles during long-term continuous thermochemical cycling tests. Compared with the second and fiftieth run of CO productivity during the long-term cycling tests, the decline fraction for LSMCo0.35 and LSMNi0.20 was 1.0% and 3.7%, respectively. Ni and Co substitutions in the LSM perovskite enhanced the amount of O2 released and improved fuel production by inducing large variations in the Mn valence owing to the existence of multivalences of Ni and Co during the thermochemical two-step cycle. Notably, LSMCo0.35 exhibits the maximum CO productivity (533 μmol/g material) compared to the previously reported LSM perovskites.

Supplementary Materials

The following supporting information can be downloaded at: https://www.mdpi.com/article/10.3390/pr11092717/s1, Figure S1: Powder XRD pattern of the as-prepared sample (x = 0, La1-xSrxMn0.8Ni0.2O3); Figure S2: Powder XRD pattern of the as-prepared sample (x = 0.2, La1-xSrxMn0.8Ni0.2O3); Figure S3: Powder XRD pattern of the as-prepared sample (x = 0.3, La1-xSrxMn0.8Ni0.2O3); Figure S4: Powder XRD pattern of the as-prepared sample (x = 0.4, La1-xSrxMn0.8Ni0.2O3); Figure S5: Powder XRD pattern of the as-prepared sample (x = 0.6, La1-xSrxMn0.8Ni0.2O3); Figure S6: Powder XRD pattern of the as-prepared sample (x = 0.8, La1-xSrxMn0.8Ni0.2O3); Figure S7: Thermochemical cycling test of the ceria sample (CeO2); Figure S8: O2 or CO2 productivities, and CO/O2 ratio of thermochemical cycling using CeO2. Table S1. Comparison of O2 productivity, average CO productivity, cycle-averaged CO production rate, and reaction conditions of LSMCo0.35, LSMNi0.20, LSMMg0.125, CeO2, and LSM perovskites reported in the literature.

Author Contributions

H.S. contributed to conducting whole experiments and analysis, visualization and writing—original draft and revision; D.Y. contributed to collaborating investigation; N.G. contributed to performing conceptualization, methodology, validation, formal analysis, writing—review and editing, supervision, project administration, funding acquisition, and providing software and resources. All authors have read and agreed to the published version of the manuscript.

Funding

This research was partially supported by the Ministry of Education, Culture, Sports, Science and Technology, Challenging Research (Exploratory), JSPS KAKENHI (grant number 21K18920), Grant-in-Aid for Scientific Research (B), JSPS KAKENHI (grant number 19H02658) and Grant-in-Aid for Scientific Research (C), and JSPS KAKENHI (grant number 20K05398).

Data Availability Statement

The original contributions presented in the study are included in the article, further inquiries can be directed to the corresponding author.

Acknowledgments

The authors gratefully acknowledge Yuki Murata at Niigata University for supporting XPS analysis, technical staff (Katsutoshi Iwafune) at Niigata University for supporting the XRD measurement, technical staff (Takahiro Nomoto) at Niigata University for supporting the SEM measurement, and technical stuff (Tsuyoshi Hatamachi) at Niigata University for helping this study.

Conflicts of Interest

The authors declare that the research was conducted in the absence of any commercial or financial relationship that could be construed as a potential conflict of interest.

References

  1. Abanades, S. Redox Cycles, Active Materials, and Reactors Applied to Water and Carbon Dioxide Splitting for Solar Thermochemical Fuel Production: A Review. Energies 2022, 15, 7061. [Google Scholar] [CrossRef]
  2. Schunk, L.O.; Haeberling, P.; Wepf, S.; Wuillemin, D.; Meier, A.; Steinfeld, A. A Receiver-Reactor for the Solar Thermal Dissociation of Zinc Oxide. J. Sol. Energy Eng. 2008, 2, 130. [Google Scholar] [CrossRef]
  3. Agrafiotis, C.; Roeb, M.; Sattler, C. A review on solar thermal syngas production via redox pair-based water/carbon dioxide splitting thermochemical cycles. Renew. Sustain. Energy Rev. 2015, 42, 254–285. [Google Scholar] [CrossRef]
  4. Chambon, M.; Abanades, S.; Flamant, G. Kinetic investigation of hydrogen generation from hydrolysis of SnO and Zn solar nanopowders. Int. J. Hdrogen Energy 2009, 34, 5326–5336. [Google Scholar] [CrossRef]
  5. Miller, J.E.; McDaniel, A.H.; Allendorf, M.D. Considerations in the design of materials for solar-driven fuel production using metal-oxide thermochemical cycles. Adv. Energy Mater. 2014, 4, 1300469. [Google Scholar] [CrossRef]
  6. Tamaura, Y.; Steinfeld, A.; Kuhn, P.; Ehrensberger, K. Production of solar hydrogen by a novel, 2-step, water-splitting thermochemical cycle. Energy 2009, 20, 325–330. [Google Scholar] [CrossRef]
  7. Sunarso, J.; Hashim, S.S.; Zhu, N.; Zhou, W. Perovskite oxides applications in high temperature oxygen separation, solid oxide fuel cell and membrane reactor: A review. Prog. Energy Combust. Sci. 2017, 61, 57–77. [Google Scholar] [CrossRef]
  8. Randhir, K.; Rhodes, N.R.; Li, L.; AuYeung, N.; Hahn, D.W.; Mei, R.; Klausner, J.F. Magnesioferrites for solar thermochemical fuel production. Sol. Energy 2018, 163, 1–15. [Google Scholar] [CrossRef]
  9. Meng, Q.L.; Lee, C.I.; Ishihara, T.; Kaneko, H.; Tamaura, Y. Reactivity of CeO2-based ceramics for solar hydrogen production via a two-step water-splitting cycle with concentrated solar energy. Int. J. Hdrogen Energy 2011, 36, 13435–13441. [Google Scholar] [CrossRef]
  10. Marxer, D.; Furler, P.; Scheffe, J.; Geerlings, H.; Falter, C.; Batteiger, V.; Sizmann, A.; Steinfeld, A. Demonstration of the Entire Production Chain to Renewable Kerosene via Solar Thermochemical Splitting of H2O and CO2. Energy Fuels 2015, 29, 3241–3250. [Google Scholar] [CrossRef]
  11. Jiang, Q.; Zhou, G.; Jiang, Z.; Li, C. Thermochemical CO2 splitting reaction with CexM1−xO2−δ (M=Ti4+, Sn4+, Hf4+, Zr4+, La3+, Y3+ and Sm3+) solid solutions. Sol. Energy 2014, 99, 55–66. [Google Scholar] [CrossRef]
  12. Bhosale, R.R.; Takalkar, G.D. Nanostructured co-precipitated Ce0.9Ln0.1O2 (Ln = La, Pr, Sm, Nd, Gd, Tb, Dy, or Er) for thermochemical conversion of CO2. Ceram. Int. 2018, 44, 16688–16697. [Google Scholar] [CrossRef]
  13. Gokon, N.; Suda, T.; Kodama, T. Oxygen and hydrogen productivities and repeatable reactivity of 30-mol%-Fe-, Co-, Ni-, Mn-doped CeO2-δ for thermochemical two-step water-splitting cycle. Energy 2015, 90, 1280–1289. [Google Scholar] [CrossRef]
  14. Lu, Y.; Zhu, L.; Agrafiotis, C.; Vieten, J.; Sattler, M.C. Solar Fuels Production: Two-Step Thermochemical Cycles with Cerium-Based Oxides. Prog. Energy Combust. Sci. 2019, 75, 10078. [Google Scholar] [CrossRef]
  15. Arifin, D.; Weimer, A.W. Kinetics and mechanism of solar-thermochemical H2 and CO production by oxidation of reduced CeO2. Sol. Energy 2018, 160, 178–185. [Google Scholar] [CrossRef]
  16. Chueh, W.C.; Falter, C.; Abbott, M.; Scipio, D.; Furler, P.; Haile, S.M.; Steinfield, A. High-Flux Solar-Driven Thermochemical Dissociation of CO2 and H2O Using Nonstoichiometric Ceria. Science 2010, 330, 1797–1801. [Google Scholar] [CrossRef]
  17. Bhosale, R.R.; Takalkar, G.; Sutar, P.; Kumar, A.; AlMomani, F.; Khraisheh, M. A decade of ceria based solar thermochemical H2O/CO2 splitting cycle. Int. J. Hdrogen Energy 2019, 44, 34–60. [Google Scholar] [CrossRef]
  18. Gokon, N.; Sagawa, S.; Kodama, T. Comparative study of activity of cerium oxide at thermal reduction temperatures of 1300–1550 C for solar thermochemical two-step water-splitting cycle. Int. J. Hdrogen Energy 2013, 381, 4402–4414. [Google Scholar] [CrossRef]
  19. Abanades, S.; Flamant, G. Thermochemical hydrogen production from a two-step solar-driven water-splitting cycle based on cerium oxides. Sol. Energy 2006, 80, 1611–1623. [Google Scholar] [CrossRef]
  20. Chueh, W.C.; Haile, S.M. Ceria as a thermochemical reaction medium for selectively generating syngas or methane from H2O and CO2. ChemSusChem 2009, 2, 735–739. [Google Scholar] [CrossRef]
  21. Gokon, N.; Hara, K.; Sugiyama, Y.; Bellan, S.; Kodama, T.; Cho, H. Thermochemical two-step water splitting cycle using perovskite oxides based on LaSrMnO3 redox system for solar H2 production. Thermochim. Acta 2019, 680, 178374. [Google Scholar] [CrossRef]
  22. Carrillo, R.J.; Scheffe, J.R. Advances and trends in redox materials for solar thermochemical fuel production. Sol. Energy 2017, 156, 3–20. [Google Scholar] [CrossRef]
  23. Parvanian, A.M.; Salimijazi, H.; Shabaninejad, M.; Troitzsch, U.; Kreider, P.; Lipiński, W.; Saadatfar, M. Thermochemical CO2 splitting performance of perovskite coated porous ceramics. RSC Adv. 2020, 10, 23049–23057. [Google Scholar] [CrossRef]
  24. Xu, X.; Wang, W.; Zhou, W.; Shao, Z. Recent Advances in Novel Nanostructuring Methods of Perovskite Electrocatalysts for Energy-Related Applications. Small Methods 2018, 2, 1800071. [Google Scholar] [CrossRef]
  25. Scheffe, J.R.; Weibel, D.; Steinfeld, A. Lanthanum–strontium–manganese perovskites as redox materials for solar thermochemical splitting of H2O and CO2. Energy Fuels 2013, 27, 4250–4257. [Google Scholar] [CrossRef]
  26. Riaz, A.; Kreider, P.; Kremer, F.; Yeohn, H.J.S.; Lipinski, W.; Lowe, A. Electrospun Manganese-Based Perovskites as Efficient Oxygen Exchange Redox Materials for Improved Solar Thermochemical CO2 Splitting. ACS Appl. Energy Mater. 2019, 2, 2495–2505. [Google Scholar] [CrossRef]
  27. Dey, S.; Naidu, B.S.; Rao, C.N.R. Ln0.5A0.5MnO3 (Ln=Lanthanide, A= Ca, Sr) Perovskites Exhibiting Remarkable Performance in the Thermochemical Generation of CO and H2 from CO2 and H2O. Chem.—A Eur. J. 2015, 21, 7077–7081. [Google Scholar] [CrossRef]
  28. Demont, A.; Abanades, S. High redox activity of Sr-substituted lanthanum manganite perovskites for two-step thermochemical dissociation of CO2. RSC Adv. 2014, 4, 54885–54891. [Google Scholar] [CrossRef]
  29. Nair, M.M.; Abanades, S. Experimental screening of perovskite oxides as efficient redox materials for solar thermochemical CO2 conversion. Sustain. Energy Fuels 2018, 2, 843. [Google Scholar] [CrossRef]
  30. Dey, S.; Naidu, B.S.; Govindaraj, A.; Rao, C.N.R. Noteworthy performance of La1−xCaxMnO3 perovskites in generating H2 and CO by the thermochemical splitting of H2O and CO2. Phys. Chem. Chem. Phys. 2015, 17, 122–125. [Google Scholar] [CrossRef] [PubMed]
  31. Demont, A.; Abanades, S. Solar thermochemical conversion of CO2 into fuel via two-step redox cycling of non-stoichiometric Mn-containing perovskite oxides. J. Mater. Chem. A 2015, 3, 3536–3546. [Google Scholar] [CrossRef]
  32. Jouannaux, J.; Haeussler, A.; Drobek, M.; Ayral, A.; Abanades, S.; Julbe, A. Lanthanum manganite perovskite ceramic powders for CO2 splitting: Influence of Pechini synthesis parameters on sinterability and reactivity. Ceram. Int. 2019, 45, 15636–15648. [Google Scholar] [CrossRef]
  33. Takalkar, G.; Bhosale, R.R.; AlMomani, F.; Rashid, S.; Qiblawey, H.; Saad, M.A.S.; Khraisheh, M.; Kumar, G.; Gupta, R.B.; Shende, R.V. Thermochemical splitting of CO2 using solution combustion synthesized lanthanum–strontium–manganese perovskites. Fuel 2021, 285, 119154. [Google Scholar] [CrossRef]
  34. Demont, A.; Abanades, S.; Beche, E. Investigation of perovskite structures as oxygen-exchange redox materials for hydrogen production from thermochemical two-step water-splitting cycles. J. Phys. Chem. C 2014, 118, 12682–12692. [Google Scholar] [CrossRef]
  35. Deml, A.M.; Stevanovic, V.; Holder, A.M.; Sanders, M.; O’Hayre, R.; Musgrave, C.B. Tunable oxygen vacancy formation energetics in the complex perovskite oxide SrxLa1−xMnyAl1−yO3. Chem. Mater. 2014, 26, 6595–6602. [Google Scholar] [CrossRef]
  36. McDaniel, A.H.; Miller, E.C.; Arifin, D.; Ambrosini, A.; Coker, E.N.; O’Hayre, R.; Chueh, W.C.; Tong, J. Sr-and Mn-doped LaAlO3-δ for solar thermochemical H2 and CO production. Energy Environ. Sci. 2013, 6, 2424–2428. [Google Scholar] [CrossRef]
  37. Liu, X.; Wang, T.; Gao, K.; Meng, X.; Xu, Q.; Song, C.; Zhu, Z.; Zheng, H.; Hao, Y.; Xuan, Y. Ca- and Ga-Doped LaMnO3 for Solar Thermochemical CO2 Splitting with High Fuel Yield and Cycle Stability. ACS Appl. Energy Mater. 2021, 4, 9000–9012. [Google Scholar] [CrossRef]
  38. Orfila, M.; Linares, M.; Molina, R.; Botas, J.; Sanz, R.; Marugán, J. Perovskite materials for hydrogen production by thermochemical water splitting. Int. J. Hdrogen Energy 2016, 41, 19329–19338. [Google Scholar] [CrossRef]
  39. Dey, S.; Naidu, B.S.; Rao, C.N.R. Beneficial effects of substituting trivalent ions in the B-site of La0.5Sr0.5Mn1−xAxO3 (A=Al, Ga, Sc) on the thermochemical generation of CO and H2 from CO2 and H2O. Dalton Trans. 2016, 45, 2430–2435. [Google Scholar] [CrossRef]
  40. Bork, A.H.; Kubicek, M.; Struzik, M.; Rupp, J.L.M. Perovskite La0.6Sr0.4Cr1−xCoxO3−δ solid solutions for solar-thermochemical fuel production: Strategies to lower the operation temperature. J. Mater. Chem. A 2015, 3, 15546–15557. [Google Scholar] [CrossRef]
  41. Wang, L.; Ma, T.; Dai, S.; Ren, T.; Chang, Z.; Dou, L.; Fua, M.; Li, X. Experimental study on the high performance of Zr doped LaCoO3 for solar thermochemical CO production. Chem. Eng. J. 2020, 389, 124426. [Google Scholar] [CrossRef]
  42. Takalkar, G.; Bhosale, R.; AlMomani, F. Combustion synthesized A0.5Sr0.5MnO3-δ perovskites (where, A = La, Nd, Sm, Gd, Tb, Pr, Dy, and Y) as redox materials for thermochemical splitting of CO2. Appl. Surf. Sci. 2019, 489, 80–91. [Google Scholar] [CrossRef]
  43. Takalkar, G.; Bhosale, R.R. Solar thermocatalytic conversion of CO2 using PrxSr(1−x)MnO3−δ perovskite. Fuel 2019, 254, 115624. [Google Scholar] [CrossRef]
  44. Takalkar, G.; Bhosale, R.R.; AlMomani, F.; Kumar, A.; Banu, A.; Ashok, A.; Rashid, S.; Khraisheh, M.; Shakoor, A.; al Ashraf, A. Thermochemical splitting of CO2 using solution combustion synthesized LaMO3 (where, M = Co, Fe, Mn, Ni, Al, Cr, Sr). Appl. Surf. Sci. 2020, 509, 144908. [Google Scholar] [CrossRef]
  45. Luciani, G.; Landi, G.; Aronne, A.; Di Benedetto, A. Partial substitution of B cation in La0.6Sr0.4MnO3 perovskites: A promising strategy to improve the redox properties useful for solar thermochemical water and carbon dioxide splitting. Sol. Energy 2018, 171, 1–7. [Google Scholar] [CrossRef]
  46. Gokon, N.; Hara, K.; Ito, N.; Sawaguri, H.; Bellan, S.; Kodama, T.; Cho, H. Thermochemical H2O splitting using LaSrMnCrO3 of perovskite oxides for solar hydrogen production. AIP Conf. Proc. 2020, 2303, 170007. [Google Scholar]
  47. Sawaguri, H.; Gokon, N.; Ito, N.; Bellan, S.; Kodama, T.; Cho, H. Thermochemical Two-Step CO2 Splitting Using La0.7Sr0.3Mn0.9Cr0.1O3 of Perovskite Oxide for Solar Fuel Production. AIP Conf. Proc. 2020, 2303, 170013. [Google Scholar]
  48. Nair, M.M.; Abanades, S. Insights into the redox performance of non-stoichiometric lanthanum manganite perovskites for solar thermochemical CO2 splitting. ChemistrySelect 2016, 1, 4449–4457. [Google Scholar] [CrossRef]
  49. Budama, V.K.; Duarte, J.P.R.; Roeb, M.; Sattler, C. Potential of solar thermochemical water-splitting cycles: A review. Sol. Energy 2023, 249, 353–366. [Google Scholar] [CrossRef]
  50. Haeussler, A.; Julbe, A.; Abanades, S. Investigation of reactive perovskite materials for solar fuel production via two-step redox cycles: Thermochemical activity, thermodynamic properties and reduction kinetics. Mater. Chem. Phys. 2022, 276, 125358. [Google Scholar] [CrossRef]
  51. Eujin, J.; Bare, Z.J.L.; Morelock, R.J.; Rodriguez, M.A.; Ambrosini, A.; Musgrave, C.B.; McDaniel, A.H.; Coker, E.N. Computationally Accelerated Discovery and Experimental Demonstration of Gd0.5La0.5Co0.5Fe0.5O3 for Solar Thermochemical Hydrogen Production. Front. Energy Res. 2021, 9, 750600. [Google Scholar]
  52. Bayon, A.; de la Calle, A.; Ghose, K.K.; Page, A.; McNaughton, R. Experimental, computational and thermodynamic studies in perovskites metal oxides for thermochemical fuel production: A review. Int. J. Hdrogen Energy 2020, 45, 12653–12679. [Google Scholar] [CrossRef]
  53. Sawaguri, H.; Gokon, N.; Hayashi, K.; Iwamura, Y.; Yasuhara, D. Two-Step Thermochemical CO2 Splitting Using Partially-Substituted Perovskite Oxides of La0.7Sr0.3Mn0.9X0.1O3 for Solar Fuel Production. Front. Energy Res. 2022, 10, 872959. [Google Scholar] [CrossRef]
  54. Pechini, M.P. Method of Preparing Lead and Alkaline Earth Titanates and Niobates and Coating Method Using the Same to Form a Capacitor. US Patent 3,3306,97, 11 July 1967. [Google Scholar]
  55. Shirley, D.A. High-Resolution X-Ray Photoemission Spectrum of the Valence Bands of Gold. Phys. Rev. B 1972, 5, 4709–4714. [Google Scholar] [CrossRef]
  56. Press, W.H.; Teukolsky, S.A. Savitzky-Golay Smoothing Filters. Comput. Phys. 1990, 4, 669. [Google Scholar] [CrossRef]
  57. Shannon, R.D.; Prewitt, C.T. Effective Ionic Radii in Oxides and Fluorides. Acta Crystallogr. Sect. B 1969, 25, 925–946. [Google Scholar] [CrossRef]
  58. Biesinger, M.C.; Paynec, B.P.; Grosvenor, A.P.; Lau, L.W.M.; Gerson, A.R.; Smart, R.S.C. Resolving surface chemical states in XPS analysis of first row transition metals, oxides and hydroxides: Cr, Mn, Fe, Co and Ni. Appl. Surf. Sci. 2011, 257, 2717–2730. [Google Scholar] [CrossRef]
  59. Dupin, C.; Gonbeau, D.; Benqlilou-Moudden, H.; Vinatier, P.; Levasseur, A. XPS analysis of new lithium cobalt oxide thin-films before andafter lithium deintercalation. Thin Solid Film. 2001, 384, 23–32. [Google Scholar] [CrossRef]
  60. Zhang, B.; Chang, A.; Zhao, Q.; Ye, H.; Wu, Y. Synthesis and Thermoelectric Properties of Yb-doped Ca0.9−xYbxLa0.1MnO3 Ceramics. J. Electr. Mater. 2014, 43, 4048–4055. [Google Scholar] [CrossRef]
  61. Xia, W.; Leng, K.; Tang, Q.; Yang, L.; Xie, Y.; Wu, Z.; Yi, K.; Zhu, X. Structural characterization, magnetic and optical properties of perovskite (La1−xLnx)0.67Ca0.33MnO3 (Ln = Nd and Sm; x = 0.0–0.5) nanoparticles synthesized via the sol-gel process. J. Alloys Compd. 2021, 867, 158808. [Google Scholar] [CrossRef]
  62. Ilango, P.R.; Prasanna, K.; Do, S.J.; Jo, Y.N.; Lee, C.W. Eco-friendly nitrogen-containing carbon encapsulated LiMn2O4 cathodes to enhance the electrochemical properties in rechargeable Li-ion batteries. Sci. Rep. 2016, 6, 29826. [Google Scholar] [CrossRef]
  63. Cao, K.; Cao, E.; Zhang, Y.; Hao, W.; Sun, L.; Peng, H. The influence of nonstoichiometry on electrical transport and ethanol sensing characteristics for nanocrystalline LaFexO3−δ sensors. Sens. Actuators B 2016, 230, 592–599. [Google Scholar] [CrossRef]
  64. Cedervall, J.; Ivanov, S.A.; Lewin, E.; Beran, P.; Andersson, M.S.; Faske, T.; Bazuev, G.V.; Nordblad, P.; Sahlberg, M.; Mathieu, R. On the structural and magnetic properties of the double perovskite Nd2NiMnO6. J. Mater. Sci. Mater. Electron. 2019, 30, 16571–16578. [Google Scholar] [CrossRef]
  65. Xiong, D.; Li, W.; Liu, L. Vertically Aligned Porous Nickel(II) Hydroxide Nanosheets Supported on Carbon Paper with Long-Term Oxygen Evolution Performance. Chem. Asian J. 2017, 12, 543–551. [Google Scholar] [CrossRef]
  66. Wang, Z.; You, Y.; Yuan, J.; Yin, Y.; Li, Y.; Xin, S.; Zhang, D. Nickel-Doped La0.8Sr0.2Mn1−xNixO3 Nanoparticles Containing Abundant Oxygen Vacancies as an Optimized Bifunctional Catalyst for Oxygen Cathode in Rechargeable Lithium—Air Batteries. ACS Appl. Mater. Interfaces 2016, 8, 6520–6528. [Google Scholar] [CrossRef]
  67. Gal, A.L.; Vallès, M.; Julbe, A.; Abanades, S. Thermochemical Properties of High Entropy Oxides Used as Redox-Active Materials in Two-Step Solar Fuel Production Cycles. Catalysts 2022, 12, 1116. [Google Scholar] [CrossRef]
  68. Gao, K.; Liu, X.; Jiang, Z.; Zheng, H.; Song, C.; Wang, X.; Tian, C.; Dang, C.; Sun, N.; Xuan, Y. Direct solar thermochemical CO2 splitting based on Ca- and Al- doped SmMnO3 perovskites: Ultrahigh CO yield within small temperature swing. Renew. Energy 2022, 194, 482–494. [Google Scholar] [CrossRef]
  69. Gao, K.; Liu, X.; Wang, Q.; Jiang, Z.; Tian, C.; Sun, N.; Xuan, Y. Remarkable solar thermochemical CO2 splitting performances based on Ce- and Al-doped SrMnO3 perovskites. Sustain. Energy Fuels 2023, 7, 1027–1040. [Google Scholar] [CrossRef]
  70. Gao, K.; Liu, X.; Wang, T.; Zhu, Z.; Li, P.; Zheng, H.; Song, C.; Xuan, Y.; Li, Y.; Ding, Y. Sr-doped SmMnO3 perovskites for high-performance near-isothermal solar thermochemical CO2-to-fuel conversion. Sustain. Energy Fuels 2021, 5, 4295–4310. [Google Scholar] [CrossRef]
Figure 1. XRD patterns of as-prepared (a) Mg-, (b) Co-, (c) Ni-substituted LSMs. The solid circles, open squares, and open triangles in the XRD pattern correspond to peak positions of R-3c(167) of crystalline phase, I4/mmm(139) of La0.5Sr1.5MnO4 (byproduct), and P63/mmc(194) of La2O3 phase (byproduct) in the reference, respectively. (d) Cell volume of crystalline phase R-3c(167) estimated from the Rietveld refinement.
Processes 11 02717 g001
Figure 2. Average O2 or CO productivities and CO/O2 ratio of (a) Mg-, (b) Co-, (c) Ni-substituted LSMs during the 1st-3rd runs of the two-step thermochemical CO2 splitting redox tests.
Processes 11 02717 g002
Figure 3. O2 production profiles of (a) Mg-, (b) Co-, (c) Ni-substituted LSMs during the TR step in the 1st–3rd runs of the two-step thermochemical CO2 splitting redox tests. Orange dotted line corresponds to temperature profiles of samples.
Processes 11 02717 g003
Figure 4. CO production profiles of (a) Mg-, (b) Co-, (c) Ni-substituted LSMs during the subsequent CS step in the 1st–3rd runs of the two-step thermochemical CO2 splitting redox tests. Orange dotted line corresponds to temperature profiles of samples.
Processes 11 02717 g004
Figure 5. Thermal durability and stability of redox materials for long-term continuous cycling: productivities and CO/O2 ratio of (a) LSMCo0.35 and (b) LSMNi0.20 samples; production rates and temperature variations of (c) LSMCo0.35 and (d) LSMNi0.20 samples.
Processes 11 02717 g005
Figure 6. XRD patterns of as-prepared (a) LSMCo0.35 and (b) LSMNi0.20 samples, and the samples obtained after the continuous test. The blue and red vertical bars below the XRD pattern corresponded to peak positions of sample and crystalline phase in the reference, respectively. The signal pattern of dark red represented the relative difference in intensity between the sample and reference in the Rietveld refinement.
Processes 11 02717 g006
Figure 7. Secondary electron image (SEI) micrograph of (ac) as-prepared LSMCo0.35 sample with magnifications of 2000, 5000, and 10,000; (d,e) the sample obtained after the long-term continuous test with magnifications of 2000 and 5000; (f,g) as-prepared LSMNi0.20 sample with magnifications of 2000 and 5000; (h,i) the sample obtained after the long-term continuous test with magnifications of 2000 and 5000.
Processes 11 02717 g007
Figure 8. TGA profiles of La1−xSrxMn0.8Ni0.2O3. TR step was performed at 1400 °C for 90 min. Subsequently, the CS step was performed at 1000 °C for 30 min.
Processes 11 02717 g008
Figure 9. Relationship between the average productivities of O2 and CO and the fraction of Sr substitution (x) of La1−xSrxMn0.8Ni0.2O3. The ratio of CO/O2 was calculated and plotted in the figure in order to evaluate stoichiometry of thermochemical cycling.
Processes 11 02717 g009
Figure 10. (a) La 3d3/2 and (b) Mn 2p3/2 X-ray photoelectron spectra with peak deconvolutions of the non-substituted LSM, thermally reduced sample obtained after the TR step, and the oxidized sample obtained after the subsequent CS step of thermochemical cycling. Red broken lines and black continuous lines are sum of peak fitting and measured XPS spectra, respectively.
Processes 11 02717 g010aProcesses 11 02717 g010b
Figure 11. (a) Co 2p3/2 and (b) Mn 2p3/2 X-ray photoelectron spectra with peak deconvolutions of the as-prepared LSMCo0.35, thermally reduced sample obtained after the TR step, and the oxidized sample obtained after the subsequent CS step of thermochemical cycling. Red broken lines and black continuous lines are sum of peak fitting and measured XPS spectra, respectively.
Processes 11 02717 g011
Figure 12. (a) La 3d3/2 and Ni 2p3/2, and (b) Mn 2p3/2 X-ray photoelectron spectra with peak deconvolutions of the as-prepared LSMNi0.20, thermally reduced sample obtained after the TR step, and the oxidized sample obtained after the subsequent CS step of thermochemical cycling. Red broken lines and black continuous lines are sum of peak fitting and measured XPS spectra, respectively.
Processes 11 02717 g012
Figure 13. Comparison of CO productivities between the samples of LSMMg0.125, LSMNi0.20, and LSMCo0.35 in the present study and the previous data cited in the literature. All data of CO productivities were plotted against cycle-averaged CO production rate: (a) CO2-to-CO conversion and (b) CO productivity. Data sources: La0.7Sr0.3Mn0.9Mg0.1O3 (LSMMg0.10), La0.7Sr0.3Mn0.9Ni0.1O3 (LSMNi0.10), La0.7Sr0.3Mn0.9Co0.1O3 (LSMCo0.10), and La0.7Sr0.3MnO3, Sawaguri et al. [53]; La0.5Sr0.5Mn0.95Sc0.05O3 and La0.5Sr0.5Mn0.75Ga0.25O3, Dey et al. [39]; La0.65Sr0.35MnO3 and La0.5Sr0.5MnO3, La0.6Sr0.4Mn0.5Co0.5O3, and LaMn0.5Ni0.5O3, Nair et al. [29]; La0.7Sr0.3Mn0.9Cr0.1O3, Sawaguri et al. [47]; LaCo0.7Zr0.3O3,Wang et al. [41]; La0.7Sr0.3MnO3, La0.7Sr0.3MnO3, La0.6Sr0.4MnO3, and La0.3Sr0.7MnO3, Takalkar et al. [33]; La0.6Sr0.4FeO3, La0.6Sr0.4MnO3, and La0.6Sr0.4Mn0.8Fe0.2O3, Luciani et al. [45], La0.5Sr0.5Mn0.83Mg0.17O3 and La0.5Sr0.5Mn0.75Al0.25O3, Demont et al. [31]; La0.5Sr0.5Mn0.9Mg0.1O3, Jouannaux et al. [32]; La0.6Sr0.4Mn0.6Al0.4O3, McDaniel et al. [36]; (La0.8Sr0.2) (Mn0.2Fe0.2Co0.4Al0.2)O3 and (La0.5Sr0.5)Mn0.9Mg0.1O3, Le Gal et al. [67].
Processes 11 02717 g013
Table 1. Comparison of redox performances for the perovskites related to the present study. O2 and CO productivities, reaction conditions, and equipment are summarized.
MaterialSynthesis MethodReactorRun No.Reduction Temp. [°C]Reduction Duration [min]Average O2 Productivity [μmol/g]Partial Pressure of CO2 (Steam) [ber]CS (WS) Temp. [°C]CS (WS) Duration [min]Average CO (H2) Productivity [μmol/g]CO(H2)/O2 Ratio [-]Reference
La0.5Sr0.5MnO3PechiniTGA41400901430.51200602481.73[53]
La0.7Sr0.3Mn0.9Mg0.1O3PechiniTGA41400901970.51200603541.8[53]
La0.7Sr0.3Mn0.9Co0.1O3PechiniTGA41400901840.51200603471.89[53]
La0.7Sr0.3Mn0.9Ni0.1O3PechiniTGA41400901880.51200603511.87[53]
La0.7Sr0.3Mn0.9Cr0.1O3PechiniFixed bed31350300−0.84−1200−50−129−0.15[21]
La0.7Sr0.3Mn0.9Cr0.1O3PechiniFixed bed31350309811200502152.19[47]
La0.5Sr0.5Mn0.83Mg0.17O3Solid-stateTGA21400451700.51050602081.22[31]
La0.6Sr0.4Al0.6Mn0.4O3PechiniTGA1135045600.4100060286-[36]
La0.5Sr0.5Mn0.95Sc0.05O3PechiniTGA31400453230.41100455061.57[39]
La0.5Sr0.5Mn0.75Ga0.25O3PechiniTGA31400452640.41100454601.74[39]
La0.5Sr0.5Mn0.9Mg0.1O3PechiniTGA21400451900.51050602151.13[32]
La0.5Sr0.5Mn0.6Al0.4O3PechiniTGA21400451290.51050602051.59[32]
La0.6Sr0.4Co0.8Cr0.2O3PechiniTGA31200--0.580060169-[40]
La0.6Sr0.4Co0.8Cr0.2O3PechiniTGA31200--0.580060-50-[40]
La0.5Ca0.5Mn0.8Ga0.2O3PechiniTGA21400452310.51050602080.9[37]
Table 2. Abbreviation, chemical composition, lattice parameter, space group, and crystal system of refined structures of samples prepared in this study.
NameChemical CompositionLattice Parameters [Å]Space GroupCrystal System
abc
LSMLa0.7Sr0.3MnO35.508(2)5.508(2)13.368(2)R-3c(167)trigonal
LSMMg0.05La0.67Sr0.28Mn0.95Mg0.05O35.490(9)5.490(9)13.379(5)R-3c(167)trigonal
La0.5Sr1.5MnO43.865(7)3.865(7)12.348(3)I4/mmm(139)tetragonal
La2O33.932(6)3.932(6)6.122(3)P63/mmc(194)hexagonal
LSMMg0.10La0.7Sr0.3Mn0.90Mg0.10O35.499(7)5.499(7)13.345(3)R-3c(167)trigonal
LSMMg0.125La0.7Sr0.3Mn0.875Mg0.125O35.502(5)5.502(5)13.358(6)R-3c(167)trigonal
LSMMg0.15La0.7Sr0.3Mn0.85Mg0.15O35.525(2)5.525(2)13.347(9)R-3c(167)trigonal
LSMCo0.05La0.7Sr0.3Mn0.95Co0.05O35.507(0)5.507(0)13.359(2)R-3c(167)trigonal
LSMCo0.10La0.7Sr0.3Mn0.90Co0.10O35.504(4)5.504(4)13.348(3)R-3c(167)trigonal
LSMCo0.15La0.7Sr0.3Mn0.85Co0.15O35.501(6)5.501(6)13.339(3)R-3c(167)trigonal
LSMCo0.20La0.7Sr0.3Mn0.80Co0.20O35.494(7)5.494(7)13.323(3)R-3c(167)trigonal
LSMCo0.25La0.7Sr0.3Mn0.75Co0.25O35.499(5)5.499(5)13.334(4)R-3c(167)trigonal
LSMCo0.30La0.7Sr0.3Mn0.70Co0.30O35.486(3)5.486(3)13.308(9)R-3c(167)trigonal
LSMCo0.35La0.7Sr0.3Mn0.65Co0.35O35.479(9)5.479(9)13.295(7)R-3c(167)trigonal
LSMCo0.40La0.7Sr0.3Mn0.60Co0.40O35.474(2)5.474(2)13.282(7)R-3c(167)trigonal
LSMCo0.50La0.7Sr0.3Mn0.50Co0.50O35.466(3)5.466(3)13.267(3)R-3c(167)trigonal
LSMNi0.05La0.7Sr0.3Mn0.95Ni0.05O35.503(3)5.503(3)13.347(9)R-3c(167)trigonal
LSMNi0.10La0.7Sr0.3Mn0.90Ni0.10O35.497(6)5.497(6)13.337(4)R-3c(167)trigonal
LSMNi0.15La0.7Sr0.3Mn0.85Ni0.15O35.492(8)5.492(8)13.325(7)R-3c(167)trigonal
LSMNi0.20La0.7Sr0.3Mn0.80Ni0.20O35.485(0)5.485(0)13.307(9)R-3c(167)trigonal
LSMNi0.25La0.7Sr0.3Mn0.75Ni0.25O35.478(9)5.478(9)13.299(8)R-3c(167)trigonal
LSMNi0.30La0.7Sr0.3Mn0.70Ni0.30O35.475(5)5.475(5)13.289(8)R-3c(167)trigonal
Table 3. Space group and crystal structure of the as-prepared La1-xSrxMn0.8Ni0.2O3.
Main PhaseSecond PhaseThird Phase
La/Sr Fractions (x)Chemical CompositionSpace GroupCrystal StructureSpace GroupCrystal StructureSpace GroupCrystal Structure
0LaMn0.8Ni0.2O3R-3c(167)trigonal----
0.2La0.8Sr0.2Mn0.8Ni0.2O3R3m(160)trigonal----
0.3La0.7Sr0.3Mn0.8Ni0.2O3R-3c(167)trigonal----
0.4La0.6Sr0.4Mn0.8Ni0.2O3R-3c(167)trigonal----
0.6La0.4Sr0.6Mn0.8Ni0.2O3Pm-3m(221)cubic----
0.8La0.2Sr0.8Mn0.8Ni0.2O3Pm-3m(221)cubicI4/mmm(139)tetragonalFm-3m(225)cubic
Table 4. Space group and crystal structure of La1-xSrxMn0.8Ni0.2O3 obtained after the redox reactivity test.
Main PhaseSecondary Phase
La/Sr Fractions (x)Space GroupCrystal StructureSpace GroupCrystal Structure
0Pnma(62)orthorhombic--
0.2R3m(160)trigonal--
0.3R-3c(167)trigonal--
0.4R-3c(167)trigonal--
0.6R-3c(167)trigonalI4/mmm(139)tetragonal
0.8Pm-3m(221)cubicI4/mmm(139)tetragonal
Table 5. Peak position, ratio of peak area, and valance state of Mn for the as-prepared non-substituted LSM, thermally reduced sample obtained after the TR step, and the oxidized sample obtained after the subsequent CS step. The values were estimated from Mn 2p3/2 X-ray photoelectron spectra.
Peak Position [eV]Ratio of Peak Area [%]Valence State of Mn
SampleMn 2p3/2 (2+)Mn 2p3/2 (3+)Mn 2p3/2 (4+)Mn 2p3/2 (2+)Mn 2p3/2 (3+)Mn 2p3/2 (4+)
As preparation640.67641.8643.5342.231.726.12.84
After TR640.67641.79643.657.431.011.62.54
After CS640.63641.76643.6850.132.417.52.67
Table 6. Peak position, ratio of peak area, and valance state of Mn for the as-prepared LSMCo0.35, thermally reduced sample obtained after the TR step, and the oxidized sample obtained after the subsequent CS step. The values were estimated from Mn 2p3/2 X-ray photoelectron spectra.
Peak Position [eV]Ratio of Peak Area [%]Valence State of Mn
SampleMn 2p3/2 (2+)Mn 2p3/2 (3+)Mn 2p3/2 (4+)Mn 2p3/2 (2+)Mn 2p3/2 (3+)Mn 2p3/2 (4+)
As preparation640.5641.87643.551.226.822.12.71
After TR640.58642.24643.5858.415.825.82.67
After CS640.65641.9643.5621.465.113.52.92
Table 7. Peak position, ratio of peak area, and valance state of Co for the as-prepared LSMCo0.35, thermally reduced sample obtained after the TR step, and the oxidized sample obtained after the subsequent CS step. The values were estimated from Co 2p3/2 X-ray photoelectron spectra.
Peak Position [eV]Ratio of Peak Area [%]Valence State of Co
SampleCo 2p3/2 (2+)Co 2p3/2 (3+)Co 2p3/2 (4+)Co 2p3/2 (2+)Co 2p3/2 (3+)Co 2p3/2 (4+)
As preparation779.98778.99780.9828.750.620.72.92
After TR780.01778.98781.0421.658.220.22.99
After CS780.04779.02781.0031.653.315.02.83
Table 8. Peak position, ratio of peak area, and valance state of Ni for the as-prepared LSMNi0.20, thermally reduced sample obtained after the TR step, and the oxidized sample obtained after the subsequent CS step. The values were estimated from Ni 2p3/2 X-ray photoelectron spectra.
SamplePeak Position [eV]Ratio of Peak Area [%]Valence State of Ni
Ni 2p3/2 (2+)Ni 2p3/2 (3+)Ni 2p3/2 (2+)Ni 2p3/2 (3+)
As preparation853.98855.630.269.82.70
After TR853.95855.5749.250.82.51
After CS854.05855.5460.339.72.40
Table 9. Peak position, ratio of peak area, and valance state of Mn for the as-prepared LSMNi0.20, thermally reduced sample obtained after the TR step, and the oxidized sample obtained after the subsequent CS step. The values were estimated from Mn 2p3/2 X-ray photoelectron spectra.
SamplePeak Position [eV]Ratio of Peak Area [%]Valence State of Mn
Mn 2p3/2 (2+)Mn 2p3/2 (3+)Mn 2p3/2 (4+)Mn 2p3/2 (2+)Mn 2p3/2 (3+)Mn 2p3/2 (4+)
As preparation640.7642.05643.634.031.734.33.00
After TR640.7641.86643.646.226.325.42.73
After CS640.8642.02643.533.330.736.93.06
Disclaimer/Publisher’s Note: The statements, opinions and data contained in all publications are solely those of the individual author(s) and contributor(s) and not of MDPI and/or the editor(s). MDPI and/or the editor(s) disclaim responsibility for any injury to people or property resulting from any ideas, methods, instructions or products referred to in the content.

