


An Experimental Study on Temperature, Relative Humidity, and Concentrations of CO and CO2 during Different Cooking Procedures


Abstract
:1. Introduction
2. Materials and Methods
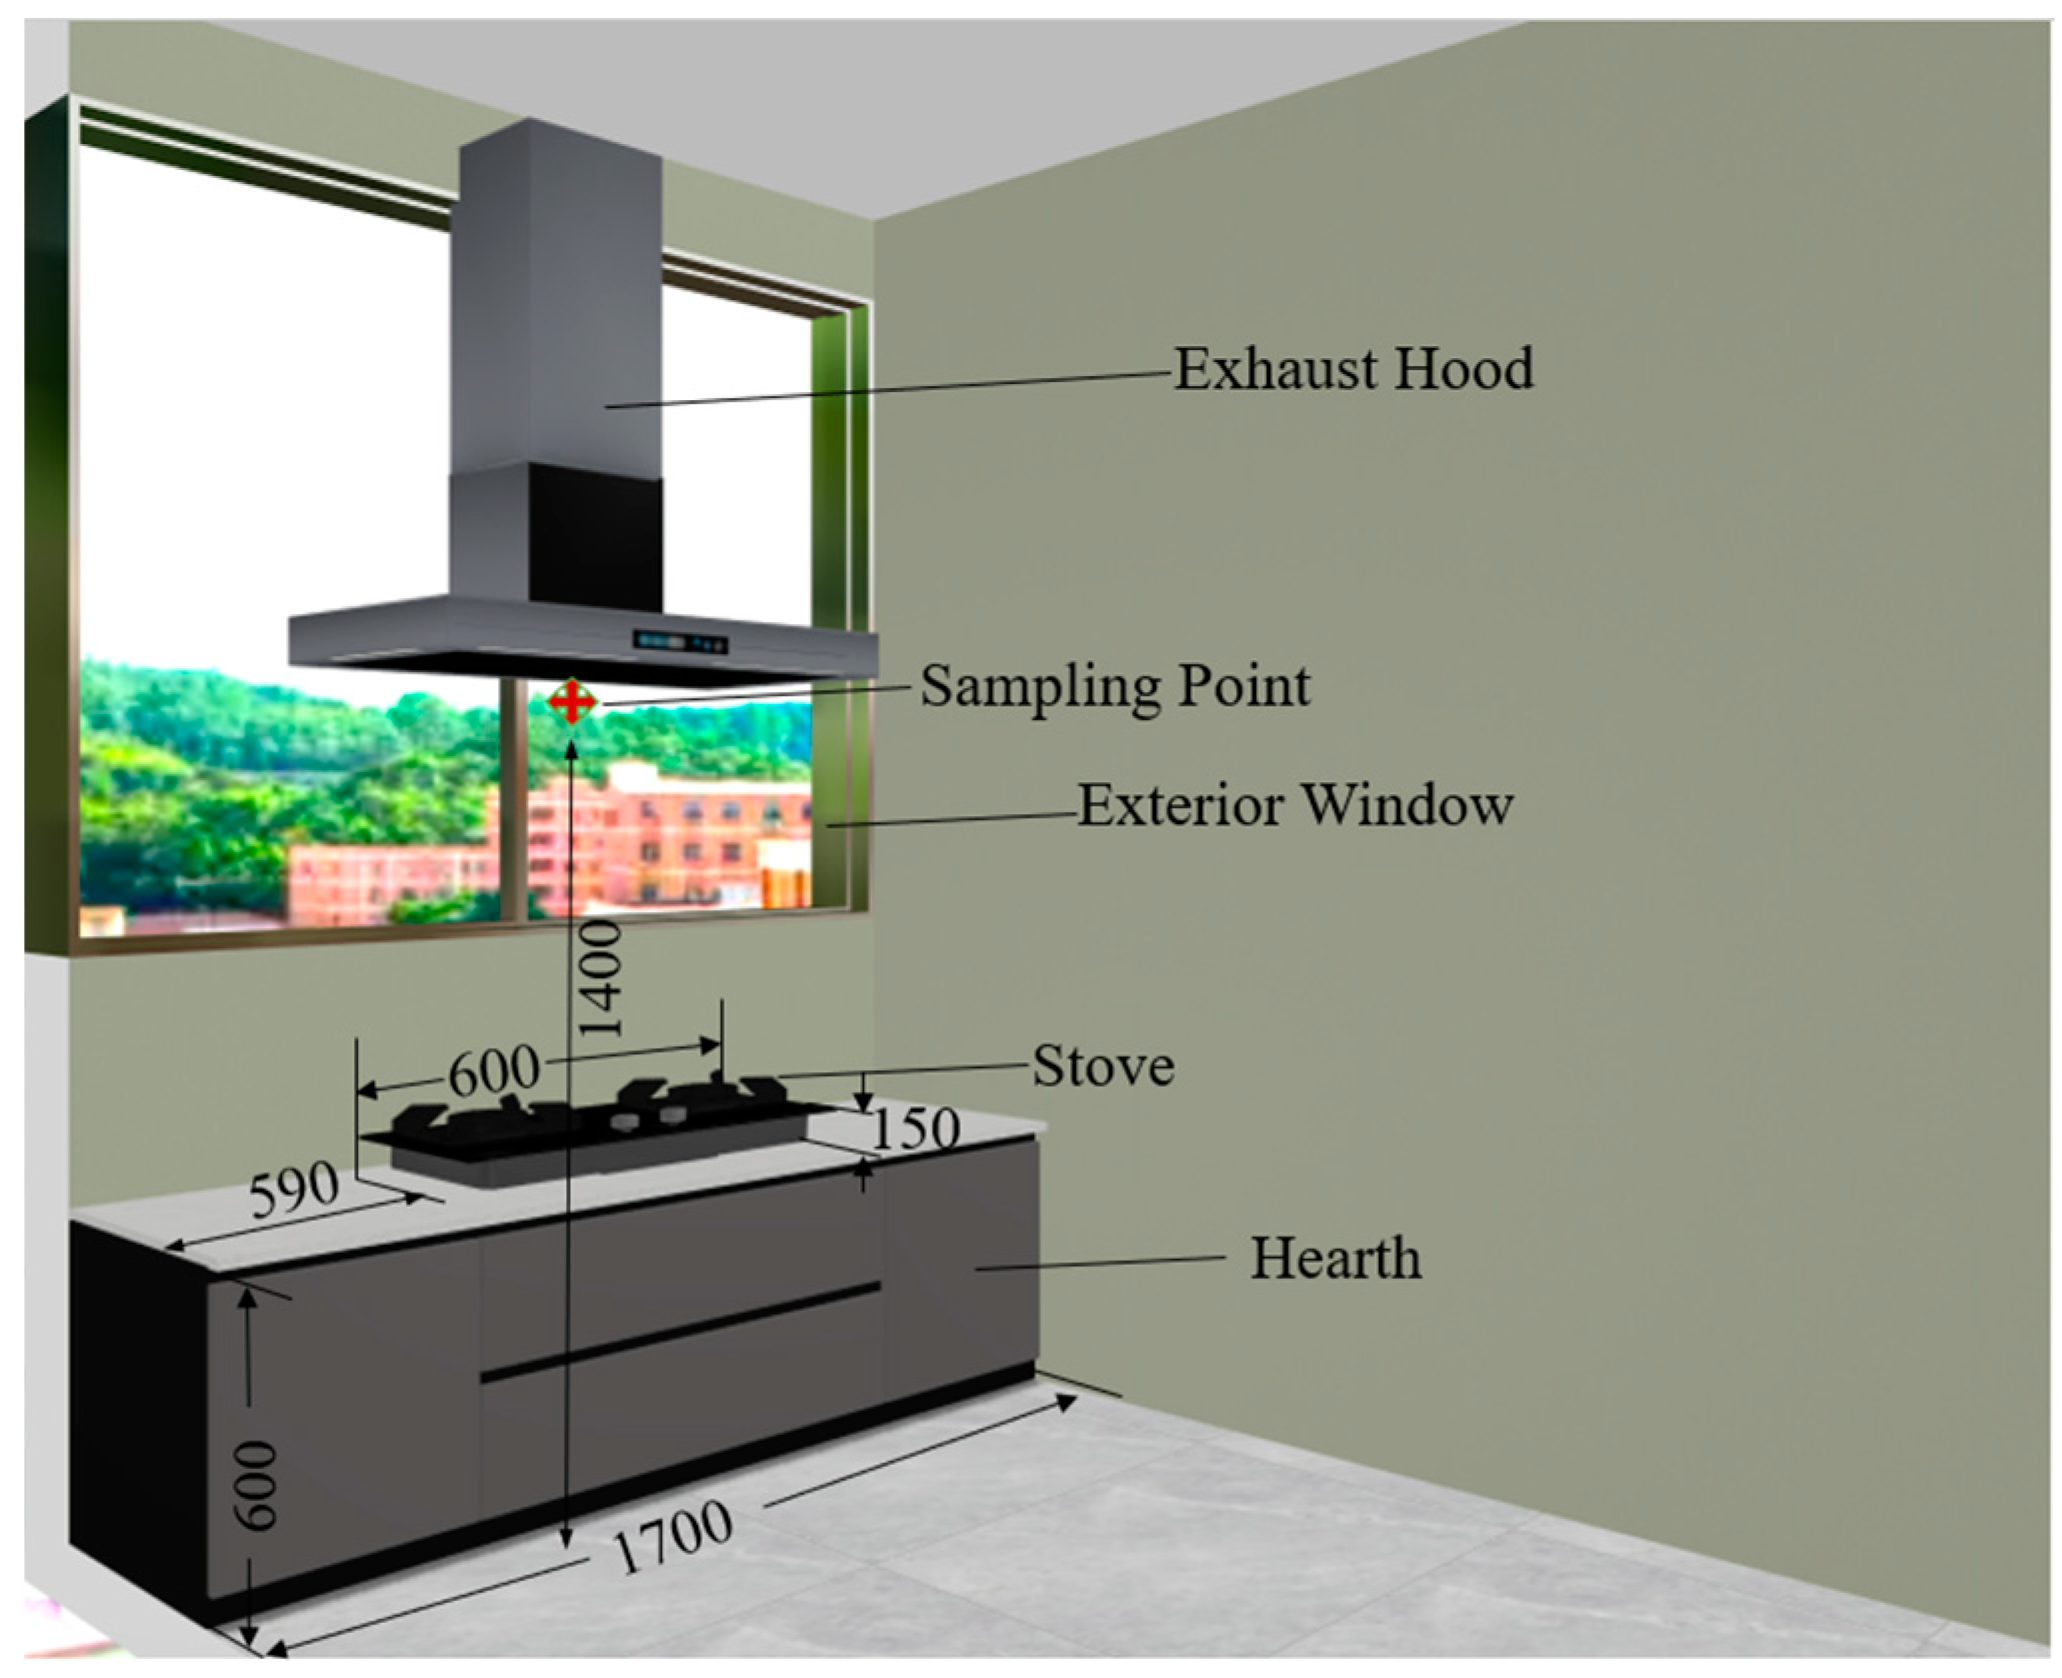
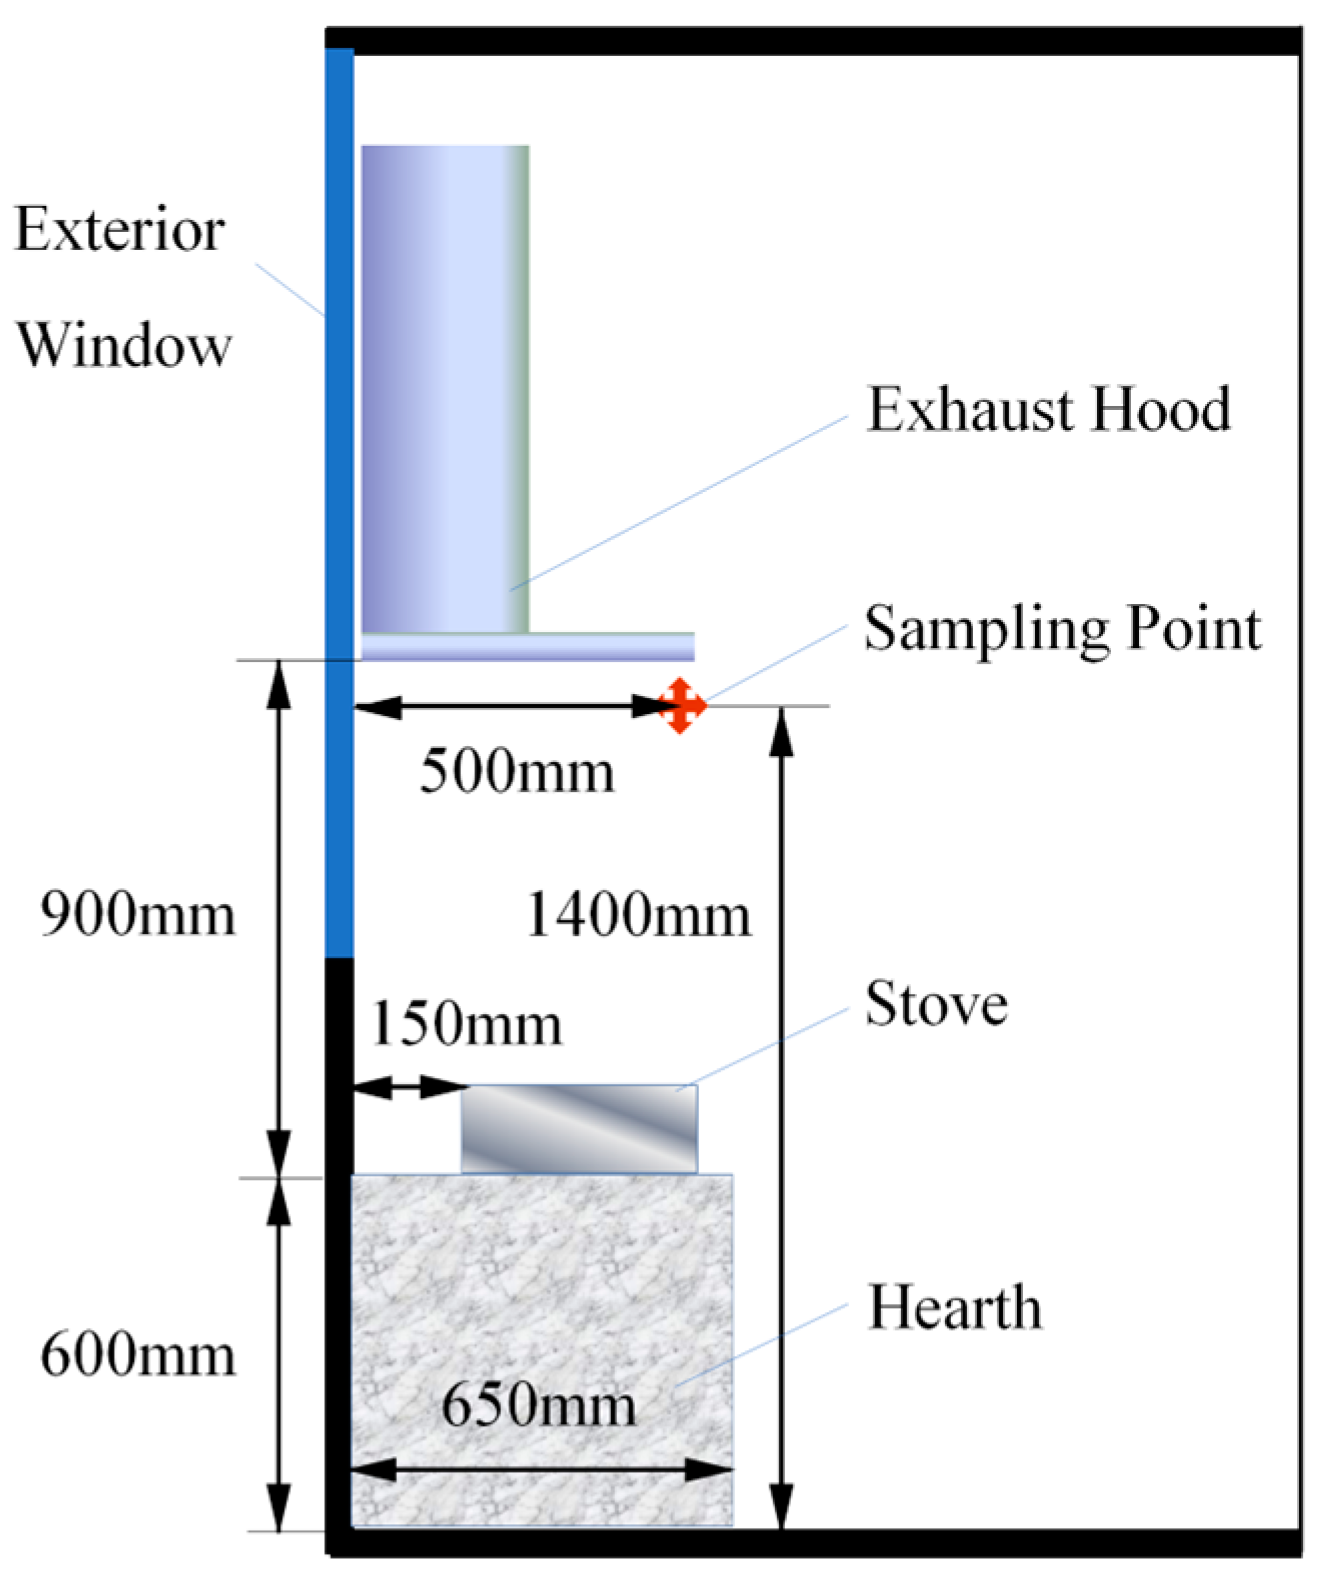
2.1. Site Description
2.2. Studied Cases
2.3. Apparatus and Parameters Measured
2.4. Procedure
3. Results and Discussion
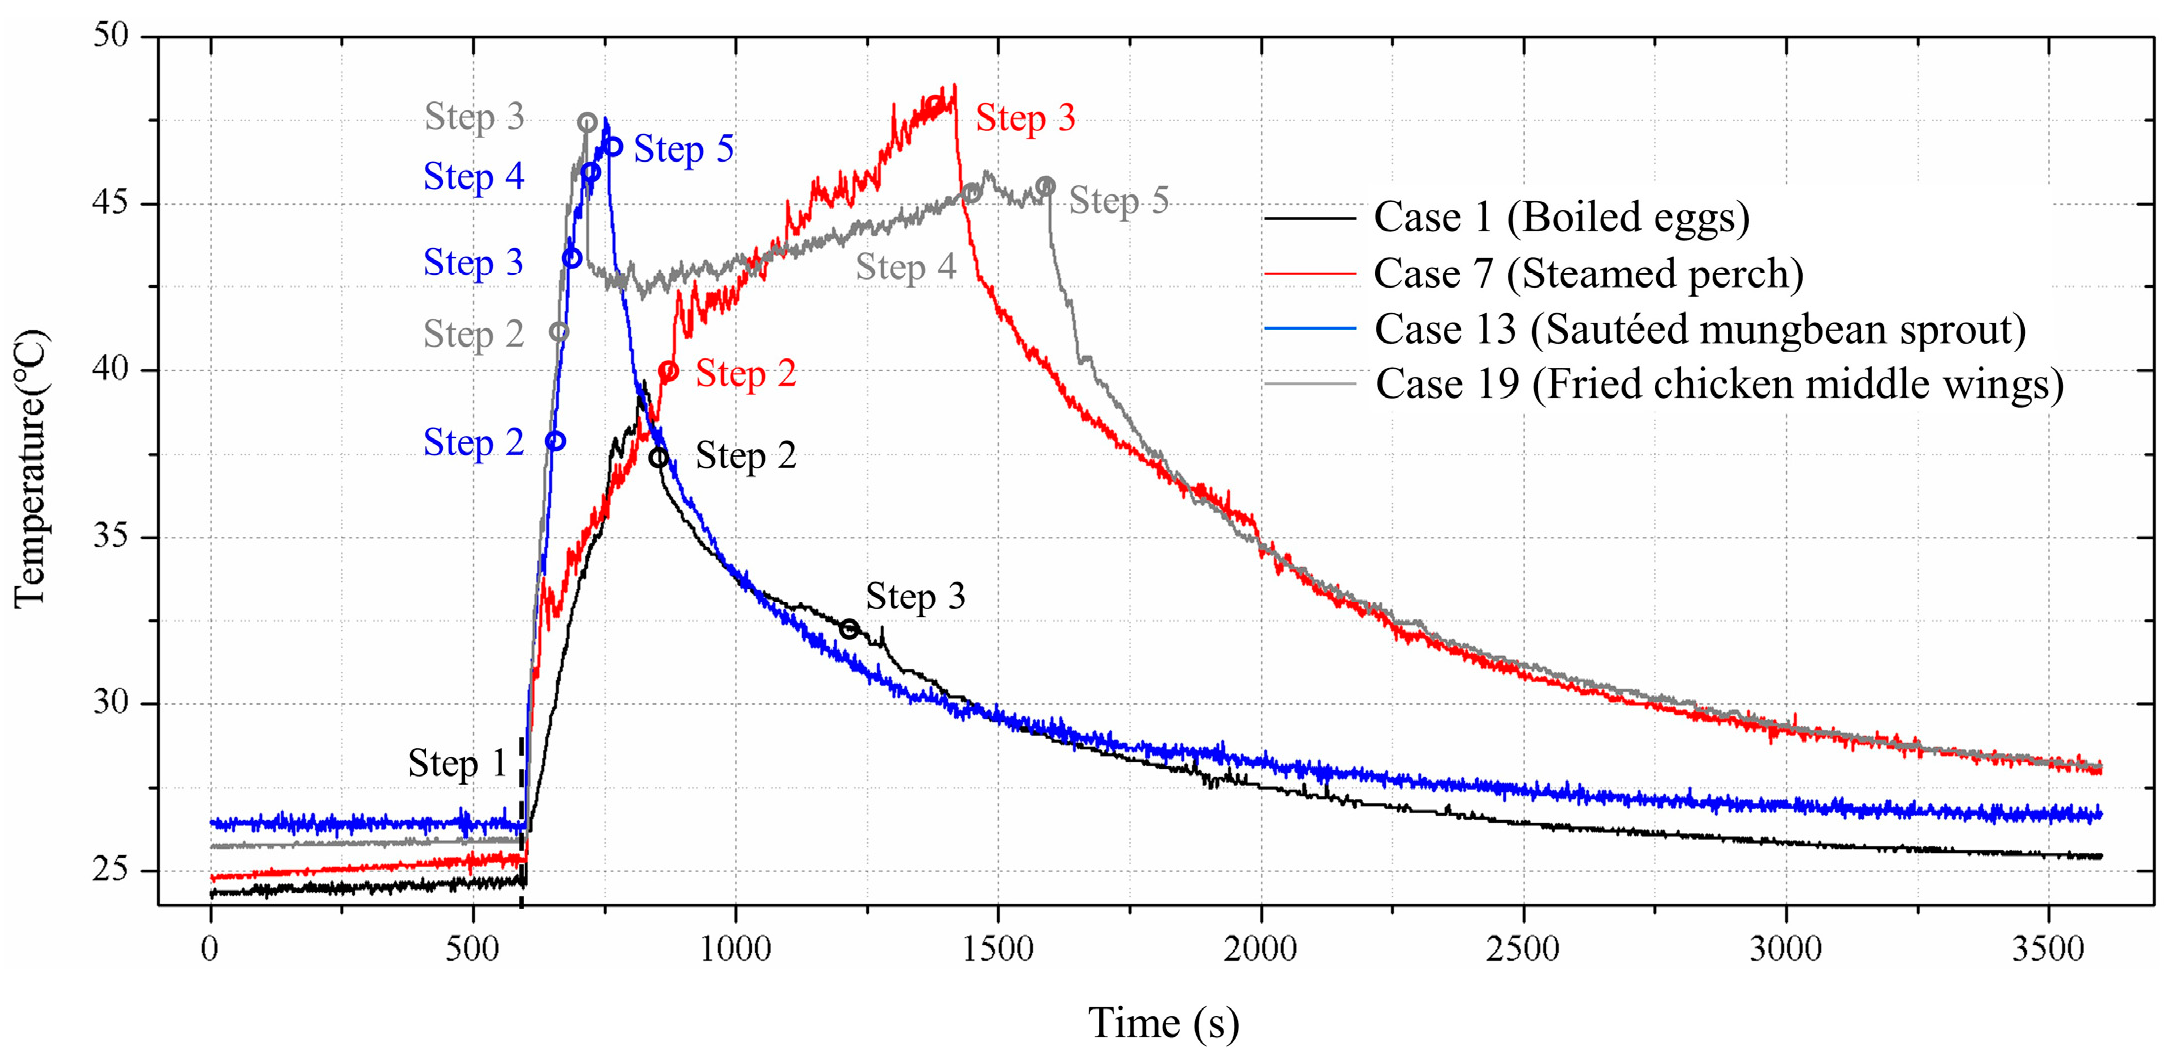
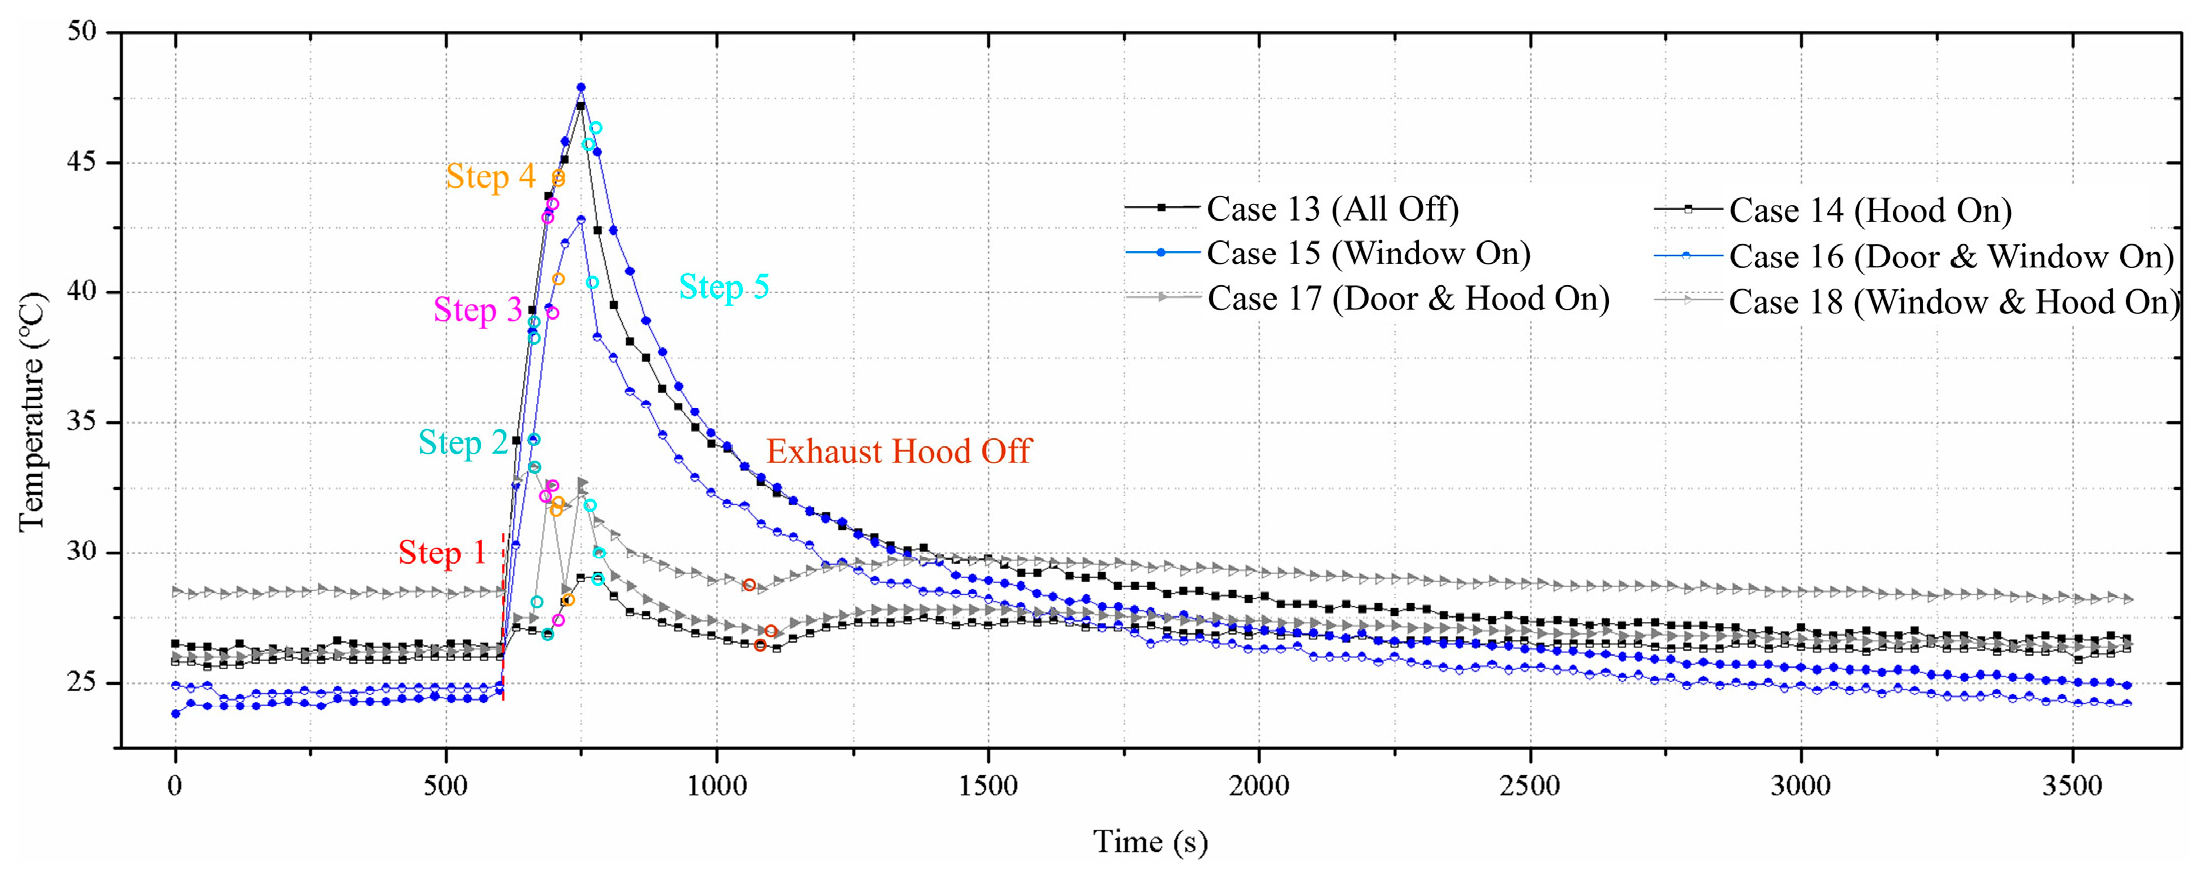
3.1. Temperature
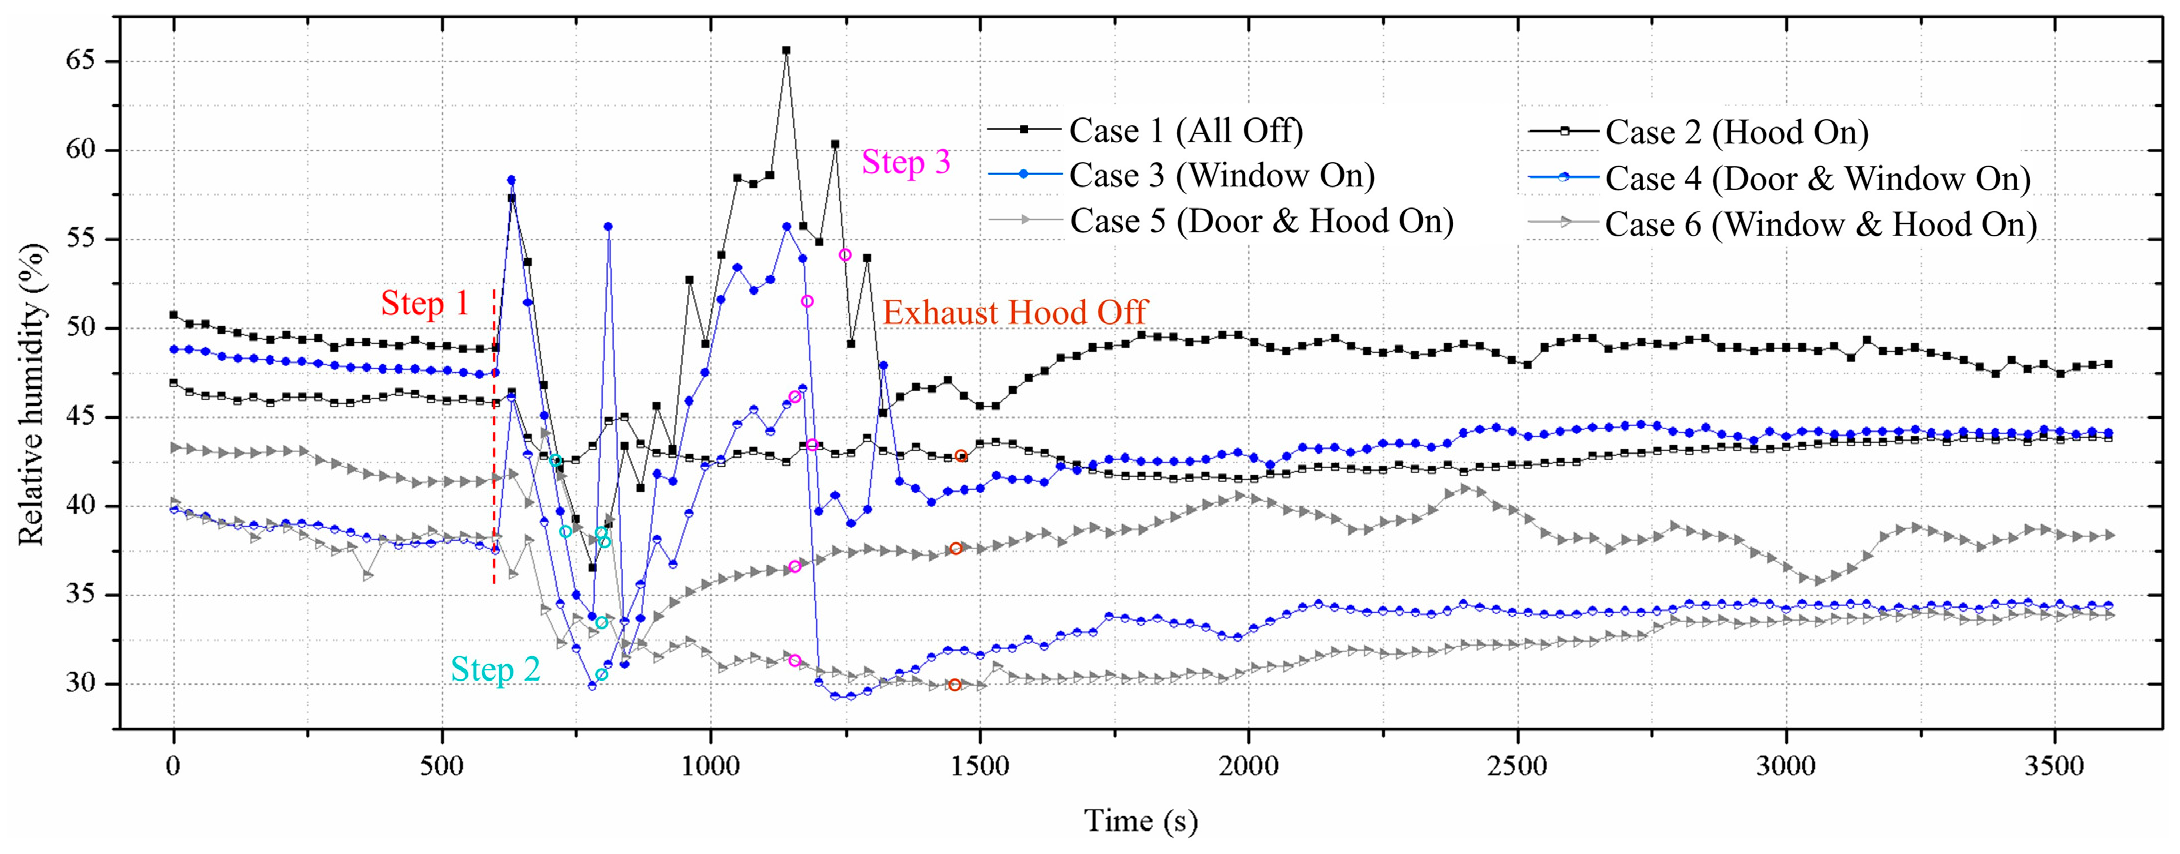
3.2. Relative Humidity
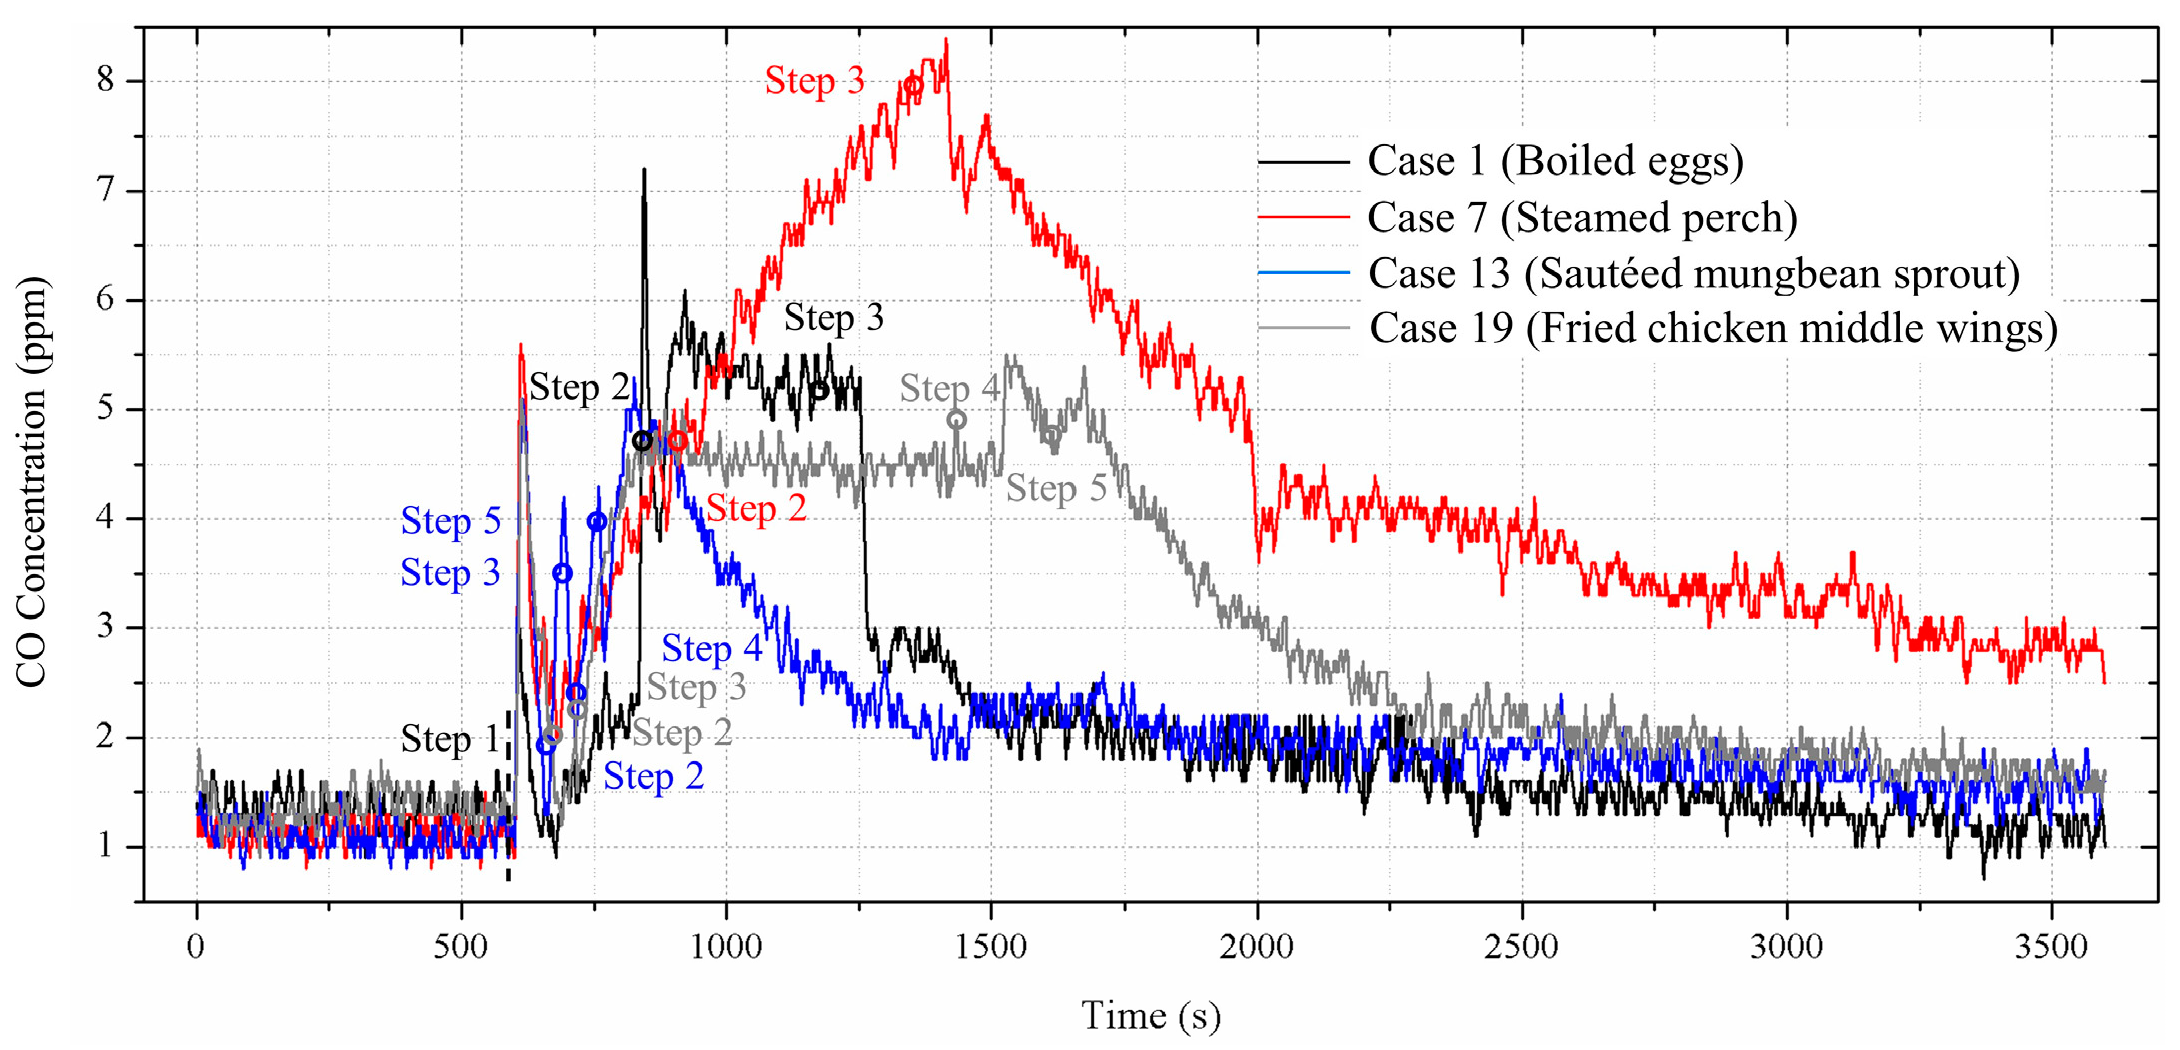
3.3. Concentration of Carbon Monoxide
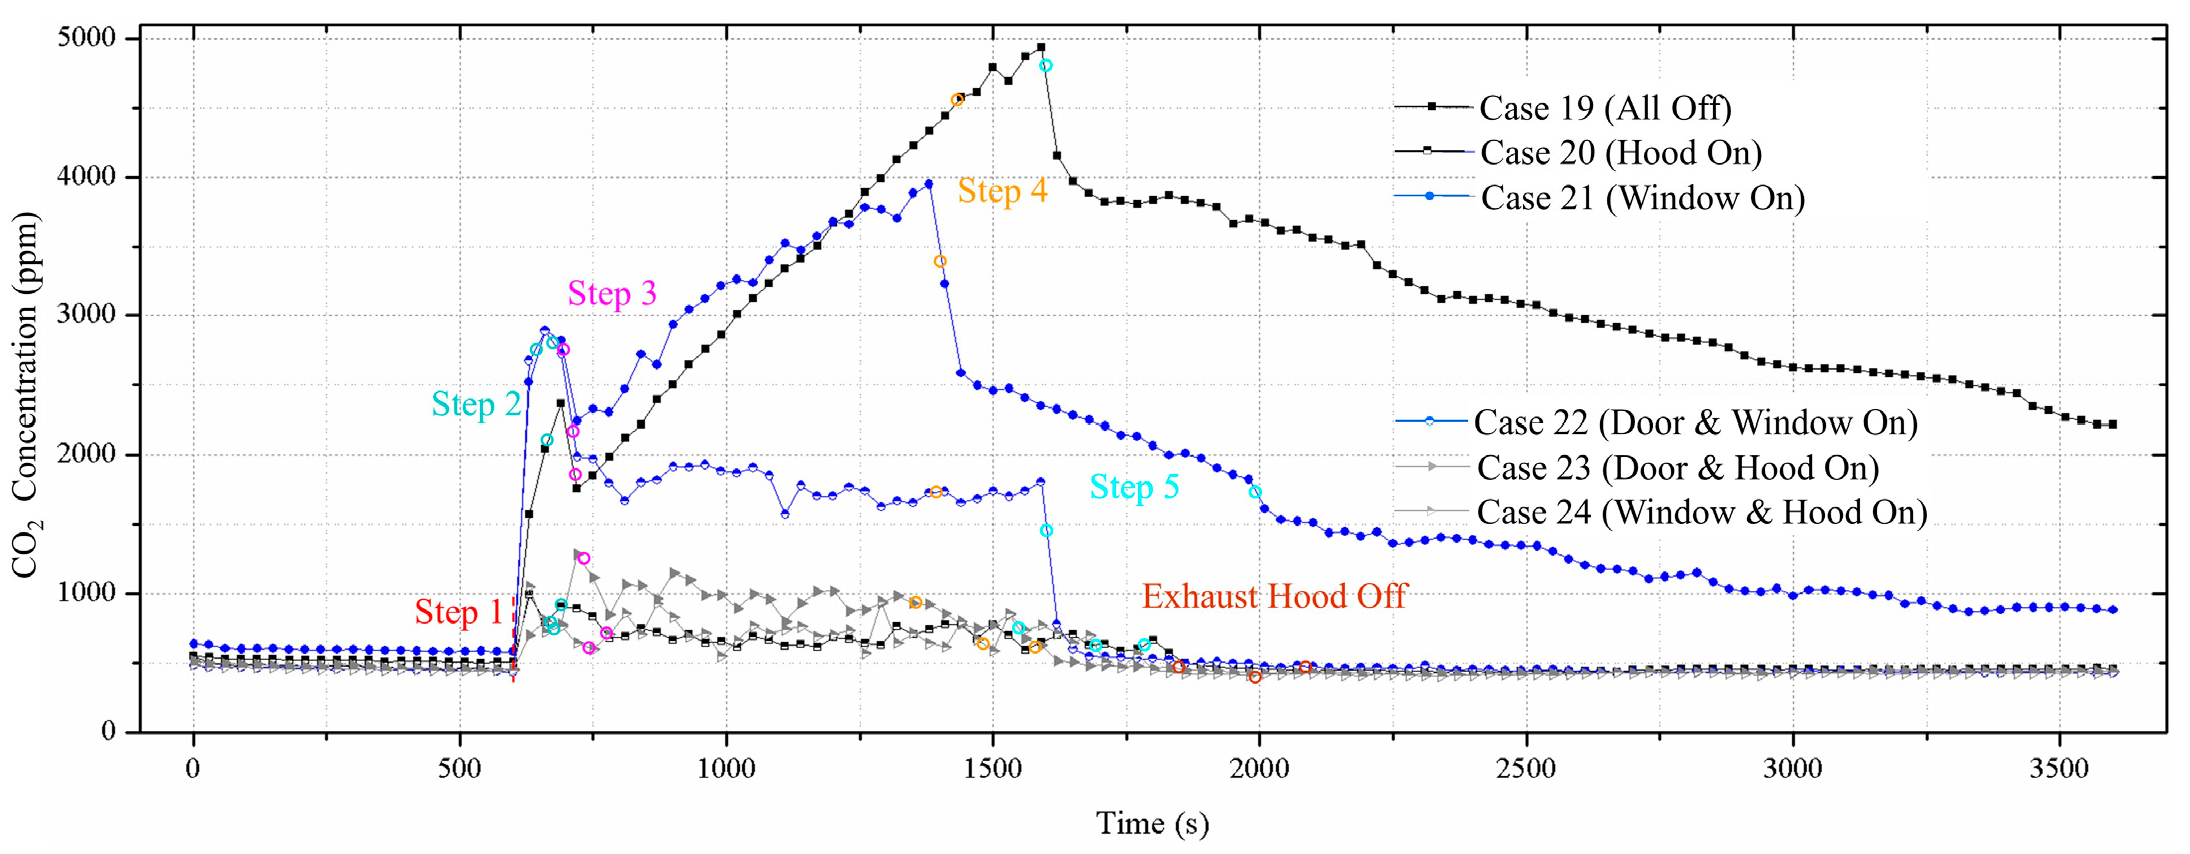
3.4. Concentration of Carbon Dioxide
4. Conclusions
Author Contributions
Funding
Data Availability Statement
Conflicts of Interest
References
- Lai, C. Assessment of side exhaust system for residential kitchens in Taiwan. Build. Serv. Eng. Res. Technol. 2005, 26, 157–166. [Google Scholar] [CrossRef]
- Vu, T.V.; Ondracek, J.; Zdímal, V.; Schwarz, J.; Delgado-Saborit, J.M.; Harrison, R.M. Physical properties and lung deposition of particles emitted from five major indoor sources. Air Qual. Atmos. Health 2016, 10, 1–14. [Google Scholar] [CrossRef]
- Chiang, C.; Lai, C.; Chou, P.; Li, Y. The influence of an architectural design alternative (transoms) on indoor air environment in conventional kitchens in Taiwan. Build. Environ. 2000, 35, 579–585. [Google Scholar] [CrossRef]
- Ryhl-Svendsen, M.; Clausen, G.; Chowdhury, Z.; Smith, K.R. Fine particles and carbon monoxide from wood burning in 17th–19th century Danish kitchens: Measurements at two reconstructed farm houses at the Lejre Historical–Archaeological Experimental Center. Atmos. Environ. 2010, 44, 735–744. [Google Scholar] [CrossRef]
- Singh, A.; Chandrasekharan Nair, K.; Kamal, R.; Bihari, V.; Gupta, M.K.; Mudiam, M.K.R.; Satyanarayana, G.N.V.; Raj, A.; Haq, I.; Shukla, N.K.; et al. Assessing hazardous risks of indoor airborne polycyclic aromatic hydrocarbons in the kitchen and its association with lung functions and urinary PAH metabolites in kitchen workers. Clin. Chim. Acta 2016, 452, 204–213. [Google Scholar] [CrossRef]
- Sidhu, M.K.; Ravindra, K.; Mor, S.; John, S. Household air pollution from various types of rural kitchens and its exposure assessment. Sci. Total Environ. 2017, 586, 419–429. [Google Scholar] [CrossRef] [PubMed]
- Amouei Torkmahalleh, M.; Naseri, M.; Nurzhan, S.; Gabdrashova, R.; Bekezhankyzy, Z.; Gimnkhan, A.; Malekipirbazari, M.; Jouzizadeh, M.; Tabesh, M.; Farrokhi, H.; et al. Human exposure to aerosol from indoor gas stove cooking and the resulting nervous system responses. Indoor Air 2022, 32, e12983. [Google Scholar] [CrossRef] [PubMed]
- Zhao, Y.; Li, A.; Gao, R.; Tao, P.; Shen, J. Measurement of temperature, relative humidity and concentrations of CO, CO2 and TVOC during cooking typical Chinese dishes. Energy Build. 2014, 69, 544–561. [Google Scholar] [CrossRef]
- Andrey, L. The Effect of Supply Air Systems on Kitchen Thermal Environment. Available online: https://www.researchgate.net/publication/242516657_The_Effect_of_Supply_Air_Systems_on_Kitchen_Thermal_Environment (accessed on 1 July 2023).
- Zhou, J.; Kim, C.N. Numerical Investigation of Indoor CO2 Concentration Distribution in an Apartment. Indoor Built Environ. 2010, 20, 91–100. [Google Scholar] [CrossRef]
- Liu, S.; Cao, Q.; Zhao, X.; Lu, Z.; Deng, Z.; Dong, J.; Lin, X.; Qing, K.; Zhang, W.; Chen, Q. Improving indoor air quality and thermal comfort in residential kitchens with a new ventilation system. Build. Environ. 2020, 180, 107016. [Google Scholar] [CrossRef]
- Liu, S.; Dong, J.; Cao, Q.; Zhou, X.; Li, J.; Lin, X.; Qing, K.; Zhang, W.; Chen, Q. Indoor thermal environment and air quality in Chinese-style residential kitchens. Indoor Air 2020, 30, 198–212. [Google Scholar] [CrossRef]
- Deng, N.; Fan, M.; Hao, R.; Zhang, A.; Li, Y. Field Measurements and Analysis on Temperature, Relative Humidity, Airflow Rate and Oil Fume Emission Concentration in a Typical Campus Canteen Kitchen in Tianjin, China. Appl. Sci. 2022, 12, 1755. [Google Scholar] [CrossRef]
- Liu, Y.; Li, C.; Ma, H.; Dong, J. Investigation on the indoor environment during a whole cooking process under constant make-up air organization in a Chinese-style residential kitchen. Indoor Built Environ. 2023, 32, 1170–1186. [Google Scholar] [CrossRef]
- World Health Organization. WHO Guidelines for Indoor Air Quality: Selected Pollutants, Geneva, Switzerland. Available online: https://www.who.int/publications/i/item/9789289002134 (accessed on 5 July 2023).
- Reboul, C.; Thireau, J.; Meyer, G.; André, L.; Obert, P.; Cazorla, O.; Richard, S. Carbon monoxide exposure in the urban environment: An insidious foe for the heart? Respir. Physiol. Neurobiol. 2012, 184, 204–212. [Google Scholar] [CrossRef] [PubMed]
- Jacobson, T.A.; Kler, J.S.; Hernke, M.T.; Braun, R.K.; Meyer, K.C.; Funk, W.E. Direct human health risks of increased atmospheric carbon dioxide. Nat. Sustain. 2019, 2, 691–701. [Google Scholar] [CrossRef]
- Lim, K.; Lee, C. A numerical study on the characteristics of flow field, temperature and concentration distribution according to changing the shape of separation plate of kitchen hood system. Energy Build. 2008, 40, 175–184. [Google Scholar] [CrossRef]
- Li, A.; Zhao, Y.; Jiang, D.; Hou, X. Measurement of temperature, relative humidity, concentration distribution and flow field in four typical Chinese commercial kitchens. Build. Environ. 2012, 56, 139–150. [Google Scholar] [CrossRef]
- Grabow, K.; Still, D.; Bentson, S. Test Kitchen studies of indoor air pollution from biomass cookstoves. Energy Sustain. Dev. 2013, 17, 458–462. [Google Scholar] [CrossRef]
- Zhou, B.; Chen, F.; Dong, Z.; Nielsen, P.V. Study on pollution control in residential kitchen based on the push-pull ventilation system. Build. Environ. 2016, 107, 99–112. [Google Scholar] [CrossRef]
- Nejat, P.; Hussen, H.M.; Fadli, F.; Chaudhry, H.N.; Calautit, J.; Jomehzadeh, F. Indoor Environmental Quality (IEQ) Analysis of a Two-Sided Windcatcher Integrated with Anti-Short-Circuit Device for Low Wind Conditions. Processes 2020, 8, 840. [Google Scholar] [CrossRef]
- Lu, S.; Zhou, B.; Zhang, J.; Hou, M.; Jiang, J.; Li, F.; Wang, Y. Performance evaluation of make-up air systems for pollutant removal from gas stove in residential kitchen by using a push-pull ventilation system. Energy Build. 2021, 240, 110907. [Google Scholar] [CrossRef]
- Wang, L.; Xiang, Z.; Stevanovic, S.; Ristovski, Z.; Salimi, F.; Gao, J.; Wang, H.; Li, L. Role of Chinese cooking emissions on ambient air quality and human health. Sci. Total Environ. 2017, 589, 173–181. [Google Scholar] [CrossRef] [PubMed]
- Chithra, V.S.; Shiva Nagendra, S.M. Impact of outdoor meteorology on indoor PM10, PM2.5 and PM1 concentrations in a naturally ventilated classroom. Urban Clim. 2014, 10, 77–91. [Google Scholar] [CrossRef]
- Martins, V.; Moreno, T.; Mendes, L.; Eleftheriadis, K.; Diapouli, E.; Alves, C.A.; Duarte, M.; de Miguel, E.; Capdevila, M.; Querol, X.; et al. Factors controlling air quality in different European subway systems. Environ. Res. 2016, 146, 35–46. [Google Scholar] [CrossRef]
- TSI. IAQ-Calc Indoor Air Quality Meter Model 7545 Operation and Service Manual. Available online: https://tsi.com/getmedia/812721b4-f84d-43aa-8b04-19a4ccab2bd7/7545-IAQ-Calc-1980576D?ext=.pdf (accessed on 9 July 2023).
- Fengfeng, Y.; Zhang, W.; Dai, Z.; Xu, N. Study on ensuring indoor fresh air volume in winter. Measurement 2010, 43, 406–409. [Google Scholar] [CrossRef]
- Wyon, D. Individual Microclimate Control: Required Range, Probable Benefits and Current Feasibility. Available online: https://www.researchgate.net/publication/310403150_Individual_microclimate_control_Required_range_probable_benefits_and_current_feasibility (accessed on 15 July 2023).
- Giwa, S.O.; Nwaokocha, C.N.; Sharifpur, M. An appraisal of air quality, thermal comfort, acoustic, and health risk of household kitchens in a developing country. Environ. Sci. Pollut. Res. 2021, 29, 26202–26213. [Google Scholar] [CrossRef] [PubMed]
- Giwa, S.O.; Nwaokocha, C.N.; Odufuwa, B.O. Air pollutants characterization of kitchen microenvironments in southwest Nigeria. Build. Environ. 2019, 153, 138–147. [Google Scholar] [CrossRef]
- General Administration of Quality Supervision, Inspection and Quarantine Health of People’s Republic of China; Ministry of Health of People’s Republic of China; Ministry of Environmental Protection of People’s Republic of China. Technical Specifications for Monitoring of Indoor Air Quality (HJ/T 167-2004). Available online: https://www.mee.gov.cn/ywgz/fgbz/bz/bzwb/jcffbz/200412/W020110127390160056847.pdf (accessed on 2 September 2023).
- Raza, Z.; Akhter, S.; Shang, Y. Expected value of first Zagreb connection index in random cyclooctatetraene chain, random polyphenyls chain, and random chain network. Front. Chem. 2023, 10, 1067874. [Google Scholar] [CrossRef]
- Tokmakoff, A. Chemical Dynamics in Condensed Phases-Fluctuations and Randomness—Some Definitions. Available online: https://chem.libretexts.org/@go/page/107300 (accessed on 25 July 2023).


| Name | Model | Size (mm) | Parameters |
|---|---|---|---|
| Two-head natural gas stove | JZT-Q30A (12T) | 710 × 400 × 150 | Rated pressure: 2000 Pa |
| Weight: 8.1 kg | |||
| Rated heat load: 4.1 kW × 2 | |||
| Exhaust hood | CXW-219-JT30 (SN) | 900 × 520 × 880 | Maximum pressure: ≥300 Pa |
| Weight: 30 kg | |||
| Volume flow rate: 0.25 m3/s |
| Names | Pictures | Average Consumed Gas (m3) | Cooking Procedures |
|---|---|---|---|
| Boiled eggs |  | 0.020 | Preparation: Put 2 eggs into 425 g water and soaked for 10 min. |
| Step 1: Turned on the stove to medium-high and brought to the water boil. | |||
| Step 2: Turned the heat to low and boiled the eggs for 6 min. | |||
| Step 3: Turned off the stove and dished out the eggs. | |||
| Steamed perch | 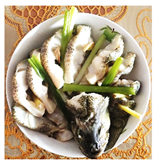 | 0.096 | Preparation: Rinsed the perch (450 g) and marinated with salt, scallion, ginger, and light soy sauce for 30 min. |
| Step 1: Turned on the stove to high and brought 1200 g of water to a boil. | |||
| Step 2: Put the perch above the water and steamed for 8 min. | |||
| Step 3: Turned off the stove and left the perch in the steamer for a period of time. | |||
| Sautéed mungbean sprout | 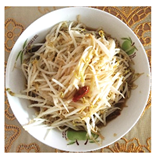 | 0.023 | Step 1: Turned on the stove to medium-high and made the wok hot. |
| Step 2: Added 10 g cooking oil, 2 chili peppers, and some scallion into the wok. | |||
| Step 3: When the oil smoked, added 375 g of mungbean sprout. Turned the heat up to high and performed a few quick stirs. | |||
| Step 4: Added some salt as well as light soy sauce and kept on stirring. | |||
| Step 5: Turned off the stove. Added some vinegar and dished out the mungbean sprout. | |||
| Fried chicken middle wings |  | 0.060 | Preparation: Rinsed 15 chicken middle wings (550 g) and marinated with salt, scallion, ginger, garlic, white pepper, and light soy sauce for 30 min. |
| Step 1: Turned on the stove to medium-high and made the wok hot. | |||
| Step 2: Added some cooking oil, Sichuan pepper, and star aniseed. | |||
| Step 3: When the oil was heat, turned the heat to low and put in 4 chicken middle wings. Fried the chicken middle wings until golden brown and dished out. (Repeated 3 times.) | |||
| Step 4: Put in 3 chicken middle wings. Fried the chicken middle wings until golden brown and dished out. | |||
| Step 5: Turned off the stove. Added some cumin powder and coriander to the chicken middle wings. |
| Cases | Dishes | Interior Door | Exterior Window | Exhaust Hood |
|---|---|---|---|---|
| 1 | Boiled eggs | off * | off | off |
| 2 | Boiled eggs | off | off | on *** |
| 3 | Boiled eggs | off | on ** | off |
| 4 | Boiled eggs | on | on | off |
| 5 | Boiled eggs | on | off | on |
| 6 | Boiled eggs | off | on | on |
| 7 | Steamed perch | off | off | off |
| 8 | Steamed perch | off | off | on |
| 9 | Steamed perch | off | on | off |
| 10 | Steamed perch | on | on | off |
| 11 | Steamed perch | on | off | on |
| 12 | Steamed perch | off | on | on |
| 13 | Sautéed mungbean sprout | off | off | off |
| 14 | Sautéed mungbean sprout | off | off | on |
| 15 | Sautéed mungbean sprout | off | on | off |
| 16 | Sautéed mungbean sprout | on | on | off |
| 17 | Sautéed mungbean sprout | on | off | on |
| 18 | Sautéed mungbean sprout | off | on | on |
| 19 | Fried chicken middle wings | off | off | off |
| 20 | Fried chicken middle wings | off | off | on |
| 21 | Fried chicken middle wings | off | on | off |
| 22 | Fried chicken middle wings | on | on | off |
| 23 | Fried chicken middle wings | on | off | on |
| 24 | Fried chicken middle wings | off | on | on |
| Parameters | Range | Accuracy | Resolution |
|---|---|---|---|
| Temperature | 0–60 °C | ±0.6 °C | 0.1 °C |
| Relative humidity | 5–95% RH | ±3% RH | 0.1% RH |
| CO concentration | 0–500 ppm | ±3% of reading or ±3 ppm, whichever is greater | 0.1 ppm |
| CO2 concentration | 0–5000 ppm | ±3% of reading or ±50 ppm, whichever is greater | 1 ppm |
Disclaimer/Publisher’s Note: The statements, opinions and data contained in all publications are solely those of the individual author(s) and contributor(s) and not of MDPI and/or the editor(s). MDPI and/or the editor(s) disclaim responsibility for any injury to people or property resulting from any ideas, methods, instructions or products referred to in the content. |
© 2023 by the authors. Licensee MDPI, Basel, Switzerland. This article is an open access article distributed under the terms and conditions of the Creative Commons Attribution (CC BY) license (https://creativecommons.org/licenses/by/4.0/).
Share and Cite
Chen, X.; Gao, Y.; Yang, L.; Liu, Y.; Qin, M.; Xia, J.; Wang, P. An Experimental Study on Temperature, Relative Humidity, and Concentrations of CO and CO2 during Different Cooking Procedures. Processes 2023, 11, 2648. https://doi.org/10.3390/pr11092648
Chen X, Gao Y, Yang L, Liu Y, Qin M, Xia J, Wang P. An Experimental Study on Temperature, Relative Humidity, and Concentrations of CO and CO2 during Different Cooking Procedures. Processes. 2023; 11(9):2648. https://doi.org/10.3390/pr11092648
Chicago/Turabian StyleChen, Xi, Yahui Gao, Liu Yang, Yang Liu, Miaomiao Qin, Jialing Xia, and Peng Wang. 2023. "An Experimental Study on Temperature, Relative Humidity, and Concentrations of CO and CO2 during Different Cooking Procedures" Processes 11, no. 9: 2648. https://doi.org/10.3390/pr11092648
APA StyleChen, X., Gao, Y., Yang, L., Liu, Y., Qin, M., Xia, J., & Wang, P. (2023). An Experimental Study on Temperature, Relative Humidity, and Concentrations of CO and CO2 during Different Cooking Procedures. Processes, 11(9), 2648. https://doi.org/10.3390/pr11092648