Article

Optimization of Cost–Carbon Reduction–Technology Solution for Existing Office Parks Based on Genetic Algorithm

1
State Grid Shanghai Municipal Electric Power Company, Shanghai 200122, China
2
China Electric Power Research Institute, Beijing 100192, China
3
College of Architecture and Urban Planning, Tongji University, Shanghai 200092, China
*
Authors to whom correspondence should be addressed.
Processes 2023, 11(8), 2452; https://doi.org/10.3390/pr11082452
Submission received: 20 July 2023 / Revised: 5 August 2023 / Accepted: 10 August 2023 / Published: 15 August 2023
(This article belongs to the Special Issue Application of Data-Driven Method for HVAC System)

Abstract

:
With limited investment costs, how to fully utilize the carbon-reduction capacity of a campus in terms of buildings, equipment, and energy is an important issue when realizing the low-carbon retrofit of office parks. To this end, this paper establishes a mathematical optimization model for the decarbonization-based retrofit of existing office parks, based on the genetic algorithm, taking into account the relationship between cost, energy-consumption, and carbon-emissions, and taking the maximum carbon reduction of the park over its whole life as the optimization goal. The validity of the model was verified in conjunction with a case study of an office park in Nanchang, China. The case study shows that, compared with current typical parks, the carbon reduction through an office park’s decarbonization retrofit has a non-linear correlation with the investment cost, and when the total investment cost of the park is above CNY 60 million, the increase in carbon reduction with the increase in the investment cost is gradually weakened, and the park achieves the maximum carbon reduction of 236,087 t when the investment cost reaches CNY 103 million. Under the current technical and economic conditions, the investment-cost–carbon-reduction benefits of different carbon-reduction technologies are different, the carbon-reduction benefit of increasing renewable energy utilization is the best, and the carbon-reduction benefit of upgrading the energy efficiency of the park’s supply-and-use system is lower than that of renewable energy utilization, but better than that of upgrading the performance of the building envelope system. In addition, the configuration of the parameters of the same low-carbon technology in different forms of buildings varies significantly, due to differences in the building form and daily use. The model established in this paper is able to give a comprehensive optimized building–equipment–energy configuration plan for existing office parks, when maximizing carbon reduction under different investment costs, which guides the park’s decarbonization retrofit.

1. Introduction

The rapid increase in carbon emissions has made environmental issues too prominent to be ignored [1]; global carbon emissions are expected to increase to 30% above the 2010 level by 2030 [2]. In China, CO2 emissions generated by parks account for 31% of the country’s total carbon emissions [3], so carbon reduction in parks has become an inevitable requirement for China’s low-carbon transition. According to the IPCC, the main sources of carbon emissions on the park scale are energy and buildings [4].
In terms of energy, most of the existing research focuses on the optimization of the configuration method and operation strategy of the integrated energy system in the park. For example, Song, Z. et al. developed a multi-objective optimization model to synergistically optimize the configuration and operation strategy of a combined cooling, heating, and power (CCHP) system, with the objectives of minimizing the cost, primary energy consumption, and carbon emissions [5]. Wu, D. et al. proposed a multi-parameter synergistic optimization method aimed at cost reduction, carbon reduction, and independence in the low-carbon park energy system, with photovoltaics, wind power, lithium batteries, and heat storage tanks, and explored the equipment configuration and operating parameters [6]. Wang, Y. et al. developed a multi-objective optimization model for an integrated energy system to optimize the capacity allocation of the energy system, using the Strength Pareto Evolutionary Algorithm 2 (SPEA2), and through a sequential preference technique similar to the ideal solution (TOPSIS), to minimize the total annual cost and carbon dioxide emissions under different investment cost constraints [7]. Guo, W. et al. constructed an integrated energy system, including combined heat and power (CHP), a heat pump (HP), and energy storage (ES), and considered the optimization objectives of the operating cost, energy efficiency, and renewable energy consumption rate, taking into account the carbon emission and demand response, and used the multi-objective particle swarm optimization algorithm (MOPSO) to optimize the operation strategy of the integrated energy system [8].
In terms of buildings, research has focused on passive energy-saving design, such as envelope thermal insulation design, and the optimization of the building form and layout. For example, Luo, Z. et al. took the optimization objective of maximizing the carbon-reduction benefit and cost-effectiveness of the whole life cycle of the building, to obtain the optimal configurations of seven design parameters for the thermal performance of the envelope, and two parameters related to the users’ willingness to save energy (cooling and heating temperatures) [9]. Fesanghary, M. et al. proposed a multi-objective optimization model based on the harmony search algorithm (HS). The minimization the life cycle cost (LCC) and CO2-equivalent (CO2-eq) of the building was used as the objective function, and the building envelope parameters were used as the design variables [10]. Ferrara, M. et al. used a combination of TRNSYS and GenOpt, with a global cost function as the objective function for optimization, and a particle swarm optimization algorithm was used to minimize the objective function and identify the cost-optimal building configuration [11]. Gerber, D.J. et al. chose ModelCenter as the process integration and design optimization software, and used a genetic algorithm to develop a multi-objective optimization model [12]. Yigit, S. et al. developed a software package that combines customized thermal simulation software with Matlab’s Optimtool [13]. Tuhus-Dubrow, D. et al. combined a genetic algorithm with a building energy simulation engine, to build an optimization model [14]. Carli, R. et al. developed a multi-objective optimization algorithm, to improve, in an integrated and holistic way, the building energy efficiency and comfort, by efficiently allocating the budget to the buildings [15].
In addition, many scholars consider the coupled effect of the building and energy system to integrate and optimize the building envelope and air-conditioning system. Chantrelle, F. et al. developed a multi-objective optimization tool for building renewal, MultiOpt, that focuses on optimizing the building envelope, air conditioning loads, and control strategies, using a genetic algorithm (NSGA-II) coupled with TRNSYS, and economic and environmental databases [16]. Petkov, I. et al. proposed a multi-stage multi-objective scalable optimization framework (called MANGOret) to provide optimal configurations for multi-energy systems and the envelope retrofits of existing buildings, using the multi-objective building optimization tools Mobo and TRNSYS [17]. Abdou, N. carried out a multi-objective optimization, using the multi-objective building optimization tool Mobo, in conjunction with TRNSYS, to find the optimal building envelope design, and the optimal sizing of the renewable energy system for a net-zero energy building in Tetouan (Morocco) [18]. Lin, Y.H. et al. established a multi-objective optimization decision model (MOBELM) for the energy performance of the building envelope and air-conditioning system with the help of MATLAB R2021a (9.10.1602886), with the optimization objectives of minimizing the building cost and carbon emissions [19]. Bichiou, Y. et al. demonstrated a comprehensive energy simulation environment to optimize the building envelope characteristics and HVAC system design and operation strategies, with the optimization objective of minimizing the whole-life-cycle cost, and compared the robustness and effectiveness of three algorithms, namely, the genetic algorithm, particle swarm algorithm, and sequential search algorithm, in the simulation environment [20]. Hashempour, N. et al. reviewed the literature related to energy efficiency optimization for existing buildings, and pointed out that GA ranked first (41%) in terms of contribution among the studies analyzed, with the NSGA-II algorithm receiving the most attention [21]. Mela, K. compared the functionality and the results provided by six multiple criteria decision; unfortunately, the best MCDM method was not discovered [22].
It can be seen that previous studies mainly focus on a single dimension, such as energy or buildings, and the selection of carbon-reduction technologies is mostly limited to the selection of one or two carbon-reduction technologies for optimization. In addition, the research on the optimization of carbon-reduction technologies in parks mainly focuses on the planning and design of new parks, offering few optimizations for retrofitting existing parks, and most of them are qualitative technical guidelines [23,24,25,26], lacking quantitative analysis. The office park is a systematic integration of various types of single buildings, equipment, and energy sources, and the form and function of different buildings are different, so when the investment cost is given, how can we configure multiple low-carbon technologies among buildings, to maximize the benefits of carbon reduction in the park? This is one of the questions that need to be answered.
Therefore, in this paper, we will consider the relationship between cost, energy consumption, and carbon emissions, and establish an integrated optimal configuration model of building–equipment–energy, based on the genetic algorithm, with the goal of maximum carbon reduction in the whole life cycle of an existing office park retrofit. The innovation of this paper is to maximize the whole carbon emission reduction of the park under limited cost constraints, and to make full use of the carbon-reduction potential of buildings, equipment, and renewable energy in all aspects, through a reasonable configuration solution, which is of great guiding significance for the low-carbon transformation of the established park.

2. Optimization Model

Currently, there are several mature low-carbon technologies for building bodies, equipment, and energy, but the costs and carbon-reduction potential of different low-carbon technologies vary greatly, and they are applicable at different stages. Under limited cost constraints, first of all, according to the region, climate, form, function, and other characteristics of the specific project, the low-carbon benefits of various types of resource inputs should be comprehensively optimized, and compared and weighed against the low-carbon benefits of buildings, equipment, and renewable energy use, etc., so as to filter out the optimal configuration of the various low-carbon technologies that can be utilized in the target park. The establishing process of the optimization model is shown in Figure 1, and is mainly divided into three steps. The first step is to select low-carbon technologies. Based on the carbon-reduction benefits and investment costs of relevant low-carbon technologies, we identify low-carbon technologies applicable to the retrofit of the target parks. The second step is to establish the optimization model. Based on the low-carbon technologies selected to form the optimization variables for the park retrofit, furthermore, we obtain the quantitative relationship between each optimization variable and carbon emissions and investment costs, then we define the objective function, and set the constraints and initial values of the optimization model. The third step is model solving. Using the genetic algorithm, we obtain the calculation results of the model, i.e., the maximum life-cycle carbon reduction achieved by the park’s decarbonization retrofit under different investment cost constraints, and the corresponding optimal configuration scheme.

2.1. Objective Function

In this paper, the maximum life cycle carbon reduction of the park’s decarbonization retrofit is taken as the objective, assuming that the park contains n buildings with a total of m low-carbon technologies available. For a given parameter of a low-carbon technology applied to a building in the park, the corresponding carbon reduction and investment cost of the technology can be obtained, as shown in Equations (1) and (2), respectively:
E i , j k = f ( k i , j )
C i , j k = g ( k i , j )
where E i , j k is the whole-life-cycle reduction in carbon emissions from the use of low-carbon technology j on building i; k i , j is the technical parameter for the use of low-carbon technology j on building i; and C i , j k is the investment cost of applying low-carbon technologies j to the building i.
The objective function for maximizing the whole-life-cycle carbon reduction in the park is established as Equation (3):
E = i = 1 n j = 1 m E i , j k = i = 1 n j = 1 m E O P , i , j k i = 1 n j = 1 m E C O , i , j k
where E O P , i , j k is the reduction in carbon emissions during the operational phase of the use of low-carbon technology j on building i; and E C O , i , j k is the increase in carbon emissions during the construction phase of the use of technology j on building i.

2.2. Constraints

2.2.1. Technical Boundary Constraints

Different low-carbon technologies have different parameter-change characteristics, and technical boundaries. For example, for low-carbon technologies such as the roof and external wall insulation thickness, external window heat transfer coefficient, and photovoltaic installation area, their technical parameter changes can be regarded as continuous, with upper and lower bounds. For carbon-reduction technologies such as heat-reflective coatings, air-conditioning intelligent operation and control systems, and energy-saving lighting retrofits, there are only two scenarios in which the change in the technical parameters takes place: when the technology is used, the parameter takes the value of 1; when it is not used, the parameter takes the value of 0. Then, the constraints of the technical boundary are shown in Equation (4):
k i , j L k i , j k i , j U

2.2.2. Cost Constraints

The application of each low-carbon technology to each building will generate the corresponding investment cost; based on the accumulation of the investment cost of all the carbon-reduction technologies in the park, we get the total cost of the park’s decarbonization retrofit, as shown in Equation (5):
C 0 = i = 1 n j = 1 m C i , j k C
where n is the number of individual buildings in the park; m is the number of low-carbon technologies adopted; k is the value of the parameter taken for the use of technology j on building i; and C i , j k is the cost of adopting the j-th technology in building i with technical parameters taking the value k. The total cost C 0 is obtained by superimposing all the sub-costs C i , j k .

2.2.3. Model Solving

Optimization models include linear optimization models, nonlinear optimization models, mixed integer linear or nonlinear optimization models, multi-objective optimization models, and many other types. Efficient and accurate solution algorithms can be selected according to the model characteristics, such as the gradient descent method, Newton method, genetic algorithm, and so on.
The optimization model established in this paper is a single-objective optimization model, with the objective of minimizing the total carbon emissions in the whole life cycle of the park. According to whether the optimization variables are continuously reachable or not, it is divided into nonlinear optimization programming and mixed integer linear programming, which corresponds to the choice of calculus or stochastic methods for solving the model using MATLAB2021a (9.10.1602886) software.

3. Case Study

3.1. Park Overview

The research object of this paper is a selected office park in Nanchang, Jiangxi Province, which covers an area of 25,000 square meters, with a total of 11 single buildings: respectively, a restaurant (No. R01), four enclosed office buildings with the same structural form (No. W01), and another enclosed office building (No. W02). In addition, there are four “E”-type office buildings with the same structural form (No. E01), and another “E”-type office building (No. E02).
The effect diagram of the park is shown in Figure 2, and the main technical indexes of each individual building in the park are shown in Table 1.

3.2. Selection of Optimization Variables

Based on the considerations of carbon-reduction potential and investment cost, Sun, J. categorized various types of low-carbon technologies. Firstly, there are high-potential and high-cost, low-carbon technologies represented by a distributed energy supply and ultra-low energy buildings. Secondly, there are high-potential, low-cost, low-carbon technologies represented by building photovoltaics and various types of heat pump technologies. Thirdly, the carbon-reduction technologies represented by a building’s photovoltaic technology and by arbor and shrub configuration, solid waste recycling, and wastewater treatment are low-potential and low-cost low-carbon technologies and, fourthly, there are low-potential and high-cost, low-carbon technologies represented by a garbage pneumatic recycling system and three-dimensional greening [27]. Xiao, H. et al. pointed out that air-conditioning systems, household appliances, and lighting systems are the three technologies with the highest potential for carbon reduction in the long term, accounting for 72.9% of the total carbon-reduction potential in the building sector in China [28]. The literature [29,30] points out that heat-reflective insulation coatings on external walls can effectively reduce the surface temperature of external walls in hot-summer and cold-winter regions, with good carbon-reduction benefits. In addition, photovoltaics have excellent carbon-reduction benefits [31,32]. For the optimization of the layout of the building form, various types of heat pump technology, and other types of low-carbon technology, despite having significant carbon-reduction benefits, are not suitable for the retrofit of existing parks.
In this paper, for the low-carbon retrofit of an existing office park in Nanchang City, considering economy and feasibility, the seven low-carbon technologies of exterior wall insulation (abbreviated as “WAIT”), roof insulation (abbreviated as “RIT”), thermal performance of exterior windows (abbreviated as “WDIT”), heat-reflective coatings (abbreviated as “HRIT”), lighting energy-saving retrofit (abbreviated as “LEST”), intelligent control system of HVAC (abbreviated as “ACIT”), and photovoltaics (abbreviated as “PVs”) are finally selected as the optimization variables to establish a comprehensive optimization model for the low-carbon optimization of the park’s retrofit. The optimization variables of this park are set as shown in Table 2.

3.3. Optimizing Variable Constraints

(1)
Low-carbon technologies for building envelopes
We examine the performance limits of low-carbon technologies for envelope structures in China. For the exterior envelope insulation performance retrofit in this park, the parameter-setting constraints for roof insulation, external wall insulation, and external window heat transfer coefficients are shown in Equations (6)–(8), respectively:
0 k i , 1 120
0 k i , 2 120
0.5 k i , 3 2.6
where k i , 1 is the thickness of the exterior wall insulation, mm; k i , 2 is the thickness of the roof insulation, mm; k i , 3 is the heat transfer coefficient of the window, W m−2 K−1.
(2)
Heat-reflective coatings
The application effect of heat-reflective coatings is related to the climate zone in which the building is located, and the part of the application, generally in the tropics or hot-summer and cold-winter areas, where the application effect is better, and the application of reflective heat-insulating coatings on the north façade of the building is not obvious. The region in which this case is located is a hot-summer and cold-winter region, taking into account the economy and feasibility of the project implementation plan to optimize the application of this technology to the east, south, and west elevations of the building. The application area of the exterior heat-reflective coatings is not a continuous variable; rather, for a particular monolithic building, there are only two cases: when not in use, k i , 4 is 0; when in use, k i , 4 is 1; and the constraint relationship is shown in Equation (9):
k i , 4 = 0 1
When k i , 4 is 0, it means that the building does not use this technology, and when k i , 4 is 1, it means that the building uses heat-reflective thermal insulation coatings.
(3)
HAVC Intelligent Control System
For the HAVC intelligent control system, there are two cases; i.e., when a building is set up with this control system, it takes the value of 1, and when the building is not set up with this control system, it takes the value of 0. The constraint relationship is shown in (10):
k i , 5 = 0 1
(4)
Lighting-energy-saving retrofit
Lighting-energy-saving retrofit technology is only considered for spaces with high occupancy rates, such as offices and conference rooms, to which the economic benefits of lighting-energy-saving retrofits are relatively obvious. For some auxiliary equipment rooms, stairwells, and other areas with a low level of space occupancy, the technology is not considered. The constraint relationship is shown in Equation (11):
k i , 6 = 0 1
When a building adopts a lighting-energy-saving retrofit, then k i , 6 is 1, and when the technology is not adopted, k i , 6 takes the value of 0.
(5)
PV-paved
There is a limited area in the park and, at the same time, there is the requirement for a green space rate, so the available photovoltaic area in the park is concentrated on the roof of the building, and the photovoltaic pavement area in the park is constrained, as shown in Equation (12):
0 k i , 7 A P
where A P is the area of the park where PV can be installed, which, in this paper, is taken as 70% of the total building roof area.

3.4. Investment Cost Constraints

The total investment cost of the decarbonization of the park is the sum of the investment costs of implementing each low-carbon technology in individual buildings, as shown in Equation (13). Among them, each individual investment cost is shown in Table 3.
C 0 = j = 1 6 C 1 , j k + 4 × j = 1 6 C 2 , j k + j = 1 6 C 3 , j k + 4 × j = 1 6 C 4 , j k + j = 1 6 C 5 , j k + C 7 k
The formula for calculating the investment cost of each type of low-carbon technology is shown in Table 3.
Table 3. The quantitative relationship between various low-carbon technology parameters and investment costs.
Low-Carbon TechnologyRelational Equation for Cost and Parameter ConfigurationEquation No.
Building thermal
performance
Roof C i , 1 k = k i , 1 × A D i × P 1 (14)
External wall C i , 2 k = k i , 2 × A Q i × P 2 (15)
External window C i , 3 k = k i , 3 × A C i × P 3 (16)
Heat-reflective coating technology C i , 4 k = ( 49.75 × k i , 4 2 602.45 × k i , 4 + 1875 ) × A W i (17)
HVAC intelligent control technology C i , 5 k = k i , 5 × P 5 (18)
Lighting-energy-saving technology C i , 6 k = k i , 6 × P 6 (19)
Photovoltaic power technology C i , 7 k = k i , 7 × P 7 (20)
Note: k i , j represents a technology configuration parameter; P i , i = 1, 2, … 7 represents the investment cost unit price of each technology, respectively.

3.5. Quantitative Relationship between Carbon Reduction and Optimization Variables

In order to obtain the quantitative relationship between the parameter settings of low-carbon technologies, and the whole life cycle carbon reduction in each type of building, this paper establishes a model of each type of building in Rhino and Grasshopper, sets up different thicknesses for the roof and exterior wall insulation, and different heat transfer coefficients for the exterior windows (the variable settings are shown in Table 4), and simulates the calculation of the operational stage of different types of building with different envelope parameter settings for carbon reduction. Meanwhile, the quantitative relationship between the PV pavement area and PV power generation is calculated, according to ref. [26].
Based on the modeling results, manner in which the carbon emissions increased in the construction stage, and reduced in the operation stage of each type of building envelope renovation in the park under different parameter settings was derived, and data fitting was performed to obtain the quantitative relationship equations between the thickness of the roof insulation layer, the thickness of the exterior wall insulation layer, the heat transfer coefficients of the exterior windows of each type of building, and the carbon emissions increased in the construction stage (CP-IN) and the carbon emissions reduced in the operation stage (OP-DE). In addition, for low-carbon technologies, such as heat-reflective coatings and lighting-energy-saving retrofits, the relationship between the parameter values taken and the carbon reduction can be given directly via a calculation. The quantitative relationship between each optimization variable and carbon reduction in the park is as follows.
(1)
Enhancement in the insulation performance of the envelope
The carbon reduction in the operational phase of the exterior wall, roof, and window insulation enhancement was calculated using the Grasshopper(Build 1.0.0007) software, the saved electricity was discounted according to the grid carbon emission factor, and the relationship equation between each optimization variable and its carbon reduction was obtained via fitting, which is summarized as shown in Table 5. The increased carbon emissions in the construction phase of each building’s exterior wall, roof, and window insulation performance enhancement were calculated, according to Equations (21)–(23):
E c o , i , 1 k i , 1 = A Q i × k i , 1 1000 × 28.2
E c o , i , 2 k i , 2 = A D i × k i , 2 1000 × 28.2
E c o , i , 3 k i , 3 = A C i × 4.84 × k i , 3 + 37
(2)
HVAC intelligent control, heat-reflective coatings, lighting-energy-saving retrofit
The carbon reduction by HVAC smart controls and heat-reflective coatings during the operational phase is calculated in Equation (39):
E o p , i , j k i , j = E o p , i , 0 j = 1 3 E o p , i , j k i , j × η j j = 5 , 6
where η j is the energy-saving rate of the j-th technology; in this case, the energy-saving rate of intelligent control η 5 is taken as 8%; and the energy-saving rate of heat-reflective coating η 6 is taken as 2%.
The carbon reduction in the operational phase of the lighting-energy-saving retrofit is calculated in Equation (40):
E o p , i , 4 k i , 4 = 171.09 × k i , 4 × A i
The increased carbon emissions in the construction phase from lighting energy efficiency retrofits, HVAC smart controls, and heat-reflective coatings are calculated in Equation (41):
E c o , i , j k i , j = E o p , i , j k i , j × 10 % i = 1 , 2 , , 5 j = 4 , 5 , 6
(3)
Photovoltaic
The carbon reduction by the park’s PV during the operation phase is discounted, based on its power generation, with reference to the grid carbon emission factor. The power generation is calculated with reference to [33], to obtain the carbon reduction of PV in the operation phase as Equation (42), and the carbon emission increased in the construction phase is calculated as 10% of the carbon reduction in the operation phase, as Equation (43):
E o p , p v , 7 k p v , 7 = 4117.07 × S p v
E c o , p v , 7 k p v , 7 = E o p , p v , 7 k p v , 7 × 10 %

4. Results and Discussion

Based on the basic information of the park, the quantitative relationship between each low-carbon technology parameter and its whole-life-cycle carbon emission and investment cost is substituted into the optimization model. to obtain the optimal configuration of the building-envelope–equipment–renewable-energy-system of the park under different investment-cost constraints.

4.1. Optimization of the Park under Infinite Cost

Firstly, the no-investment-cost constraint is set, and the optimal configuration of different carbon-reduction technologies for each type of building in the park is obtained through model calculations, as shown in Table 6.
From the above table, it can be seen that the maximum life-cycle carbon reduction that the park can achieve through the optimal configuration of the selected low-carbon technologies is 236,087 t, corresponding to a total investment cost of CNY 103 million. The average carbon-reduction benefit for the entire park is 2.29 kg CNY−1; at this point, additional investments continue to be made, and carbon reduction is not increasing. It can also be seen that the equipment energy efficiency improvement technology has been applied to all the buildings in the park without investment cost constraints. It is worth noting that, when the maximum carbon reduction is achieved, the configuration parameters of the envelope thermal insulation technology of each type of building in the park differ significantly and, for the “E”-type of building, which has the highest requirements for the envelope thermal insulation technology, the thickness of the insulation layer of the roof and the external wall, and the heat-transfer coefficient of the external window, have reached the constraint boundaries, which are 120 mm, 120 mm, and 0.5 W m−2 K−1, respectively. While the restaurant building’s (R01) enclosure thermal insulation technology parameter configuration requirements are low, its roof and exterior wall insulation thickness, and exterior window heat-transfer coefficient were 71 mm, 0 mm, and 2.6 W m−2 K−1.

4.2. Analysis of Carbon-Reduction Benefits under Infinite Cost

Based on the results of the model calculations, the carbon-reduction benefits of LCTs in various types of building are analyzed, as follows.
(1)
Carbon-reduction benefits of different LCTs in different buildings
Based on the model-optimization results, the carbon-reduction benefits (whole-life-cycle carbon reduction at unit cost) of each LCT in each building are calculated, as shown in Figure 3.
As can be seen from Figure 3, the carbon-reduction benefits of different LCTs in the same building vary greatly and, in general, compared with envelope thermal insulation technologies, equipment energy efficiency improvement technologies, such as ACIT and LEST, have higher carbon-reduction benefits. In addition, with the exception of LEST, the carbon-reduction benefits of the same LCT vary across buildings. For example, for the high-rise enclosed office building W02, the WAIT, ACIT, and HRCT have achieved the highest carbon-reduction benefits, compared with the other types of building. The applicability of the LEST is good in all types of building, with a carbon-reduction benefit of 3.56 kg CNY−1, which is due to the low correlation between the lighting retrofit technology and the building thermal performance and building form, and the relatively low cost and linear relationship with the retrofit area.
It is worth noting that, for the restaurant building R01, the parameters of WAIT and HRCT take the value of 0. The carbon-reduction benefits of RIT and WDIT are very low, at 0.14 and 0.27 kg CNY−1, respectively, which indicates that these LCTs are poorly adapted to the restaurant building. Unlike with the other types of building, the window-to-wall ratio of the restaurant is 0.8, and the building does not comply with the concept of an ultra-low-energy building, and it is more difficult and costly to improve the thermal performance of the envelope, so the measures related to the retrofit of the envelope have a very low carbon-reduction benefit.
(2)
Carbon-Reduction Benefits of Various Types of Building and Various Types of LCT
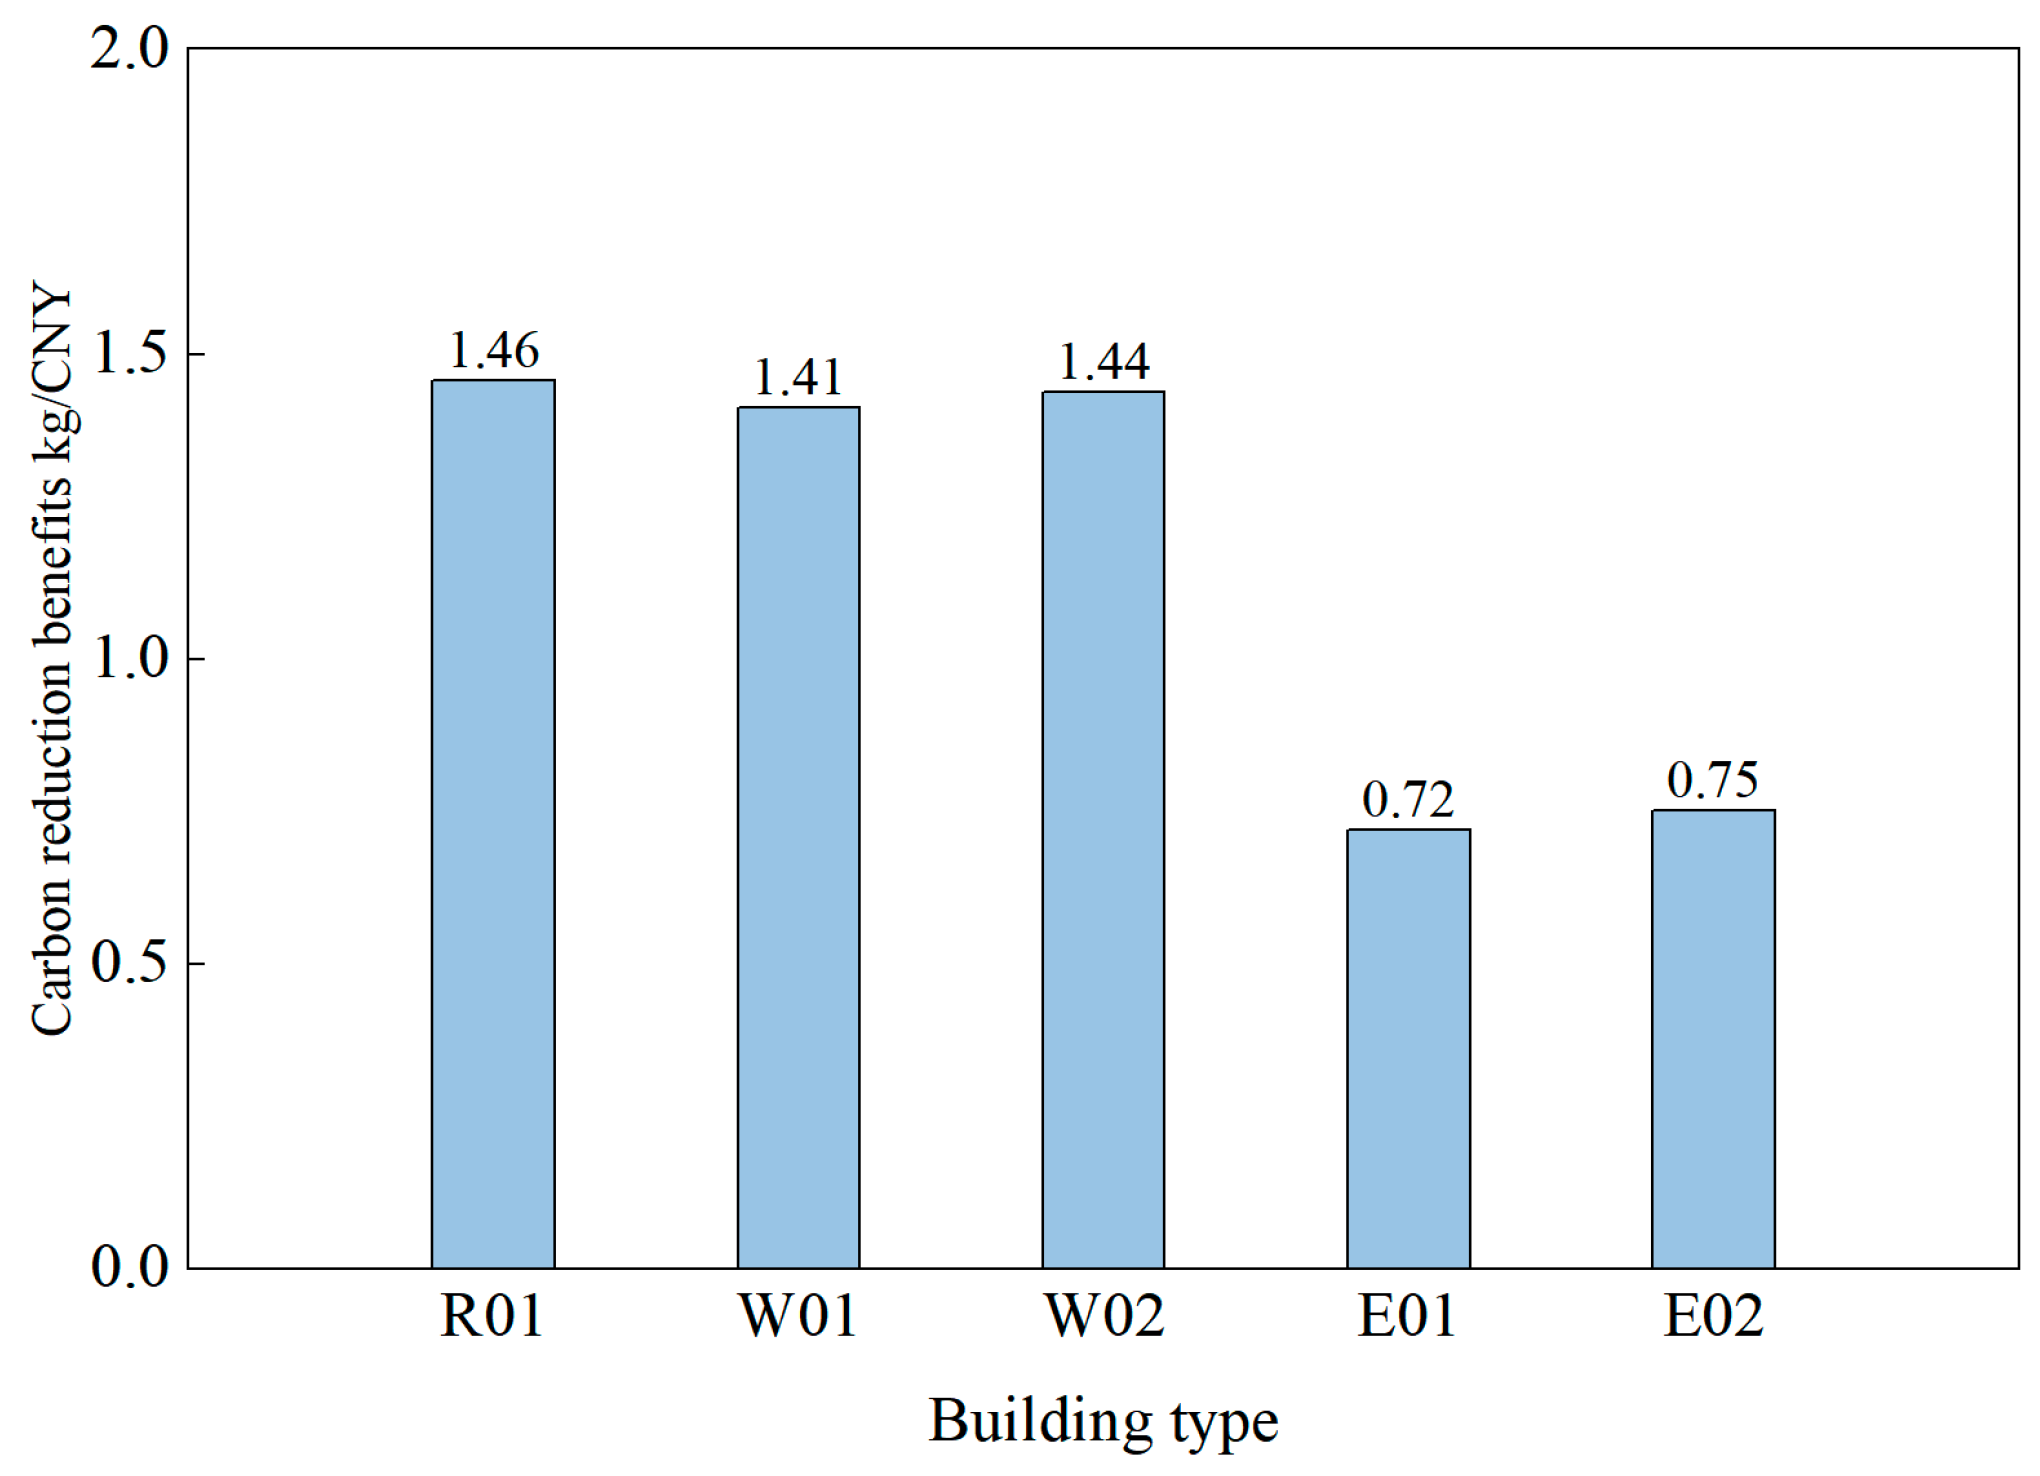
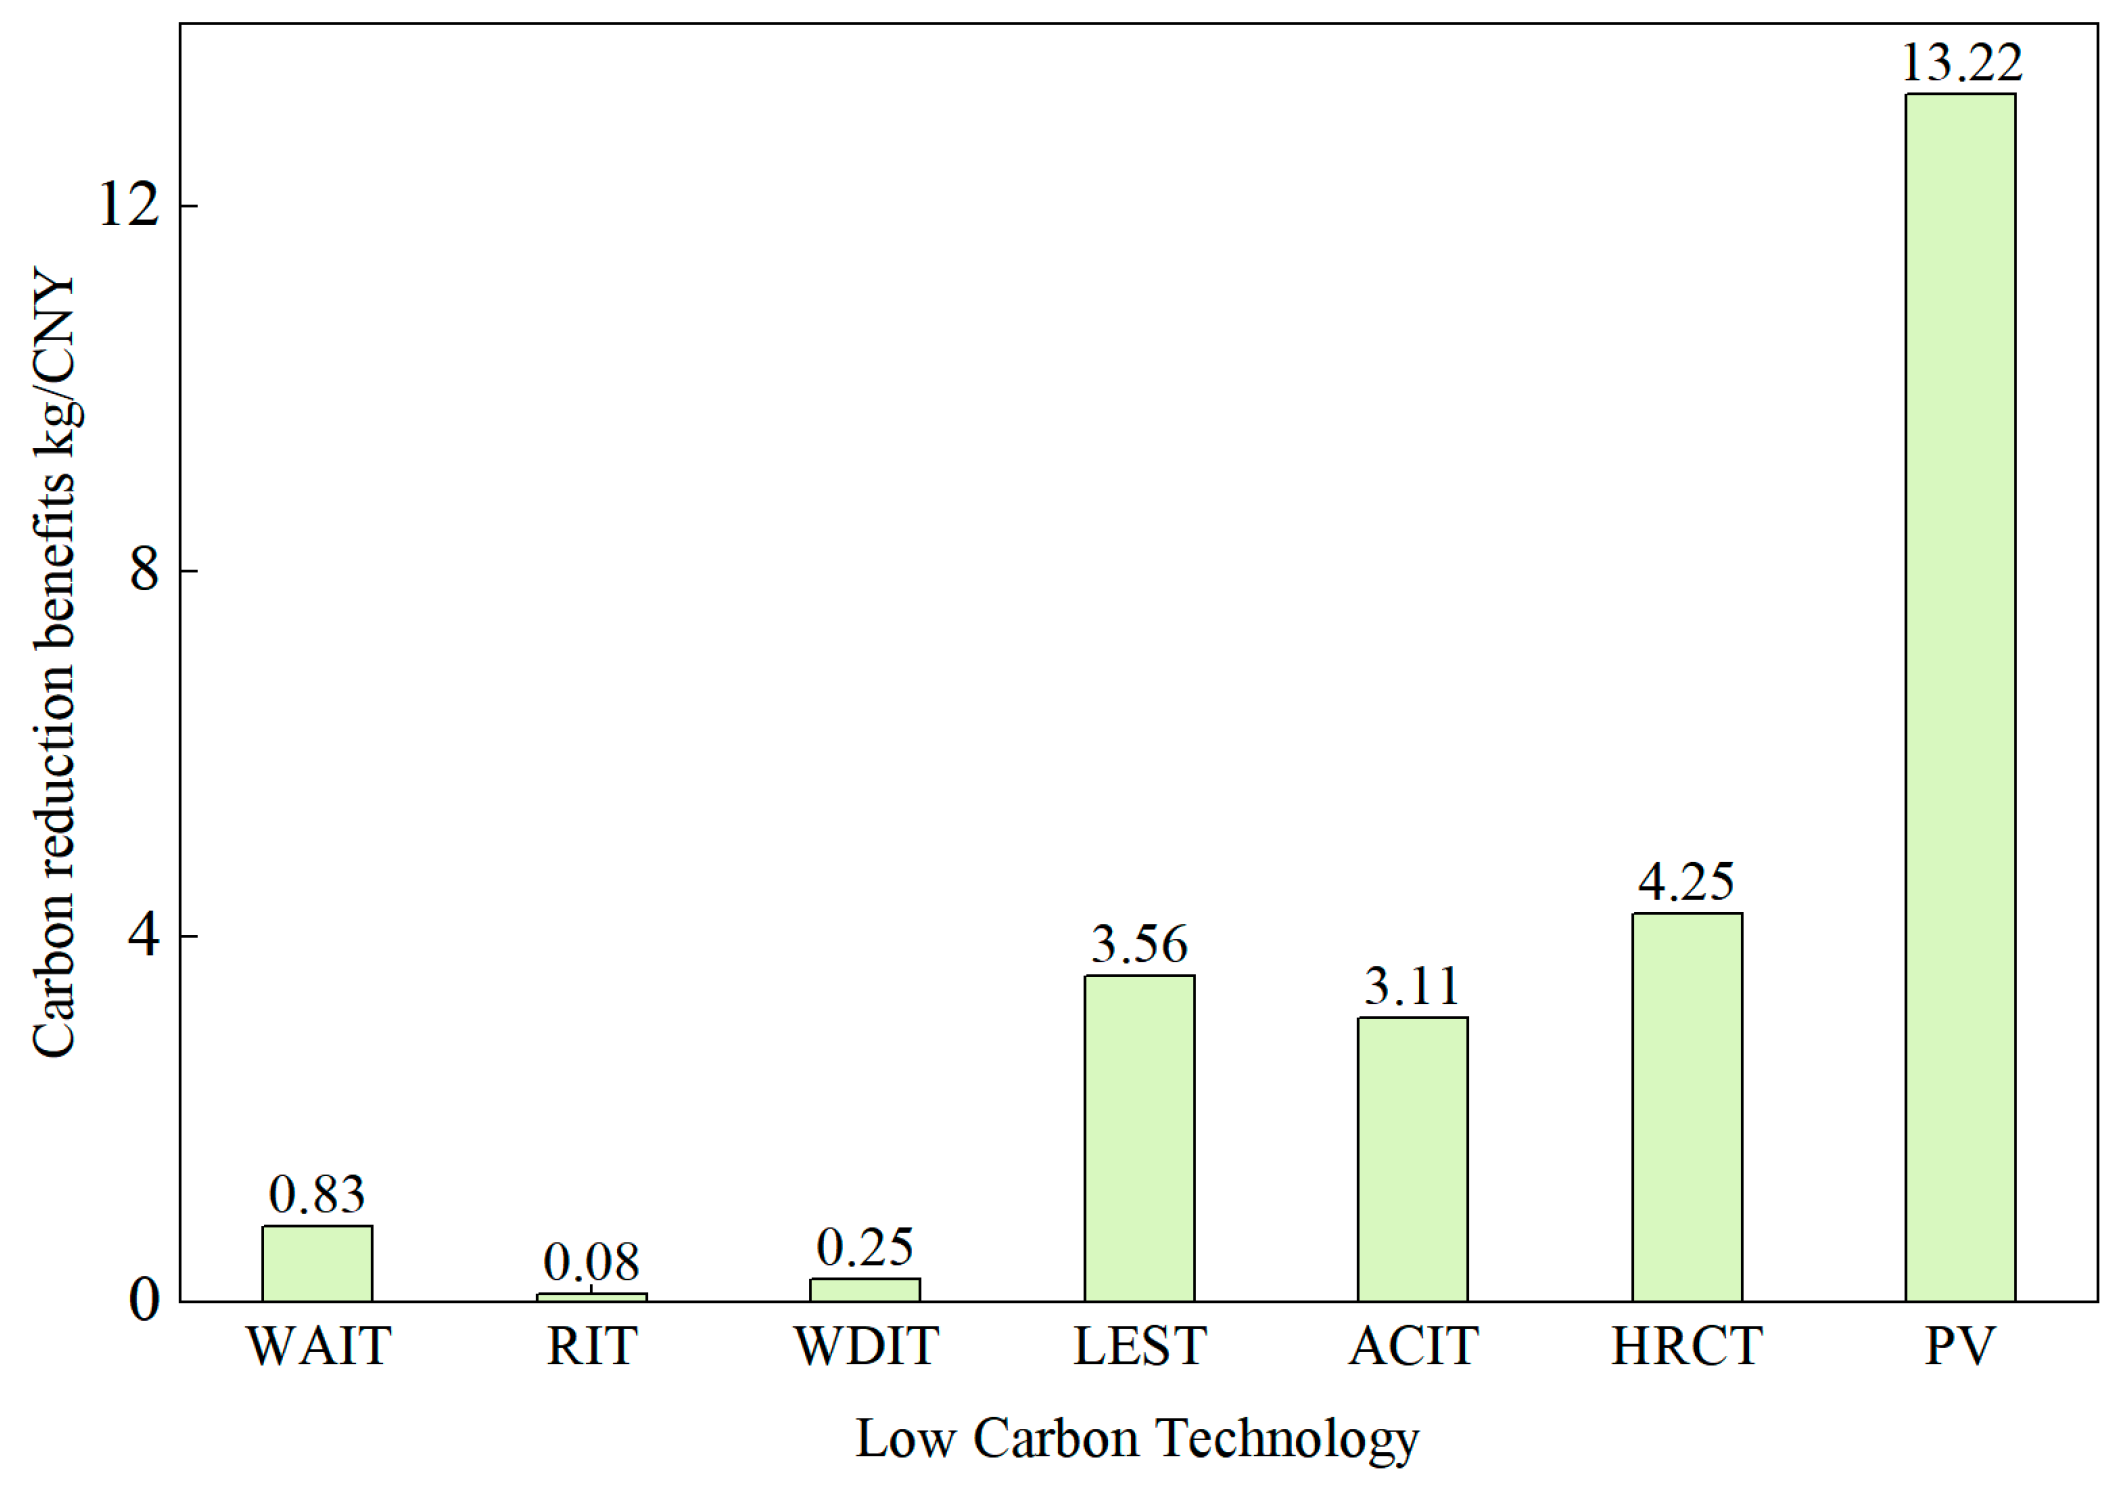
Based on the results of the model calculations, the carbon-reduction benefits of each type of building, and the carbon-reduction benefits of each type of LCT are shown in Figure 4 and Figure 5, respectively.
As can be seen from Figure 4, the carbon-reduction benefits of restaurant building R01, enclosed building W01, and enclosed building W02 are higher, while the carbon-reduction benefits of “E”-type building E01 and “E”-type building E02 are lower.
As can be seen from Figure 5, the carbon-reduction benefits of LEST, ACIT, and HRCT are higher, while the carbon-reduction benefits of LCT related to the improvement of the thermal performance of the building envelope are lower.

4.3. Optimization of the Park at Limited Cost

According to the calculation results of the optimization model under an infinite investment cost, it can be seen that the cost corresponding to reaching the maximum carbon reduction in the park is CNY 103 million; based on this result, different limits of investment cost from CNY 0 to 100 million are set, and the optimal configuration scheme for the comprehensive decarbonization retrofit of the park under different cost constraints is calculated. The relevant calculation results are as follows.
(1)
Variation in total carbon reduction in the park with the total investment cost
Based on the results of the model calculations, the variation in the total carbon reduction of the park with the increase in the investment cost is obtained, as shown in Figure 6.
As can be seen from Figure 6, the total carbon reduction in the park is non-linear with the change in investment cost; when the investment cost is below CNY 60 million, the carbon reduction increases faster with the investment cost, which is approximately linear, and the carbon reduction per-unit cost is basically unchanged. However, as the investment cost continues to increase, the trend of carbon reduction increase is gradually weakened, and the carbon reduction per-unit cost gradually decreases. When the investment cost reaches CNY 103 million, the park achieves the maximum carbon reduction of 236,087 t; at this time, the marginal benefit is 0. Up to this point, the carbon reduction in the park will not be increased with the incremental increase in the investment.
(2)
Variation in parameters with the investment costs for different LCTs in the same building
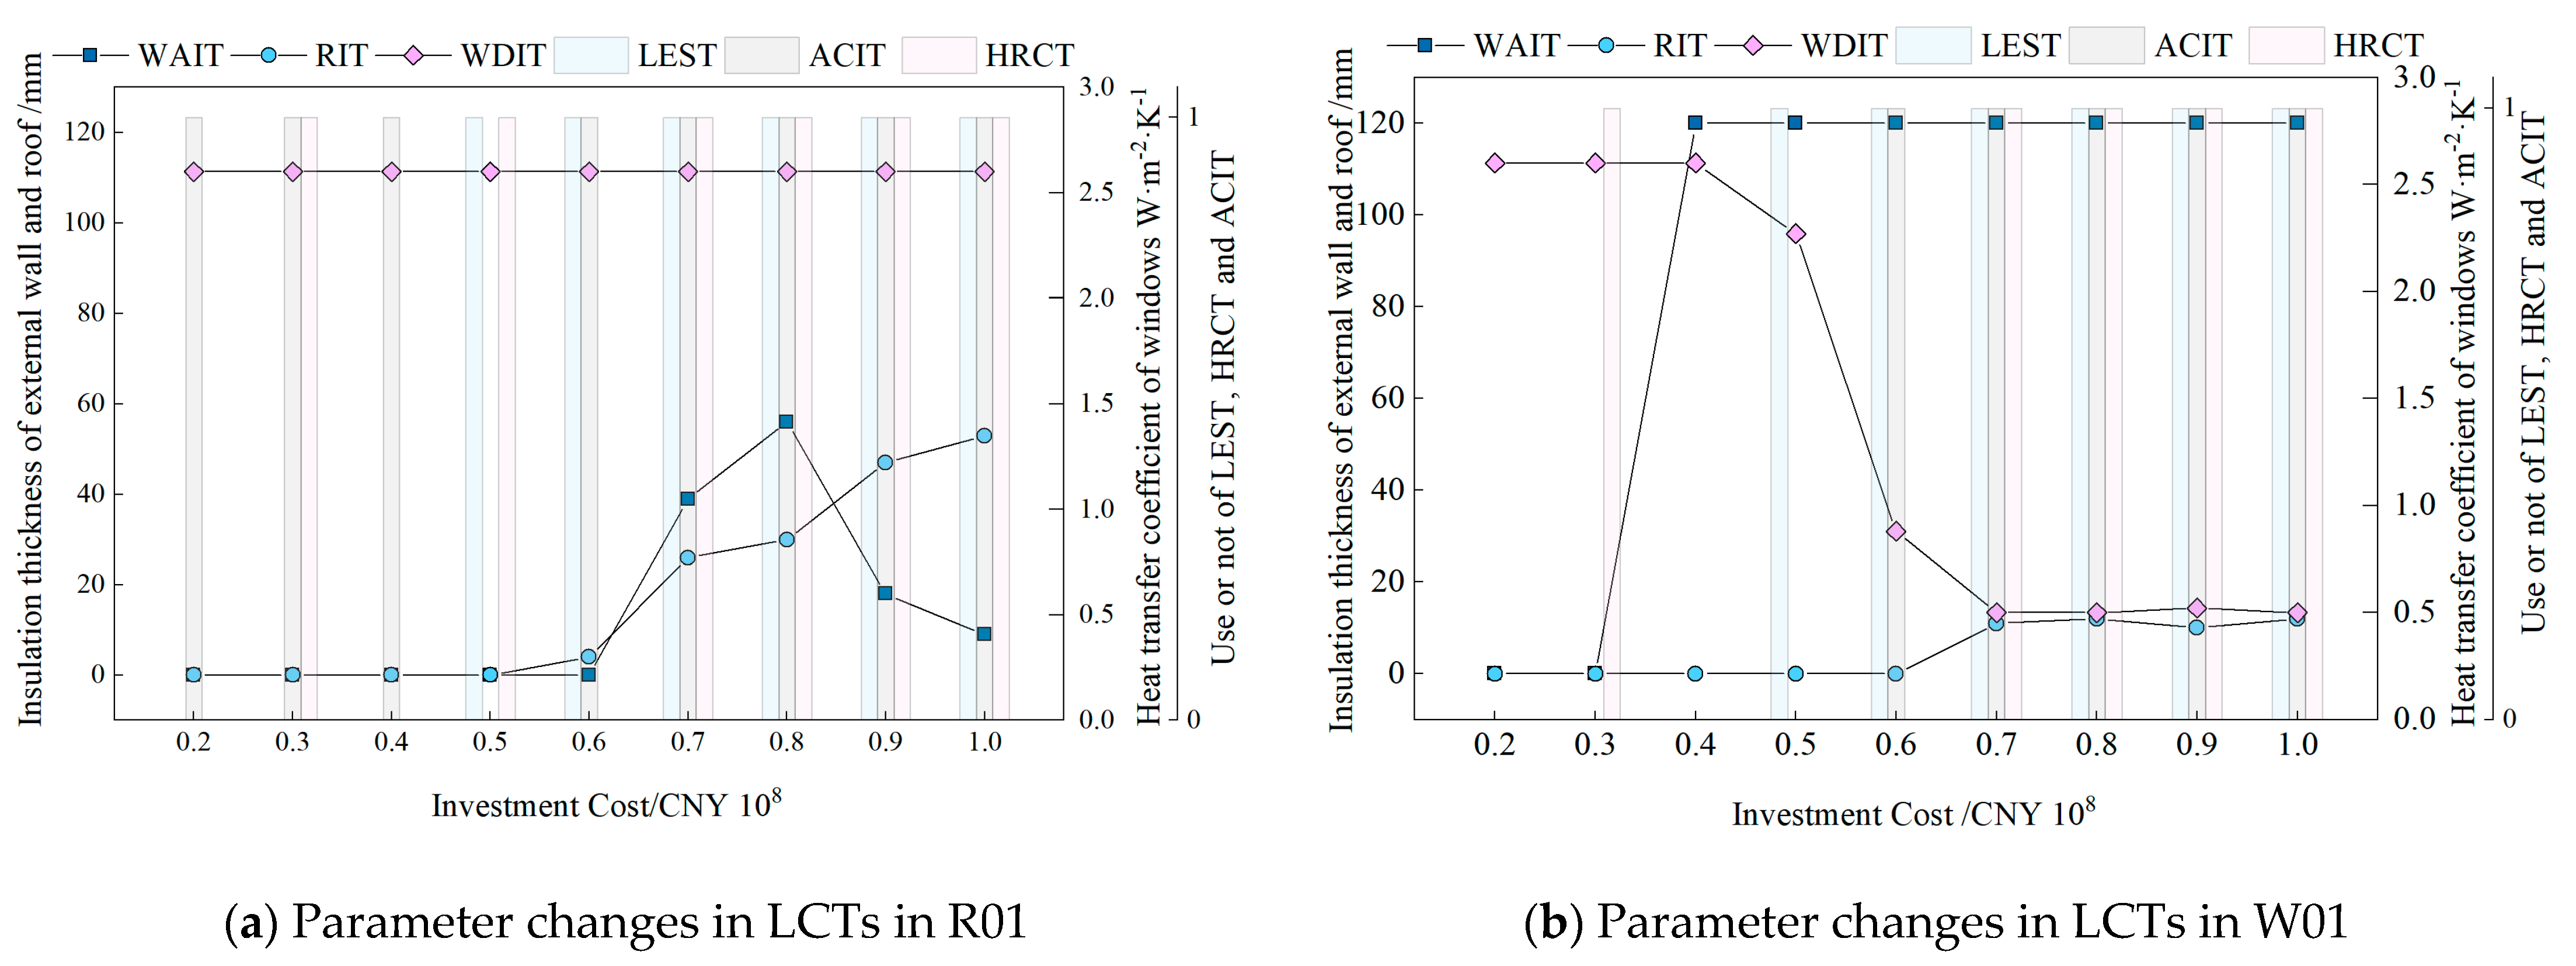
Based on the modeling results, the variation in the parameters of the carbon-reduction technologies with the investment cost in each building type was obtained separately, as shown in Figure 7.
As can be seen in Figure 7, there is a large difference in the variation in the parameters of the various types of LCT in the same type of building. With the increase in the investment cost, the priority of using various LCTs in different types of building is different. Changes in the technical parameters of the restaurant building R01 differ significantly from the other four types of office building. Changes in the technical parameters of the restaurant building R01 differ significantly from the other four types of office buildings. The other four types of office buildings have a relatively high priority for HRCT, but there are differences in the investment costs when the technology starts to be used.
For restaurant building R01, equipment energy efficiency upgrading technologies, such as ACIT and LEST, begin to be applied at an investment cost of CNY 30 million, indicating the high priority of this technology for restaurant buildings. In addition, the WDIT does not change with the investment cost, and remains at the initial value of 2.6. The RIT starts be applied when the investment reaches CNY 60 million.
For the low-rise enclosed office building W01, the first technologies configured are WAIT and HRCT and, when the investment cost reached CNY 40 million, the reduction in the window heat transfer coefficients begins. The parameters of the roof insulation technology do not change significantly with the investment cost.
For the high-rise enclosed office building W02, LEST, HRCT, and WDIT are the first technologies to be applied in the building, at a total investment cost of CNY 30 million. When the investment cost reaches CNY 70 million, with the exception of RIT, other LCTs are maximized.
For the low-rise “E” office building, the implementation of LCTs begins when the investment cost is CNY 50 million, with HRCT being the first technology to be implemented and, when the investment cost reached CNY 65 million, RIT and WAIT begin to be applied on a large scale, with all LCTs being maximized in the building when the total investment cost reaches CNY 10,000 million.
For the high-rise “E”-type office building, the first to be applied is the HRCT, and then, when the total investment reaches CNY 35 million, LEST and ACIT begin to be applied in the building, while the thermal performance improvement of the building envelope begins to be gradually configured when the total investment reaches CNY 70 million. By the time the total investment reaches CNY 105 million, all the LCTs are maximized in the building.
(3)
Variation in the configuration parameters of the same LCT in different buildings
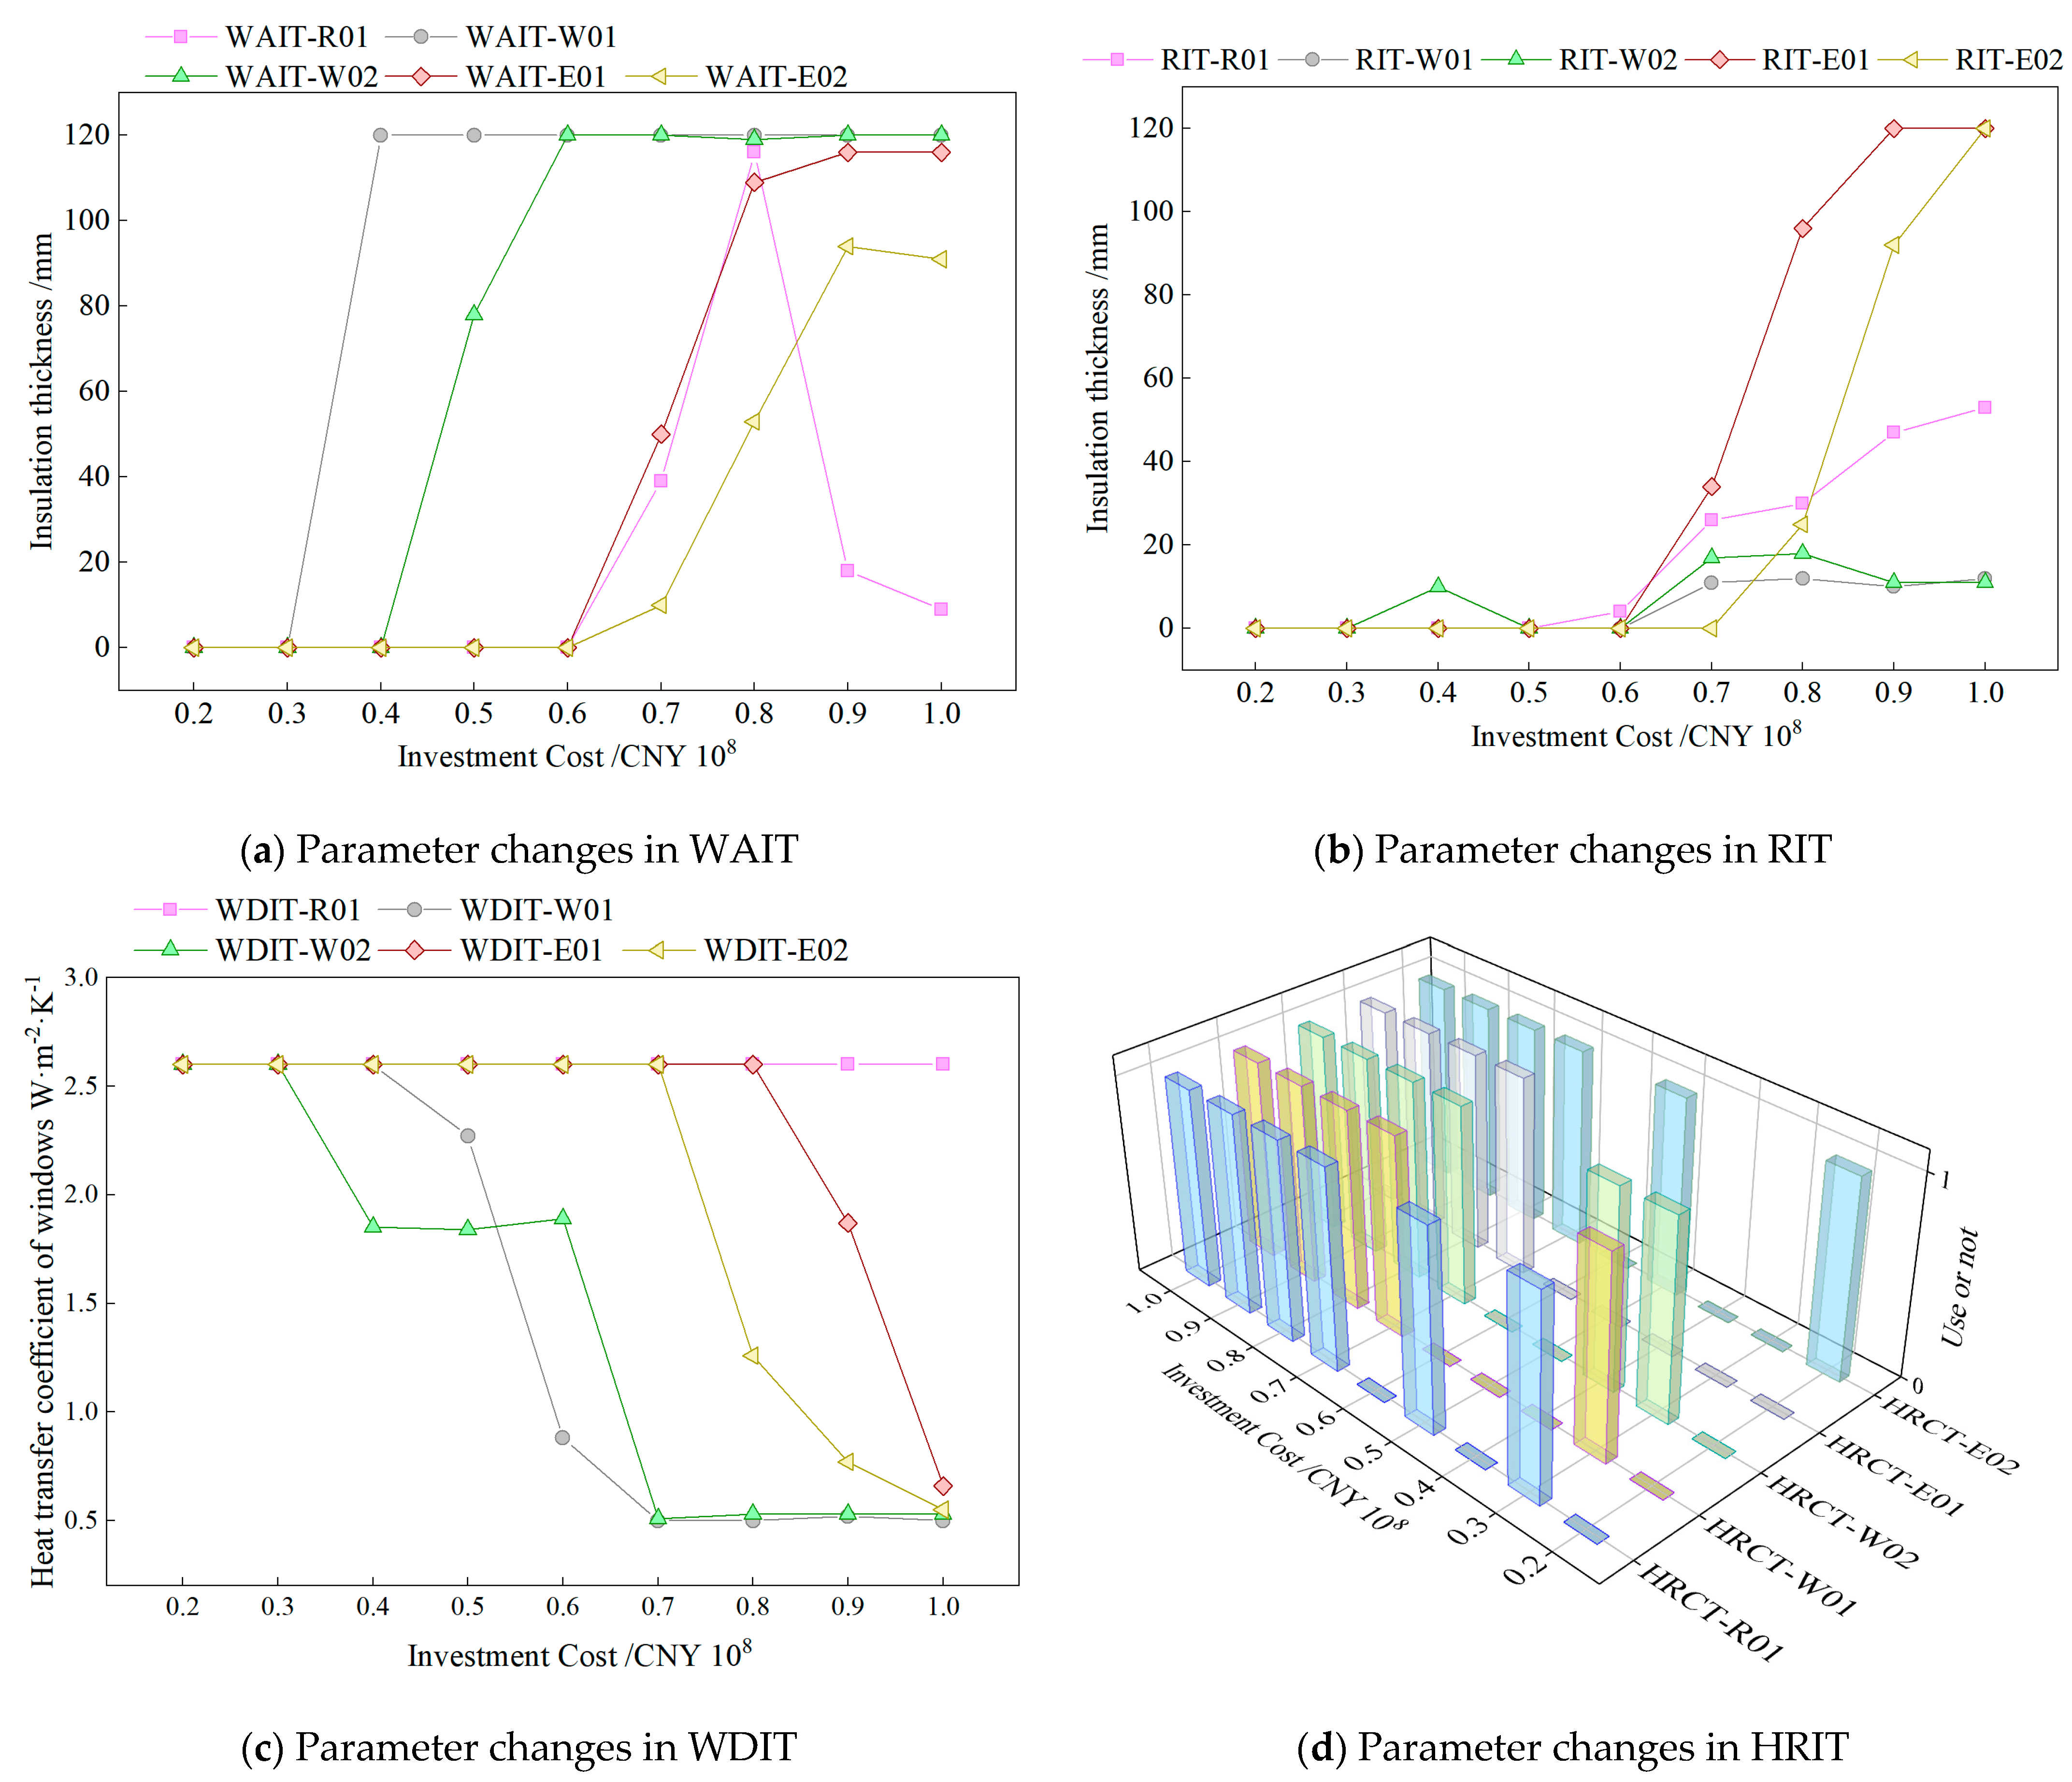
According to the results of the model calculations, the variation in the configuration parameters of the same carbon-reduction technology in different buildings, with the investment cost is obtained, as shown in Figure 8.
As can be seen in Figure 8, the same LCT is prioritized differently for use in different buildings, as investment costs increase.
For the WAIT, comparing its priority in different types of building, we can see that its application priority on enclosed office buildings is relatively higher, while its application priority on restaurant buildings is the lowest. Comparing W01 and W02, and E01 and E02, it can be found that, for the enclosed or “E” type of building, the priority of WAIT is higher for low-rise buildings than for high-rise buildings.
For the RIT, the technology only begins to be applied on a large scale when the investment cost is CNY 70 million, indicating that the technology has a low priority. From the comparison of its priority in different types of building, it can be seen that the technology in various types of building showed a priority of no significant difference. However, the technology in different types of building on the configuration parameters varies significantly; with the “E”-type office buildings E01 and E02 at the investment cost of CNY 100 million, the roof is set up with a thicker insulation layer, both 120 mm, while, at this point, the thickness of the roof insulation layer of the enclosed office buildings W01 and W02 is only 10 mm.
For the WDIT, comparing the priority of this technology on different types of building, it can be seen that the priority of the enclosed office buildings W01 and W02 is higher, the priority of the “E” buildings E01 and E02 is relatively lower, and there is no configuration of this technology for the restaurant building R01. Comparing W01 and W02, and E01 and E02, it can be found that, for enclosed or “E”-type buildings, the technology configuration priority of high-rise buildings is higher than that of low-rise.
For the HRCT, the technology begins to be applied when the total investment cost is CNY 20 million, indicating that the technology is prioritized higher. Through comparing its priority in different types of building, it can be seen that the difference in the priority of this technology in various types of building is small, and the priority in E02 buildings is relatively low.
For the ACIT, comparing its priority on different types of building, it can be seen that its priority is higher on the restaurant building R01, which starts to apply it when the total investment cost is CNY 20 million. Meanwhile, high-rise office buildings W02 and E02 start applying the technology at a total investment cost of CNY 50 million, and low-rise office buildings W01 and E01 start applying the technology at a total investment cost of CNY 60 million.
For the LEST, through comparing its priority in different types of building, it can be seen that there is no obvious difference in the priority of the technology in various types of building. At a total investment cost of about CNY 40 million, the technology starts to be applied in E02 and W02 and, when the total investment cost is CNY 50 million, the technology starts to be applied comprehensively in the park.

4.4. Analysis of Carbon-Reduction Benefits with Limited Cost

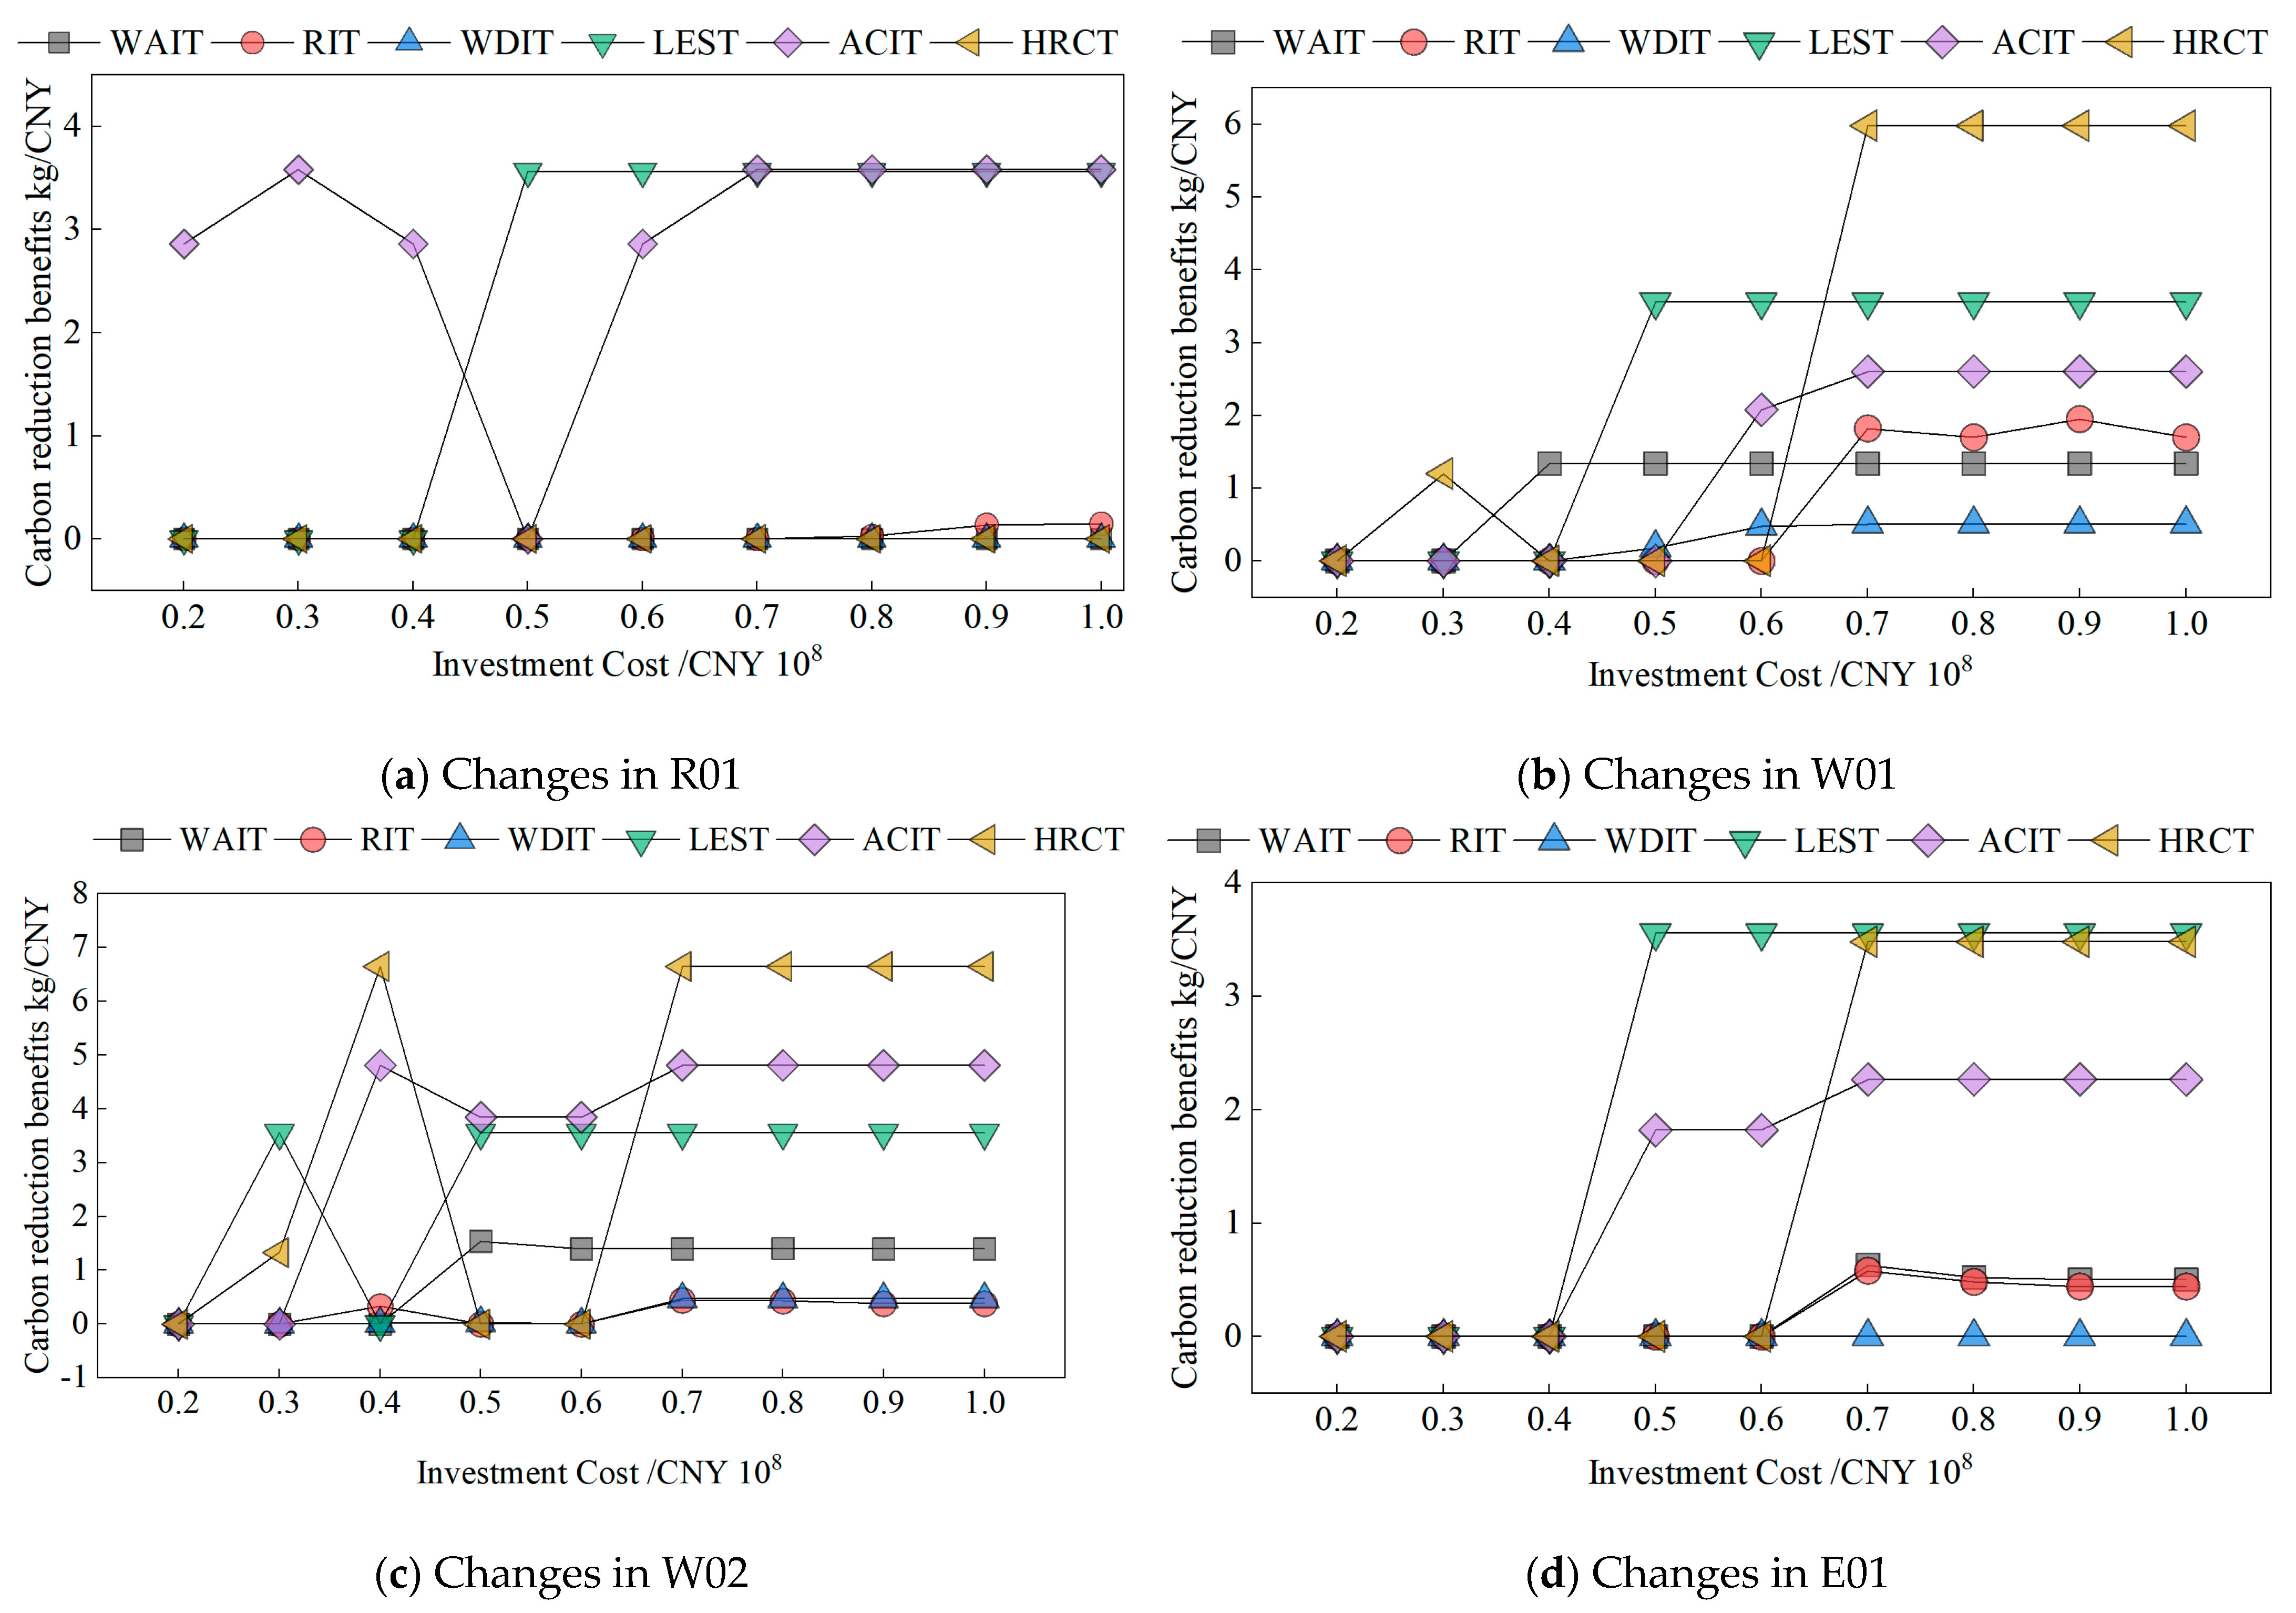
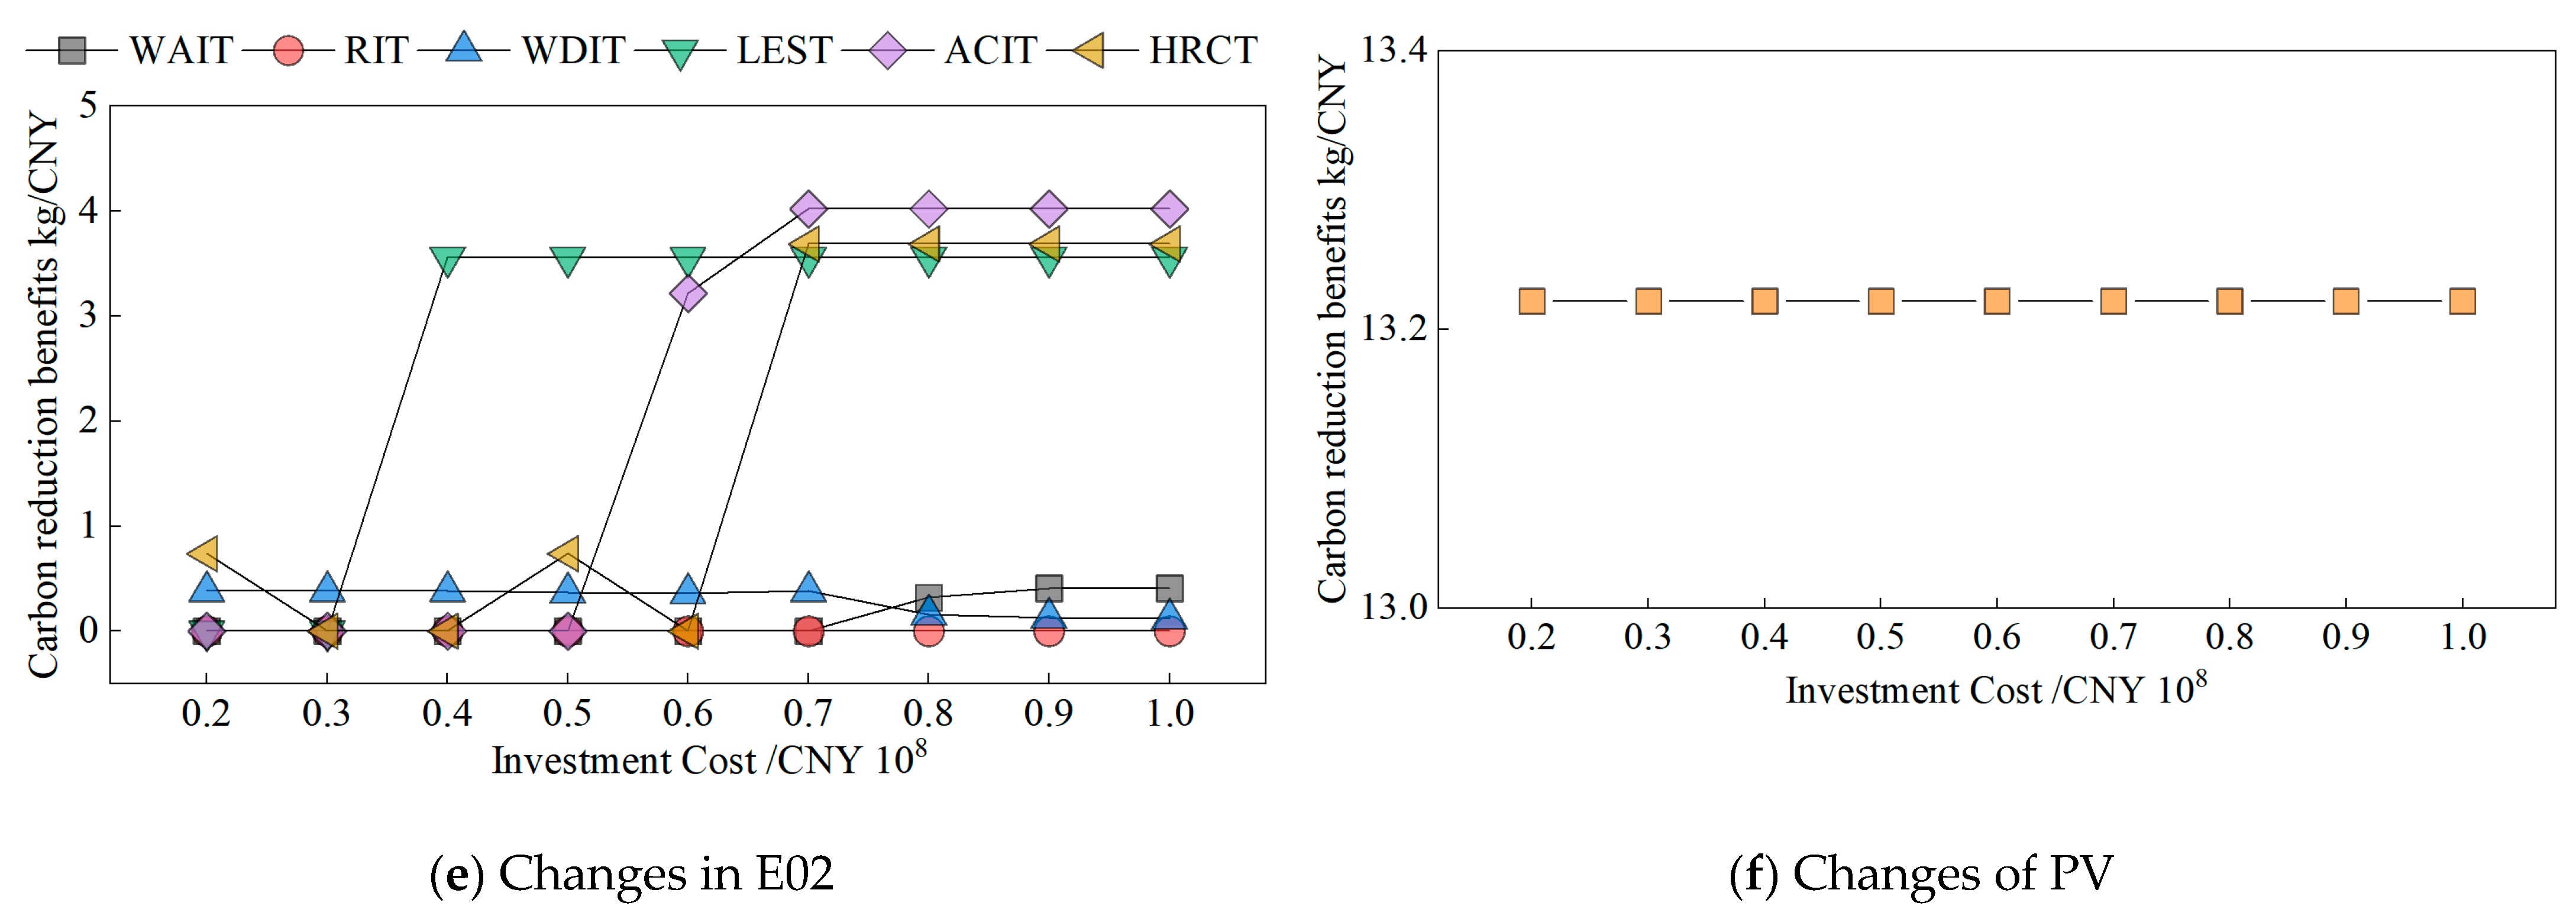
Based on the results of the optimization model calculations, the variation in the carbon-reduction benefits of each LCT with the investment cost in each type of building is obtained, as shown in Figure 9.
From Figure 9f, it can be seen that PVs have an outstanding carbon-reduction benefit of up to 13.22 kg CNY−1. Comparing Figure 9a–e, it can be seen that, with the increase in investment cost, the changes in the carbon-reduction benefits of various types of LCT in different types of building vary greatly.
Among them, there is a big difference in the change in the carbon-reduction benefit between restaurant building R01 and other types of building, as can be seen from Figure 9a: in the restaurant building R01, the ACIT and LEST have a high carbon-reduction benefit; at the investment cost of CNY 50–110 million, the building implements LEST, and the carbon-reduction benefit is 3.56 kg CNY−1; at the investment cost of CNY 70–110 million, the carbon-reduction benefit of ACIT is 3.58 kg CNY−1. The carbon-reduction benefit of the technology to enhance the thermal insulation performance of the envelope, such as WAIT and RIT, is 0 in this restaurant building.
For the four types of office buildings, HRCT, LEST, and ACIT have relatively higher carbon-reduction benefits, but the carbon-reduction benefits for different types of building have large differences. For example, the low-rise enclosed building W01, configured with HRCT, achieved a carbon-reduction benefit of 5.98 kg/CNY, and this result was 6.65, 3.48, and 3.69 kg CNY−1 for W02, E01, and E02, respectively. This shows that the carbon-reduction benefit of those technologies in enclosed buildings is higher than that in “E”-type buildings; the maximum carbon-reduction benefit achieved by the ACIT in low-rise buildings W01 and E01 is 2.6 and 2.27 kg CNY−1 respectively, while the maximum carbon-reduction benefit achieved in high-rise buildings W02 and E02 is 4.82, 4.02 kg CNY−1 respectively, indicating that the carbon-reduction benefit of high-rise buildings is higher than that of low-rise buildings.

5. Conclusions

This paper establishes a comprehensive optimization model for the retrofit of building-equipment-renewable-energy-systems in existing office parks, with the goal of maximizing the carbon reduction over the whole life cycle. Based on the modeling results, the maximum carbon reduction achievable in the park and the corresponding maximum investment cost are obtained. By setting different investment cost constraints, the maximum carbon reduction and the change in building-equipment-renewable-energy-system configuration parameters with the increase in investment cost are obtained. Based on the analysis of the carbon-reduction benefits and the prioritization of various LCTs in the different types of building in the park, the main conclusions are as follows:
① With the increase in investment cost, the carbon reduction of the park increases gradually, but non-linearly. When the total investment cost of the park is below CNY 60 million, the carbon reduction increases faster with the investment cost, but as the investment cost continues to increase, the trend of increasing carbon reduction gradually decreases, and when the investment cost reaches CNY 103 million, the park achieves the maximum carbon reduction of 236,087 t. Up to this point, the carbon reduction of the park will not increase with the investment.
② By analyzing the change in parameters of different LCTs with investment costs in various types of building, we can see that, overall, the changes in the technical parameters of restaurant buildings are significantly different from those of office buildings. The decarbonization retrofit of the restaurant is more suitable for the equipment energy efficiency improvement technology, not for the thermal performance improvement technology of the building envelope. In office buildings, both the equipment energy efficiency improvement and thermal performance improvement technologies for the building envelope are applicable, but equipment retrofitting is prioritized over the building envelope. It is worth noting that the same technology is prioritized differently in different types of building; e.g., WAIT is prioritized more highly in enclosed buildings than in “E” buildings.
③ An analysis of the carbon-reduction benefits of different LCTs in different building types found that, overall, the carbon-reduction benefits of all LCTs were higher in high-rise buildings than in low-rise buildings, higher in office buildings than in restaurants, and higher in enclosed buildings than in E-type buildings. In addition, the carbon-reduction benefits of different LCTs in the same type of building varied considerably and, overall, retrofitting equipment and renewable energy systems had better carbon-reduction benefits than retrofitting the thermal performance of the building envelope.
④ The optimal configuration of the building-equipment–renewable-energy-system retrofit in the park with the change in investment cost has a large difference. The paper gives the configuration parameters of each low-carbon technology in different types of building in an office park in Nanchang City with the increase in investment cost, but in other office parks, with different building compositions as well as climatic zones, the specific parameter settings of the optimal configuration scheme under different investment cost constraints should be determined based on the results of the modeling calculations.
This paper establishes an optimal configuration model for building-equipment–renewable-energy-system retrofits based on the relationship between investment cost, energy consumption, and carbon emissions in the park. It provides a reference for the design of low-carbon retrofits of existing parks. However, this paper does not take the guidance of building design on users’ autonomous energy-saving behaviors into account in the establishment of the model, and the model needs to be further optimized in future research.

Author Contributions

Conceptualization, Z.D. and L.J.; methodology, Y.C.; software, Y.C.; validation, Z.H., Z.D. and L.J.; formal analysis, Z.H.; investigation, Z.H.; data curation, Y.C.; writing—original draft preparation, Y.C.; writing—review and editing, L.J.; visualization, Y.C.; funding acquisition, Z.D. All authors have read and agreed to the published version of the manuscript.

Funding

This research was funded by the science and technology project of State Grid Corporation of China: entitled “Research and Demonstration of Key Technologies for the Implementation of Zero Carbon Park Based on Flexible Resource Carbon Control of Cold, Heat and Electricity” (grant number 5400-202325227A-1-1-ZN).

Data Availability Statement

The data used to support the findings of this study are included in the article.

Acknowledgments

Many thanks to State Grid Corporation of China for providing the research funding.

Conflicts of Interest

The authors declare no conflict of interest.

References

  1. Dong, F.; Yu, B.; Hadachin, T.; Dai, Y.; Wang, Y.; Zhang, S.; Long, R. Drivers of carbon emission intensity change in China. Resour. Conserv. Recycl. 2018, 129, 187–201. [Google Scholar] [CrossRef]
  2. Liu, Q.; Zhang, W.; Yao, M.; Yuan, J. Carbon emissions performance regulation for China’s top generation groups by 2020: Too challenging to realize? Resour. Conserv. Recycl. 2017, 122, 326–334. [Google Scholar] [CrossRef]
  3. Yin, H.; Zhou, X. Research on Low-Carbon Development Model of Domestic and Overseas Typical Cities and Parks. Shanghai Energy Sav. 2022, 04, 363–369. [Google Scholar]
  4. IPCC. 2019 Refinement to the 2006 IPCC Guidelines for National Greenhouse Gas Inventory; IPCC: Geneva, Switzerland, 2019. [Google Scholar]
  5. Song, Z.; Liu, T.; Liu, Y.; Jiang, X.; Lin, Q. Study on the optimization and sensitivity analysis of CCHP systems for industrial park facilities. Int. J. Electr. Power Energy Syst. 2020, 120, 105984. [Google Scholar] [CrossRef]
  6. Wu, D.; Han, S.; Wang, L.; Li, G.; Guo, J. Multi-parameter optimization design method for energy system in low-carbon park with integrated hybrid energy storage. Energy Convers. Manag. 2023, 291, 117265. [Google Scholar] [CrossRef]
  7. Wang, Y.; Li, R.; Dong, H.; Ma, Y.; Yang, J.; Zhang, F.; Li, S. Capacity planning and optimization of business park-level integrated energy system based on investment constraints. Energy 2019, 189, 116345. [Google Scholar] [CrossRef]
  8. Guo, W.; Wang, Q.; Liu, H.; Desire, W.A. Multi-energy collaborative optimization of park integrated energy system considering carbon emission and demand response. Energy Rep. 2023, 9, 3683–3694. [Google Scholar] [CrossRef]
  9. Luo, Z.; Lu, Y.; Cang, Y.; Yang, L. Study on dual-objective optimization method of life cycle energy consumption and economy of office building based on HypE genetic algorithm. Energy Build. 2022, 256, 111749. [Google Scholar] [CrossRef]
  10. Fesanghary, M.; Asadi, S.; Geem, Z.W. Design of low-emission and energy-efficient residential buildings using a multi-objective optimization algorithm. Build. Environ. 2012, 49, 245–250. [Google Scholar] [CrossRef]
  11. Ferrara, M.; Fabrizio, E.; Virgone, J.; Filippi, M. A simulation-based optimization method for cost-optimal analysis of nearly Zero Energy Buildings. Energy Build. 2014, 84, 442–457. [Google Scholar] [CrossRef]
  12. Gerber, D.J.; Pantazis, E.; Wang, A. A multi-agent approach for performance based architecture: Design exploring geometry, user, and environmental agencies in façades. Autom. Constr. 2017, 76, 45–58. [Google Scholar] [CrossRef] [Green Version]
  13. Yigit, S.; Ozorhon, B. A simulation-based optimization method for designing energy efficient buildings. Energy Build. 2018, 178, 216–227. [Google Scholar] [CrossRef]
  14. Tuhus-Dubrow, D.; Krarti, M. Genetic-algorithm based approach to optimize building envelope design for residential buildings. Build. Environ. 2010, 45, 1574–1581. [Google Scholar] [CrossRef]
  15. Carli, R.; Dotoli, M.; Pellegrino, R.; Ranieri, L. Using multi-objective optimization for the integrated energy efficiency improvement of a smart city public buildings’ portfolio. In Proceedings of the 2015 IEEE International Conference on Automation Science and Engineering (CASE), Gothenburg, Sweden, 24–28 August 2015; IEEE: New York, NY, USA; pp. 21–26. [Google Scholar]
  16. Chantrelle, F.P.; Lahmidi, H.; Keilholz, W.; El Mankibi, M.; Michel, P. Development of a multicriteria tool for optimizing the renovation of buildings. Appl. Energy 2011, 88, 1386–1394. [Google Scholar] [CrossRef]
  17. Petkov, I.; Mavromatidis, G.; Knoeri, C.; Allan, J.; Hoffmann, V.H. MANGOret: An optimization framework for the long-term investment planning of building multi-energy system and envelope retrofits. Appl. Energy 2022, 314, 118901. [Google Scholar] [CrossRef]
  18. Abdou, N.; El Mghouchi, Y.; Hamdaoui, S.; Mhamed, M. Optimal Building Envelope Design and Renewable Energy Systems Size for Net-zero Energy Building in Tetouan (Morocco). In Proceedings of the 2021 9th International Renewable and Sustainable Energy Conference (IRSEC), Tetouan, Morocco, 28 March 2022. [Google Scholar]
  19. Lin, Y.H.; Lin, M.D.; Tsai, K.T.; Deng, M.J.; Ishii, H. Multi-objective optimization design of green building envelopes and air conditioning systems for energy conservation and CO2 emission reduction. Sust. Cities Soc. 2021, 64, 102555. [Google Scholar] [CrossRef]
  20. Bichiou, Y.; Krarti, M. Optimization of envelope and HVAC systems selection for residential buildings. Energy Build. 2011, 43, 3373–3382. [Google Scholar] [CrossRef]
  21. Hashempour, N.; Taherkhani, R.; Mahdikhani, M. Energy performance optimization of existing buildings: A literature review. Sustain. Cities Soc. 2020, 54, 101967. [Google Scholar] [CrossRef]
  22. Mela, K.; Tiainen, T.; Heinisuo, M. Comparative study of multiple criteria decision making methods for building design. Adv. Eng. Inform. 2012, 26, 716–726. [Google Scholar] [CrossRef]
  23. Shan, W. Research on Low-Carbon Design of High-Tech Park Office Building under Ecological Concept. Master’s Thesis, Nanchang Hangkong University, Nanchang, China, 2020. [Google Scholar]
  24. Zhu, J. Study on the Low Carbon Design Strategy of the Office Building of High-Tech Park. Master’s Thesis, Huazhong University of Science and Technology, Wuhan, Chian, 2012. [Google Scholar]
  25. Huang, B.; Jiang, P.; Wang, S.; Zhao, J.; Wu, L. Low carbon innovation and practice in Caohejing high-tech industrial park of Shanghai. Int. J. Prod. Econ. 2016, 181, 367–373. [Google Scholar] [CrossRef]
  26. Wang, Z.; Guo, H.; Wang, S.; Meng, F. Analysis of building energy consumption and discussion on energy-saving reform in an office park. Archit. Technol. 2020, 51, 670–672. [Google Scholar]
  27. Sun, J. Methodology of Integrated Planning Toward Urban Block-Level Carbon Reduction. Urban Plan. Forum 2022, 6, 102–109. [Google Scholar]
  28. Xiao, H.; Wei, Q.; Wang, H. Marginal abatement cost and carbon reduction potential outlook of key energy efficiency technologies in China’s building sector to 2030. Energy Policy 2014, 69, 92–105. [Google Scholar] [CrossRef]
  29. Guo, W.; Qiao, X.; Huang, Y.; Fang, M.; Han, X. Study on energy saving effect of heat-reflective insulation coating on envelopes in the hot summer and cold winter zone. Energy Build. 2012, 50, 196–203. [Google Scholar] [CrossRef]
  30. Ye, X.; Chen, D. Thermal insulation coatings in energy saving. In Energy-Efficient Approaches in Industrial Applications; IntechOpen: London, UK, 2018. [Google Scholar]
  31. Liu, Z.; Liu, Y.; He, B.J.; Xu, W.; Jin, G.; Zhang, X. Application and suitability analysis of the key technologies in nearly zero energy buildings in China. Sustain. Energy Rev. 2019, 101, 329–345. [Google Scholar] [CrossRef]
  32. Liu, Y.; Xue, S.; Guo, X.; Zhang, B.; Sun, X.; Zhang, Q.; Dong, Y. Towards the goal of zero-carbon building retrofitting with variant application degrees of low-carbon technologies: Mitigation potential and cost-benefit analysis for a kindergarten in Beijing. J. Clean. Prod. 2023, 393, 136316. [Google Scholar] [CrossRef]
  33. Tang, J.; Cai, X.; Li, H. Study on development of low-carbon building based on LCA. Energy Procedia 2011, 5, 708–712. [Google Scholar] [CrossRef] [Green Version]
Figure 1. Optimization flow chart.
Processes 11 02452 g001
Figure 2. Effective diagram of the park.
Processes 11 02452 g002
Figure 3. Carbon-reduction benefits of different LCTs in different types of building.
Processes 11 02452 g003
Figure 4. Carbon-reduction benefits of various building types.
Processes 11 02452 g004
Figure 5. Carbon-reduction benefits of various low-carbon technologies.
Processes 11 02452 g005
Figure 6. Variation in the total carbon reduction with the investment cost.
Processes 11 02452 g006
Figure 7. Variation in the parameters of different carbon-reduction technologies with the investment cost in each type of building.
Processes 11 02452 g007aProcesses 11 02452 g007b
Figure 8. Parameter changes with investment costs for each LCT.
Processes 11 02452 g008aProcesses 11 02452 g008b
Figure 9. Carbon-reduction benefits of various LCTs in each building type changing with the investment cost.
Processes 11 02452 g009aProcesses 11 02452 g009b
Table 1. Technical indicators for each type of building in the park.
BuildingNumberIndividual Building Area/m2No. of FloorsWindow–Wall RatioRoof Area/m2External Wall Area/m2External Window Area/m2The Area of East, West, and South External Wall/m2
R01123,15020.811,575120048001200
W014208860.33348522327122717
W02133,480100.33348870546874528
E01422,90260.33817716038564086
E02138,170100.3381711,93364276809
Table 2. Optimized variable settings.
BuildingBuilding EnvelopeUse or Not of Heat Reflective Coating Technology k i , 4 Use or Not of HVAC Intelligent Control Technology k i , 5 Use or Not of Lighting Energy-Saving Technology k i , 6 PV Area
k 7
Thickness of Roof Insulation k i , 1 Thickness of External Wall Insulation k i , 2 Heat Transfer Coefficient of Windows k i , 3
R01 k 1 , 1 k 1 , 2 k 1 , 3 k 1 , 4 k 1 , 5 k 1 , 6 k 7
W01 k 2 , 1 k 2 , 2 k 2 , 3 k 2 , 4 k 2 , 5 k 2 , 6
W02 k 3 , 1 k 3 , 2 k 3 , 3 k 3 , 4 k 3 , 5 k 3 , 6
E01 k 4 , 1 k 4 , 2 k 4 , 3 k 4 , 4 k 4 , 5 k 4 , 6
E02 k 5 , 1 k 5 , 2 k 5 , 3 k 5 , 4 k 5 , 5 k 5 , 6
Table 4. Low-carbon technology variable settings.
BuildingOptimization VariablesUnitRangeStep
R01, W01, W02, E01, E02Thickness of external wall insulationmm[0, 120]10
Thickness of roof insulationmm[0, 120]10
Heat transfer coefficient of windowsW m−2 K−1[0.5, 2.6]0.5
Use or not of heat-reflective coating technology/0/1\
Use or not of lighting-energy-saving technology/0/1\
Use or not of HVAC intelligent control technology/0/1\
ParkPV aream2[0, 33, 180]1
Table 5. The quantitative relationship between each optimization variable and its carbon reduction in the operation stage.
BuildingLow-Carbon TechnologyRelationship Equation between Optimization Variables and Carbon Reduction in the Operational PhaseEquation No.
R01External wall insulation E o p , 1 , 1 k 1 , 1 = 5 × 10 5 × k 1 , 1 2 0.0089 × k 1 , 1 17.91 × A 1 (24)
Roof insulation E o p , 1 , 2 k 1 , 2 = 4.3 × 10 3 × k 1 , 2 2 0.62 × k 1 , 2 + 13.49 × A 1 (25)
External window insulation E o p , 1 , 3 k 1 , 3 = 30.32 × k 1 , 3 + 57 × A 1 (26)
W01External wall insulation E o p , 2 , 1 k 2 , 1 = 5 × 10 5 × k 2 , 1 2 0.0089 × k 2 , 1 + 138.09 × A 2 (27)
Roof insulation E o p , 2 , 2 k 2 , 2 = 0.01 × k 2 , 2 2 0.28 × k 2 , 2 3.15 × A 2 (28)
External window insulation E o p , 2 , 3 k 2 , 3 = 51.38 × k 2 , 3 140.02 × A 2 (29)
W02External wall insulation E o p , 3 , 1 k 3 , 1 = 3.1 × 10 3 × k 3 , 1 2 1.09 × k 3 , 1 + 16.23 × A 3 (30)
Roof insulation E o p , 3 , 2 k 3 , 2 = 0.01 × k 3 , 2 2 0.29 × k 3 , 2 + 1.61 × A 3 (31)
External window insulation E o p , 3 , 3 k 3 , 3 = 76.96 × k 3 , 3 148.04 × A 3 (32)
E01External wall insulation E o p , 4 , 1 k 4 , 1 = 1.1 × 10 3 × k 4 , 1 2 0.39 × k 4 , 1 + 0.64 × A 4 (33)
Roof insulation E o p , 4 , 2 k 4 , 2 = 4 × 10 4 × k 4 , 2 2 0.17 × k 4 , 2 0.17 × A 4 (34)
External window insulation E o p , 4 , 3 k 4 , 3 = 13.39 × k 4 , 3 36.8 × A 4 (35)
E02External wall insulation E o p , 5 , 1 k 5 , 1 = 1.4 × 10 3 × k 5 , 1 2 0.48 × k 5 , 1 + 12.59 × A 5 (36)
Roof insulation E o p , 5 , 2 k 5 , 2 = 4 × 10 4 × k 4 , 2 2 0.16 × k 4 , 2 + 23.86 × A 5 (37)
External window insulation E o p , 5 , 3 k 5 , 3 = 41.26 × k 5 , 3 48.76 × A 5 (38)
Note: i = 1, 2, … 5 are denoted as restaurant R01, low-rise enclosed building W01, high-rise enclosed building W02, low-rise “E” building E01, and high-rise “E” building E02, respectively; j = 1, 2, 3 denotes the external wall insulation, roof insulation, and external window insulation, respectively.
Table 6. Parameter configurations for LCTs at infinite cost.
BuildingR01W01W02E01E02
Building envelopeThe thickness of the roof insulation/mm711919120120
The thickness of the external wall insulation/mm0120120120120
Heat transfer coefficient of the windows/W m−2 K−1 2.60.50.50.50.5
Use or not of heat-reflective coating technology01111
Use or not of HVAC intelligent control technology11111
Use or not of lighting-energy-saving technology11111
Whole-life carbon reductions for different building types/t8462958016,064730112,405
PV area/m233,180
Whole-life-cycle carbon reduction by PV/t131,627
Total life-cycle carbon reduction of the park/t236,087
Total investment/CNY 10,00010,300
Disclaimer/Publisher’s Note: The statements, opinions and data contained in all publications are solely those of the individual author(s) and contributor(s) and not of MDPI and/or the editor(s). MDPI and/or the editor(s) disclaim responsibility for any injury to people or property resulting from any ideas, methods, instructions or products referred to in the content.