1. Introduction
The sewer pipeline system is one of the important components of urban infrastructure construction and an important guarantee for maintaining the cleanliness and hygiene of cities [
1]. With the increase in the service time of pipelines, some sections may develop defects such as misalignment and rupture. In order to ensure the normal operation of the pipeline network, the municipal government invests a lot of manpower and resources every year to carry out daily inspections and maintenance work on it.
Currently, closed-circuit television (CCTV) inspection is the most extensively employed method for pipeline inspection globally [
2]. The process of CCTV inspection comprises two stages, namely, on-site video information collection and off-site evaluation. On-site video is collected using either pipeline cameras or robots and is submitted to experts for evaluation. Finally, manual inspection reports are provided by the experts [
3]. However, in the process of manual evaluation, there are many factors that can lead to inaccurate results and low efficiency, such as different levels of technical expertise among personnel, varying video quality, and excessive workload.
The development of deep learning technology has brought about many remarkable object detection algorithms in the field, such as Fast R-CNN [
4], SSD [
5], YOLO [
6,
7,
8,
9], etc. These algorithms have surpassed traditional computer vision detection techniques in terms of detection accuracy and speed in various application scenarios. The YOLO models have demonstrated their excellent detection performance in a variety of fields. Sergio and Abdussalam [
10] conducted an investigation into the correlation between image size, training time, and the performance of YOLO series models, resulting in the successful detection of a vehicle dataset. Furthermore, Yang et al. [
11] employed YOLOv5 for defect detection in steel pipe welds. In recent years, some scholars have applied deep learning technology to the field of pipeline defect detection. Srinath et al. [
12] used YOLOv3 as the detection network to locate defects such as tree roots and sediment in pipelines, and compared it with other detection models. Tan et al. [
13] utilized Mosaic data augmentation on top of YOLOv3, introduced generalized intersection over union (GIOU), and employed adaptive anchor boxes. Chanmi et al. [
14] utilized YOLOv5 as the architecture and incorporated a small object detection layer while introducing attention mechanisms to enhance the detection accuracy of small objects.
Despite the outstanding achievements of the aforementioned models, it is important to note that they are predominantly proposed based on non-field evaluations, overlooking the challenges linked to on-site video collection. Limitations in device computational power, among other factors, can hinder the deployment of these models. Additionally, video quality holds significant importance as a contributing factor to detection performance. Moreover, persisting challenges such as weak lighting conditions and complex background structures within the pipelines pose difficulties in identifying specific defects. Hence, further research is warranted to tackle concerns such as model lightweighting and enhancing detection accuracy.
The aim of the paper is to present a novel enhanced detection model, built upon YOLOv5, aimed at mitigating the challenges prevalent in existing object detection models. The proposed model specifically tackles issues such as suboptimal accuracy, high parameter and computational complexity, excessive memory consumption due to large model weights, and constraints associated with deploying on mobile devices.
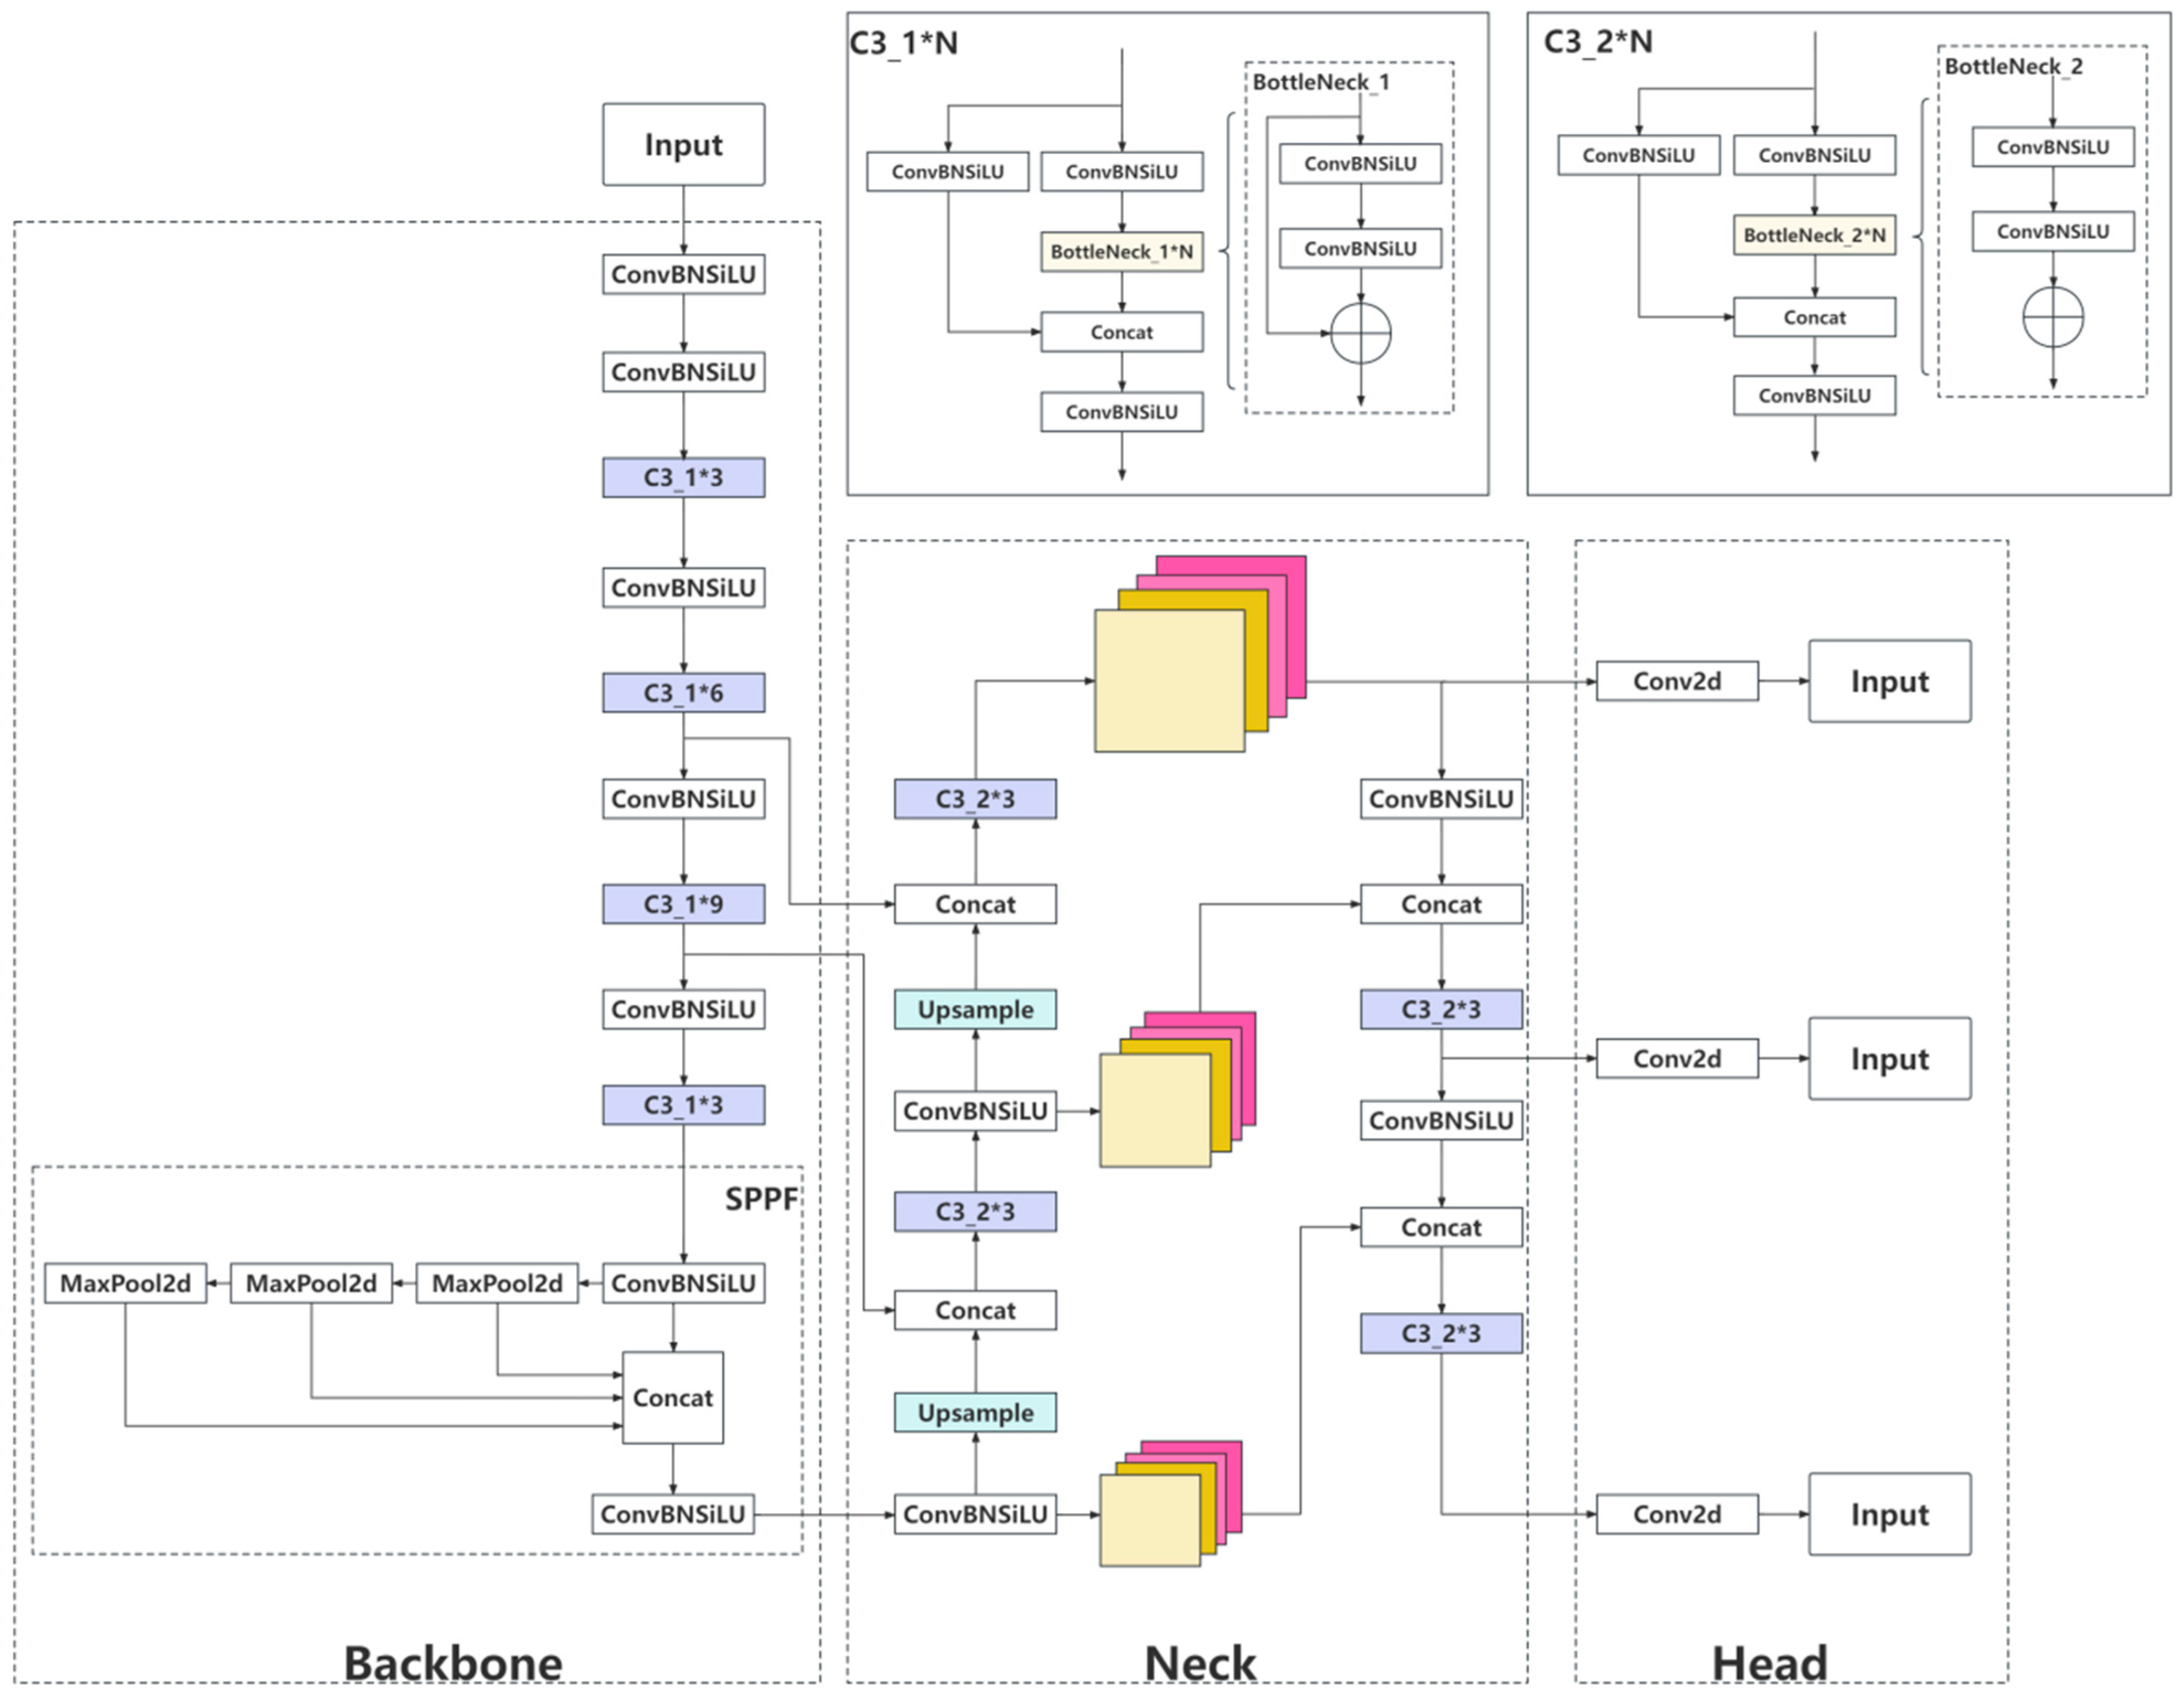
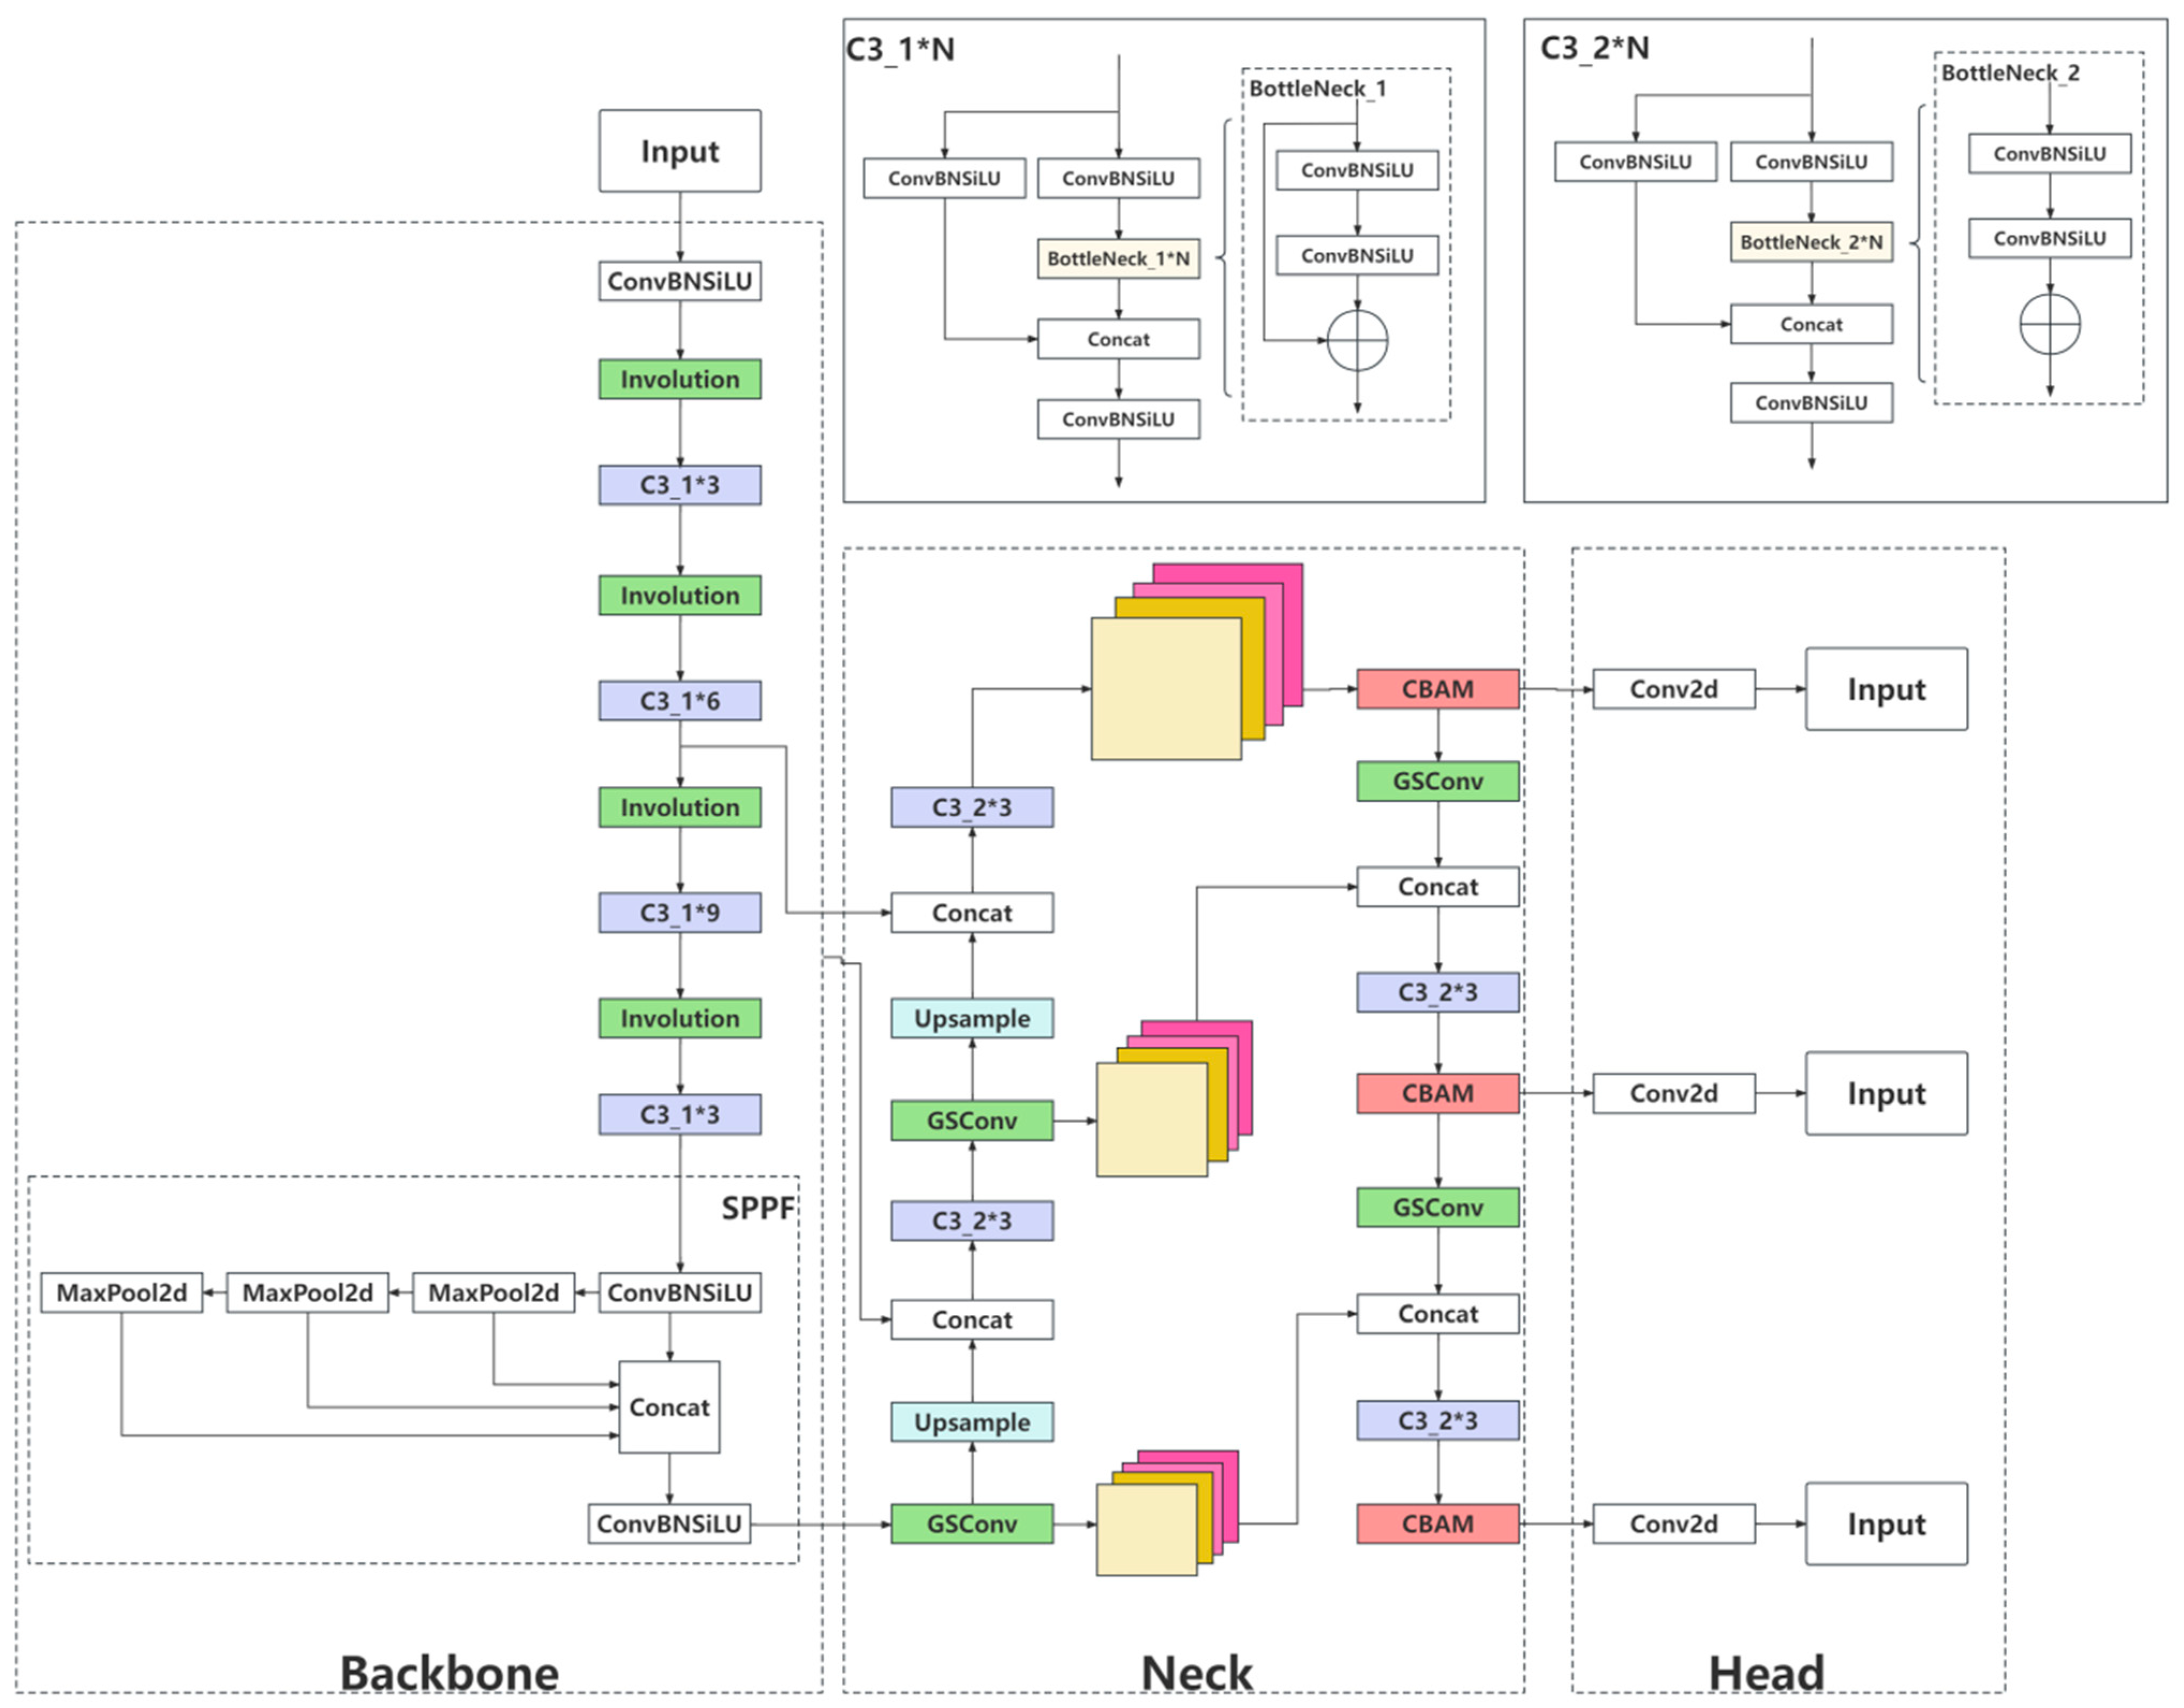
In this study, the YOLOv5s model is selected as the foundational detection network. To facilitate efficient deployment, the main network incorporates the Involution [
15] operator, while the feature fusion network adopts the GSConv [
16] technique to construct a lightweight network structure. Furthermore, to mitigate the effects of challenging factors such as weak lighting and complex backgrounds in pipeline environments on detection accuracy, the CBAM [
17] attention mechanism is introduced in the feature fusion network to effectively integrate semantic features across different network layers, thereby augmenting the detection accuracy. Lastly, knowledge distillation [
18] is employed, utilizing YOLOv5m as the teacher network, to distill the improved model and further enhance its accuracy and generalization capabilities.
The contributions of this paper can be summarized as follows:
- (1)
In light of the limitations associated with current pipeline defect detection methods, an enhanced YOLOv5 model is presented in this study. This model strikes a fine balance between lightweight architecture and detection accuracy, thereby facilitating its effective deployment for on-site sewer pipeline defect detection tasks.
- (2)
Based on the model’s detection accuracy, a comparative analysis is conducted to evaluate the effects of three distinct attention mechanisms, namely SE [
19], CA [
20], and CBAM, on the precision of the improved model. Heatmaps are employed to visually illustrate the regions of interest captured by each attention mechanism. Furthermore, ablation experiments are carried out to examine the impact of different enhancement modules on the detection performance of the network.
- (3)
The experimental findings unequivocally establish the superior detection accuracy of the enhanced YOLOv5 model in comparison to its original counterpart. Moreover, the improved model showcases reduced parameter and computational complexity, thereby satisfying the real-time detection prerequisites essential for on-site scenarios.
3. Methods
3.1. Involution
Convolution exhibits two fundamental properties: spatial invariance and channel specificity, which enable it to fully exploit the translational equivariance of visual features and the modeling information between channels. Nonetheless, these properties can also restrict the modeling capability of convolution kernels in various spatial positions and result in a substantial computational and parameter cost due to the non-sharing of parameters between channels. Thus, the involution operator is proposed as having opposite characteristics to the convolution operator, specifically spatial specificity and channel invariance. By sharing parameters between channels, the involution operator can reduce the number of parameters and computational complexity.
The involution operator partitions the number of feature channels into
groups, where each group shares one kernel and different kernels are used for different spatial coordinates. The size of the involution kernel can be represented as
, and the output feature map of the involution operator can be denoted by Equation (1):
In this equation,
represents the input feature map,
represents the output feature map,
is the kernel vector of the involution operator,
represents the entire pixel coordinate space,
denotes the number of shared groups within a channel, and
represents the set of offset values for the neighborhood of the central pixel convolution. Unlike convolution, the involution kernel is dynamically generated based on the input features. Specifically, the input feature map
is mapped to form a dynamic convolution kernel, which can be expressed in a general form using Equation (2):
represents the input feature map at pixel point
,
denotes the kernel generation function of the involution operator,
and
represent two linear transformations, and the inter-channel dimension is controlled by the downsampling ratio
for efficient processing.
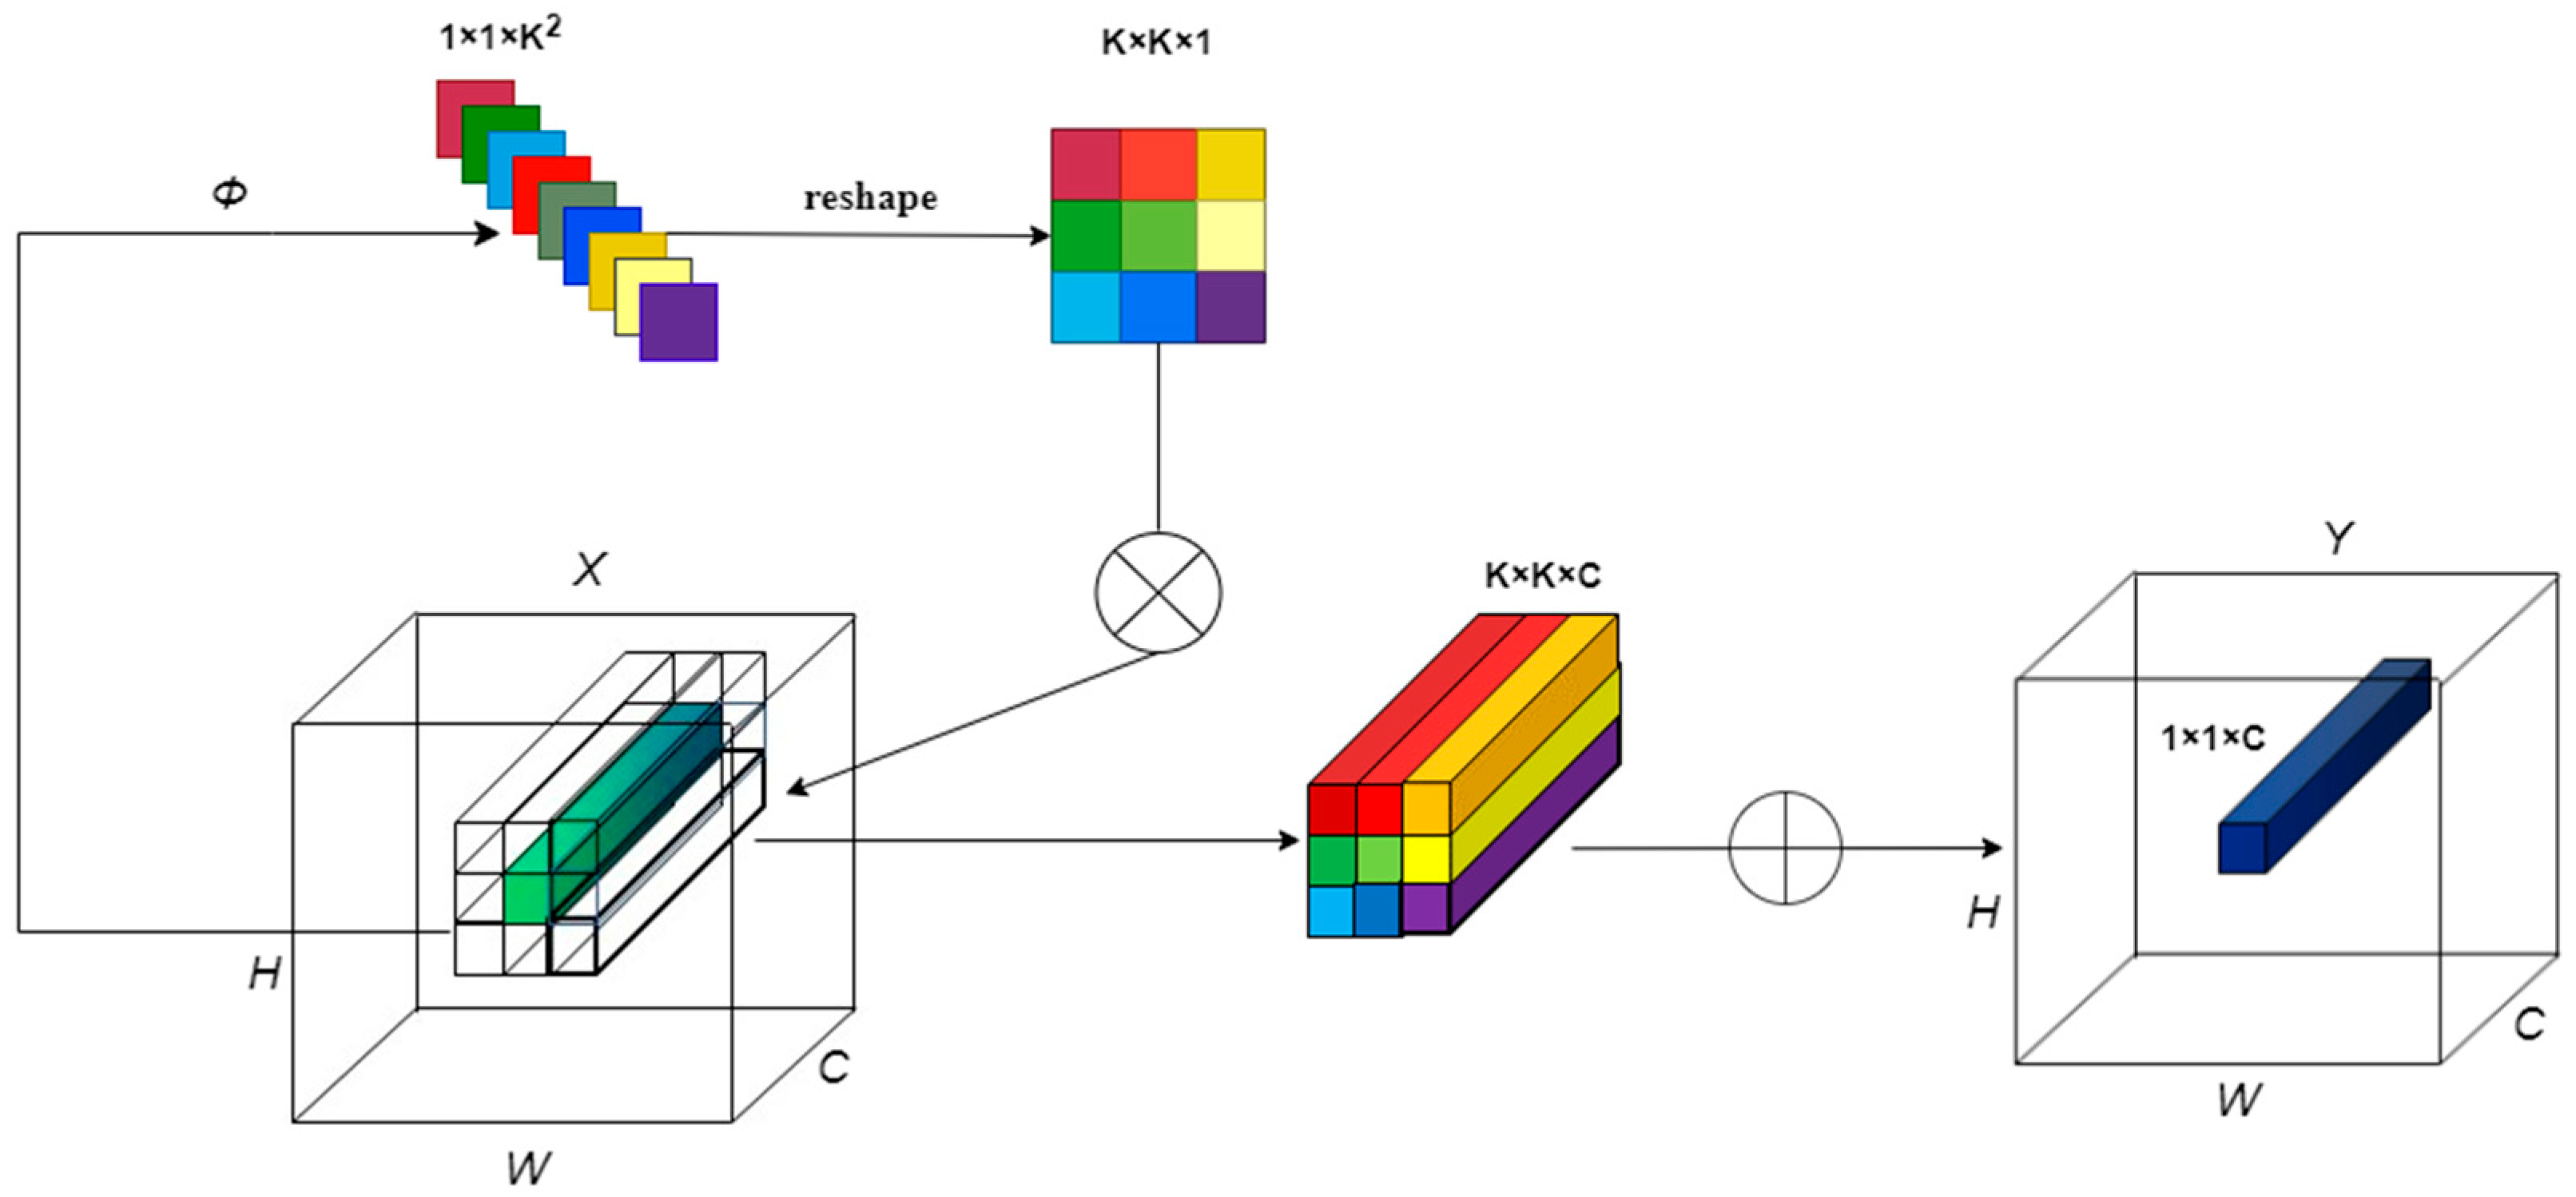
denotes the nonlinear activation function processed on the above linear transformations after batch normalization. The principle and operation of involution are shown in
Figure 3. Each group of pixel coordinates is mapped by the
function to obtain a
feature map, which is then restructured by the reshape function into the shape of the involution operator’s kernel. Finally, a multiplication and addition operation is performed with the feature vector of the neighborhood of this coordinate point to obtain the output feature map.
Compared to traditional convolution, the involution operator enhances spatial modeling information while weakening channel modeling information. If all ordinary convolution operators are replaced with the involution operator, it will cause a significant drop in accuracy. Considering that downsampling with a stride of 2 in traditional convolution will cause the phenomenon of spatial information loss, this paper replaces the downsampling convolution block in the backbone network with the involution block to balance the model size and accuracy.
3.2. GSConv
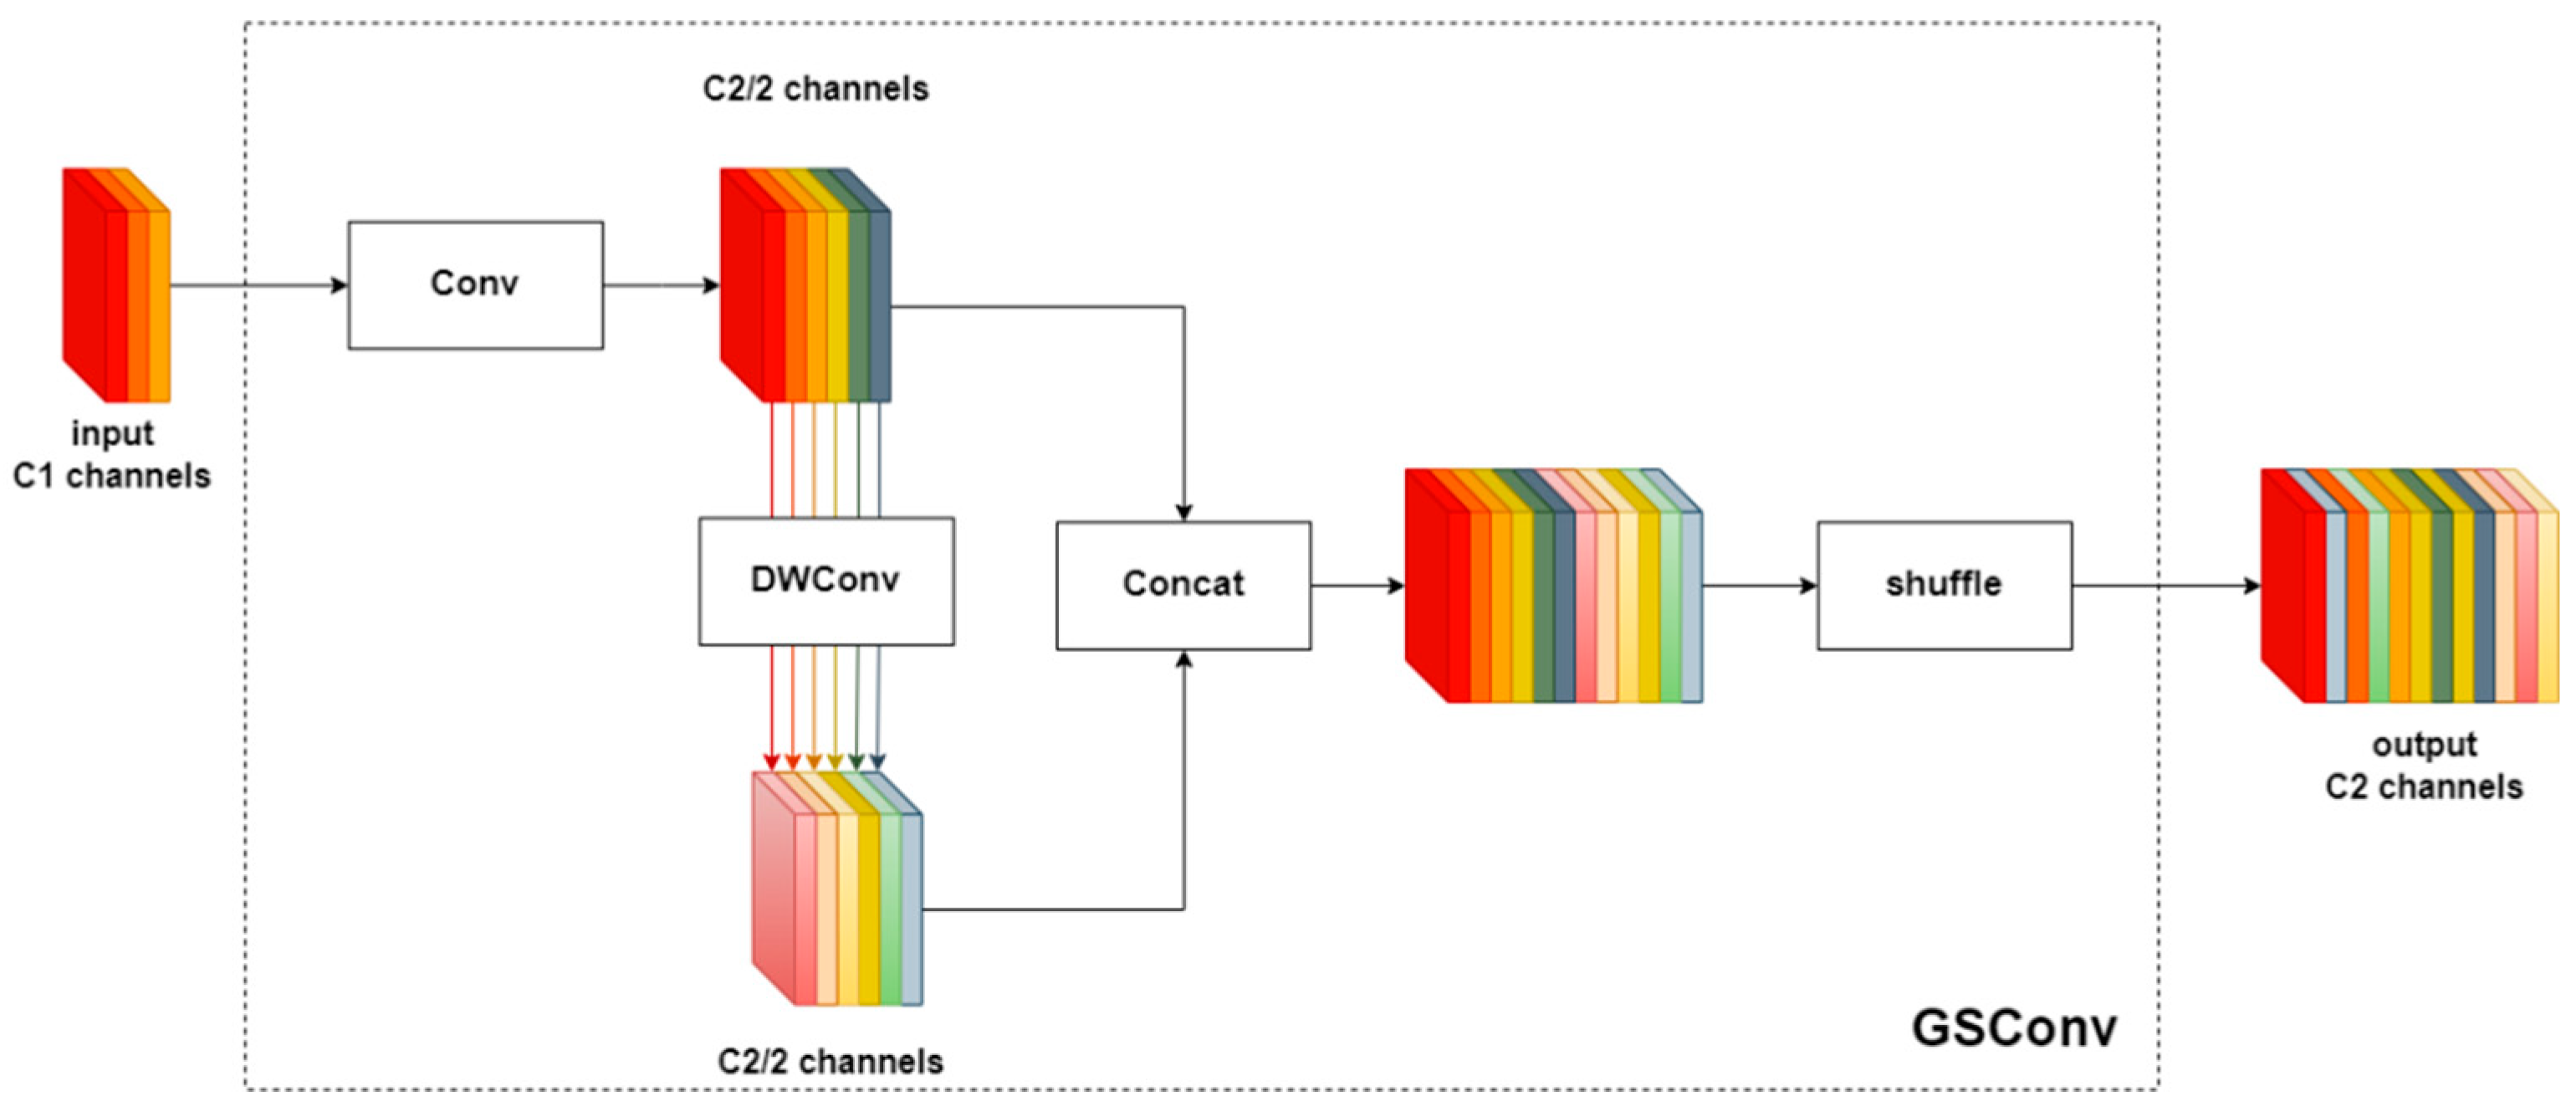
When designing lightweight networks, depth-wise separable convolution (DSConv) is often utilized as a replacement for standard convolution (SConv) to reduce computational costs. However, DSConv separates the channel information of the input feature map, which leads to lower feature extraction and fusion capabilities when compared to SConv. This article presents the introduction of GSConv to the feature fusion network, as illustrated in
Figure 4. By concatenating and shuffling the feature tensors output by SConv and DSConv, the model’s nonlinear expression capability is enhanced. This leads to a balance between the lightweight structure of the network and detection accuracy.
3.3. CBAM
Incorporating attention mechanisms in the construction of neural networks can effectively suppress irrelevant information and enhance network efficiency. One of the widely used attention modules is the CBAM, which is simple yet effective, as illustrated in
Figure 5.
CBAM consists of two independent sub-modules: the channel attention module (CAM) and the spatial attention module (SAM). To begin, the channel attention mechanism is applied to the input feature map, which generates two two-dimensional feature maps via parallel max-pooling and average-pooling operations. These feature maps are then fed into a multi-layer perceptron (MLP) with shared weights. The resulting features are summed and passed through a sigmoid activation function. Finally, the output of the activation function is multiplied with the input feature map, resulting in an intermediate feature map. The intermediate feature map undergoes parallel max-pooling and average-pooling operations in the spatial attention module, producing two two-dimensional feature maps that are concatenated. After passing through a 7 × 7 convolutional layer and a sigmoid activation function, the final output feature map is obtained by multiplying it with the intermediate feature map.
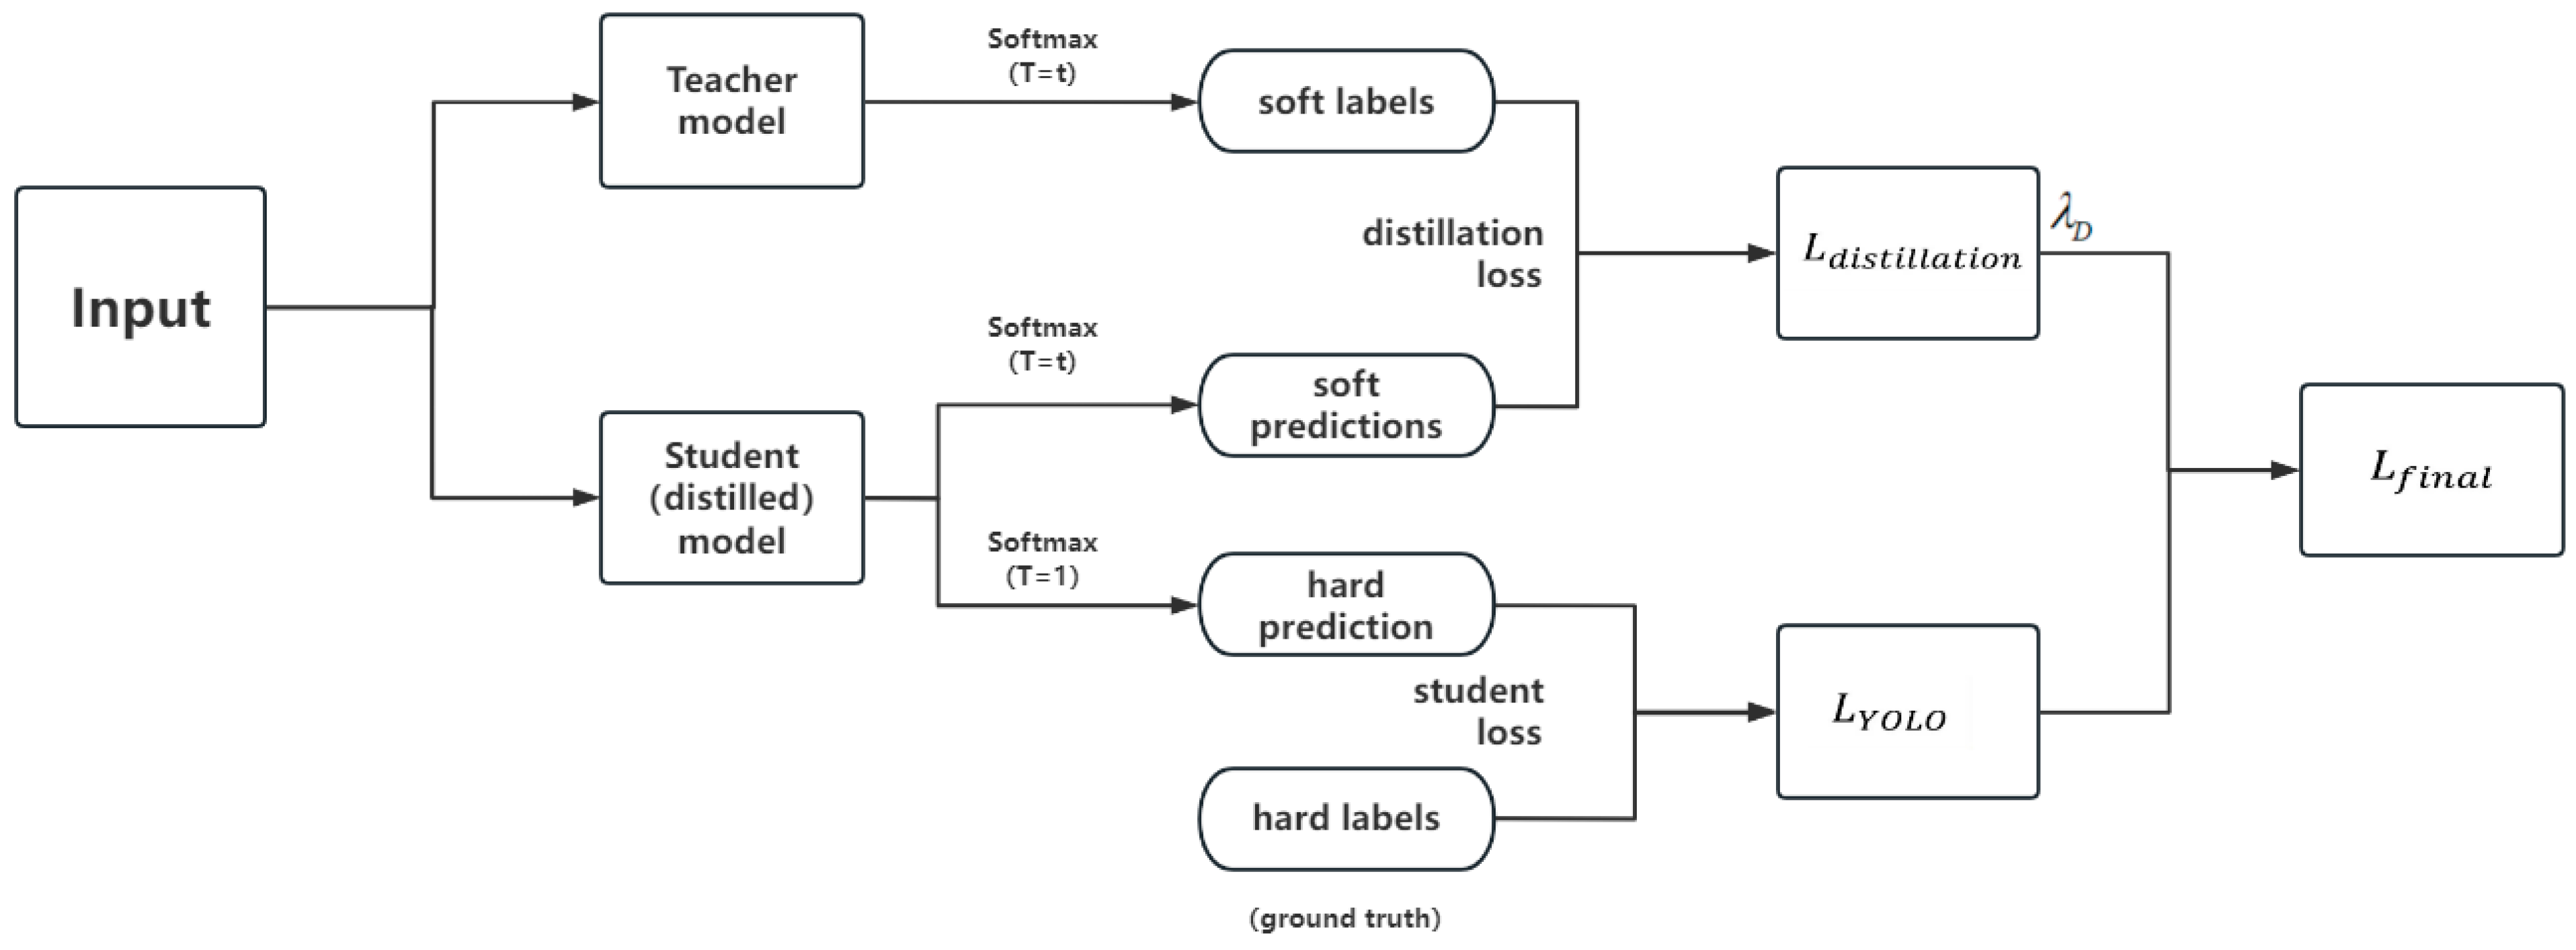
3.4. Knowledge Distillation
The main concept of knowledge distillation is to transfer knowledge from a large and accurate network (teacher network) to a lightweight network (student network). This paper conducts offline distillation of the improved model using the response-based distillation strategy proposed in Rakesh et al. [
21]. The distillation process is shown in
Figure 6. The output of the teacher network is heated to obtain soft labels, and one branch of the student network is also heated during output to obtain soft predictions. The distillation loss is calculated by computing the loss function between the soft predictions and the soft labels generated by the teacher network. The other branch calculates the student loss by computing the loss function between the unheated output and the true label.
The loss function of the YOLO algorithm is represented by Equation (3):
In Equation (3) of the YOLO algorithm,
represent the losses of objectness, class probability, and bounding box coordinates, respectively.
, and
represent the target objectness, class probability, and coordinate information of the predicted bounding box by the student network, while
represent the target objectness, class probability, and coordinate information of the ground truth bounding box. Moreover, building upon this foundation, the concept of distillation loss is introduced, accompanied by its corresponding loss function presented in Equation (4):
The variables
denote the objectness, class probability, and coordinate information of the bounding box predicted by the teacher network. The output
after applying the sigmoid function is denoted as
, which is used as the coefficient for both the classification and localization losses to prevent the student network from learning incorrect background box information. The total loss function comprises both distillation loss and student loss, and the parameter
is introduced to balance the object detection loss and distillation loss of the student network. Thus, the total loss function can be expressed as Equation (5):
The network structure of the teacher model is usually more complex than that of the student model. However, the difference between the teacher model and the student model should not be too large, otherwise the student model will have difficulty fitting the predictions of the teacher model, resulting in poor knowledge distillation. Therefore, in this paper, the YOLOv5m network with the same structure as the improved YOLOv5s is used as the teacher network to perform knowledge distillation on the improved YOLOv5s to improve the performance of the model.
4. Experimental Results and Analysis
4.1. Dataset and Preprocessing
This paper utilizes a dataset from SewerML [
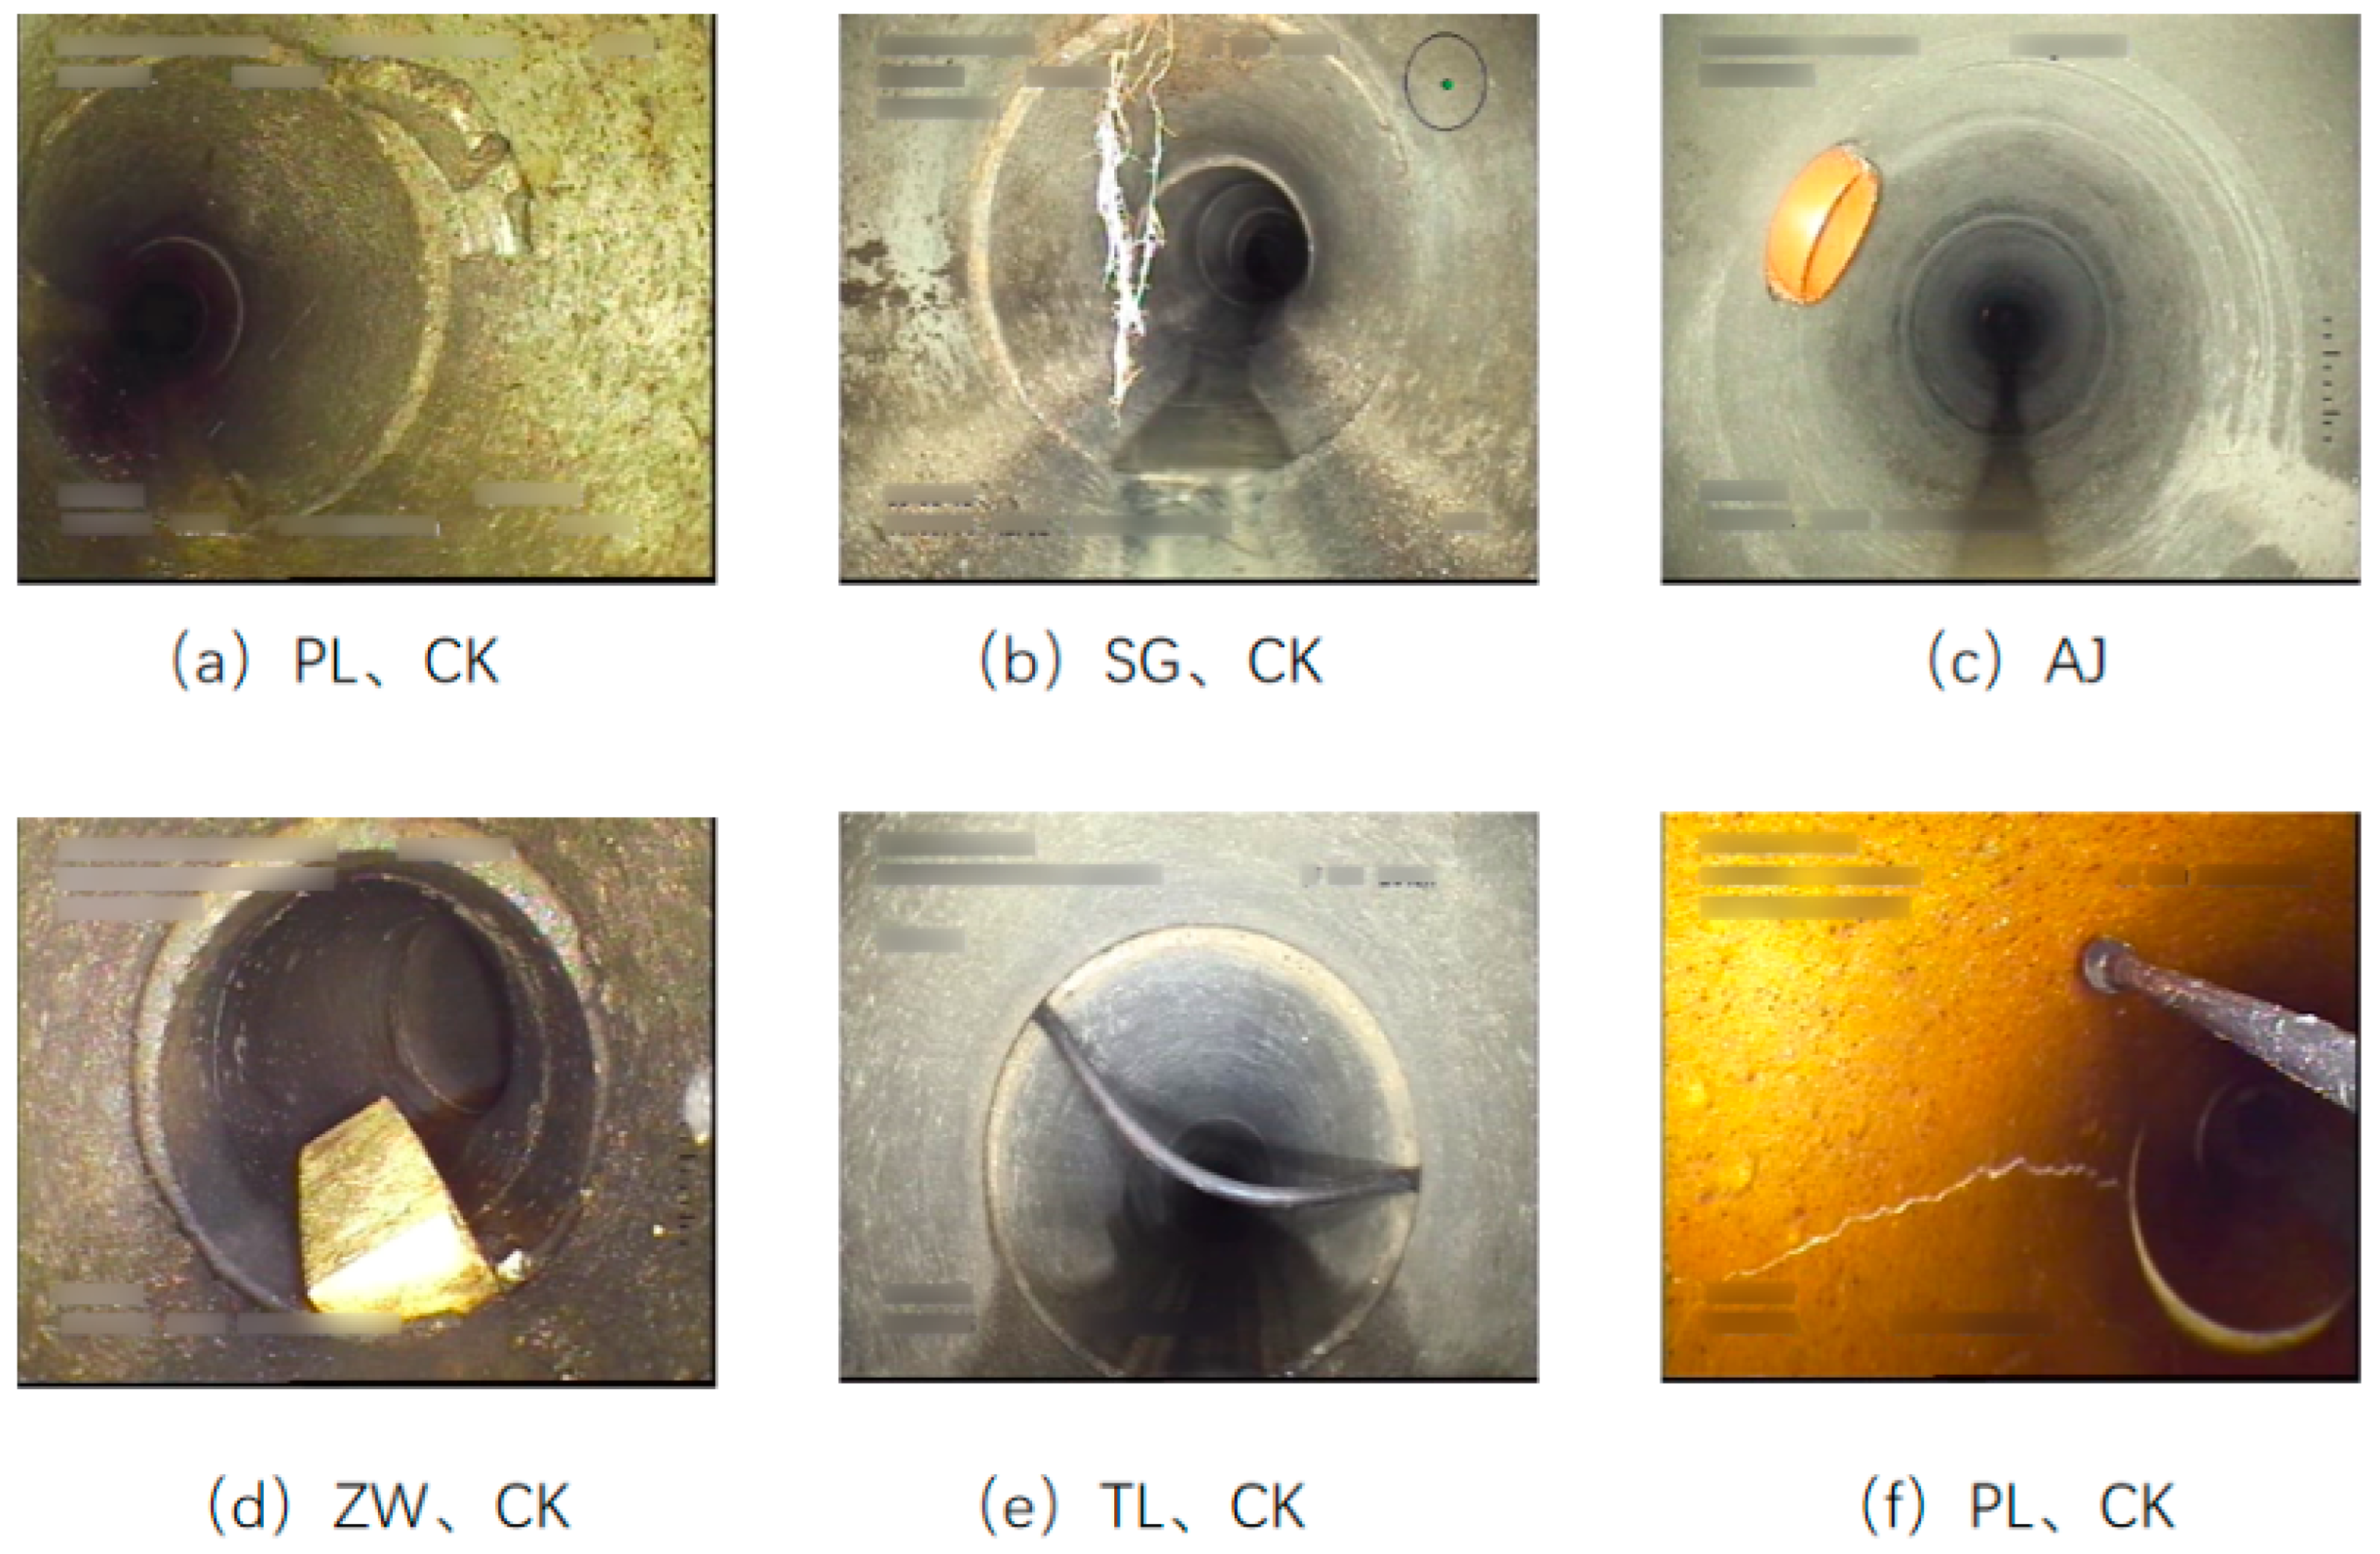
22], which was originally designed for multi-label image classification. Therefore, only six commonly occurring defects, namely break (PL), displaced joint (CK), roots (SG), intruding sealing material (TL), branch pipe (AJ), and obstacle (ZW), are selected for analysis in this study. In this study, a total of 2122 defect images were utilized, and 3490 annotation boxes were manually labeled using the labeling tool.
The dataset was divided into training, testing, and validation sets in a ratio of 7:2:1. To enhance the sample size and improve the generalization ability and robustness of the model, online data augmentation techniques, such as HSV enhancement, random rotation, random scaling, random translation, and Mosaic4, were applied to the training set. Partial defect images are shown in
Figure 7.
4.2. Experimental Environment and Hyperparameter Settings
The experiments were carried out using a Windows 11 operating system, an NVIDIA GeForce RTX 3050 graphics card, an Intel Core i5-11260H2 CPU, and 16 GB of memory. The model was constructed, trained, and validated using the PyCharm 2018 editor and the PyTorch 1.12.1 deep learning framework, respectively, to achieve the research objectives.
During training, the epoch was set to 300, and the initial learning rate was set to 0.01. The learning rate decay employed the cosine annealing method, with a final decay of 0.0001. The optimizer used was SGD, with a momentum of 0.937. The batch size was set to 16, and the input image size was set to 480 × 480. For the knowledge distillation experiment, the value of λD was set to 0.5.
4.3. Evaluation Index
To compare the accuracy of models with different structures for detecting defects in sewer pipelines, mean average precision
and
were used as evaluation metrics. The formulas for the evaluation metrics are as shown in Equations (6)–(9):
represents the number of true positive samples detected,
represents the number of false positive samples detected, and
represents the number of undetected positive samples.
is the average precision for a given category,
is the total number of categories, and
and
represent precision and recall, respectively.
To reflect the speed and complexity of model detection, the evaluation metrics included frames per second (FPS) and the number of parameters (Params), floating-point operations per second (FLOPs), and the size of model weight files (Weights).
4.4. Different Attention Mechanism Comparative Experiments
The CBAM attention mechanism was introduced in the feature fusion network of this paper. In order to verify its effectiveness and investigate the impact of different attention mechanisms on the improved model, SE and CA attention mechanisms were introduced at the same position for comparative experiments, as shown in
Table 1 for the results.
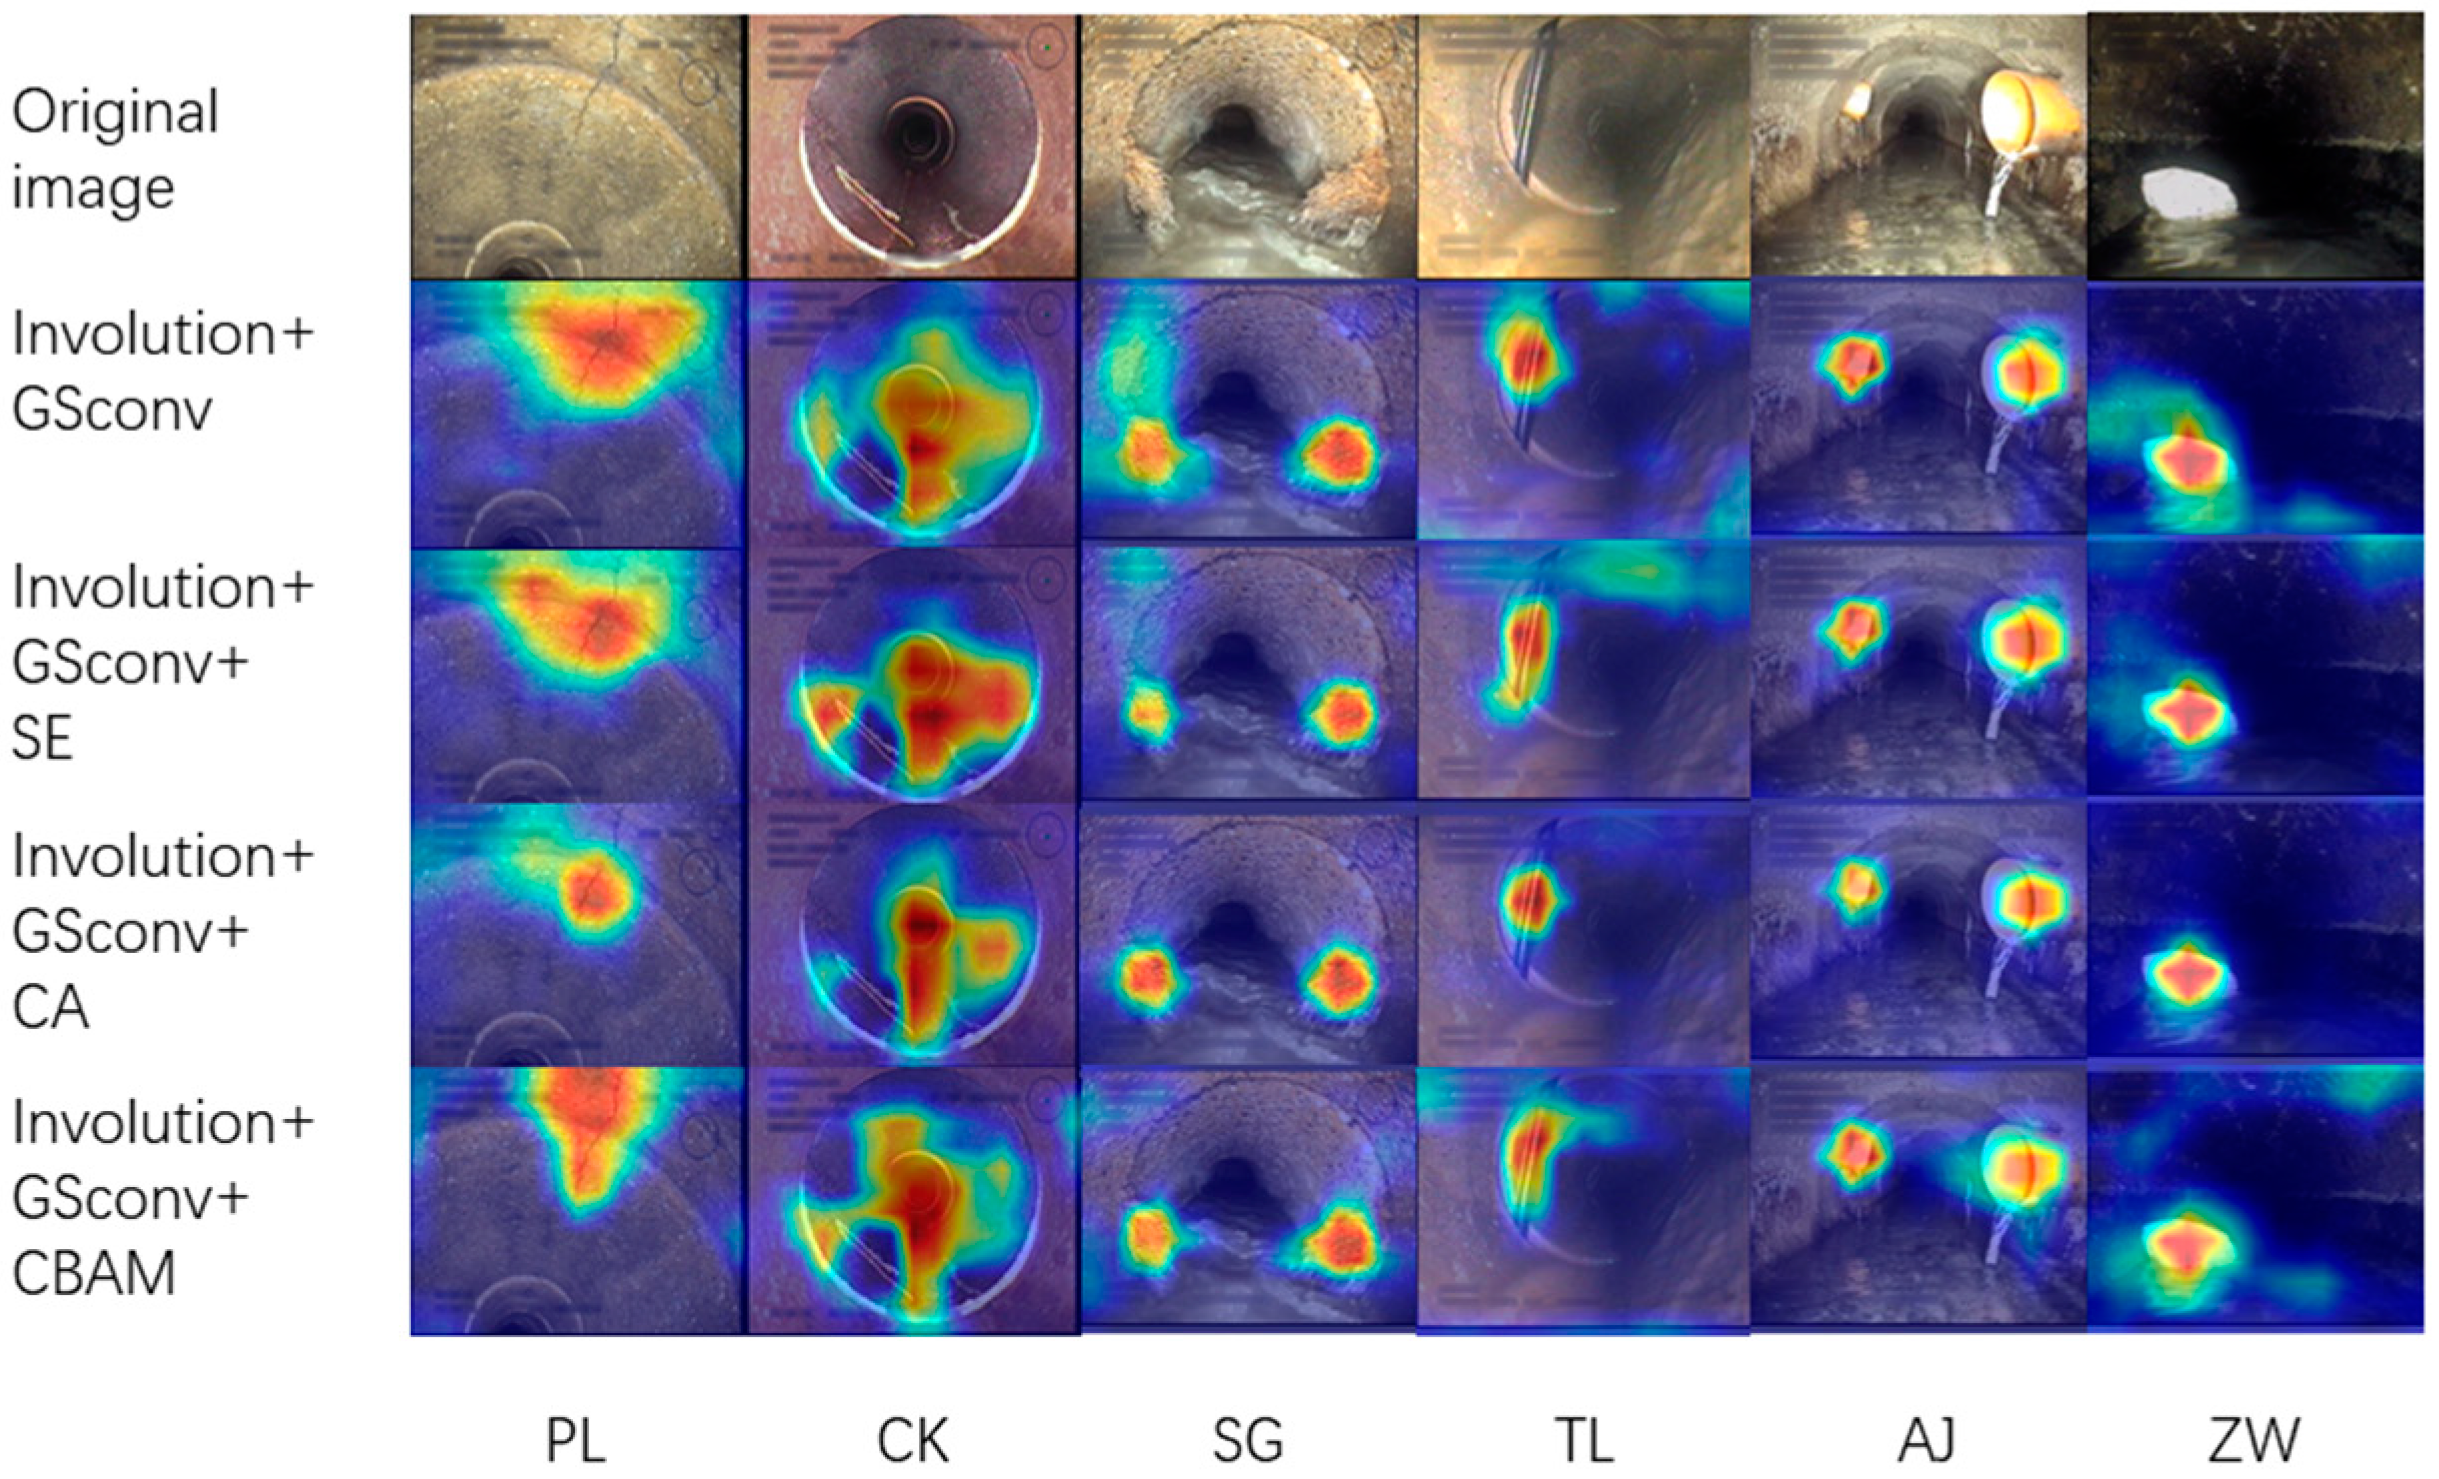
To further analyze the impact of different attention mechanisms on the improved network’s prediction results, GradCAM++ [
23] was employed to visualize the feature maps of the last layer of the neck network and generate heat maps, as presented in
Figure 8. The heat map indicates that the attention of the three different attention mechanisms has been enhanced to varying degrees compared to the original model, with darker colors representing higher attention in the corresponding areas. Notably, among the three types of defects, namely break, displaced joint, and intruding sealing material, the CBAM mechanism shows higher coverage of the target region. Thus, based on the experimental findings and heat map analysis, this paper selects the CBAM attention mechanism, which exhibits more pronounced improvement in the model’s performance.
4.5. Ablation Experiments
To further analyze the influence of various improvement modules on network detection performance, ablation experiments were conducted on the test set, and various performance indicators are presented in
Table 2. The symbol “√” denotes the inclusion of the corresponding improvement module.
Based on the observation of
Table 2, it is apparent that the integration of the involution module into the original network leads to a substantial decrease in both the number of parameters and the computational complexity. GSConv adds shuffling operation on the basis of DSConv to enhance the network’s nonlinear expression ability, enabling the network to achieve higher accuracy while slightly reducing the number of parameters and computational complexity. While the introduction of CBAM reduces detection speed, it compensates for the accuracy loss incurred by the lightweight process.
Table 3 presents the selection of YOLOv5m as the teacher network, with mAP@0.5 and mAP@0.5:0.95 reaching 79.3% and 46.3%, respectively, prior to knowledge distillation. Post distillation, the final model demonstrated a 2.4% and 2.6% improvement in mAP@0.5 and mAP@0.5:0.95, respectively, when compared to the baseline model. The number of parameters and computational cost decreased by 30.1% and 29.4%, respectively, and the detection speed reached 75 FPS. The above data demonstrates the effectiveness of the proposed improvement method, which achieves lightweight network and improved prediction accuracy while ensuring real-time on-site detection.
4.6. Comparison Experiment
To objectively demonstrate the effectiveness of the improved YOLOv5 model proposed in this paper for detecting defects in sewer pipes, some mainstream object detection models, including SSD, Faster R-CNN, and the YOLO series, were trained and tested on the same dataset. Moreover, the enhancement strategy proposed by Chanmi et al. [
14] (YOLOv5LC, micro-scale detection layer + CBAM) for the detection of sewer pipeline defects using the YOLOv5s model has been successfully reproduced in this study. Subsequently, a comparative analysis was conducted between the improved model and theirs. The evaluation metrics used were mean average precision (mAP), frames per second (FPS), and model weight size. The experimental results are presented in
Table 4.
According to
Table 4, the improved algorithm achieved a detection speed of 75 FPS and has good real-time performance. The precision metric mAP@0.5 reached 80.5%, which is 2.0% and 4.3% higher than the classic object detection algorithms Faster R-CNN and SSD, respectively. It is also significantly better than the same type of algorithms YOLOv3, and YOLOv5s. Compared to other improved lightweight algorithms such as YOLOv5 (backbone based on ShuffleNetV2 [
24] and MobileNetV3 [
25]) and the newer YOLOv7tiny, the improved model achieves the highest detection accuracy while satisfying the real-time detection requirements. Compared to YOLOv5sLC, the proposed approach demonstrates superior suitability for sewer pipeline defect detection tasks in terms of accuracy, speed, and lightweight design. Although its accuracy is slightly lower than large models such as YOLOv4 and YOLOv7, due to its smaller model size and faster detection speed, it is more suitable for field deployment in sewer pipe defect detection.
4.7. Detection Results
In order to further validate the efficacy of the final improved model, a comprehensive comparison was conducted between the improved model and YOLOv5s on the test dataset, aiming to assess their performance and effectiveness.
Table 5 demonstrates that the improved model demonstrates diverse degrees of performance enhancement across different defect detection scenarios.
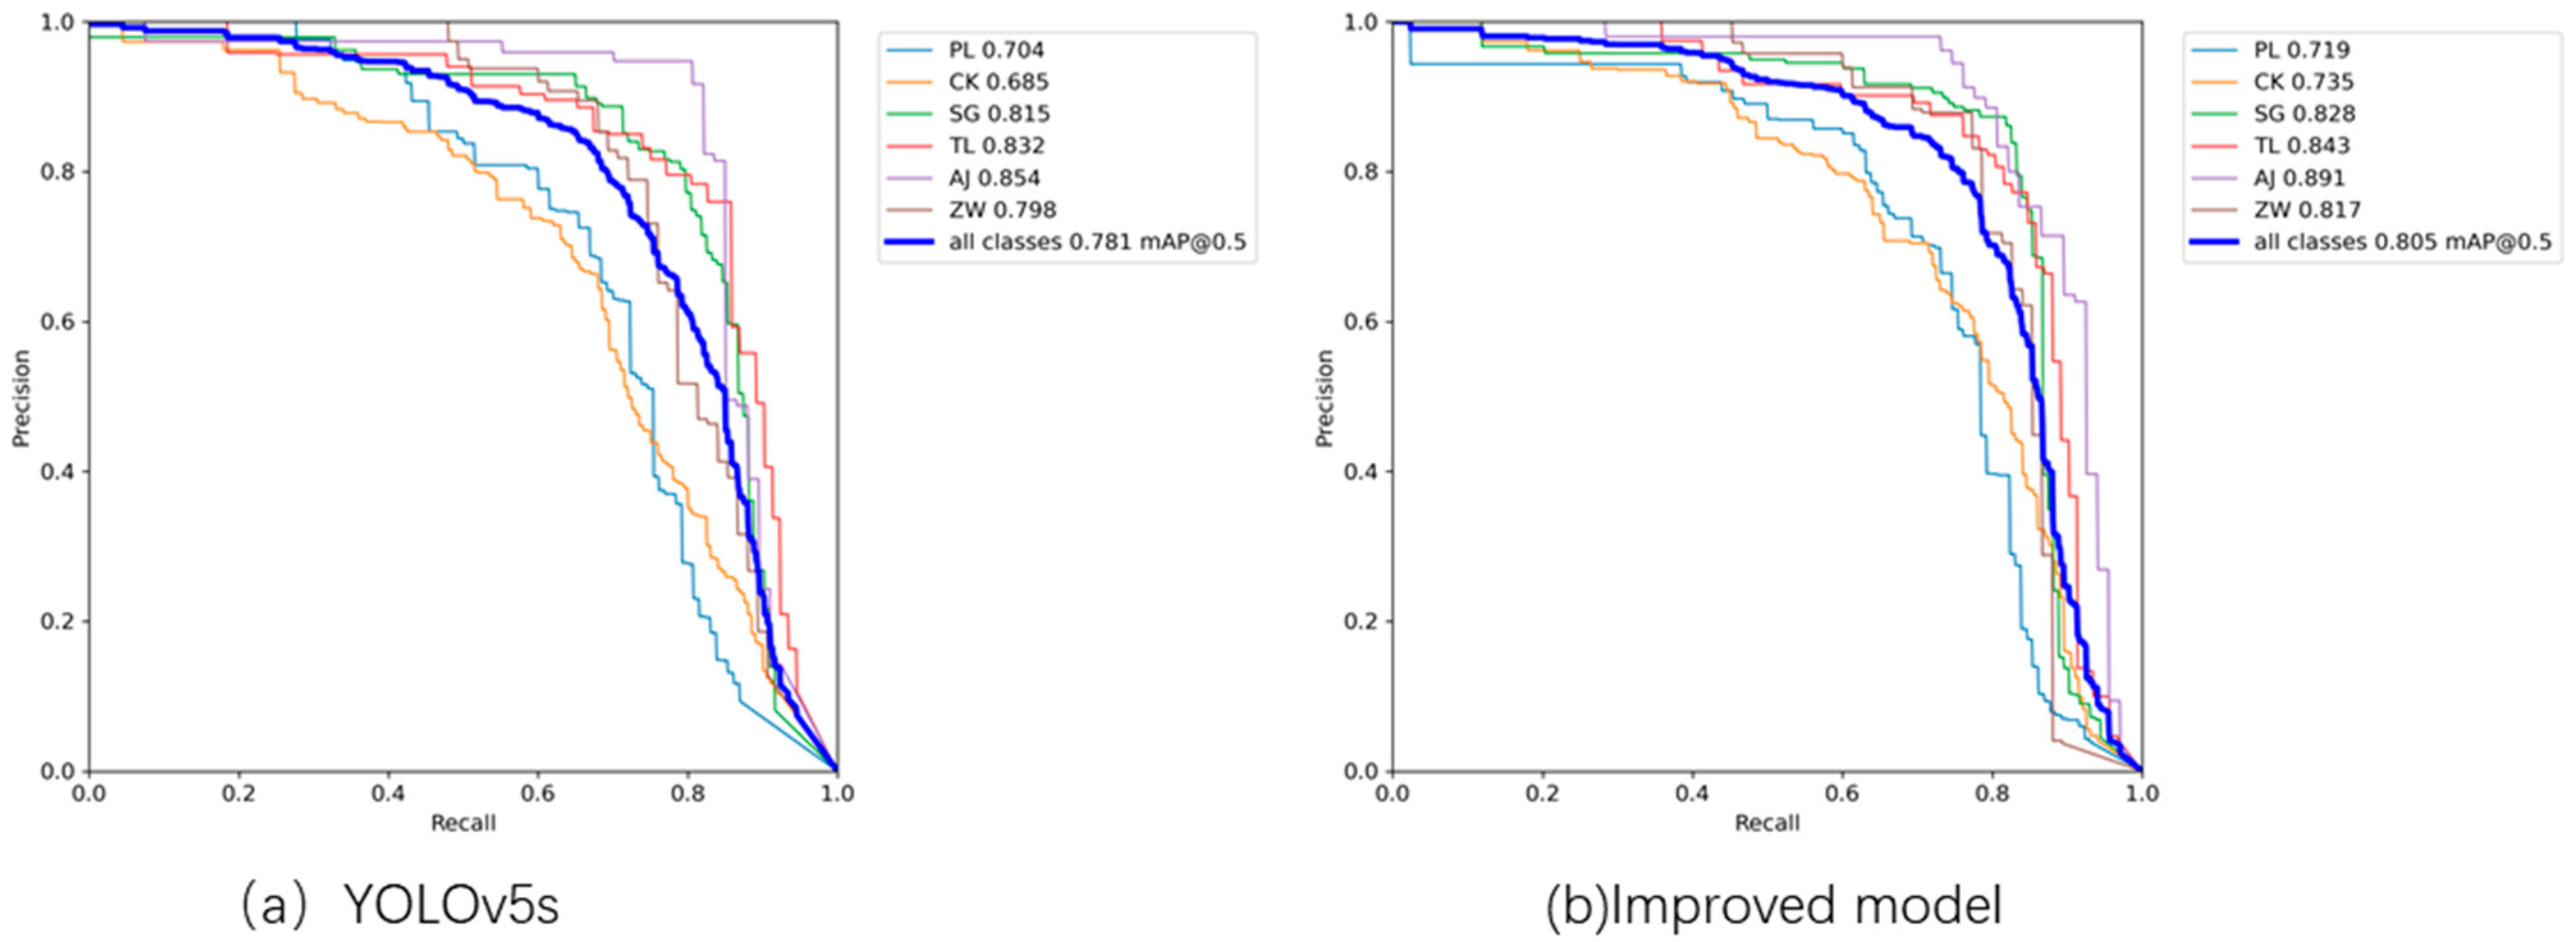
Figure 9 presents the PR curve plots for the original and the improved models. As shown in the figure, it is evident that the PR curve of the improved model achieves a larger area under the curve, indicating its superior performance compared to the original model.
In the task of detecting sewer pipeline defects, missed detections often occur due to factors such as low lighting conditions and occlusions. Analysis of
Table 5 and
Figure 9 reveals a notable enhancement in the recall rate of the improved model compared to YOLOv5s. A higher recall rate indicates a reduced number of missed defects by the model, which holds significant importance for sewer defect detection tasks.
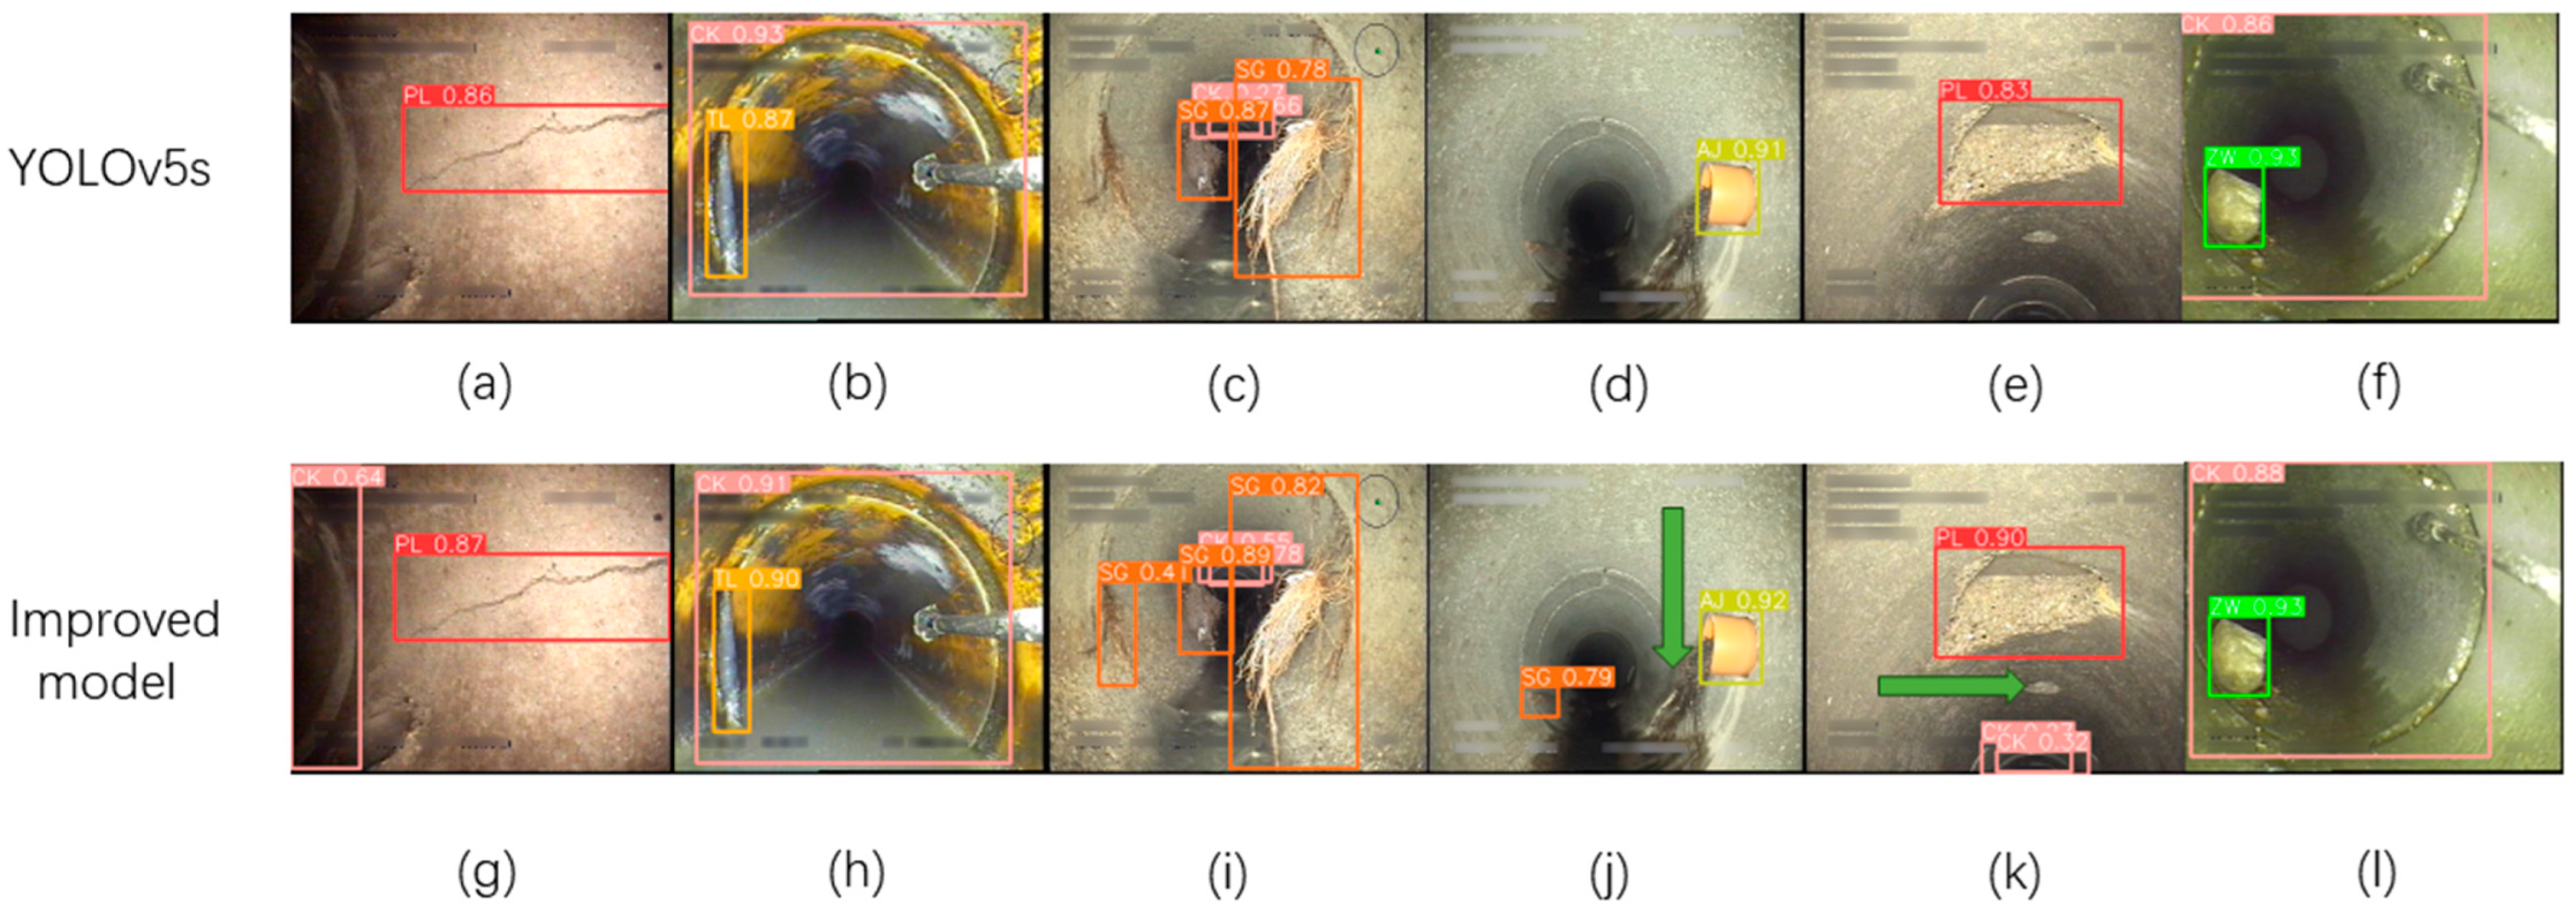
Figure 10 presents the visual results of the original and improved models, providing visual evidence of the enhanced performance of the improved model in detecting sewer pipeline defects. In
Figure 10, a comparison between (a) and (g), as well as (e) and (k), reveals that the improved model, compared to the original model, successfully detects break (PL) under low-light conditions. Comparing (d) and (j), the improved model demonstrates excellent detection capabilities for smaller roots (SG) defects as well.
In conclusion, the model proposed in this study demonstrates substantial advancements over YOLOv5s, facilitating enhanced detection of diverse defect types and precise localization within sewer pipelines.
It is important to acknowledge that while the improved model demonstrates the capability to identify the majority of diverse sewer pipeline defects, there might be specific scenarios where certain limitations or oversights in the improved model’s performance could arise. In
Figure 10j, the model failed to detect the roots (SG) extending from the lateral branch. This can be attributed to the similarity in height between the roots and the background sediment, which leads to less distinct features and subsequently results in missed detections. In
Figure 10k, a break (PL) at a specific location was not detected, possibly due to the small size of the fracture, leading to a missed detection (missed defects are indicated by green arrows in
Figure 10).
Typically, in pipeline engineering regulations, fractures are classified into four distinct levels. Hence, in this study, both cracks and substantial wall damages are categorized as break (PL) defects. Moreover, existing object detection methods lack the capability to evaluate the severity level of individual defects, thereby requiring the incorporation of segmentation techniques. This presents a promising avenue for future research in the domain of sewer pipeline inspection tasks.
5. Conclusions
This paper presents an improved algorithm for sewer pipeline defect detection based on YOLOv5s, effectively tackling the subjectivity, low efficiency, and on-site model deployment challenges associated with existing CCTV-based defect detection methods. The model presented in this paper possesses the following advantages:
- (1)
The proposed model exhibits a reduced number of parameters and computational complexity. In this study, a lightweight network architecture is constructed by incorporating involution and GSconv, thereby mitigating the dependence on computational power of the device. Compared to the YOLOv5s model, the proposed model exhibits a reduction of 30.1% in the number of parameters and a 29.4% decrease in computational complexity.
- (2)
The model proposed in this study exhibits a high level of detection performance. The incorporation of the CBAM attention mechanism enhances the detection capability of the model, particularly in complex backgrounds. Furthermore, the utilization of knowledge distillation is employed to enhance the model’s generalization performance. Ultimately, the improved model successfully attained an mAP@0.5 score of 80.5% and an mAP@0.5:0.95 score of 48.7% on the test dataset. Moreover, the detection speed demonstrated remarkable performance, achieving a rate of 75 frames per second (FPS), effectively meeting the stringent real-time demands for on-site detection.
Through comparative experiments, the proposed model demonstrated superior performance compared to well-known models such as SSD and Faster R-CNN. Furthermore, it surpassed its counterparts in the YOLOv3 and YOLOv5s series. When compared to other lightweight enhancement algorithms, such as YOLOv5s (ShuffleNetV2 and MobileNetV3) and YOLOv7tiny, the proposed model achieves the highest level of detection accuracy while satisfying the real-time detection demands. Although the proposed model’s mAP is slightly lower compared to YOLOv4 and YOLOv7, it offers notable advantages in terms of model size and detection speed. Moreover, in comparison to the YOLOv5sLC model, a target detection model for the same task, the proposed model exhibits even greater advantages on the dataset employed in this study.
Based on the aforementioned data, the model proposed in this study fulfills the real-time requirements for on-site sewer pipeline defect detection. It demonstrates low computational overhead and achieves enhanced accuracy compared to mainstream algorithms at the current stage. Thus, it is well-suited for deployment on mobile devices. While current object detection models demonstrate the ability to accurately detect defects, they encounter difficulties in assessing the precise severity level of individual defects. In future studies, semantic segmentation will be carried out on the detected defect images, followed by the evaluation of their respective severity levels, considering their geometric characteristics.
