Abstract
Recently, Japan and the European Union have been experiencing declining petroleum demand owing to global initiatives aimed at reducing environmental impact by curtailing CO2 emissions. Consequently, alternative products and operational conditions should be developed to utilize the fluid catalytic cracking (FCC) unit. Using simulation software (Aspen Hysys), this study modeled a typical FCC unit and compared the simulation results with operational data to ensure reproducibility. Two new process models were developed to investigate two scenarios: (i) the slurry discharged from the FCC unit is utilized as a feedstock for the FCC process and (ii) the slurry and fraction obtained from the downstream absorber of the FCC unit are introduced into a delayed coker unit to facilitate carbon fixation. Within an optimum riser outlet temperature (ROT) of 520–530 °C, the yields of gasoline and liquefied petroleum gas increased up to 4%. For profit performance, although ROT of 535–545 °C yielded peak efficiency, the CO2 emissions increased by 70%. Thus, a ROT of 530–540 °C, coupled with a delayed coker unit, can maximize profitability. Furthermore, a correlation graph illustrated the relationship between CO2 emissions and profit for selecting optimal FCC operational conditions.
1. Introduction
The current global landscape characterized by geopolitical, economic, and environmental instability exerts substantial pressures on petroleum refiners to modernize refinery processes and operations to sustain profitability and minimize environmental impact. Otherwise, the refinery will be forced to shut down due to the recent decline in oil demand [1]. Recently, 15% of refineries were shut down in Japan [2,3]. The fluid catalytic cracking (FCC) unit, which plays a pivotal role in petroleum refining plants, has been the subject of extensive research aiming to enhance its performance [4,5,6]. Similarly, studies on the chemical reaction kinetics of the FCC process have led to the development of techniques for simulating these kinetics within the FCC unit [7,8]. Presently, the advancement of highly accurate process simulation tools and analytical techniques enables the optimization of petroleum refining plants, providing valuable economic assessment tools to inform investment decisions [9].
Since 2000, the demand for petroleum in Japan and European Union countries has witnessed a steady decline, which has further accelerated since 2020 [10]. This trend is exemplified by the closure of two refineries in Japan over the past 3 years [2]. In light of these circumstances, petroleum refining plants encounter two pressing demands. First, their operations need to be oriented toward the production of petrochemical base materials with added value [6]. Second, achieving high operational efficiency and reducing environmental impact are paramount objectives. The FCC slurry is a byproduct of the FCC unit, which is commonly utilized as carbonaceous fuel oil in boilers because of its distinctive properties [11].
However, the slurry generated from FCC units yields low-value liquid products and high quantities of petroleum coke, resulting in adverse atmospheric pollution and diminished economic benefits [11]. To effectively mitigate the environmental impact of the FCC unit, alternative applications for the slurry must be explored beyond its current usage as a fuel. Previous studies have investigated the decomposition performance of the slurry and explored the recirculation of a portion back into the FCC unit [11,12]. However, these studies have primarily focused on the characteristics of the slurry, lacking a quantitative evaluation of the potential reduction in environmental impact achieved by modifying the slurry process.
In response to the challenges experienced by petroleum refining plants, this research aims to identify the operational conditions (independent variables) of the FCC unit that can be customized to align with market trends while considering their correlation with environmental impact. Additionally, novel approaches should be developed to manage the slurry, which poses an environmental burden, and update the process scheme of the FCC unit. To achieve these objectives, process simulation is employed as an alternative to physical modifications of the plant. The developed simulation model undergoes comparative analysis with actual operational data to ensure its reliability. Through this analysis, three operational conditions are modified to identify key independent variables. Although the maximization of gasoline production remains important, this study tackles the challenge of incorporating an economic evaluation method that takes environmental impact into account.
Furthermore, two new process schemes are proposed and evaluated for their effectiveness. The first model involves utilizing the slurry discharged from the FCC unit as a feedstock for the FCC process. The second model introduces the slurry from the FCC unit and the fraction from the downstream absorber into a delayed coker unit, thereby enabling the production of needle cokes. Considering the environmental impact, an economic evaluation is performed for the proposed process schemes. Moreover, optimal operational conditions for future FCC units are proposed, given the complex interplay between economic performance and environmental considerations.
2. Materials and Methods
2.1. FCC Unit
2.1.1. Process Flow Diagram
FCC is a vital conversion process employed in petroleum refineries to transform high-boiling point, high-molecular weight hydrocarbon fractions, such as crude oils, into valuable products such as gasoline, olefinic gases, and other petroleum derivatives. The catalytic cracking process generates larger quantities of high-octane rating gasoline and produces byproduct gases that hold great economic value in the petrochemical industry [5,13]. Figure 1 illustrates the typical process flow diagram of an FCC unit. For this study, a capacity of 18,000 BPSD (barrel per stream day), which is representative of typical capacity in Japan, is considered. The FCC unit comprised the reaction regeneration system, fractionation system, and absorption system [13].
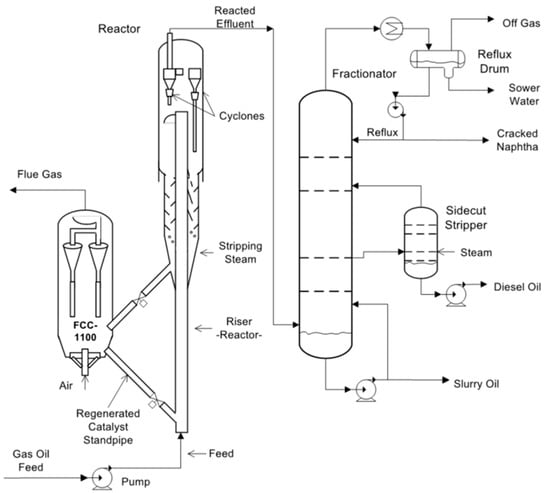
Figure 1.
Typical FCC process flow diagram.
2.1.2. Reaction System
The process begins with preheating the gas oil feed via a heat exchanger using the hot products from the main fractionator. The preheated feed is then mixed with a regenerated catalyst and charged into the reactor. Alternatively, unconverted heavy cycle oil (HCO) can be recycled back to the reactor to enhance conversion. Additionally, introducing a small amount of lift gas into the riser pipe is gaining popularity as a means to reduce the detrimental effects of metal contaminants present in the feedstock. Within the reactor, the products resulting from the catalytic cracking process are separated from the spent catalyst. Steam is employed to strip the catalyst, removing any remaining oil products and hydrocarbons present in the reactor, and directing them to the main fractionator for the initial separation of the reaction products.
2.1.3. Fraction and Absorption System
The hot effluent from the reactor undergoes cooling at the bottom of the main fractionator using a circulating slurry oil quench. The slurry oil product is a highly aromatic stream with a final boiling point of approximately 649 °C [5]. This heavy material is directed either to a separating unit or to another residue process. Alternatively, a net flow of HCO can be withdrawn from the main fractionator above the quench zone, with a portion potentially recycled back to the reactor to enhance conversion. Light cycle oil, a side product of the main fractionator, is withdrawn and subjected to steam stripping to eliminate light components and improve its flash point. This product serves as a suitable blending stock for light heating oils. However, for use in low-sulfur heating oils, hydrotreating is necessary to reduce the sulfur content.
2.1.4. Typical Operation
The primary feeds to the FCC process unit consist of atmospheric and vacuum gas oil obtained downstream of the crude distillation unit. The gas oil boils within the approximate range of 344–580 °C. Catalytic cracking operates at low pressures, with most FCC reactors functioning within the pressure range of 2.4–3.4 bars absolute. The regenerator is maintained at a slightly higher pressure, whereas the main fractionator operates at a small pressure differential relative to the reactor outlet. Typical reactor temperatures range from 483 to 552 °C, with regenerator temperatures reaching up to 691 °C for conventional units and up to 816 °C for units processing heavy residues [5].
2.2. Simulation Methods
The initial step involves developing a simulation model that encompasses logical process kinetics to quantitatively assess the material balance within the FCC unit. This study utilized the Aspen HYSYS V12 software [14], employing the 21-lump kinetics model developed by AspenTech based on actual production process data from the refinery [15,16]. Figure 2 depicts the FCC unit simulation in the refinery. Given that most FCC systems are virtual components involving light hydrocarbons, the selected thermodynamic fluid package adopted the Peng–Robinson method [17].
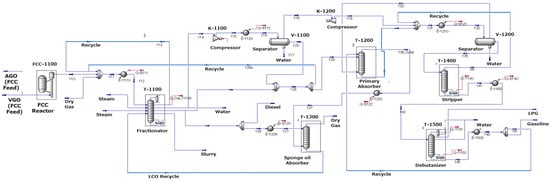
Figure 2.
Simulation model of FCC unit (Case 1).
In the subsequent step, the reactor and regenerator sizes are specified, along with key FCC operational variables such as ROT, stripping steam mass flow, and feed inlet temperature, to initialize the model. After the simulation program has achieved convergence, the yield and performance data obtained from measurements are inputted based on the current simulation scenario. The correction factor is then updated to align the simulation results with the actual operational data. Similarly, the fractionation, absorption, and stabilization systems are simulated in a consistent manner [18]. The specifications of the simulation plant are summarized in Table 1. Each equipment has a design value of temperature, pressure, and flowrate. These values are reflected in the simulation model.

Table 1.
Specification of simulation plant.
2.3. Case Study
After setting up the simulation model, three scenarios are investigated as simulation case studies. Each process flow is depicted in Figure 3. In Case 1, a typical FCC operation is selected as a benchmark to verify the accuracy of the model. The simulated results are compared with actual FCC operation data, with the acceptance criterion being an absolute relative error of <0.5. If the results fall within this acceptable range, the Case 1 setup is considered as the baseline data [18]. In Case 2, the model is developed from Case 1 by modifying the process flow scheme to incorporate the recirculation of slurry products. The Case 2 process flow involves introducing slurry, one of the heavy products from the FCC unit, into the inlet of the FCC reactor. This aims to recycle the slurry as a feedstock and reduce the slurry yield from the FCC reactor. Finally, in Case 3, a delayed coker unit is incorporated to increase the yield of needle coke, with the heavy components being recycled back to the FCC inlet.
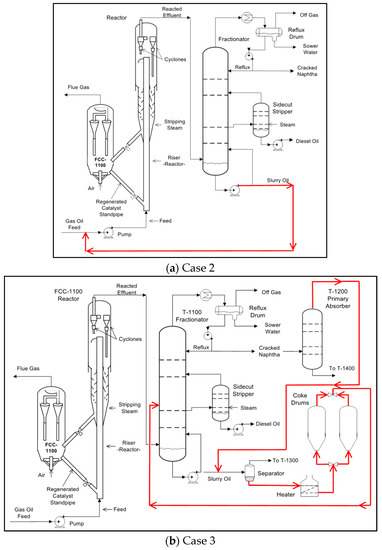
Figure 3.
Simulation model of Case 2 and Case 3.
The absolute relative error value, Ere, is described by the following equations (Equations (1) and (2)) [19]:
2.4. Evaluation Methods
2.4.1. Economical Evaluation
The economic value as produced from FCC unit, P, is described by Equation (3) [20]:
The transaction price of each petroleum product, pi, is referred to in Table 2 [21]. The yield of each product, qi, was delivered from the simulation result. For the cost component, the energy cost ratio, c, was set as $0.42/m3 [22]. The consumption energy with exclusion energy of flue gas, which is the byproduct of the FCC unit, is described as U’.
Table 2.
The transaction price of each petroleum product.
2.4.2. Environmental Evaluation
In terms of environmental evaluation, the emission of carbon dioxide from the FCC unit is accounted for. Carbon dioxide is emitted during the catalyst regenerator process and in-house power generation within the FCC unit. The volume of CO2 emissions, Em, is described in Equation (4) [20]. The emissions of each product, ei, are obtained from the simulation. A study conducted by JPEC [23] reported that 57.6 g of CO2 is emitted to generate 1 MJ of energy in a refinery plant, and this coefficient is represented as k. The total energy consumption, U, was calculated through process simulation.
2.4.3. Comprehensive Evaluation
To comprehensively evaluate the economic and environmental factors, Equation (5) is employed [20]. This integrated evaluation formula captures the sustainability aspect.
The values for P are described in Section 2.4.1, and Em is obtained from Section 2.4.2. The coefficient α represents the effective carbon rate in Japan. Previous studies have reported that effective carbon rates have been established globally, as listed in Table 3. Note that the effective carbon rate in Japan is $42.9/tCO2, which is comparatively lower than that of other European countries [24].
Table 3.
Effective carbon rate.
3. Results and Discussion
3.1. Comparative Analysis of Yield
The simulation results of Case 1 are summarized in Table 4. The left column displays the simulation results of the main product yields under normal operation conditions from the FCC unit. The center column presents the normal operation data of the actual plant. As observed, the absolute relative error was <0.5, indicating that the simulation model accurately represents the catalytic cracking reaction and can be utilized for further predictive case studies [18].
Table 4.
Comparison of product yield between simulation and actual operation.
3.2. Comparative Analysis of Key Design Parameters
The key design parameters for the FCC unit are shown in Table 5. The process simulation revealed that the independent variables included three temperature parameters, and their conditions affected the yield of FCC products.
Table 5.
Summary of design parameters.
- ROT
- feed inlet temperature
- stripping steam temperature
Particularly for ROT, this temperature is identified as a key independent variable through the case study as it directly affects the kinetics of catalytic cracking. Given that gasoline is the most valuable product in the FCC unit, identifying the optimal operation setting for maximizing gasoline production contributes to the plant’s profitability.
3.3. Analysis of Case Studies
The yield performance of the main products is portrayed in Figure 4a–d. This performance has a relationship with temperature, pressure, feed components, and catalyst-to-oil ratio [25]. The FCC ROT is a crucial operational condition, directly influencing the kinetics of catalytic cracking. Using a simulation case study tool [26], the yield of the main products in the FCC unit is calculated, where each figure expresses specific phenomena.
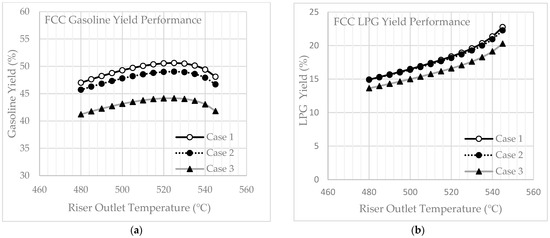
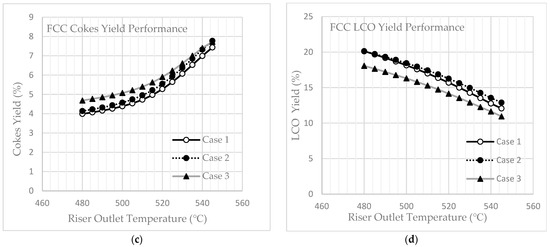
Figure 4.
Product yield performance: (a) gasoline yield; (b) LPG yield; (c) coke yield; (d) LCO yield.
Figure 4a illustrates that the yield of gasoline increases in accordance with ROT; however, the yield curve has its peak point at approximately 520–530 °C [27]. This phenomenon is directed by catalytic cracking kinetics, which converts heavy components into light products, such as C5, as the ROT rises. However, if the temperature is increased to >530 °C, hydrocarbons are excessively converted into light gas products, resulting in a reduction in gasoline distillate, as depicted in Figure 4b.
Figure 4c,d displays the yields of coke and light cycle oil (LCO). The yield of coke varies quadratically, tending to increase rapidly at temperatures >530 °C. There is a correlation between ROT and coke yield, exhibiting an opposite trend compared to LCO. The coke formation increases due to prolonged exposure to heavy oil at the reaction temperature and steam exposure during regeneration at even higher temperatures. These factors can reduce the accessibility of molecules to the active sites and therefore decrease the catalytic cracking efficiency.
3.4. Economic Evaluation and CO2 Emission
According to the economic evaluation outlined in Section 2.4.2, the profit increase ratio is summarized in Figure 5. As observed, high ROT increases gasoline production, which is a significant economic factor. However, the ROT leads to elevated CO2 emissions, as depicted in Figure 6, thereby negatively affecting carbon pricing. Figure 5 illustrates a peak point in the performance curve under the current production settings. The optimal operational temperature is determined to be 525 °C, which aligns with the findings of a previous study [27].
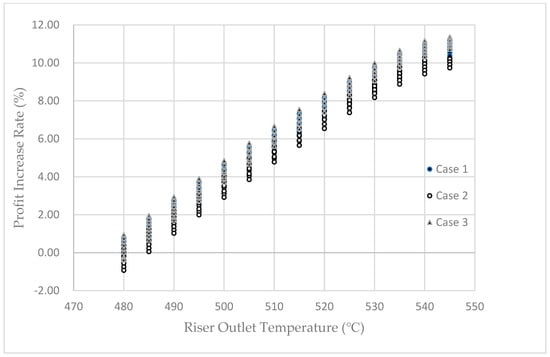
Figure 5.
Comprehensive evaluation curve.
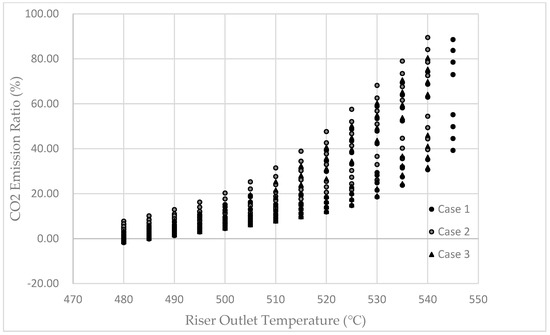
Figure 6.
CO2 emission curve.
3.5. Economic Optimum Operational Conditions for Each Case
Further case studies have been conducted to identify the most economically viable operational conditions under the current price setting. The amount of stripping steam is varied in two steps from 5000 kg/h to 6000 kg/h, the feed preheating temperature is adjusted in four steps from 145 to 190 °C, and the ROT is modified in eight steps from 480 to 545 °C.
The optimal operational conditions for maximizing profit are determined for each case. Following the case studies, a comprehensive evaluation is conducted, considering the environmental aspects. The results are presented in Table 6 below.
Table 6.
Economic optimum operational conditions for each case.
Consequently, the maximum economic value is obtained in all cases when the stripping steam rate is set at 5000 kg/h, the feed preheat temperature is maintained at 145 °C, and the ROT is set to 545 °C. When comparing the different cases, Case 3 demonstrates the highest profit, surpassing Case 1 by 0.6%. Considering the overall evaluation obtained by deducting the carbon dioxide emissions from the economic evaluation using the effective carbon price, the operational condition maximizing the overall evaluation aligned closely with the condition that maximized the economic value. This finding indicated that the carbon tax rate in Japan is relatively low, and the current condition does not strongly incentivize the prioritization of CO2 reduction in FCC unit operations.
3.6. Changes in Potential Value and Optimal Operational Conditions in Rising Coke Prices
A general interpretation of cokes, a refinery byproduct, as a means of carbon fixation to offset CO2 emissions is yet to be established. Currently, cokes are applied in various fields, including iron-making, casting, carbide manufacturing, and construction materials. Notably, needle cokes produced from delayed coker in refineries are utilized for graphite electrodes in electric steel-making and have gained attention as a carbon material for lithium-ion secondary batteries in electric vehicles [28]. The market value of cokes is expected to increase in the future. Considering these factors, if the value of coke is newly recognized as a material for offsetting carbon dioxide emissions, the simulation results undergo changes as summarized in Table 7. The CO2 deduction effect reaches 70% compared to the current process, contributing to an increase in profit rate of up to 11%.
Table 7.
Changes in the potential for carbon offset by cokes.
The evaluation would be enhanced by recognizing the delayed coker as a means of carbon dioxide fixation. Additionally, given the anticipated rise in coke demand, the price of coke is predicted to increase. In this study, the price of coke has been set at $0.6/kg, and the profit increase rates under different coke prices are presented in Table 8 below.
Table 8.
Cokes price and rating in Case 3.
3.7. Relationship between Carbon Price and Optimal Operational Conditions
Scatter plots illustrating the relationship between CO2 emissions and economic value are created for each operational condition from Case 1 to Case 3 (Figure 7). As the decarbonization trend necessitates minimizing CO2 emissions, the point in the upper-left corner of the graph represents the ideal operational condition. Furthermore, Case 3 is a favorable option for decreasing the CO2 emissions by >20% while maintaining a profit increase rate of up to 11%.
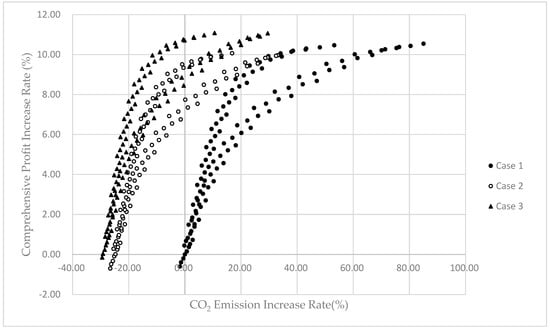
Figure 7.
Plots for a comprehensive profit with CO2 emission.
Figure 7 demonstrates a correlation between profit and CO2 emissions. Due to the relatively low carbon price in Japan ($42.9/tCO2), the curve slope is relatively flat. However, as the carbon price increases, reaching up to $200/tCO2, the curve becomes steeper (Figure 8). Of the existing options, Case 3 is the preferred choice for effectively reducing CO2 emissions.
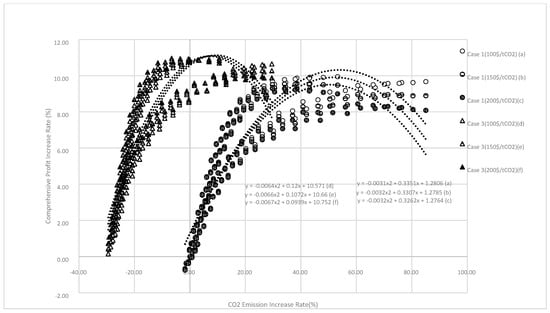
Figure 8.
Correlation plots for profit and carbon price change.
4. Conclusions
This study aimed to identify the key operational conditions (independent variables) of the FCC unit and propose suitable operational conditions based on the current market demand. Aspen HYSYS, a widely used process simulation software, was employed to quantify the yield of each product and CO2 emissions. The simulation results demonstrated good agreement with actual operation data. Through the case studies, ROT was determined to be the most influential variable, exhibiting a peak point in yield performance.
Building upon the comparative analysis, two additional process simulations were conducted, introducing novel approaches to utilize FCC slurry and reduce environmental impact. The first scenario involved incorporating FCC slurry into the FCC feedstock, whereas the second scenario introduced the slurry and the fraction from the downstream absorber into a delayed coker unit. The delayed coker unit plays a vital role in carbon fixation and the production of needle cokes, a market that is expected to grow.
Further case studies revealed a correlation between profit and environmental load, depicted through graphical representations. Given the increasing pressure to reduce CO2 emissions worldwide, this case study revealed that the delayed coker option, which produces needle cokes, will be a recommended operational condition in the near future. The recommended operational condition for the FCC unit includes a stripping steam rate of 5000 kg/h, a feed preheat temperature of 145 °C, and a ROT of 545 °C.
Additionally, the case study proposed that an increase in carbon pricing would make the ROT of 530–540 °C with delayed coker operation yield a 12–15% increase in profit. Case 3 aligns with efforts to reduce environmental load and market trends. Specifically, by fixing CO2, mitigating the CO2 emissions of oil refineries becomes possible. The fixed carbon, transformed into needle coke through the delayed coker unit, represents a fundamental material with anticipated growth in the market. By adopting this process scheme, refineries can avoid closure due to loss of profit resulting from declining gasoline demand. Furthermore, centered around the FCC unit, this method has the potential to alter the value proposition of refineries by shifting production from gasoline to petrochemicals and needle coke.
This study primarily focused on a typical FCC unit in Japan; note that FCC units can have multiple equipment configuration patterns, and not all patterns have been validated in this study. Furthermore, as FCC units are crucial conversion processes in petroleum refining plants, they were selected as the initial research target. Future studies should focus on the upstream and downstream processes, thereby contributing to the reduction in CO2 emission and proposing scenarios for shifting toward plants that manufacture petrochemical products in line with market trends. By proposing a transition scenario for the entire plant, it is possible to transform at-risk petroleum refining plants into petrochemical base product plants, ensuring their survival as foundation industries.
Author Contributions
Conceptualization, Y.M. and D.O.; methodology, Y.M.; software, D.O.; validation, Y.M.; formal analysis, Y.M.; investigation, D.O.; resources, Y.M.; data curation, D.O.; writing—original draft preparation, D.O.; writing—review and editing, Y.M.; visualization, Y.M.; supervision, G.M.; project administration, G.M.; funding acquisition, G.M. All authors have read and agreed to the published version of the manuscript.
Funding
This research received external funding from the Mohammed bin Salman Center for Future Science and Technology for Saudi-Japan Vision 2030 at The University of Tokyo (MbSC2030).
Data Availability Statement
Not Applicable.
Acknowledgments
This work has been supported by the Mohammed bin Salman Center for Future Science and Technology for Saudi-Japan Vision 2030 at The University of Tokyo (MbSC2030).
Conflicts of Interest
The authors declare no conflict of interest.
References
- Changes in Crude Oil Processing Capacity, Processing Volume, and Operating Ratio (as of 31 March 2023). Available online: https://www.eneos.co.jp/binran/document/data/pdf/27.pdf (accessed on 7 April 2023).
- Agency for Natural Resources and Energy. Available online: https://www.meti.go.jp/committee/kenkyukai/sansei/kaseguchikara/pdf/010_s03_02_02_01.pdf (accessed on 7 April 2023).
- Refinery Locations and Crude Oil Processing Capacity (as of 31 March 2022). Available online: https://www.paj.gr.jp/sites/default/files/2022-08/paj-8%E7%B2%BE%E8%A3%BD%E8%83%BD%E5%8A%9B%E4%B8%80%E8%A6%A7202204.pdf (accessed on 11 April 2023).
- Akira, I. Petroleum Refining Process; Japan Petroleum Institute: Tokyo, Japan, 2014. [Google Scholar]
- Kaes, G.L. A Practical Guide to Steady State Modeling of Petroleum Process; Kaes Consulting: Lawrenceville, GA, USA, 2011; Volume 11. [Google Scholar]
- K.I. Oil Refining Technology and Oil Supply and Demand Trends. Available online: https://oilgas-info.jogmec.go.jp/_res/projects/default_project/_project_/pdf/8/8027/201709_001a.pdf (accessed on 11 April 2023).
- Arbel, A.; Huang, Z.; Rinard, I.H.; Shinnar, R.; Sapre, A.V. Dynamic and control of fluidized catalytic crackers. 1. Modeling of the current generation of FCC’s. Ind. Eng. Chem. Res. 1995, 34, 1228–1243. [Google Scholar] [CrossRef]
- McFarlane, R.C.; Reineman, R.C.; Bartee, J.F.; Georgakis, C. Dynamic simulator for a model IV fluid catalytic cracking unit. Comput. Chem. Eng. 1993, 17, 275–300. [Google Scholar] [CrossRef]
- Akira, I. Chemical Process Simulator; Corona, Inc.: Tokyo, Japan, 2018. [Google Scholar]
- FY2022 Annual Report on Energy; Agency for Natural Resources and Energy. Available online: https://www.enecho.meti.go.jp/about/whitepaper/2017html/1-3-3.html (accessed on 11 June 2023).
- Kolev, I.; Stratiev, D.; Shishkova, I.; Atanassov, K.; Ribagin, S.; Sotirov, S.; Sotirova, E.; Stratiev, D.D. Effect of crude oil quality on properties of hydrocracked vacuum residue and its blends with cutter stocks to produce fuel oil. Processes 2023, 11, 1733. [Google Scholar] [CrossRef]
- Stratiev, D.; Shishkova, I.; Dinkov, R.; Dobrev, D.; Argirov, G.; Yordanov, D. The Synergy between Ebullated Bed Vacuum Residue Hydrocracking and Fluid Catalytic Cracking Processes in Modern Refining—Commercial Experience; Professor Marin Drinov Publishing House of Bulgarian Academy of Sciences: Sofia, Bulgaria, 2022; ISBN 978-619-245-234-6. [Google Scholar]
- The Fluid Catalytic Cracking; Encyclopedia of Earth (EoE). Available online: https://encyclopedia.pub/entry/7441 (accessed on 7 April 2023).
- Aspen Tech. Aspen HYSYS Unit Operation Guide; AspenTech: Bedford, MA, USA, 2020. [Google Scholar]
- Aspen Tech. Aspen FCC Reactor Operation Guide; AspenTech: Bedford, MA, USA, 2020. [Google Scholar]
- Aspen Tech. Aspen Publishers FCC, V.12.1; User Guide; AspenTech: Bedford, MA, USA, 2020. [Google Scholar]
- Cubic Equations of State (Thermo.eos); The ACS Publications. Available online: https://pubs.acs.org/doi/abs/10.1021/ie020447b (accessed on 7 April 2023).
- Juma, H. Chemical Process Design and Simulation; John Wiley & Sons Inc.: Hoboken, NJ, USA, 2019; Chapter 9. [Google Scholar]
- Riyahin, M.; Montazeri, G.M.; Jamoosian, L.; Farahbod, F. PVT-generated correlations of heavy oil properties. Petrol. Sci. Technol. 2014, 32, 703–711. [Google Scholar] [CrossRef]
- Semia, T. Analysis of environmental burdens on byproduct hydrogen in oil refinery using a matrix. Method Jpn. Soc. Energy Resour. 2011, 33, 23–31. [Google Scholar]
- JPEC. Possibility of Domestic Refinery Shift to Petrochemicals and Strengthening of International Competitiveness for Future Demand Structural Changes in Japan and Overseas; Report No. 201002; Japan Petroleum Energy Technology Center: Tokyo, Japan, 2020. [Google Scholar]
- Standard Calorific Value by Energy Source/Carbon Emission Factor; Government Agency for Natural Resources and Energy. Available online: https://www.enecho.meti.go.jp/statistics/total_energy/pdf/stte_028.pdf (accessed on 7 April 2023).
- JPEC. Analysis of Energy Consumption and CO2 Emissions in the Oil Refining Stage; Japan Petroleum Energy Technology Center: Tokyo, Japan, 2022. [Google Scholar]
- Carbon Pricing Dashboard/The World Bank. Available online: https://carbonpricingdashboard.worldbank.org/map_data (accessed on 7 April 2023).
- Bai, P.; Etim, U.J.; Yan, Z.; Mintova, S.; Zhang, Z.; Zhong, Z.; Gao, X. Fluid catalytic cracking technology: Current status and recent discoveries on catalyst contamination. Catal. Rev. 2019, 61, 333–405. [Google Scholar]
- Al-Lagtah, N.M. A case study on the application of Aspen HYSYS to optimize the performance of an existing gas sweetening process plant. In Proceedings of the 2015 Spring Meeting & 11th Global Congress on Process Safety, Austin, TX, USA, 26–30April 2015. [Google Scholar]
- Zhang, Y.; Li, Z.; Wang, Z.; Jin, Q. Optimization study on increasing yield and capacity of fluid catalytic cracking (FCC) units. Processes 2021, 9, 1497. [Google Scholar] [CrossRef]
- Panorama Date Insights. Global Needle Coke Market Expected to Be Worth USD 8.76 Billion by 2030; PR Times; Panorama; Tokyo, Japan; 2022. Available online: https://prtimes.jp/main/html/rd/p/000000074.000091008.html (accessed on 7 April 2023).
Disclaimer/Publisher’s Note: The statements, opinions and data contained in all publications are solely those of the individual author(s) and contributor(s) and not of MDPI and/or the editor(s). MDPI and/or the editor(s) disclaim responsibility for any injury to people or property resulting from any ideas, methods, instructions or products referred to in the content. |
© 2023 by the authors. Licensee MDPI, Basel, Switzerland. This article is an open access article distributed under the terms and conditions of the Creative Commons Attribution (CC BY) license (https://creativecommons.org/licenses/by/4.0/).