Abstract
Fiber-reinforced additive manufacturing components have been used in various industrial applications in recent years, including in the production of aerospace, automobile, and biomedical components. Compared to conventional methods, additive manufacturing (AM) methods can be used to obtainin lighter parts with superior mechanical properties with lower setup costs and the ability to design more complex parts. Additionally, the fabrication of onyx composites using the conventional method can result in delamination, which is a significant issue during composite machining. To address these shortcomings, the fabrication of onyx composites via additive manufacturing with the Mark forged 3D-composite printer was considered. Machinability tests were conducted using abrasive water jet machining (AWJM) with various drilling diameters, traverse speeds, and abrasive mass flow rates. These parameters were optimized using Taguchi analysis and then validated using the Genetic algorithm (GA) and the Moth Flame Optimization algorithm (MFO). The surface morphology (Dmax) and the roughness of the drilled holes were determined using a vision measuring machine with 2D software (MITUTOYO v5.0) and a contact-type surface roughness tester. Confirmation testing demonstrated that the predicted values werenearly identical to the experimental standards. During the drilling of an onyx polymer composite, regression models, genetic algorithms and the Moth-Flame Optimization algorithm were used to estimate the response surface of delamination damage and surface roughness.
1. Introduction
Composites reinforced with onyx have high degrees of strength, stiffness, fatigue strength, corrosion resistance, and wear resistance, as well as being lightweight. As reported by Fernandes et al. and He, Q et al. [1,2], such composites have many industrial structural applications, including aerospace, valves and fittings, robot grippers, tools, battery cell holders, cargo and passenger doors, jigs and fixtures, wind turbine blades, automotive, prototype parts, and civil structures. Compared to other manufacturing methods, additive manufacturing (AM) enables the 3D printing of complex structures that arelightweight and cost-effective with minimal material waste, as well as offering reduced fuel consumption due to the use of improved geometrical structures and short lead times. Different types of AM techniques have beendeveloped in the industry, such as selective laser sintering (SLS), fused deposition modelling (FDM), stereo-lithography apparatus (SLA), direct metal deposition (DMD), direct inkjet printing (DIP), laminated object manufacturing (LOM), and selective laser melting (SLM). These methods differ in their approach tolayer deposition and the types of materials used in the fabrication process [3]. FDM is the most adaptable AM process that provides serviceable parts and prototypes usingvarious thermoplastic polymers; it can be applied to produce complex geometrical parts at low cost with excellent recyclability [4]. Methods for the post-processing of the internal surfaces of AM parts, with regard to their porosity, poor surface finish, and voids, are discussed in [5]. The internal surfaces of AM parts cannot be machined through conventional methods. As such, unconventional methods, such as ultrasonic machining, water jet machining, abrasive flow jet machining, abrasive water jet machining (AWJM), and abrasive barrel machining, are most suitable. Overall, the AWJM process is environmentally friendly and low-cost. Further, compared to other techniques, AWJM has negligible thermal deformation, no change in physical and chemical properties, and less chemical contamination, and does not require the use of a cutting fluid. Fused deposition modeling, a 3D printing technique, was used to fabricate a composite material with a Mark forged Mark Two Desktop 3D printer. According to Sanei et al. and Caminero, M. et al. [6,7,8], the printer achieved greater stiffness, durability, and reliability, with consistent results and unique strength. Figure 1 illustrates the various manufacturing processes associated with 3D printers.
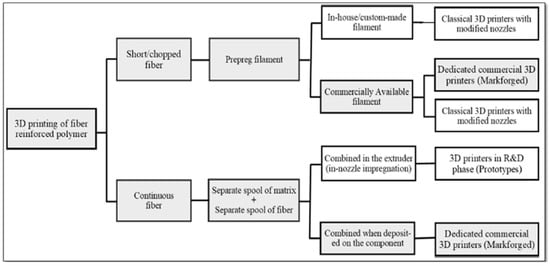
Figure 1.
The manufacturing process of 3D printed fiber-reinforced polymer composite [6].
Polymer composite materials require sequential machining operations to achievedimensional tolerances and assembly. During the machining of composite materials, the inner layers suffer from damage related to delamination, resulting from the machining process parameters and the drilling geometry. At present, the machining (drilling) of polymer matrix composites is a significant challenge. Failure modes are oftenobserved in polymer composite materials, such as intralaminar matrix cracking, fiber fractures, fiber-matrix debonding, fiber pull in and out, delamination, and longitudinal matrix splitting during the machining process because of localized impact loads. Abrao et al., Benardos et al., and Rubio et al. [9,10,11] noted that severe delamination and higher surface roughness values were observed during the drilling of the fiber-reinforced composite plastics. These characteristics significantly affected the resulting plastics. Tan et al. [12] stated that themachining process parameters can beoptimized through statistical analysis and the Taguchi method tocontrol the delamination damage and surface roughness.
As reported by Masoud et al. [13], the conventional machining process, i.e., sawing, milling, and drilling, is used to make holes and profiles and to trim polymer matrix composite materials as well as metal matrix composites. In the conventional machining of polymer matrix composite materials, one of the significant disadvantages is the poor surface quality because of thecomplexity of composite materials. As reported by Abdullah et al., Solati et al. [14,15], and Hejjaji et al. [16], during theconventionaldrilling of composite materials such as carbon and glass fibers, the cutting tool produces ashear force, resulting indelamination.Rao et al. [17] proposed laser drilling as an alternativeto conventional drilling methods due to the absence of tool wear, vibrations, and thrust force. However, drilling using lasers results in the ablation of composites due to thermal effects. Therefore, the optimization of the process parameters is an important aspect which determines the quality of drilled holes.
Yallewet al. [18] reported on differences in surface quality based on the cutting tool geometry inthe machining of the fiber-based composite materials. Celiket al. [19] concluded that the conventional machining process parameters significantly affect fiber-reinforced polymer composite materials in terms ofsurface damage and the delamination factor. The Markforged 3D printer can make net-shaped holesin 3D printed parts, resulting in good quality final products; however, this process increases the surface roughness. Moreover, obtaining accurate dimensions of the hole is a daunting task. Osama et al. [20], Akhilesh et al. [21], Atzeni, E et al. [22], and Khorasani, M et al. [5] reported that 3D-printed parts suffer frompoor surface roughness, dimensional inaccuracies, and warping. For these reasons, the present study is focused primarily on abrasive water jet machining (AWJM), a flexible process for achieving high productivity withhigher material removal rates [23]. Compared to conventional machining, the AWJM process produces lower cutting forces and useslowertemperatures. Therefore, AWJM is of great interest formachining, reducing defects in or deterioration ofthe polymer matricesof composite materials. Banon et al. [24] stated that AWJM does not require the use of physical tools, resulting in significantly less wear on auxiliary components and reduced cost. Ramesha and Akhtar [25] stated that the aforementionedmachining issues can be resolved through AWJM, noting that the approach is ten times more rapid than conventional machining. Prabu et al. [26] concluded that the AWJM drilling process is completely free ofcutting tools, chip generation, plastic delamination, and thrust force (TF).
Ming et al. [27] investigated the surface quality of glass fibers and carbon fibers reinforced with epoxy matricesmachined usingthe AWJM process. Based on ananalysis of variance (ANOVA), it was concluded that the abrasive mass flow rate, hydraulic pressure, and transverse speed aremajor influencing factorson the surface quality of hybrid polymer composite materials. Jagadeesh et al. [28] and Seyedaliet al. [29,30] studied these statistical results, which were benchmarked based on algorithms such as GA and MFO to provide optimized and competitive results. James et al. [31] identified the optimum machining parameters for metals and composites via the design of experiments (DOE) approach, followed by ANOVA.
Based on a literature review, machinability studies on3D printed onyx polymer compositepartshave not been reported. Therefore, we assessedthe characteristics of mark forged (FDM) 3D printed parts made of onyx polymer composites followingmachinability studies (drilling) usingAWJM. In the present work, we selectedappropriate machining process parameters, e.g., traverse speed rate (mm/min), drilling diameter (mm), and abrasive mass flow rate (g/min), for an onyx polymer composite through Taguchi analysis and optimization algorithms (GA and MFO) to minimize delaminationand lower the surface roughness.
2. Materials and Methods
Onyx composite consists of 80% nylon and 20% carbon. The onyx grade used in the present study wasPA6. Onyx fiber filaments were procured from M/s Adroitec information systems Pvt. Ltd. (Noida, India) in U.P. The mechanical properties of the composite material were as follows density—1.2 g/cc, Tensile stress at yield—40MPa (ASTM D638), Tensile Modulus—2.4 GPa (ASTM D638), Flexural strength—71 MPa (ASTM D790), Flexural Modulus—3.0 GPa (ASTM D790), and Izod Impact Strength—330 J/m (ASTM D256-10A), as reported by Markforged, Watertown, MA, USA [32]. The melting point of onyx fiber is 270°C.The presentstudy soughtto optimize the AWJM process parameters to obtain the most favorable delamination and surface roughness characteristics. The onyx, a mixture of nylon with continuous carbon fiber and plastic filaments, was fabricated using Markforged (USA) Mark Two Desktop composite 3D printers, as shown in Figure 2a,b, through the fusion deposition modeling technique. The onyx wasmodeled using the Solid Works computer-aided design (CAD) software version 18.0, as illustrated in Figure 2c. The onyx printing parameters were set to 100 layers with a solid fill pattern, where each layer had a thickness of 0.125 mm and the infill density wasset to 100%. The 3D printing parameters are shown in Table 1. As shown in Figure 2d, the dimensions of the printed onyxwere 100 × 100 × 10 mm. The shore D hardnessof the onyx was measured using a durometer, as per the ASTM D 2240 standard; a value of 68 was obtained.
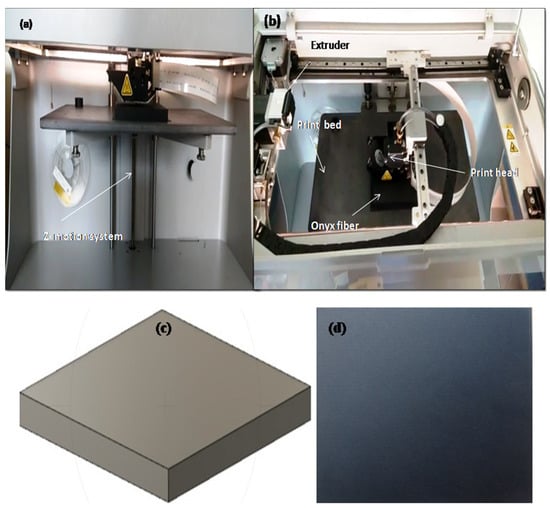
Figure 2.
Printing of Onyx fiber using Markforged Mark Two Desktop composite 3D printers. Experimental setup: (a) Front view, (b) Top view, (c) onyx CAD model, and (d) printed onyx.

Table 1.
Markforged (Mark Two) FDM-3D printerparameters.
The machinability (drilling) of an onyx polymer composite using AWJM is summarizedin Figure 3. The AWJM has a travel capacity of 3500 mm on the Xaxis and 1500 mm on the Yaxis. Table 2 shows the constant condition parameters used during the AWJ machining experiments [33,34].
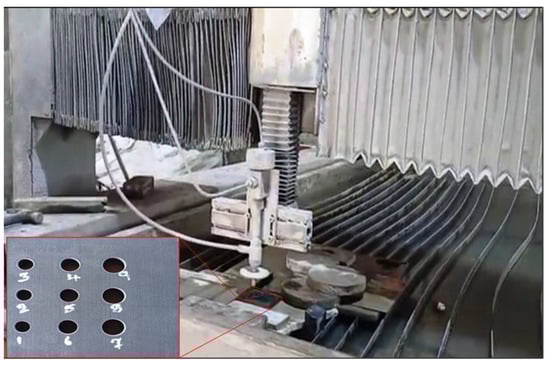
Figure 3.
Experimental AWJM setup for drilling of onyx composite.
Table 2.
Constant parameters used for the AWJM process.
AWJM is an advanced non-traditional machining method which iswidely used in many industrial and manufacturing applications. It is a cold machining process in which abrasives are proportionally mixed with water, which passes through an extremely fine jet at high velocity (1000 m/s) to assist in the removal of material by plastic deformation. The pressurized abrasive water jet is focused ontothe work piece; the velocity of the fluid is reduced to virtually zero after striking the surface of the work piece. After striking, the kinetic energy is transformed into pressure energy. The AWJM process has many advantages, such as low cutting force, high flexibility, no heat affected zone, no residual stress formation, eco-friendliness, ability to generate complex shapes, and high machining performance. Moreover, in this method, as the tool is not in direct contact with the work piece, the mechanical properties of the work piece are retained [35,36,37].
Design of Experiments and Optimization Techniques
Taguchi analysis, combined with experimental design theory and the quality loss function, was used to minimize the production time, cost, and required materials [38]. The Taguchi design of experiments (DOE) and the L9 orthogonal array were reported by Sesharaoet al., Chohanet al., Sakthi et al., Kuset al. [39,40,41,42]. This approach wasappliedin the current machinability study, where the controllable parameters were drilling diameter, traverse speed rate, and abrasive mass flow rate. Table 3 shows summarizes these settings. The experimental results, such as the delamination factor at hole entry and exit and the surface roughness, were examined using the signal to noise (S/N) ratio, where lower values are preferable. The term ‘signal’ denotes the preferred response, while ‘noise’ denotes undesirable values resulting from uncontrollable factors. The S/N ratio is shown below (Equation (1)) [43,44].
where n represents the replication number and y represents the observed response value.
Table 3.
Design of control factors and levels for Taguchi Analysis.
The optimum drilling parameters were determined in this study using the S/N ratio through graph data and a response table. Furthermore, ANOVA yielded an estimate of the percentage of contribution (PC) of the response parameters. Aregression model was developed to ascertain the relationship between the process parameters and output (response) parameters. Figure 4 shows the response parameters regarding delamination, i.e., peeling at the entry hole and pushing out at theexit, as measured using the Profile Projector Vision Measuring Machine (VMM) 2D software (MITUTOYO v5.0). The surface roughness was measured using a contact-type surface roughness tester, as shown in Figure 5. Damage due to delamination factor Fd was measured during onyx composite drilling; such damage was observed on both sides of the onyx composite, i.e., jet entry and exit. The delamination factor was calculated using the standard formulae (Fd = Dmax/Do), as reported by Vigneshwaran et al. [45], where Dmax is the maximum diameter of the delaminated area and the Do is nominal or actual diameter of the drilled hole. Dmax was calculated for the peel up at the entry hole and push out at the exit hole using VMM followed and a2D software (MITUTOYO) three-point method. Each measurementwas madeten times and the average values were recorded [46]. In the current study, the Minitab ‘17’software was used to analyze process parameters such as traverse speed rate (mm/min), drilling diameter (mm), and abrasive mass flow rate (g/min). To identifythe best possible solutions for the machining process parameters of the onyx composite, optimization techniques such as the Moth-Flame Optimization (MFO) algorithm and genetic algorithm (GA) were used. The algorithms use a list of parameters, as shown in Table 4. These input parameters were selected based on aliterature survey, drawing on the findings ofGeetha et al. [47], Lenin et al. [48], Yang et al. [49], Chohan et al. [40], Antil et al. [30], Nadimi et al. [50], Shehab et al. [51], Mirjalili et al. [29], and Buch et al. [52].
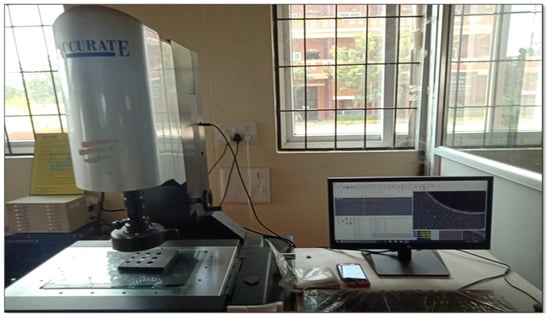
Figure 4.
Profile projector vision measuring machine for the delamination of an onyx composite.
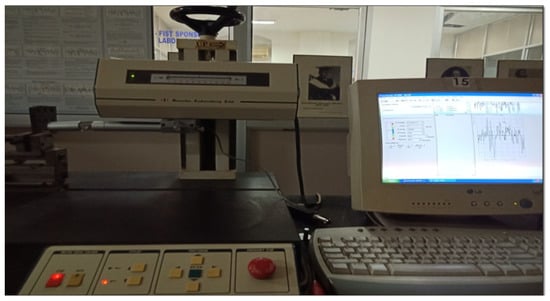
Figure 5.
Measurement of surface roughness.
Table 4.
List of algorithm parameters.
3. Results and Discussion
3.1. Delamination Factor on Onyx Composite
Machinability studies (drilling) were carried out on the onyx composite, using AWJM to assess the impact of the machining process parameters on work piece damage. Figure 6 shows the maximum measured damage drilled hole diameter (Dmax). Table 5 shows the effect of the machining process parameters on the delamination factor for peel up and push out. It can be seen that as the abrasive mass flow rate increased, the delamination factor value decreasedfor both the peel up and push out. We found that alower traverse speed rate could reduce the delamination factor and improve thesurface roughness (Ra).
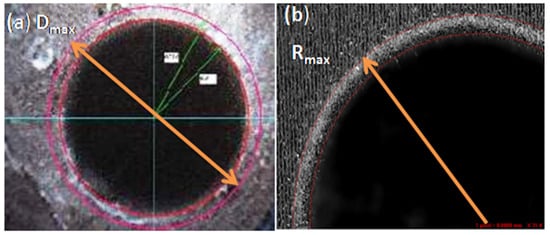
Figure 6.
Measurement of maximum damage drilled hole diameter (Dmax): (a) Peel up at the entry hole and (b) Push out at the exithole.
Table 5.
Design of theL9 orthogonal array used for Taguchi analysisand measured values for delamination peel up at the entryhole, push out at the exit hole, and surface roughness.
As shown in Table 5, the delamination aspect ranged from 0.69600 to 1.43780 for peel up delamination and from 0.6856 to 1.1120 for push out. These factor values werelower than those reported by several other researchers in previous studies usingconventional drilling forGFRP and CFRP composites [12,28,46,53]. ATaguchi statistical analysis was performed using the S/N ratio characteristics for the observed response value, as shown in Figure 7 and Figure 8. The machining process parameters variedfrom levels1 to 3. Based on the results shown in Figure 7 and Figure 8, it is clear that the drilling diameter significantly influences the delamination damage (hole entry and exit), as do the traverse speed rate and the abrasive mass flow rate. The latter appears to be the most influential factor fordelamination, as evidenced inthe response graph from level 1 to 3. Adrilling diameter of 12 mm, a traverse speed rate of 30 mm/min, and an abrasive mass flow rate of 450 g/min were found to be the optimal drilling process parameters for minimizing delamination factor peel up and push out. As such, it was noted that a larger drilling diameter, a lower traverse rate, and a higher abrasive mass flow rate were desirablefor drilling onyx composite. Conversely, a smaller drilling diameter, a higher traverse speed, and a lower abrasive mass flow rate yielded poor-quality holes (with a higher delamination factor) in the onyx composite. For such a composite, during AWJM, the drilling diameter has a major influence on the delamination factor and surface roughness. Table 5 shows the delamination factor (peel up and push out) and surface roughnesswith different drilling diameters (8 mm to 12 mm). Notably, with drilling diameters of 8 mm and 10 mm, ahigher delamination factor and greater surface roughness wereobserved than when using adrilling diameter of 12 mm.
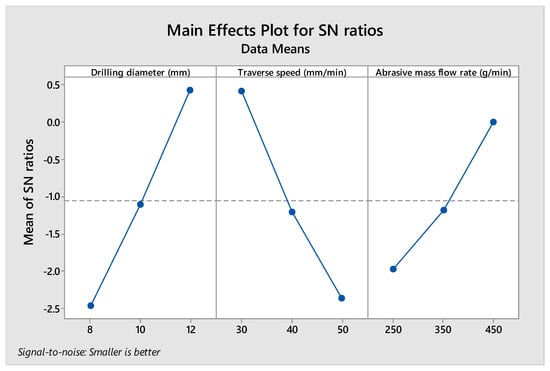
Figure 7.
Response graph of S/N ration for delamination peel up at entryhole.
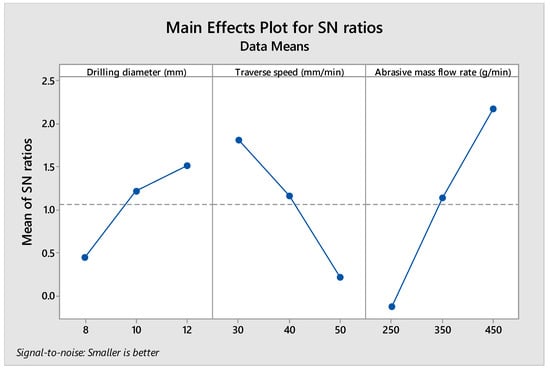
Figure 8.
Response graph of S/N ration for delamination push out at exithole.
3.2. Surface Roughness on Onyx Composite Fiber
Table 5 shows the effect of the machining process parameters on surface roughness values, similar to the effect of delamination factor peel up and push out. It can be seen that as the abrasive mass flow rate increased, lower surface roughness values were noted. Additionally, the higher the traverse speed rate, the higher the surface roughness. In contrast, alowerdrilling diameter, a higher traverse speed, and a lower abrasive mass flow rate produced higher surface roughness values. The surface roughness response for each factor and level was summarized using the S/N ratio, as shown in Figure 9. The drilling process parameters varied from level 1 to level 3.
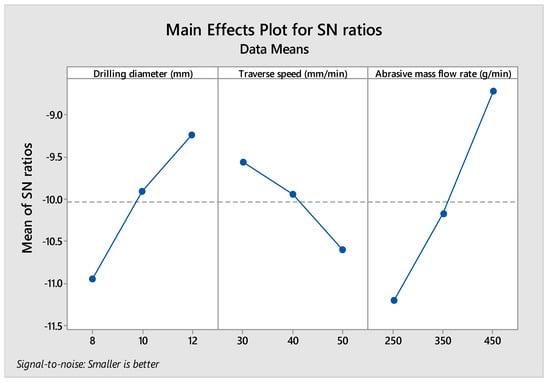
Figure 9.
Response graph ofS/N ration for onyx composite fiber drilled hole surface roughness.
Based on the response graph of the S/N ratio shown in Figure 9, it is clear that the abrasive mass flow rate significantly influences the surface roughness, as do the traverse speed rate and the drilling diameter.
From the mean effects plots in Figure 10 and Figure 11 and Table 5, it may beobserved that a higher abrasive mass flow rate, a lower traverse speed rate, and a higher drilling diameter resulted in a lower delamination factor at both hole entry and exit. This is because of the increased momentum of the abrasive particles with higher water jet pressure (380 MPa). The abrasive particles tend to obtainmore cutting energy with a low traverse speed rate, which explainsthe lower delamination and smooth surface roughness value. Similarly, in the effects plot of surface roughness shown in Figure 12, it was noted that with ahigher abrasive mass flow rate, lower traverse speed rate, and higher drilling diameter, lower surface roughness was observed. This is due to the fact that at a higher abrasive mass flow rate and lower traverse speed rate, the cutting action and overlapof abrasive particles on the surface occur in a shorter timeframe, thereby increasing the smooth surface roughness value.
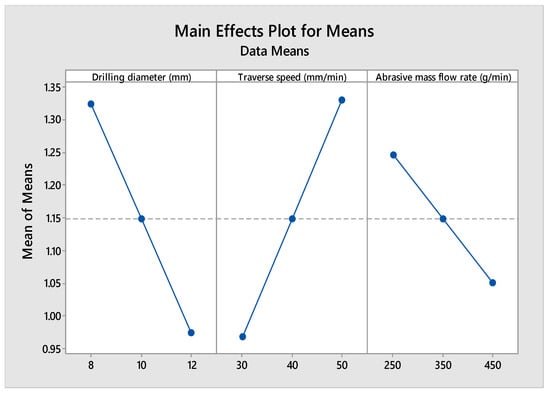
Figure 10.
Main effects of delamination factor at hole entry.
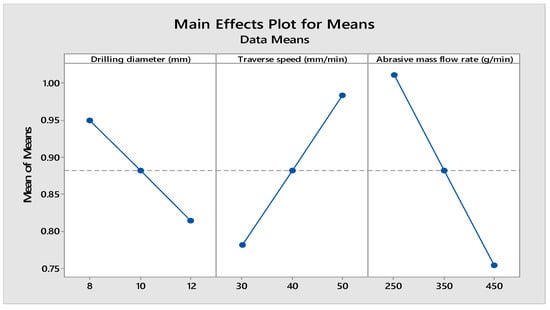
Figure 11.
Main effects of delamination factor at hole exit.
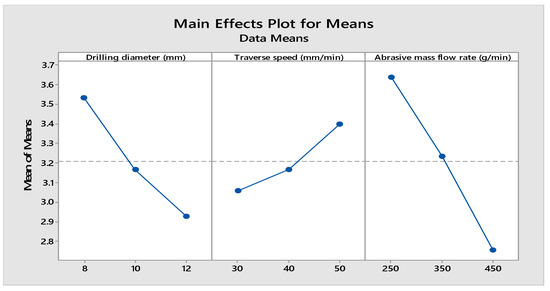
Figure 12.
Main effects of surface roughness (Ra).
3.3. Multiple Linear Regression Model and ANOVA
In the current study, correlation regression analysis of multiple linear regression analysis was used to determine the delamination factor peel-up, push-out, and surface roughnessresponse of an onyx composite. The R2 (99.1%) of the regression coefficient delamination factor peel-up standard is in good qualitative agreement with the adjusted R2 (96.4%) value obtained. Similarly, in ourstudy, the delamination factor pushes out standard of the regression coefficient R2 (99.6%) isin conformity with the adjusted R2 (98.5%), as isthe corresponding surface roughness standard of the regression coefficient R2 (99.6%) with the adjusted R2 (98.3%).
Regression equations for the delamination factor peel-up, delamination factor push out, and surface roughnesswerecreated:
Delamination peel up = 1.7632 − 0.08857 Drilling diameter (mm) + 0.016808 Traverse speed (mm/min) − 0.001137 Abrasive mass flow rate (g/min)
Delamination push out = 1.2396 − 0.02547 Drilling diameter (mm) + 0.00793 Traverse speed (mm/min) − 0.001167 Abrasive mass flow rate (g/min)
Surface roughness = 5.587 − 0.1517 Drilling diameter (mm) + 0.01693 Traverse speed (mm/min) − 0.004397 Abrasive mass flow rate (g/min)
According to Equations (2)–(4), the drilling diameter, traverse speed rate, and abrasive mass flow rate all play a significant role in the response of the onyx composite delamination factor (peel up, push out) and surface roughness. The drilling parameters (i.e., drilling diameter (12 mm), traverse speed rate (30 mm/min), and abrasive mass flow rate (450 g/min)) were optimized based on the response graph of the S/N ratio and the mean analysis shown in Figure 7, Figure 8, Figure 9, Figure 10, Figure 11 and Figure 12. ANOVA was performed and pseudocode of the optimization algorithms wascreatedusing MINITAB 17.0 and MATLAB 18.0 to accurately verify the desired drilling process parameters and the corresponding importance of each factor onthe delamination and surface roughness.
Based on the ANOVA, the p-value wasless than 0.05, as shown in Table 6 and Table 7; it was determined with a 95% confidence level that the drilling operation parametershavea clear impact. Table 6 and Table 7 show the percentage of contribution (PC) of each parameter in the last column. According to Table 6, the drilling diameter and traverse speed rate are the most significant contributing factors to delamination peelup at the entry hole. In contrast, the abrasive mass flow rate and traverse speed rate (30 mm/min) were found to be the most important contributing factors to push out at the exit hole and surface roughness; see Table 7. The S/N ratio and the ANOVA results were consistent with each other. For delamination peel-up, the PC results of the drilling diameter (41.163 %) and traverse speed rate (38.430%) were found to befar more influencing factors than the abrasive mass flow rate (19.498%). In contrast, the delamination push out at hole exit was shown to be more influenced by the abrasive mass flow rate (58.116%) and the traverse speed rate (28.301%) than the drilling diameter (13.212%) foronyx composite materials. In ANOVA, the abrasive mass flow rate (59.69088%) wasthe most influencing factor on surface roughness, followed by drilling diameter (28.89676%) and traverse speed rate (10.66138%), as shown in Table 7.
Table 6.
ANOVA analysis for delamination peel up at the entry hole and push out at the exit hole.
Table 7.
ANOVA analysis for surface roughness.
3.4. Interaction Plot for Delamination Factor and Surface Roughness
The interaction plots, as shown in Figure 13, Figure 14 and Figure 15, revealed an increasing trend inthe abrasive mass flow rate, a decreasing trend inthe traverse speed rate, and an increasing trend inthe geometry of the hole, indicating a lower delamination factor (peel up, push out) value and reduced surface roughness. The maximum delamination factor peel-up (1.43780) was observed with a higher traverse speed rate (50 mm/min), lower drilling diameter (8 mm and 10 mm), and lower abrasive mass flow rate (250 g/min) because of insufficient kinetic energy. In addition, the chipping effect was observed as a result of fiber interfacial debonding, as shown in Figure 16. Similarly, the chipping effect was observed due to the pull-out mechanism for the delamination factor push-out, as shown in Figure 17. Because of better fiber interfacial bonding, the delamination factor push out (1.1120) was lower value than the delamination factor peel up. In contrast, whenthe abrasive mass flow rate (350 g/min) increased the delamination factor peel up and the push-out value decreased (Figure 13 and Figure 14). However, chipping was observed in both cases (Figure 18 and Figure 19) at a faster traverse speed rate (50 mm/min), lower abrasive mass flow rate, and lower drilling diameter (8 mm and 10 mm), which led to insufficient kinetic energy over the target material. Similarly, as shown in Figure 15, the maximum surface roughness (3.8025 μm) was observed with a higher traverse speed rate (50 mm/min), lower drilling diameter (8 mm), and a lower abrasive mass flow rate (250 g/min). Compared to anabrasive mass flow rate of 250 g/min, a traverse speed rate of 50 mm/min, and adrilling diameter of 8 mm, the increasing trend of abrasive mass flow rate (350 g/min, 450 g/min) and drilling diameter (10 mm, 12 mm) and the decreasing trend of traverse speed rate (30 mm/min) resulted in a lower surface roughness value (Figure 15 and Table 5). According to the interaction plot, the optimized machining (drilling) process parameters of drilling diameter (12 mm), traverse speed rate (30 mm/min), and abrasive mass flow rate (450 g/min) resulted in the lowest delamination factor and surface roughness. Furthermore, the chipping effect was not observed with these parameters due to the higher kinetic energy over the target material (good fiber interfacial bonding) (Figure 20 and Figure 21).
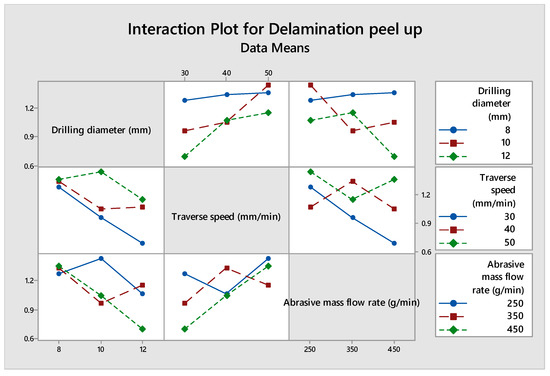
Figure 13.
Interaction plot for delamination peel up.
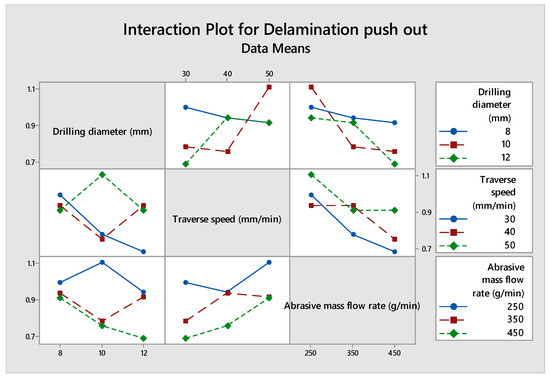
Figure 14.
Interaction plot for delamination push out.
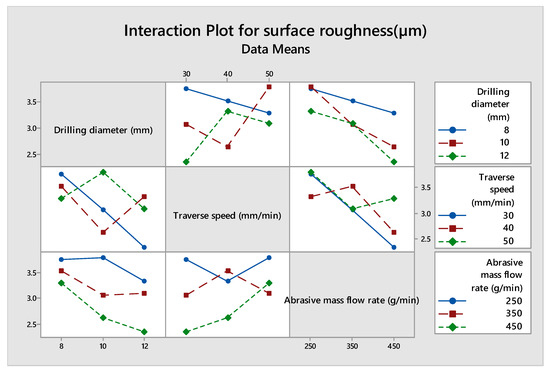
Figure 15.
Interaction plot for surface roughness.
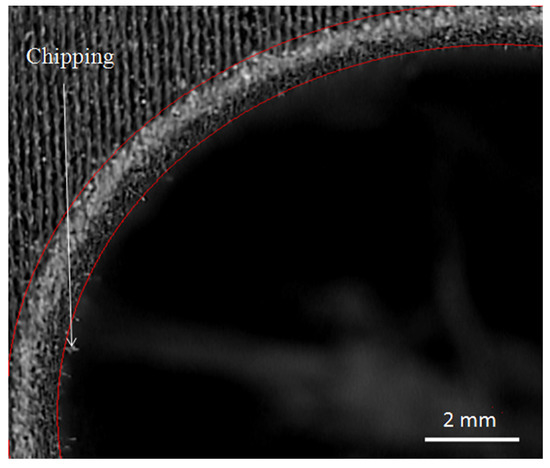
Figure 16.
Delamination peel up on a drilled hole surface with adrilling diameter of 10 mm, a traverse speed rate of 50 mm/min, and an abrasive mass flow rate of 250 g/min.
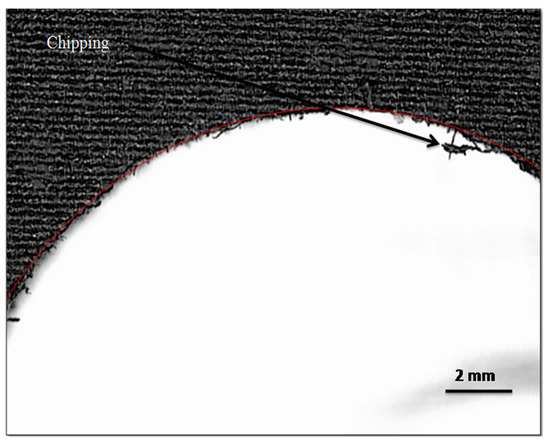
Figure 17.
Delamination push out on a drilled hole surface with adrilling diameter of 10 mm, a traverse speed rate of 50 mm/min, and anabrasive mass flow rate of 250 g/min.
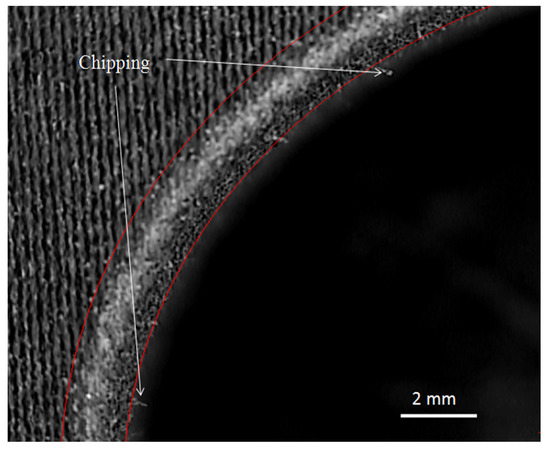
Figure 18.
Delamination peel up on a drilled hole surface with adrilling diameter of 12 mm, a traverse speed rate of 50 mm/min, and an abrasive mass flow rate of 350 g/min.
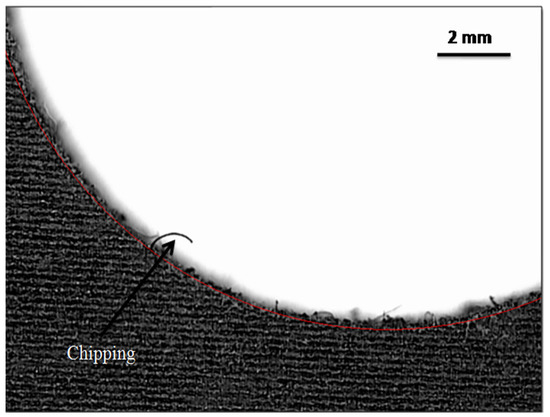
Figure 19.
Delamination push out on a drilled hole surface with a drilling diameter of 12 mm, a traverse speed rate of 50 mm/min, and andabrasive mass flow rate of 350 g/min.
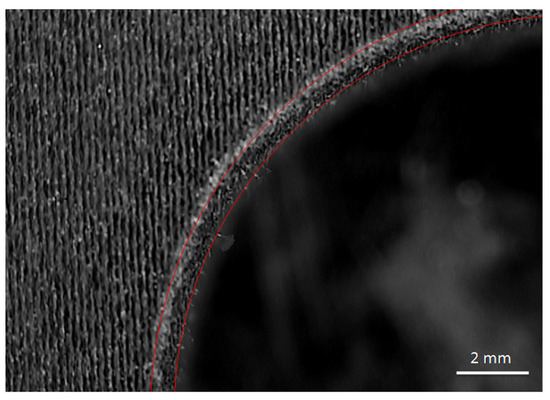
Figure 20.
Delamination peel up on a drilled hole surface with adrilling diameter of 12 mm), a traverse speed rate of 30 mm/min, and anabrasive mass flow rate of 450 g/min.
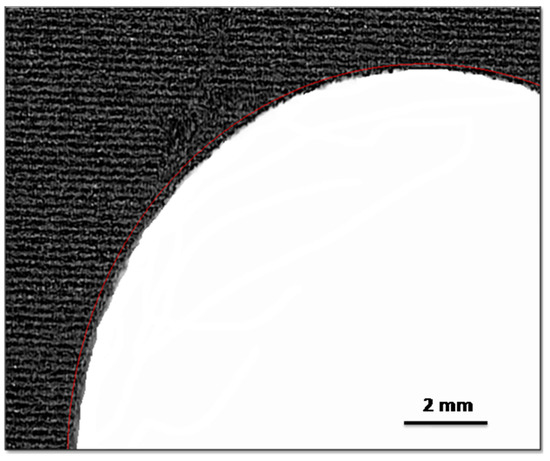
Figure 21.
Delamination push out with a drilling diameter of 12 mm, a traverse speed rate of 30 mm/min, and anabrasive mass flow rate of 450 g/min.
Comparative Study of Unconventional Machining Process Methods and Other Methods
By using special equipment, the material removal which occurs in unconventional machining process (UCM) methods is based onminimal cutting force, high pressure, high frequency vibration, and high temperature. This is completely different from conventional material removing techniques [54]. Wire electro discharge machining (WEDM) has limitations for machining operations, as only conductive materials can be used [55]. Other types of unconventional machining processesinclude laser, water jet, electrochemical, and ultrasonic machining [45]. Compared to UCM processes, with AWJM, machining is based on the machining process parameters and thematerial properties. Table 8 shows the delamination damage and surface roughness resulting fromthe AWJM process compared to those of other methods. Conventional machining techniques often lead to poor surface finish, fiber pullout, harsh damage to sub surfaces, and a high level of matrix removal, resulting inuneven surfaceroughnessdue to the higher thrust force and torque which are applied, as reported by Vinod et al. [56], Azmi et al. [57], Debnath et al. [58], and Dvivediet al. [59].
Table 8.
Delamination damage and surface roughness in the AWJM process compared to those resulting from other methods.
AWJM is the most suitable machining method for fiber-reinforced composites because of the minimal cutting force used and the absence of aheat-affected zone (HAZ). Due to the absence of cutting tools during machining, delamination damage isreduced drastically when compared to other machining techniquesand thermal distortion effects are eliminated. Moreover, choosing appropriate variables for AWJM, such as lower traverse speed rate, higher abrasive mass flow rate, and higher water jet pressure, leads to reduced delamination of onyx composites. Higher abrasive mass flow rate and water jet pressure lead to increasedkinetic energy ofthe abrasive particles impacting the work piece surface, enhancing the drilling of the material, i.e., achieving better surface roughness and high jet penetration and minimizing the delamination factor. Lower traverse speed rates may increasethe number of abrasive particles, which has an influence on the work piece over time, resulting in improved surface roughness andminimization of the delamination factor and penetration depth (Momber et al. [65] and Karakurt et al. [66]). The other input process parameters and interactionsamong themwere found to be less significant due to the failure of astatistical test. Compared to other methods, AWJM is a low-cost production technique, a time saving process, and is more environmentally friendly. It can be applied in the machining of metals, non-metals, and synthetic and natural fiber composite materials.
3.5. Probability Plot for the Delamination Factor and Surface Roughness
Figure 22, Figure 23 and Figure 24 show the normal probability function plotted between the response values in the Xaxis and the percentage in the Yaxis. The response values of delamination peel up, delamination push out, and surface roughness points were fitted within the central line, as indicated by the central limit theorem. The goodness of fit is also shown for the data response values. As shown, the response data are typically distributed close to the central line. Similar analyses were reported by Vankanti et al. [56]. The presentwork will be useful for industries for the selection of process parameters to improve thequality of drilled holes in onyx composite materials by reducing delamination.
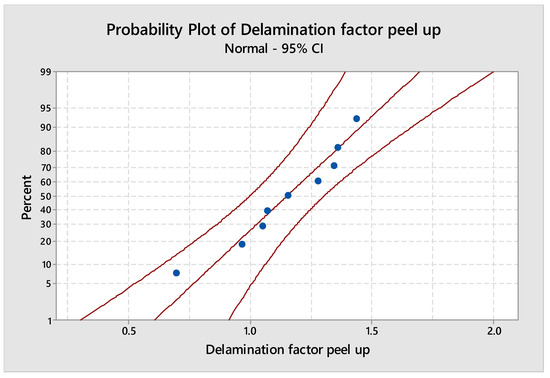
Figure 22.
Probability plot of delamination factor peel up.
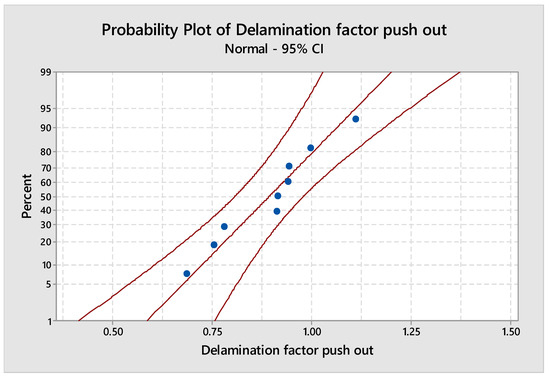
Figure 23.
Probability plot for delamination push out.
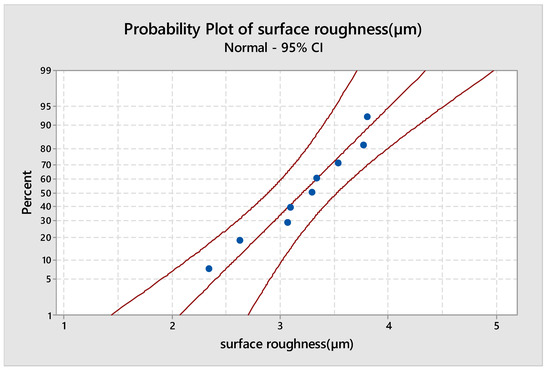
Figure 24.
Probability plot for surface roughness.
3.6. Pseudocode of Optimization Algorithms
The optimum drilling process parameters were identified and validated using pseudocode of optimization algorithms such as the Moth Flame Optimization Algorithm 1 (MFO) and the Genetic Algorithm 2 (GA), as shown in Figure 25, Figure 26 and Figure 27.
| Algorithm 1 Moth-Flame Optimization Algorithm |
| Read the lower and upper bounds of each parameter along with the number of Flames (mf) |
| Initialize Moth position Pij randomly (i = 1,2,3…mf and j = 1,2,3…np) |
| For each i = 1:mf |
| Compute the response values Rik(i = 1,2,3…mf and k = 1,2,3…nr) |
| End |
| While (itr ≤ max_itr) |
| Update the position of Pij |
| Calculate the number of flames (nf) = round((mf-(itr*(mf-1)/max_itr))) |
| Evaluate the fitness function Rik |
| If (itr = =1) then |
| F = sort (Pij) |
| OF = sort (Rik) |
| Else |
| F = sort (Pt-1, Pt) |
| OF = sort (Pt-1, Pt) |
| End |
| For each i = 1:mfdo |
| For each j = 1:npdo |
| Update the values of r = −1 + (itr*(-2-1)/max_itr) and t = randbetween(r,1) |
| Calculate the value of D as abs(Fj.− Pi.) |
| Update Pijw.r.t. corresponding Flame |
| End |
| End |
| End |
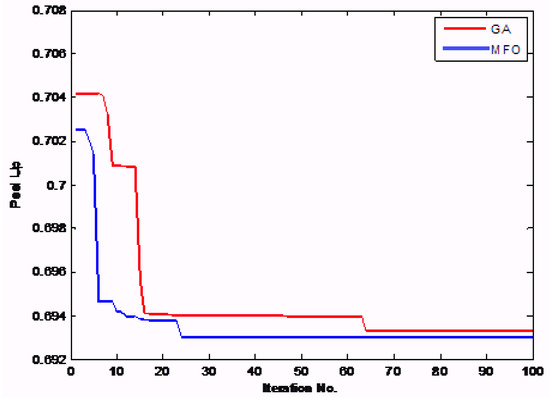
Figure 25.
Convergence plot for delamination peel up value.
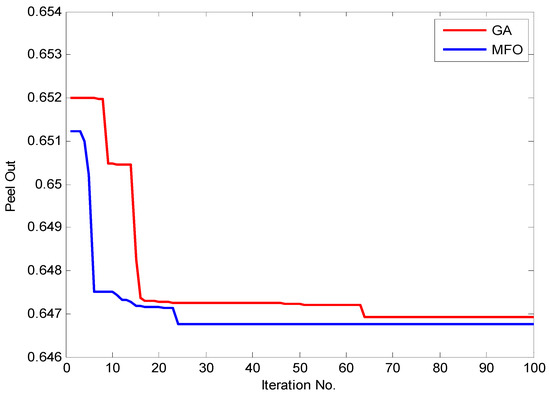
Figure 26.
Convergence plot for delamination push out value.
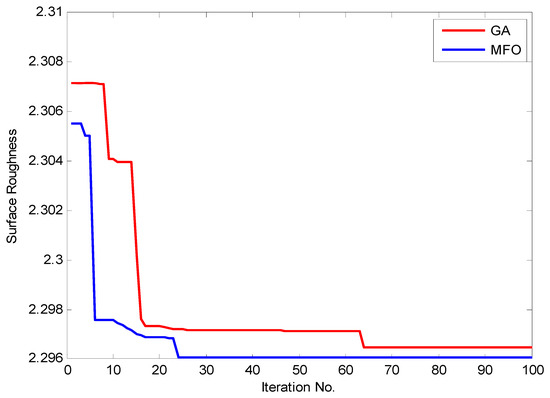
Figure 27.
Convergence plot for surface roughness value.
Using Deng’s Method, we computed the best parameters and theirresponse values:
| Algorithm 2 Genetic Algorithm (GA) |
| Initialize population of chromosomes (Pij) |
| While (itr≤max_itr) |
| Compute Response values Rik |
| Select pareto optimal solutions |
| Select N chromosomes for reproduction |
| Crossover (new chromosome created by crossover operator from N) |
| Mutation (new chromosome created from both reproduction and crossover chromosomes) |
| End |
| Using Deng’s method, we selected the best chromosomes and theirfitness values from pareto optimal front solutions. |
| mf—maximum number of moth flames |
| np—number of parameters |
| nr—number of responses |
| nf—number of flames |
| Pij—ith moth’s jth parameter value |
| Rik—kth response value of ith moth flame |
| Flj—lth flame’s jth parameter value |
3.7. Confirmation Test of the Drilling Process Parameters on Onyx Composite
The best delamination peel up (PU), delamination push out (PO), and surface roughnesswere obtained using optimized drilling process parameters, i.e., drilling diameter—12 mm, traverse speed rate—30 mm/min, and abrasive mass flow rate—450 g/min, as shown in Table 9. The experimental results were almost identical—with a margin of error of less than 6%—to those predicted using the regression model equation, Moth-Flame Optimization algorithm (MFO), and a genetic algorithm (GA). Additionally, both the experimental and predicted values, obtained through Taguchi analysis and Pseudocode of Optimization Algorithms (Figure 25, Figure 26 and Figure 27), were satisfactory. As such, it may be stated that the proposed model is suitable for determining the drilling process parameters foronyx composite using AWJM.
Table 9.
Results of confirmation tests for delamination peel up (PU), pushout (PO), and surface roughness (SR).
AM techniques, which are less expensive than conventional methods, can produce be used to produce complex structures and freeform features such as lattice structures. In contrast, in conventional manufacturing methods, the design of complex geometriesis limited. However, the cost of the model must be considered when AM is used. Conventional manufacturing methods increase the costof the moldand suffer from greater material wastage and manufacturing costs. The presence of cavities, part size, shape complexity, and tolerances influence the choice of the molding material. In this present study, an onyx composite was fabricated using a Markforged Mark Two Desktop composite 3D printer. It wasmachined using abrasive water jet machining (AWJM), and the optimized process parameters were found to create a cheaper manufacturing method compared to conventional methods.
4. Conclusions
The machinability (drilling) using AWJM of anonyx polymer composite was evaluated. Subsequently, Taguchi statistical analysis andANOVA were performed, and the results were validated using a GA and MFO.
The concluding remarks for the present study are as follows.
- ➢
- Based on the Taguchi analysis, S/N ratio, ANOVA, GA, and MFO, the optimal combination of AWJ drilling parameters was identified toachieve low delamination factor peel up, push out, and surface roughness.
- ➢
- Process parameter combinations were identified which conformed to the response of the closeness coefficients: abrasive mass flow rate—450 g/min, traverse speed rate—30 mm/min, and drilling diameter—12 mm.
- ➢
- ANOVA was undertakento investigate the significance of each parameter onthe performance characteristics of AWJM. On this basis, the p value was found to be the most significant factor, followed by abrasive mass flow rate, traverse speed rate, and drilling diameter. The delamination factor and surface roughness couldbe reduced by reducing the traverse speed rate, increasing the abrasive mass flow rate and drilling diameter, and using a constant water jet pressure of 380 MPa. Further increasing the traverse speed rate and reducing the abrasive mass flow rate and drilling diameter increased the delamination factor due to the resulting insufficient kinetic energy over the target material.
- ➢
- Aregression model, a genetic algorithm, and the Moth-Flame Optimization algorithm were used to mathematically model the influenceof the machining operation parameters. Aconfirmation test indicatedthat the experimental results were close to the predicted values fordelamination factorpeel up and push out and surface roughness. It was found that the proposed combination of Taguchi analysis, ANOVA, and the GA and MFO algorithms was more effective in solving AWJM multi response problems.
- ➢
- Finally, it was discovered that the AWJM process is superior to conventional methods for machining onyx composite materials. It can be used in various industrial applications, such as aerospace, automobile, and construction, among others.
The mechanism of the interlaminar deformation of onyx composites during drilling could be further analyzed with the help of the finite element method, and delamination couldbe monitored via the Internet of Things. Variationsin theabrasive water jet pressure will be considered infuture work.
Author Contributions
Conceptualization, D.G.; methodology, D.G.; software, D.G and S.M.; validation, S.S., A.P.M., D.P. and D.G.; formal analysis, D.G.; investigation, D.G.; resources, H.T.; data curation, D.G.; writing—original draft preparation, D.G.; writing—review and editing, S.S., A.P.M.; visualization, S.R.G.; supervision, S.S.; project administration, D.G., S.S., D.P.; funding acquisition, H.M.A.-M.H. All authors have read and agreed to the published version of the manuscript.
Funding
This research received no external funding.
Conflicts of Interest
The authors declare no conflict of interest.
References
- Fernandes, R.R.; Tamijani, A.Y.; Al-Haik, M. Mechanical characterization of additively manufactured fiber-reinforced composites. Aerosp. Sci. Technol. 2021, 113, 106653. [Google Scholar] [CrossRef]
- He, Q.; Man, Z.; Chang, L.; Ye, L. On structure-mechanical and tribological property relationships of additive manufactured continuous carbon fiber/polymer composites. In Structure and Properties of Additive Manufactured Polymer Components; Woodhead Publishing: Cambridge, UK, 2020; pp. 359–387. [Google Scholar] [CrossRef]
- Ali, M.H.; Issayev, G.; Shehab, E.; Sarfraz, S. A critical review of 3D printing and digital manufacturing in construction engineering. Rapid Prototyp. J. 2022, 28, 1312–1324. [Google Scholar] [CrossRef]
- Saini, M. Optimization the process parameter of FDM 3D printer using Taguchi method for improving the tensile strength. Int. J. All Res. Educ. Sci. Methods 2019, 7, 16–24. [Google Scholar]
- Khorasani, M.; Ghasemi, A.; Rolfe, B.; Gibson, I. Additive manufacturing a powerful tool for the aerospace industry. Rapid Prototyp. J. 2022, 28, 87–100. [Google Scholar] [CrossRef]
- Sanei, S.H.R.; Popescu, D. 3D-Printed Carbon Fiber Reinforced Polymer Composites: A Systematic Review. J. Compos. Sci. 2020, 4, 98. [Google Scholar] [CrossRef]
- Caminero, M.; Chacón, J.; García-Moreno, I.; Rodríguez, G. Impact damage resistance of 3D printed continuous fibre reinforced thermoplastic composites using fused deposition modelling. Compos. Part B Eng. 2018, 148, 93–103. [Google Scholar] [CrossRef]
- Sanei, S.H.; Arndt, A.; Doles, R. Open hole tensile testing of 3D printed continuous carbon fiber reinforced composites. J. Compos. Mater. 2020, 54, 2687–2695. [Google Scholar] [CrossRef]
- Abrão, A.; Rubio, J.C.; Faria, P.; Davim, J. The effect of cutting tool geometry on thrust force and delamination when drilling glass fibre reinforced plastic composite. Mater. Des. 2007, 29, 508–513. [Google Scholar] [CrossRef]
- Benardos, P.; Vosniakos, G.-C. Predicting surface roughness in machining: A review. Int. J. Mach. Tools Manuf. 2003, 43, 833–844. [Google Scholar] [CrossRef]
- Rubio, J.C.C.; da Silva, L.J.; Leite, W.D.O.; Panzera, T.H.; Filho, S.L.M.R.; Davim, J.P. Investigations on the drilling process of unreinforced and reinforced polyamides using Taguchi method. Compos. Part B Eng. 2013, 55, 338–344. [Google Scholar] [CrossRef]
- Tan, C.L.; Azmi, A.I.; Muhammad, N. Performance Evaluations of Carbon/Glass Hybrid Polymer Composites. In Advanced Materials Research; Trans Tech Publications Ltd.: Stafa-Zurich, Switzerland, 2014. [Google Scholar] [CrossRef]
- Masoud, F.; Sapuan, S.; Ariffin, M.K.A.M.; Nukman, Y.; Bayraktar, E. Cutting Processes of Natural Fiber-Reinforced Polymer Composites. Polymers 2020, 12, 1332. [Google Scholar] [CrossRef]
- Abdullah, A.B.; Sapuan, S. Hole-Making and Drilling Technology for Composites: Advantages, Limitations and Potential; Woodhead Publishing: Cambridge, UK, 2019. [Google Scholar]
- Solati, A.; Hamedi, M.; Safarabadi, M. Comprehensive investigation of surface quality and mechanical properties in CO2 laser drilling of GFRP composites. Int. J. Adv. Manuf. Technol. 2019, 102, 791–808. [Google Scholar] [CrossRef]
- Hejjaji, A.; Singh, D.; Kubher, S.; Kalyanasundaram, D.; Gururaja, S. Machining damage in FRPs: Laser versus conventional drilling. Compos. Part A Appl. Sci. Manuf. 2016, 82, 42–52. [Google Scholar] [CrossRef]
- Rao, S.; Sethi, A.; Das, A.K.; Mandal, N.; Kiran, P.; Ghosh, R.; Dixit, A.R.; Mandal, A. Fiber laser cutting of CFRP composites and process optimization through response surface methodology. Mater. Manuf. Process. 2016, 32, 1612–1621. [Google Scholar] [CrossRef]
- Yallew, T.B.; Kumar, P.; Singh, I. A study about hole making in woven jute fabric-reinforced polymer composites. Proc. Inst. Mech. Eng. Part L J. Mater. Des. Appl. 2015, 230, 888–898. [Google Scholar] [CrossRef]
- Çelik, Y.H.; Kilickap, E.; Kilickap, A.I. An experimental study on milling of natural fiber (jute)- reinforced polymer composites. J. Compos. Mater. 2018, 53, 3127–3137. [Google Scholar] [CrossRef]
- Abdulhameed, O.; Al-Ahmari, A.; Ameen, W.; Mian, S.H. Additive manufacturing: Challenges, trends, and applications. Adv. Mech. Eng. 2019, 11, 1687814018822880. [Google Scholar] [CrossRef]
- Pal, A.K.; Mohanty, A.K.; Misra, M. Additive manufacturing technology of polymeric materials for customized products: Recent developments and future prospective. RSC Adv. 2021, 11, 36398–36438. [Google Scholar] [CrossRef]
- Atzeni, E.; Iuliano, L.; Minetola, P.; Salmi, A. Redesign and cost estimation of rapid manufactured plastic parts. Rapid Prototyp. J. 2010, 16, 308–317. [Google Scholar] [CrossRef]
- Jesthi, D.K.; Nayak, R.K. Sensitivity analysis of abrasive air-jet machining parameters on machinability of carbon and glass fiber reinforced hybrid composites. Mater. Today Commun. 2020, 25, 101624. [Google Scholar] [CrossRef]
- Bañon, F.; Simonet, B.; Sambruno, A.; Batista, M.; Salguero, J. On the Surface Quality of CFRTP/Steel Hybrid Structures Machined by AWJM. Metals 2020, 10, 983. [Google Scholar] [CrossRef]
- Ramesha, N.; Siddaramaiah; Akhtar, S. Abrasive water jet machining and mechanical behavior of banyan tree saw dust powder loaded polypropylene green composites. Polym. Compos. 2014, 37, 1754–1764. [Google Scholar] [CrossRef]
- Prabu, V.A.; Kumaran, S.T.; Uthayakumar, M. Performance Evaluation of Abrasive Water Jet Machining on Banana Fiber Reinforced Polyester Composite. J. Nat. Fibers 2016, 14, 450–457. [Google Scholar] [CrossRef]
- Ming, I.W.M.; Azmi, A.I.; Chuan, L.C.; Mansor, A.F. Experimental study and empirical analyses of abrasive waterjet machining for hybrid carbon/glass fiber-reinforced composites for improved surface quality. Int. J. Adv. Manuf. Technol. 2017, 95, 3809–3822. [Google Scholar] [CrossRef]
- Jagadeesh, B.; Babu, P.D.; Mohamed, M.N.; Marimuthu, P. Experimental investigation and optimization of abrasive water jet cutting parameters for the improvement of cut quality in carbon fiber reinforced plastic laminates. J. Ind. Text. 2017, 48, 178–200. [Google Scholar] [CrossRef]
- Mirjalili, S. Moth-flame optimization algorithm: A novel nature-inspired heuristic paradigm. Knowl. Based Syst. 2015, 89, 228–249. [Google Scholar] [CrossRef]
- Antil, P.; Singh, S.; Manna, A. Genetic Algorithm Based Optimization of ECDM Process for Polymer Matrix Composite. Mater. Sci. Forum 2018, 928, 144–149. [Google Scholar] [CrossRef]
- James, S.J.; Annamalai, A.R. Machinability Study of Developed Composite AA6061-ZrO2 and Analysis of Influence of MQL. Metals 2018, 8, 472. [Google Scholar] [CrossRef]
- Parmiggiani, A.; Prato, M.; Pizzorni, M. Effect of the fiber orientation on the tensile and flexural behavior of continuous carbon fiber composites made via fused filament fabrication. Int. J. Adv. Manuf. Technol. 2021, 114, 2085–2101. [Google Scholar] [CrossRef]
- Yuvaraj, N.; Kumar, M.P. Multiresponse Optimization of Abrasive Water Jet Cutting Process Parameters Using TOPSIS Approach. Mater. Manuf. Process. 2014, 30, 882–889. [Google Scholar] [CrossRef]
- Dhakal, H.N.; Ismail, S.O.; Ojo, S.O.; Paggi, M.; Smith, J.R. Abrasive water jet drilling of advanced sustainable bio-fibre-reinforced polymer/hybrid composites: A comprehensive analysis of machining-induced damage responses. Int. J. Adv. Manuf. Technol. 2018, 99, 2833–2847. [Google Scholar] [CrossRef]
- Jain, V.K. Advanced Machining Processes; Allied publishers: New Delhi, India, 2009. [Google Scholar]
- Benedict, G. Nontraditional Machining Processes; Marcel Dekker Inc.: New York, NY, USA; Basel, Switzerland, 1987; pp. 231–232. [Google Scholar]
- Kumar, V.; Das, P.P.; Chakraborty, S. Grey-fuzzy method-based parametric analysis of abrasive water jet machining on GFRP composites. Sādhanā 2020, 45, 106. [Google Scholar] [CrossRef]
- Jiang, C.-P.; Cheng, Y.-C.; Lin, H.-W.; Chang, Y.-L.; Pasang, T.; Lee, S.-Y. Optimization of FDM 3D printing parameters for high strength PEEK using the Taguchi method and experimental validation. Rapid Prototyp. J. 2022, 28, 1260–1271. [Google Scholar] [CrossRef]
- Sesharao, Y.; Sathish, T.; Palani, K.; Merneedi, A.; De Poures, M.V.; Maridurai, T. Optimization on Operation Parameters in Reinforced Metal Matrix of AA6066 Composite with HSS and Cu. Adv. Mater. Sci. Eng. 2021, 2021, 1609769. [Google Scholar] [CrossRef]
- Chohan, J.S.; Kumar, R.; Yadav, A.; Chauhan, P.; Singh, S.; Sharma, S.; Li, C.; Dwivedi, S.P.; Rajkumar, S. Optimization of FDM Printing Process Parameters on Surface Finish, Thickness, and Outer Dimension with ABS Polymer Specimens Using Taguchi Orthogonal Array and Genetic Algorithms. Math. Probl. Eng. 2022, 2022, 2698845. [Google Scholar] [CrossRef]
- Sakthi Balan, G.; Ravichandran, M.; Kumar, V.S. Study of ageing effect on mechanical properties of Prosopis juliflorafibre reinforced palm seed powder filled polymer composite. Aust. J. Mech. Eng. 2020, 20, 1413–1425. [Google Scholar] [CrossRef]
- Kus, H.; Basar, G.; Kahraman, F. Modeling and optimization for fly ash reinforced bronze-based composite materials using multi objective Taguchi technique and regression analysis. Ind. Lubr. Tribol. 2018, 70, 1187–1192. [Google Scholar] [CrossRef]
- Dharmalingam, G.; Mariappan, R.; Prasad, M.A. Optimization of wear process parameters on 16-Cr Ferritic ODS steel through Taguchi approach. Mater. Today Proc. 2020, 23, 583–589. [Google Scholar] [CrossRef]
- Palanikumar, K. Experimental investigation and optimisation in drilling of GFRP composites. Measurement 2011, 44, 2138–2148. [Google Scholar] [CrossRef]
- Vigneshwaran, S.; John, K.; Johnson, R.D.J.; Uthayakumar, M.; Arumugaprabu, V.; Kumaran, S.T. Conventional and unconventional machining performance of natural fibre-reinforced polymer composites: A review. J. Reinf. Plast. Compos. 2020, 40, 553–567. [Google Scholar] [CrossRef]
- Tan, C.L.; Azmi, A.I.; Muhammad, N. Delamination and Surface Roughness Analyses in Drilling Hybrid Carbon/Glass Composite. Mater. Manuf. Process. 2015, 31, 1366–1376. [Google Scholar] [CrossRef]
- Geetha, K.; Ravindran, D.; Kumar, M.S.; Islam, M.N. Multi-objective optimization for optimum tolerance synthesis with process and machine selection using a genetic algorithm. Int. J. Adv. Manuf. Technol. 2012, 67, 2439–2457. [Google Scholar] [CrossRef]
- Lenin, N.; Kumar, M.S.; Islam, M.N.; Ravindran, D. Multi-objective optimization in single-row layout design using a genetic algorithm. Int. J. Adv. Manuf. Technol. 2012, 67, 1777–1790. [Google Scholar] [CrossRef][Green Version]
- Yang, D.; Guo, Q.; Wan, Z.; Zhang, Z.; Huang, X. Surface Roughness Prediction and Optimization in the Orthogonal Cutting of Graphite/Polymer Composites Based on Artificial Neural Network. Processes 2021, 9, 1858. [Google Scholar] [CrossRef]
- Nadimi-Shahraki, M.H.; Fatahi, A.; Zamani, H.; Mirjalili, S.; Abualigah, L.; Elaziz, M.A. Migration-Based Moth-Flame Optimization Algorithm. Processes 2021, 9, 2276. [Google Scholar] [CrossRef]
- Shehab, M.; Abualigah, L.; Al Hamad, H.; Alabool, H.; Alshinwan, M.; Khasawneh, A.M. Moth–flame optimization algorithm: Variants and applications. Neural Comput. Appl. 2019, 32, 9859–9884. [Google Scholar] [CrossRef]
- Buch, H.; Trivedi, I.N.; Jangir, P. Moth flame optimization to solve optimal power flow with non-parametric statistical evaluation validation. Cogent Eng. 2017, 4, 1286731. [Google Scholar] [CrossRef]
- Eneyew, E.D.; Ramulu, M. Experimental study of surface quality and damage when drilling unidirectional CFRP composites. J. Mater. Res. Technol. 2014, 3, 354–362. [Google Scholar] [CrossRef]
- Malik, K.; Ahmad, F.; Gunister, E. Drilling Performance of Natural Fiber Reinforced Polymer Composites: A Review. J. Nat. Fibers 2021, 19, 4761–4779. [Google Scholar] [CrossRef]
- Unde, P.D.; Gayakwad, M.D.; Patil, N.G.; Pawade, R.S.; Thakur, D.G.; Brahmankar, P.K. Experimental Investigations into Abrasive Waterjet Machining of Carbon Fiber Reinforced Plastic. J. Compos. 2015, 2015, 971596. [Google Scholar] [CrossRef]
- Vankanti, V.K.; Ganta, V. Optimization of process parameters in drilling of GFRP composite using Taguchi method. J. Mater. Res. Technol. 2014, 3, 35–41. [Google Scholar] [CrossRef]
- Azmi, A. Chip formation studies in machining fibre reinforced polymer composites. Int. J. Mater. Prod. Technol. 2013, 46, 32. [Google Scholar] [CrossRef]
- Debnath, K.; Singh, I.; Dvivedi, A. Drilling Characteristics of Sisal Fiber-Reinforced Epoxy and Polypropylene Composites. Mater. Manuf. Process. 2014, 29, 1401–1409. [Google Scholar] [CrossRef]
- Debnath, K.; Singh, I.; Dvivedi, A. On the analysis of force during secondary processing of natural fiber-reinforced composite laminates. Polym. Compos. 2015, 38, 164–174. [Google Scholar] [CrossRef]
- Korlos, A.; Tzetzis, D.; Mansour, G.; Sagris, D.; David, C. The delamination effect of drilling and electro-discharge machining on the tensile strength of woven composites as studied by X-ray computed tomography. Int. J. Mach. Mach. Mater. 2016, 18, 426. [Google Scholar] [CrossRef]
- Feito, N.; Díaz-Álvarez, J.; Díaz-Álvarez, A.; Cantero, J.L.; Miguélez, M.H. Experimental Analysis of the Influence of Drill Point Angle and Wear on the Drilling of Woven CFRPs. Materials 2014, 7, 4258–4271. [Google Scholar] [CrossRef] [PubMed]
- Harugade, M.; Waigaonkar, S.; Dhawale, N. A novel approach for removal of delaminated fibers of a reinforced composites using electrochemical discharge machining. Proc. Inst. Mech. Eng. Part B J. Eng. Manuf. 2021, 235, 1949–1960. [Google Scholar] [CrossRef]
- Tewari, R.; Singh, M.K.; Zafar, S.; Powar, S. Parametric optimization of laser drilling of microwave-processed kenaf/HDPE composite. Polym. Polym. Compos. 2020, 29, 176–187. [Google Scholar] [CrossRef]
- Guu, Y.H.; Hocheng, H.; Tai, N.H.; Liu, S.Y. Effect of electrical discharge machining on the characteristics of carbon fiber reinforced carbon composites. J. Mater. Sci. 2001, 36, 2037–2043. [Google Scholar] [CrossRef]
- Momber, A.W.; Kovacevic, R. Material-Removal Mechanisms in Abrasive Water-Jet Machining. In Principles of Abrasive Water Jet Machining; Springer: London, UK, 1998; pp. 89–162. [Google Scholar] [CrossRef]
- Karakurt, I.; Aydin, G.; Aydiner, K. An Experimental Study on the Depth of Cut of Granite in Abrasive Waterjet Cutting. Mater. Manuf. Process. 2011, 27, 538–544. [Google Scholar] [CrossRef]
Disclaimer/Publisher’s Note: The statements, opinions and data contained in all publications are solely those of the individual author(s) and contributor(s) and not of MDPI and/or the editor(s). MDPI and/or the editor(s) disclaim responsibility for any injury to people or property resulting from any ideas, methods, instructions or products referred to in the content. |
© 2023 by the authors. Licensee MDPI, Basel, Switzerland. This article is an open access article distributed under the terms and conditions of the Creative Commons Attribution (CC BY) license (https://creativecommons.org/licenses/by/4.0/).