Abstract
The evolution of the variance and entropy of granule size in the fluidized bed agglomeration process using two different aggregation kernels is examined. The first is a constant kernel (aggregation is independent of both time and granule size) and permits the most unconstrained agglomeration process that can occur where granules in any size class (up to a maximum size) can be formed at any point in time. This gives the fastest and largest increase in the variance and entropy of the resulting granule size distribution. The second kernel is a mechanistic kernel including a granule growth-limiting mechanism, in this case implemented by the consideration that not all collisions result in coalescence. This markedly changes the evolution of the variance and entropy of the distribution and reduces both significantly. Quantifying the entropy of the distribution provides another perspective on the change in the size distribution in an agglomeration process. It is shown that entropy can provide a better measure of size evolution than variance in that it represents the changing shape of the distribution more closely.
1. Introduction
In a fluidized bed granulation (for this paper taken to be synonymous with aggregation or agglomeration), particle coalescence occurs when a binder liquid solution is sprayed over the particles to promote agglomeration. For agglomeration, granule volume and its evolution with time is the main variable of interest; specifically, the mean granule size and granule size distribution, as quantified by the moments of the distribution, are the fundamental characteristics. The evolution of the granule size was first studied by Kapur and Fuerstenau using a random coalescence model [1]. It is generally thought desirable to minimize the amount of variation in the final granule size distribution as this improves the subsequent functionality of the product. Dispersion is conventionally measured by the second central moment (i.e., variance) of the corresponding probability density function of size. The square root of the variance (standard deviation) is an alternative measure of dispersion. Recently, Cronin and Gutiérrez Ortiz [2] examined the behavior of the dispersion of the size distribution as measured by the standard deviation of the granule volume. It can be noted that this paper also provides a more detailed review of fluidized bed operations and their modeling. However, variance is very much influenced by the fractional number of granules lying at either extreme of the size distribution and it suffers from some other drawbacks in quantifying the spread of the particle size distribution [3].
Information entropy [4] is an alternative measure of dispersion, and because it draws more equally from all size classes, it can be a more useful measure of dispersion. The concept of information entropy has been used to examine particle size distributions in a range of applications, although not for the fluidized bed granulation process [5,6,7]. Xie [8] examined the evolution of entropy with time for the Smoluchowski coagulation kernel while Wu and McFarquhar [9] employed the principle of maximum entropy to determine a theoretical form of the particle size distribution of cloud particles that satisfies the general dynamic equation of their evolution with time. Furthermore, the concept of entropy and the maximum entropy principle have been widely used to predict droplet size distributions in a variety of systems [10,11,12]. Its relevance to agglomeration stems from the fact that while there are a number of important physical sub-processes that determine the output of a granulation process, inter-particle or inter-granule collisions are the primary physical process. Because of the randomness that is inherent in the collision process, many outcomes in terms of possible granule size distributions can be present. The basic concept of applying (information) entropy analysis to the system is that, starting from a single state of mono-dispersion, for unhindered or un-constrained agglomeration, the granule size should disperse spontaneously across all possible size intervals, reflecting the inherent stochastic dynamics of the process. Information entropy (also more simply termed entropy) is a measure of the number of possible configurations for the granule size distribution, and the more size intervals, the greater the entropy. When all the granules are in one size class, the entropy of the size distribution is at a minimum. When they are equally distributed across all possible size classes, the entropy is at a maximum. So, the former case corresponds to the size distribution being in the least possible state of randomness, while the latter case corresponds to the most random distribution in size that is possible. The inherent tendency in a granulation process is for the entropy of the size distribution to increase, and entropy can be interpreted as a measure of heterogeneity of the distribution. Where there are no constraints on the formation of granules, then the resulting granule size distribution will asymptotically converge to the uniform distribution. However, the presence of physical constraints modifies the principle of entropy increase.
This paper will theoretically examine the evolution of the variance and entropy of size distribution during a granulation process and explore their inter-relationships. The known analytical solution for time- and size-independent aggregation will be used as a benchmark comparison. Also, this kernel, by not including any additional physical constraints, yields the distribution with the greatest entropy. Hence, the parts of a more realistic mechanistic aggregation kernel that constrain or reduce the entropy of the size distribution can be identified. It will be shown that examining the evolution of entropy of the size distribution with time yields extra insights into explaining the dynamics of fluidized bed granulation.
2. Modeling of the FBG Process
2.1. System Definition
Considering a system where the initial size is not dispersed and all the initial particles are in the smallest-size class, each of volume , and the maximum possible granule size is , then the number of size classes, will be
The number of the primary particles is . Because granule size is discretized and can only exist in -size classes, the variance of the size distribution will be given as
where is the fractional number of granules in each size class of volume (i.e., number of granules in this size class divided by the total number of granules in the system) and is mean granule volume. Variance quantifies the average value of the square of the departure of granule volume from the mean. Similarly, the (information) entropy of the distribution, can be defined as [13]
Equation (3) can be interpreted as meaning that if there are possible states into which granules can be distributed, the entropy is a measure of the number of possible configurations that these granules can be distributed. Specifically, the entropy of the distribution is the average value of the natural logarithm of the fractional number of granules in each size class. The lower this average value, the larger the entropy. The entropy of the size distribution will tend to increase with time. However, where size is upper limited, there is a maximum upper limit value for the entropy of the distribution, which is
The entropy value predicted by Equation (3) is a dimensionless quantity. Its magnitude will depend on the level of size discretization that is adopted. However, we are using it as a comparative measure between two different aggregation kernels while maintaining the same level of size discretization so discretization effects will not affect the output.
2.2. Analytical Model
The time- and size-independent kernel makes a good benchmark case as it needs the fewest number of assumptions about the granulation process [14,15]. For this kernel, all particle collisions produce coalescence at all times in the process. Furthermore, aggregations are equally likely between all sized granules at every point in the process, so the aggregation rate, , between two particles or two granules of volume and , at any moment, is constant and equal to :
The characteristic time for this process,, will be
This time quantifies how fast aggregation occurs when there are no limiting mechanisms present. For the theoretical situation of no upper limit on possible granule size, the statistics of mean and variance of volume are as follows [16]:
Also, the fractional number of granules in any size class, , at any point in time is as follows:
Inputting the fractional number of granules from Equation (9) into the expression for entropy of Equation (3) means that the entropy of the granule size distribution can be theoretically determined at any point in time. An approximating analytical expression based on the geometric distribution can be given to indicate the dependence of entropy on granulation parameters and time as
Equation (10) predicts that the entropy will be zero at the start and increase logarithmically with respect to time. It must be noted that Equations (7)–(10) technically only apply where there is no upper size limit on granule volume, so their predictions will be approximate but will be valid at early stages of the process. An accurate numerical value for these quantities can always be obtained and is valid at all times in the process. For this constant kernel, entropy of the size distribution will tend to increase logarithmically with respect to time, which is in contrast to the linear dependence of mean volume on time and the quadratic dependence of variance.
2.3. Mechanistic Model
The constant aggregation kernel enables theoretical expressions for parameters of interest to be obtained but is not representative of actual aggregation processes, except at their very early stages. It does not take into account the dependence of aggregation on granule size and speed. Moreover, real granulation systems include effects such as the dropping out of large granules that cannot be fluidized, the presence of unavoidable granule breakage for some collisions, or alternatively, collisions that just produce rebound. More mechanistic kernels, which include the physical sub-processes of agglomeration, provide more realistic output although they can only provide numerical solutions. The aggregation kernel is decomposed into time-dependent and size-dependent parts as
The size-dependent part of the aggregation model, , is controlled by the dynamics of collisions. The equi-partition of kinetic energy, EKE size kernel, is selected for this form of agglomeration [17], and takes the following form:
Likewise, the time-dependent part is broken down into three parts as
where is the collision-determined part of the process, is the geometric success factor, which depends on the granule surface wetting regime, and is the physical success factor, which measures how well collision energy is absorbed to produce coalescence. The aggregation rate due to particle collisions, , has a time dependence [18]:
where is the initial collision aggregation rate and the parameter measures the time dependence of the collision aggregation rate. These parameters can be quantified knowing bed volume, and a scaling factor,
The initial collision rate parameter, , is quantified in terms of the speed of the particles in the bed,
Equations (14)–(16) are a summarized form of the aggregation model that has previously been developed and validated; more information on the model is available in [18]. To simplify the analysis, the geometric success factor, , is made equal to 1:
This means all granules are assumed to be properly wetted from the start. Its role in granulation has been extensively examined in the literature, and excluding it reduces the number of simulations that are needed. For any specific collision between two entities, the physical success factor,, is given in terms of a Stokes number, , and critical Stokes number, [19,20].
The Stokes number, , for two granules of volume, and , respectively, has two parts and is given as
where the size-independent component depends on granule density, , collision velocity, , and , the binder liquid viscosity. The critical Stokes number is given as
where is the coefficient of restitution between the particles, is the average depth of the binder liquid film on the particle surface, and is a surface roughness parameter. The time dependence of the physical success factor can be found by evaluating the proportion of collisions where Stokes numbers are less than critical Stokes number. The corresponding probability mass function, , is given in terms of the number of granules in each size class as
where is shown in Equation (12). Hence, the physical success factor as a function of time is
While Equation (18) applies to a specific inter-granule collision, Equation (22) applies to all the collisions for the whole ensemble of granules at any point in time. Figure 1a shows the time dependence of the aggregation rate up to a time of 1500 s (using the data provided in Table 1), while Figure 1b shows the size dependence of the aggregation rate up to a granule volume of 1 mm3.
2.4. Model Implementation
The simulation parameter values are representative of batch agglomeration of glass particles in a fluidized bed arrangement [21]. This specific granulation process was selected because of its good correspondence with the physics of the mechanistic kernel. The discretized size interval was 0.01 mm3 and time interval was 1 s. The maximum size limit was set to 10 mm3, giving 1000-size classes. The Population Balance Modeling (PBM) solution method was implemented in MATLAB [22]. While there are many possible approaches in numerically evaluating the discretized PBM scheme [23,24,25], a simple, uniform, one-dimensional method, based solely on granule volume is used here. The granulation simulation time was set to 1500 s because previous numerical studies have shown that numerical and theoretical methods are in good agreement up to this time. Table 1 summarizes the input parameter data used by the constant and mechanistic kernels; the selection of the aggregation rate values is influenced by the need to ensure that the aggregation intensity of both kernels is comparable.

Figure 1.
(a) Time dependence of the total aggregation rate (to a time of 1500 s). (b) Size dependency of the EKE collision kernel (to a volume of 1 mm3). Regarding the notation, 2.0E-09 = 2 × 10⁻⁹.

Table 1.
Main simulation parameter values.
Table 1.
Main simulation parameter values.
| Initial particle volume | mm3 | 0.01 | |
| Dropout volume | mm3 | 10 | |
| Maximum entropy | - | 6.908 | |
| Initial number of particles | - | 1 × 10⁷ | |
| Granulation time | s | 1500 | |
| Constant kernel | |||
| Constant aggregation rate | s−1 | 2 × 10⁻⁸ | |
| Characteristic aggregation time | s | 10 | |
| Mechanistic kernel | |||
| Initial aggregation rate | s−1 | 1 × 10⁻⁸ | |
| Aggregation rate time dependence | s−1 | 0.0439 | |
| Aggregation rate time dependence | s−1 | - | |
| Stokes number constant | mm−1 | 23 | |
| Critical Stokes number | - | 28 |
With the number of possible size classes limited to 1000, the maximum upper limit value for entropy for this system, will be the natural log of this, i.e., 6.908 (by Equation (4)). This corresponds to the fractional number of granules in every size class being equal to 0.001. All values quoted in the results for entropy will be expressed as a fraction of this, i.e., normalized entropy. Also, for presenting and interpreting results, granule volume statistics of mean and variance are best expressed in terms of a dimensionless volume (equal to ) and also time in terms of dimensionless time (). Finally, it should be noted that this paper will not include experimental data. Further information on the comparison and validation of the aggregation model with experimental FBG data has been published and is available in [18].
3. Results
3.1. Comparison between the Constant and Mechanistic Kernels
The objective of the paper is to explore and understand how the variance and entropy of granule size evolve with time in an aggregation process and to explain how their evolution differs between a constant kernel and a mechanistic kernel. Figure 2a illustrates the evolution of the dimensionless mean granule volume with dimensionless time for the constant and mechanistic kernels. Figure 2b gives the evolution of dimensionless variance in the granule volume with time for both aggregation models, and Figure 2c displays the evolution of the normalized entropy of the granule size distribution versus dimensionless time for the two kernels. The output is shown up to a dimensionless time of 150 for the mean and entropy and up to a dimensionless time of 90 for variance.
Regarding Figure 2a, for the constant kernel, the mean granule volume increases linearly with respect to time without limit, while for the more realistic mechanistic kernel, the mean volume increases in a quasi-sigmoidal fashion with time and approaches an approximate asymptotic value. For variance in granule volume (Figure 2b) for the constant kernel at short times, variance initially increases almost linearly with time, but for times considerably longer than (i.e., a normalized time of 1), the dependence on time is quadratic. By contrast, for the mechanistic kernel, variance rises to a peak value at a dimensionless time equal to 51.5, and then falls back to an approximate asymptotic value. Finally, for entropy of the granule size distribution (shown in Figure 2c), for the constant kernel, it increases logarithmically with time toward the asymptotic normalized value. While for the mechanistic kernel, its time behavior follows a similar pattern to that of variance, although peak entropy occurs at a later dimensionless time of 58.6 compared to peak variance.

Figure 2.
Dimensionless mean granule volume (a), variance in granule volume (b), and normalized entropy of the granule size distribution (c) versus dimensionless time for the constant and mechanistic kernels.
The different behaviors between the two kernels arise because there is no restraining mechanism for a constant kernel, and the granule size and dispersion can increase without limit. For the mechanistic kernel, the physical success factor acts to stabilize the size distribution and limit the growth of the moments of the distribution. More generally, Figure 2c shows that each type of aggregation kernel will have its own unique profile of how entropy varies with time depending on the physical processes and constraints that it includes. Hence, graphs of entropy versus time can be used to compare the operation of different possible aggregation kernels.
3.2. Relationship of Variance and Entropy to the Size Distribution
Figure 3a plots the normalized entropy of the distribution against the dimensionless variance of the granule size distribution for the constant kernel, and Figure 3b plots the same for the mechanistic kernel. By examining the behavior of the constant aggregation kernel, because variance increases monotonically with respect to time, then entropy will have a monotonic relationship with respect to variance. In fact, entropy is proportional to the logarithm of the square root of variance. For the mechanistic kernel, strikingly different behavior is observed. Entropy increases with variance up to the point at which variance achieves its peak value (marked as point ‘a’ in the graph). Then, as variance falls, entropy continues to increase to its peak value (point ‘b’ in the graph), and then both continue to decay toward their respective quasi-asymptotic levels (point ‘c’). This behavior results from the fact that variance achieves its peak value earlier than entropy does, so there is a short time interval (from 51.5 to 58.6) where the entropy of the size distribution rises although its variance falls. Figure 4 displays the granule size distribution as predicted by the mechanistic kernel at a dimensionless time of 51.5 (which is the distribution with the largest variance) and the size distribution for the mechanistic kernel at a dimensionless time of 58.6 (which has the largest entropy).
For this kernel, the condition of maximum variance occurs earlier than maximum entropy because at the earlier time, there are proportionally more small granules in the distribution that contribute more to variance than to entropy. The bimodal distributions seen in Figure 4 result from the fact that at the start, all the particles lie in the smallest-size class, and this is where a single peak lies. As granulation proceeds, these particles become distributed into the higher-size classes, but a large amount still remain un-granulated in the smallest-size class or in the adjacent small-size classes. When the physical success factor is activated at an intermediate time, the granules in the larger-size classes begin to coalesce into the size class proximate to the mean size. Hence, there will be two peaks in the distribution: one near the smallest-size class and one near the mean-size class. At long times, the peak at the smallest-size classes diminishes, as all the small particles become consumed by aggregation and one peak is left near the mean size value. These trends can also be seen in Figure 5.
It is informative to examine the granule size distributions at three points in time corresponding to an early, intermediate, and later stage of the process. Figure 5a plots the granule size distribution for the constant and mechanistic kernels at a time equal to the aggregation time, (of 10 s). The distributions are shown up to a dimensionless volume of 10 for clarity. Figure 5b gives the distributions at a time of 10 times the aggregation time (i.e., 100 s), up to a dimensionless volume of 30, while Figure 5c gives both distributions for a time 100 times the aggregation time (i.e., a time of 1000 s), up to a dimensionless volume of 200. At short times, the predicted size distributions from both kernels are very similar, and both are approximately discrete exponential in nature. As time progresses, the mean and dispersion increase, so the number of granules in any size class falls for both kernels. For the constant kernel, after a long period of time, the ratio of the successive fractional number of granules in any size class converges to one, meaning that the granule size distribution approaches uniform distribution. However, once the physical success factor becomes significant after a long period of time, then the mechanistic kernel produces a markedly divergent size distribution, as seen in Figure 5c. The fractional number of granules in any size class no longer falls monotonically with increasing granule size but rather produces a large number of granules with a volume clustering around the mean volume. The mechanistic kernel predicts much fewer very small and very large granules compared to the constant kernel, reflecting its tighter distribution.

Figure 3.
Normalized entropy of the distribution versus dimensionless variance of the distribution for (a) the constant kernel and (b) mechanistic kernel.

Figure 4.
Granule size distribution as predicted by the mechanistic kernel at a dimensionless time of 51.5 (largest variance and shown in blue) and 58.6 (largest entropy and shown in red).
Using these size distributions, the contribution of each dimensionless-size class to the total variance of the distribution for each kernel can be established at the three respective times. Figure 6a plots the fractional variance of each size class (up to a dimensionless-size class of 10) for both kernels at the time . Figure 6b gives the same information (up to a dimensionless-size class of 50) at 10 , while Figure 6c does so at 100 (up to a dimensionless-size class of 200). These graphs display the distribution of variance. The mean granule volume as predicted by each kernel is shown on the graphs. From the definition of variance, the contribution of each size class to the total variance of the distribution is the product of the square of its difference from the mean volume multiplied by the fractional number of granules in that class. For the two shorter times, both kernels yield a similar pattern because the size distributions are similar. For size ranges below the mean, the smallest-size class (i.e., primary particles) makes the largest contribution to variance because of the many particles present and its extreme position in the size distribution. As the mean is approached, the contribution of each successive size class is diminished. For size ranges above the mean, the contribution to variance initially rises but then falls, as fewer and fewer granules are present in the very large-size classes. By contrast, at later stages in the process (100 ), a different behaviour is seen. The constant kernel maintains the same pattern as early stages, but the mechanistic kernel has a considerably different pattern. For this reason, the very small size ranges no longer make a dominant contribution to the variance, and the variance primarily comes from mid-sized granules that lie on either side of the mean.

Figure 5.
Granule dimensionless volume distribution for the constant and mechanistic kernels at (a) (10 s), (b) 10 (100 s), and (c) 100 (1000 s).

Figure 6.
Fractional contribution of each size class to total variance for the constant and mechanistic kernels at (a) (10 s), (b) 10 (100 s), and (c) 100 (1000 s).
Figure 7a–c plots the fractional contribution of each dimensionless size class to the entropy of the distribution for each kernel at the three respective times above and using the same dimensionless size ranges, i.e., the entropy distribution. According to the definition of entropy, the contribution of each size class is the product of the fractional number of granules in the class times the natural logarithm of that fractional number. After short periods of time, both kernels produce the same pattern: the larger the size of the class, the smaller its contribution to the total entropy of the distribution, primarily because the number of granules in successively larger-size classes is successively smaller. So, entropy is preferentially determined by the smaller-size classes. This pattern remains invariant for the constant kernel even at later stages of the process, but for the mechanistic kernel, the size range centered about the mean makes the greatest contribution to entropy toward the end.
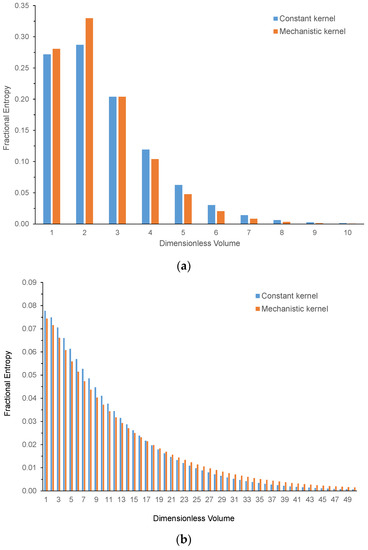
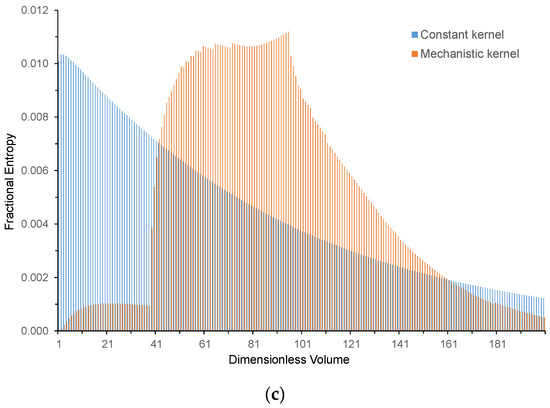
Figure 7.
Fractional contribution of each size class to the entropy for the constant and mechanistic kernels at (a) (10 s), (b) 10 (100 s), and (c) 100 (1000 s).
4. Discussion
4.1. Physical Success Factor
The transformation of the granule size distribution, using constant and mechanistic aggregation kernels, has been explored using the concepts of variance and entropy. The different outcomes for both kernels can be explained by considering three salient granule sizes of the primary particle volume, , Stokes volume,, and drop out volume, . The significance of the physical success factor in terms of acting as a constraint on granulation and thus limiting the increase in entropy and variance can be understood by comparing these volumes. The Stokes volume is present because two granules will not agglomerate when their Stokes number equals the critical Stokes number and the corresponding volume is given as
Agglomeration is not possible between two granules that both exceed this size. Hence, the domain of the granule volume is divided into a number of distinct zones. No granules with a volume less than or greater than can be present in the system. Where both contacting granules are larger than (and less than ), then no aggregation between them is possible. When one granule has a volume greater than while the other has a volume less than , then conditional aggregation is possible (once the resulting granule volume that is formed is less than ). When both granules are less than , then agglomeration can occur. At the early stages of the granulation process, where most granules have a volume less than , the influence of the Stokes number is negligible, but as granule sizes increase, an increasing proportion have a volume larger than , and the limiting effect on growth becomes more pronounced. At later stages, the aggregation process is limited to where most relatively large-sized granules can only combine either with primary particles or very small granules. This phenomenon explains why the mean size can continue to increase, albeit very slowly.
4.2. Entropy of the Granule Size Distribution
Entropy and variance both measure how ‘spread out’ a distribution is. Variance measures how spread out it is from the mean value, while entropy does not have any specific datum point. However, entropy is also a measure of the evenness of the spread: the more dispersed the distribution and the more even (or uniform) it is, the larger the entropy. Entropy more directly quantifies the rate at which granules disperse into the increasingly available size classes as granulation proceeds. As such, it provides a good measure of how dispersed the distribution is and also its proximity to the uniform distribution, where all size classes are evenly occupied. Variance is a narrower concept measuring the average value of the square of the departure from the mean value for the distribution and has the disadvantage, compared to entropy, of being quite sensitive to the tails of the distribution, which may contain a relatively small fraction of the total number of granules. The distinction between variance and entropy is particularly marked for the output of the constant kernel; the variance increases rapidly with time because the size distribution becomes much more dispersed, but the entropy increases much more slowly because the shape of the distribution only changes slightly. Even for the mechanistic kernel, after a long period of time, i.e., 100 , there is a strong similarity between the size distribution (Figure 5c) and the entropy distribution (Figure 7c) that is not present for the variance distribution (Figure 6c), indicating the strong correspondence between size and entropy distribution.
In summary, entropy measures both the amount of dispersion in the size distribution and the shape of the size distribution. An increase in entropy with time is a sign that the size distribution is increasing and also that the distribution is becoming more uniform. Hence, monitoring the entropy of the granule size distribution in an agglomeration process provides information on both aspects of the distribution. This is particularly important when inferences are drawn from sampling of the granule size distribution; the larger the entropy of the distribution, the more sampling is needed to obtain the same information about the distribution. Furthermore, entropy provides extra insight into the fractional number of granules in any sub-intervals of the size distribution that may be of interest. Of course, ultimately, both variance and entropy are useful statistics that shed light on different attributes of a distribution.
5. Conclusions
The evolution of variance and entropy of the granule size distribution in the fluidized bed agglomeration process for two different aggregation kernels has been analyzed. The constant kernel (aggregation is independent of both time and granule size) is the most unconstrained agglomeration process that can occur, where granules in any size class (up to a maximum size) can be formed at any point in time. This gives the fastest and largest increase in the variance and entropy of the resulting granule size distribution. More realistic aggregation kernels include granule growth-limiting mechanisms, in this case, implemented by the viscous Stokes number method. This markedly changes the evolution of the variance and entropy of the distribution and reduces both significantly. Entropy can provide another perspective on the evolution of the size distribution in an agglomeration or granulation process in addition to the usual focus on the moments of the distribution. Specifically, it provides important insights into how the shape of the size distribution evolves with time, in addition to the width of the distribution. Information entropy can provide a measure of the rate at which a mono-dispersed initial size distribution tends to approach a uniform (flat) distribution as an asymptotic limit. Because each type of aggregation kernel will achieve this transformation in a different fashion, entropy can be a powerful tool to understand their respective operations and characteristics.
Author Contributions
K.C.: Conceptualization, Methodology, Software, Formal analysis, Writing—Original Draft, Writing—Review & Editing, Supervision. F.J.G.O.: Conceptualization, Methodology, Software, Formal analysis, Writing—Review & Editing, Supervision. All authors have read and agreed to the published version of the manuscript.
Funding
This research received no external funding.
Data Availability Statement
Data is unavailable due to privacy restrictions.
Conflicts of Interest
The authors declare no conflict of interest.
Notation
| Entropy | ||
| Number of granule size classes | - | |
| Initial number of primary particles | - | |
| Fractional number of entities in size class i | ||
| Stokes number | - | |
| Critical Stokes number | - | |
| Stokes number constant | m−1 | |
| Time | s | |
| Granule volume | m3 | |
| Maximum granule volume | m3 | |
| Volume of individual elementary particle | m3 | |
| Characteristic aggregation time | s | |
| Greek Letters | ||
| Aggregation rate | s−1 | |
| Initial aggregation rate | s−1 | |
| Reference (constant) aggregation rate | s−1 | |
| Aggregation rate time dependency parameter | s−1 | |
| Geometric success factor | - | |
| Physical success factor | - | |
| μ | Mean volume | m3 |
| σ | Standard deviation in volume | m3 |
| φ | Relative frequency of Stokes number | - |
References
- Kapur, P.C.; Fuerstenau, D.W. A coalescence model for granulation. Ind. Eng. Chem. Processes Dev. Des. 1969, 8, 56–62. [Google Scholar] [CrossRef]
- Cronin, K.; Gutiérrez Ortiz, F.J. Understanding the evolution of particle size dispersion with time in a fluidised bed granulation process. Powder Technol. 2023, 423, 118502. [Google Scholar] [CrossRef]
- MacFhionnlaoich, N.; Guldin, S. Information Entropy as a Reliable Measure of Nanoparticle Dispersity. Chem. Mater. 2020, 32, 3701–3706. [Google Scholar] [CrossRef]
- Kapur, J.N. Entropy Optimization Principles with Applications; Academic Press: San Diego, CA, USA, 1992. [Google Scholar]
- Martín, M.Á.; Reyes, M.; Taguas, F.J. An entropy-like parameter of particle size distributions as packing density index in complex granular media. Granul. Matter 2017, 19, 9. [Google Scholar] [CrossRef]
- Leak, J.; Barreto, D.; Dimitriadi, V.; Imre, E. Revisiting Hardin’s parameters for the quantification of particle breakage—A statistical entropy approach. EPJ Web Conf. 2021, 249, 07001. [Google Scholar] [CrossRef]
- Mikkelsen, O.A.; Curran, K.J.; Hill, P.S.; Milligan, T.G. Entropy analysis of in situ particle size spectra, Estuarine. Coast. Shelf Sci. 2007, 72, 615–625. [Google Scholar] [CrossRef]
- Xie, M. The Approximation of Entropy for Smoluchowski Coagulation Equation with TEMOM. Preprints 2021, 2021010096. [Google Scholar] [CrossRef]
- Wu, W.; McFarquhar, G.M. Statistical Theory on the Functional Form of Cloud Particle Size Distributions. J. Atmos. Sci. 2018, 75, 2801–2814. [Google Scholar] [CrossRef]
- Fu, Q.; Wang, J.; Yang, L. Application of Maximum Entropy Principle to Predict Droplet Size Distribution for Swirl Injectors. Iran. J. Sci. Technol. Trans. Mech. Eng. 2017, 41, 305–313. [Google Scholar] [CrossRef]
- Li, X.; Li, M. Droplet Size Distribution in Sprays Based on Maximization of Entropy Generation. Entropy 2003, 5, 417–431. [Google Scholar] [CrossRef]
- Movahednejad, E.; Ommi, F.; Hosseinalipour, S.M.; Chen, C.P.; Mahdavi, S.A. Application of maximum entropy method for droplet size distribution prediction using instability analysis of liquid sheet. Heat Mass Transf. 2011, 47, 1591–1600. [Google Scholar] [CrossRef]
- García-Gutiérrez, C.; Martín, M.Á.; Pachepsky, Y. On the Information Content of Coarse Data with Respect to the Particle Size Distribution of Complex Granular Media: Rationale Approach and Testing. Entropy 2019, 21, 21. [Google Scholar] [CrossRef] [PubMed]
- Elimelech, M.; Jia, X.; Gregory, J.; Williams, R. Particle Deposition and Aggregation, Measurement, Modelling and Simulation, 1st ed.; Butterworth-Heinemann: Oxford, UK, 1998. [Google Scholar]
- Litster, J.; Ennis, B. The Science and Engineering of Granulation Processes; Springer Science + Business Media Dordrecht: Berlin/Heidelberg, Germany, 2004. [Google Scholar]
- Ramkrishna, D. Population Balances: Theory and Applications to Particulate Systems in Engineering; Academic Press: San Diego, CA, USA, 2000. [Google Scholar]
- Tan, H.S.; Goldschmidt, M.J.V.; Boerefijn, R.; Hounslow, M.J.; Salman, A.D.; Kuipers, J.A.M. Building population balance model for fluidised bed melt granulation: Lessons from kinetic theory of granular flow. Powder Technol. 2004, 142, 103–109. [Google Scholar] [CrossRef]
- Cronin, K.; Gutiérrez Ortiz, F.J.; Ring, D.; Zhang, F. A new time-dependent rate constant of the coalescence kernel for the modelling of fluidised bed granulation. Powder Technol. 2021, 379, 321–334. [Google Scholar] [CrossRef]
- Stepanek, F.; Rajniak, P.; Mancinelli, C.; Chern, R.T.; Ramachandran, R. Distribution and accessibility of binder in wet granules. Powder Technol. 2009, 189, 376–384. [Google Scholar] [CrossRef]
- Tardos, G.I.; Khan, M.I.; Mort, P.R. Critical parameters and limiting conditions in binder granulation of fine powder. Powder Technol. 1997, 94, 245–258. [Google Scholar] [CrossRef]
- Catak, M.; Baş, N.; Cronin, K.; Tellez-Medina, D.; Byrne, E.P.; Fitzpatrick, J.J. Markov chain modelling of fluidised bed granulation. Chem. Eng. J. 2010, 164, 403–409. [Google Scholar] [CrossRef]
- Abberger, T. Population balance modelling of granulation, Chapter 24. In Handbook of Powder Technology, 1st ed.; ASalman, D., Hounslow, M.J., Seville, J.P.K., Eds.; Elsevier Science: Amsterdam, The Netherlands, 2007; Volume 11, pp. 1109–1186. [Google Scholar]
- Das, A.; De, T.; Kaur, G.; Dosta, M.; Heinrich, S.; Kumar, J. An efficient multiscale bi-directional PBM-DEM coupling framework to simulate one-dimensional aggregation mechanisms. Proc. R. Soc. A 2022, 478, 20220076. [Google Scholar] [CrossRef]
- Kaur, G.; Kumar, J.; Heinrich, S. A weighted finite volume scheme for multivariate aggregation population balance equation. Comput. Chem. Eng. 2017, 101, 1–10. [Google Scholar]
- Skorych, V.; Dosta, M.; Hartge, E.U.; Heinrich, S.; Ahrens, R.; Le Borne, S. Investigation of an FFT-based solver applied to dynamic flowsheet simulation of agglomeration processes. Adv. Powder Technol. 2019, 30, 555–564. [Google Scholar] [CrossRef]
Disclaimer/Publisher’s Note: The statements, opinions and data contained in all publications are solely those of the individual author(s) and contributor(s) and not of MDPI and/or the editor(s). MDPI and/or the editor(s) disclaim responsibility for any injury to people or property resulting from any ideas, methods, instructions or products referred to in the content. |
© 2023 by the authors. Licensee MDPI, Basel, Switzerland. This article is an open access article distributed under the terms and conditions of the Creative Commons Attribution (CC BY) license (https://creativecommons.org/licenses/by/4.0/).