Article

Development of In-Line Measurement Techniques for Monitoring Powder Characteristics in a Multi-Stage Spray Drying Process

Department of Process Engineering and Food Powders, University of Hohenheim, Garbenstraße 25, 70599 Stuttgart, Germany
*
Authors to whom correspondence should be addressed.
These authors contributed equally to this work.
Processes 2023, 11(7), 1931; https://doi.org/10.3390/pr11071931
Submission received: 7 June 2023 / Revised: 16 June 2023 / Accepted: 23 June 2023 / Published: 27 June 2023
(This article belongs to the Special Issue Computational and Experimental Study of Granulation in Fluidized Beds)

Abstract

:
The integration of spray drying and agglomeration offers significant advantages, such us continuous production with lower energy consumption. However, it is a knife-edge process with a narrow operating window and limited degrees of freedom that decide between successful agglomeration and fluidized bed blockage due to excessive moisture. In this contribution, factors influencing the spray-through agglomeration process of skim milk powder as a model system were investigated via a design of experiments. Three in-line monitoring methods were applied and tested to observe the most important parameters in the agglomeration process—the product moisture and particle size distribution. Regarding the moisture content, a capacitive moisture sensor was calibrated with linear regression and a near-infrared sensor with partial least squares regression. Near-infrared spectroscopy was found to be the suitable method for determining the moisture content, while the capacitive moisture sensor mainly provides information on the bulk density, filling level, or fluidization state in the fluidized bed. Additionally, particle size distribution data were extracted from the spectral data using in-line data from a spatial filter velocimetry probe in the fluidized bed. This opens the potential to monitor both parameters in real time with a single non-invasive sensor.

1. Introduction

Skim milk powder (SMP) is a frequently used ingredient in various food applications including infant formula, ice cream, confectionery and baked goods [1,2]. The powder is typically produced by spray drying, where liquid skim milk concentrate is atomized into fine drops and then dried in a stream of hot air, resulting in a bulk solid. The size of the drops, as well as the inlet and outlet air temperatures, can be adjusted to control the final particle size of the SMP. However, a major challenge with this process is the generation of fine materials [2,3]. These fine particles cause problems in certain applications due to their dusting properties and poor wettability. This makes it challenging for customers to effectively incorporate the product into their formulations, as they may struggle to achieve a consistent mix and accurate dosing [4,5].
To improve the product quality, SMP can be further processed via agglomeration to increase its flowability, solubility, and dispersibility [3,5]. An effective example of agglomeration equipment is a fluidized bed [6,7,8], where a bulk solid is subjected to a flow of heated gas, which causes the particles to behave in a fluid-like manner. A binding agent or plasticizer, such as water, is then sprayed onto the particles. Collisions of moist surfaces cause them to form clusters through the formation of liquid bridges, which are solidified by the evaporation of the solvent [8].
In addition to batch processes, integrated spray drying and agglomeration solutions have been reported in the literature as design concepts since the 1980s. Their development was driven by the need for more efficient and cost-effective powder manufacturing processes, especially for more difficult-to-dry products such as fine or sticky materials [9]. These integrated solutions have the advantage of being able to perform the entire production process in a single plant and also allow for continuous production. They also have certain disadvantages, such as increased process complexity. The mean residence time, i.e., the agglomeration time, is determined by the installed bed volume and the throughput of the spray dryer. Spraying too much binder in this time interval will result in sticky material and bed blockage, while spraying too little will not achieve the target particle size and, consequently, the target powder properties. This makes it a knife-edge process. One of the most important parameters for forced agglomeration with binding agents is the product moisture content. Monitoring the moisture content is thus crucial, as it directly impacts the formation and properties of the agglomerates. In addition, it ensures the effective use of binding agent and energy. When properly implemented, the operating parameters, such as the fluidization air velocity or binding agent amount, can be adjusted as needed to achieve the required particle size and shape [8,10].
Measurement technology can be used to monitor and control these parameters. By utilizing reliable and widespread methods, such as temperature and mass flow rate measurements, only the process conditions can be monitored. Advanced techniques are needed to measure the product moisture and the particle size, although sampling-based methods are not suitable for real-time control. Methods such as near-infrared spectroscopy (NIR) and dielectric property measurement (CM—capacitance measurement) for moisture, as well as spatial filter velocimetry (IPP—in-line particle probe), focused beam reflectance measurements, or even image analyses for particle size, can be used [11,12,13]. In some cases, attempts have been made to determine basic size information in addition to moisture information from NIR spectral data [14]. Multi-sensor approaches are already available, although mostly in the context of individual unit operations and not in the integrated spray agglomeration process [13]. Advanced monitoring and control strategies are especially needed for a continuous integrated process, as bed blockages lead to a shutdown of the entire process. However, their implementation is more challenging due to the high complexity.
The practical implementation process for this study involved a pilot-scale two-stage spray-through agglomeration process with an integrated fluidized bed. The fluidization velocity, temperature, and amount of moisture injected into the system were varied within the scope of a full factorial design of experiments (DoE). In addition, further trials were conducted to optimize the agglomeration process and expand the data set. The integrated fluidized bed was equipped with measurement ports allowing for the simultaneous operation of two sensors (NIR, CM, or IPP). The sensors used in this study varied in terms of measurement location as well as principle, being either non-invasive (NIR) or invasive (CM, IPP) and coming into contact with the product. The former can be operated through a glass window. From a hygienic perspective, non-invasive techniques are preferred in the context of food production.
The objective of this work was to optimize the two-stage spray-through agglomeration process with an integrated fluidized bed. An in-line monitoring system was established with a special focus on the product moisture content and the particle size. The use of these measurement techniques allows the monitoring and control of the agglomeration process. This is particularly important with respect to the moisture added to the system with a binder, regardless of the varying air temperature and mass flow, enabling one to achieve the desired powder properties within the short residence time of a two-stage spray dryer without risking a bed blockage.

2. Materials and Methods

This study involved calibration and validation trials using skim milk that had been dried using a spray-through method in a pilot-scale spray dryer. A detailed explanation of the spray drying process is given below.

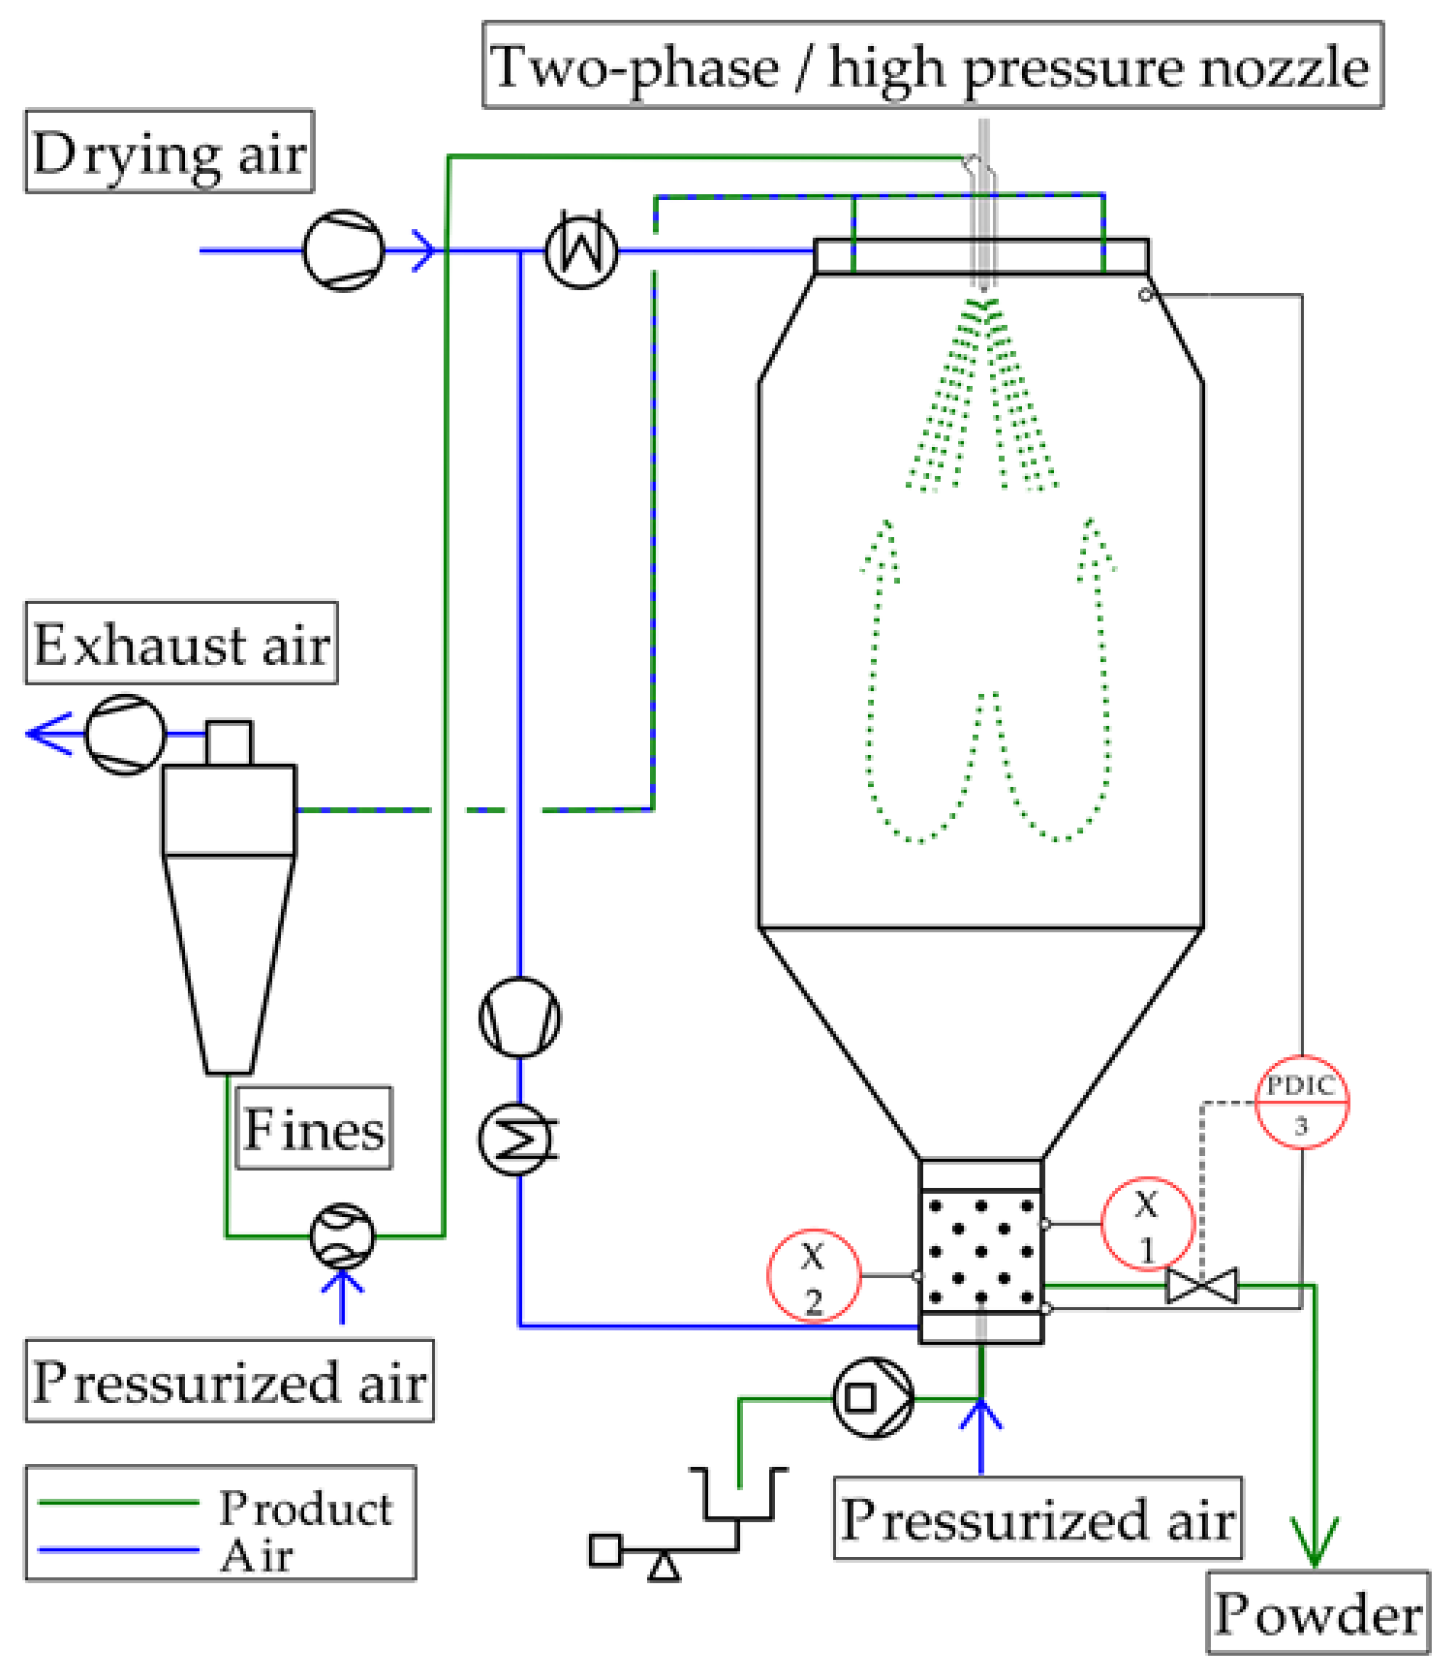
2.1. Spray Drying and Agglomeration

The starting material was low-heat SMP (Sachsenmilch Leppersdorf GmbH, Leppersdorf, Germany), which was rehydrated with demineralized water to a total solid content of 30%. The concentrate was then atomized using either a Schlick-type 100 hollow cone pressure nozzle (Düsen-Schlick GmbH, Coburg, Germany) with orifice diameters between 0.3 and 0.5 mm and a pressure of 8 MPa or a two-fluid nozzle (GEA Niro, Søborg, Denmark) with an orifice of 2 mm. The two-fluid nozzle was operated at a constant air-to-liquid ratio (ALR = 1) to ensure comparable droplet sizes at varying mass flow rates [15]. The mass flow rate was adjusted to maintain a constant outlet temperature of 75 °C under varying process conditions.
The multi-stage drying process, including the fines return and nozzle zone agglomeration, is described in detail in [16]. Additionally, the process parameters were optimized for the product with the inlet air temperature set to 200 °C, drying air mass flow to 200 kg h−1, and fines return airflow to 25 kg h−1. On average, the selected spray conditions correspond to a solid mass flow of about 60 g min−1. The perforated plate in the fluidized bed had a pressure drop of 510 Pa at an empty pipe fluidization air velocity of 0.8 m s−1.
A second two-fluid Schlick-type 970/7-1 S 1 nozzle (Düsen-Schlick GmbH, Coburg, Germany) with an orifice diameter of 0.8 mm was mounted into the fluidized bed as a bottom-spray configuration. Water was introduced into the fluidized bed at rates between 0 and 18 g min−1 as the binding agent. The cap was set on position four. To measure the properties of the agglomerates formed, measurement ports were mounted at distances of 60 and 160 mm above the perforated plate.
The equipment configuration is shown in Figure 1. The fluidized bed is located below the spray dryer with the fluidization air entering through a perforated plate and exiting the system at the top of the spray dryer. Either the IPP or CM sensor is mounted on measurement port one. While the IPP sensor protrudes into the fluidized bed, the NIR sensor is mounted on sapphire glass at port two. Powder discharge is automated to maintain a constant residence time and filling level based on differential pressure (sensor 3). The discharge valve is triggered for 0.2 s as soon as the bulk material causes a pressure drop of 140 Pa.
Different combinations of measurement probes were used to gather the necessary data. These combinations included the NIR probe and IPP, the NIR probe and CM sensor, or the CM sensor at the lower position and the IPP at the upper position. This approach allowed the simultaneous measurement of different properties using different probes. However, it should be noted that the measuring positions did not always align in every comparison.

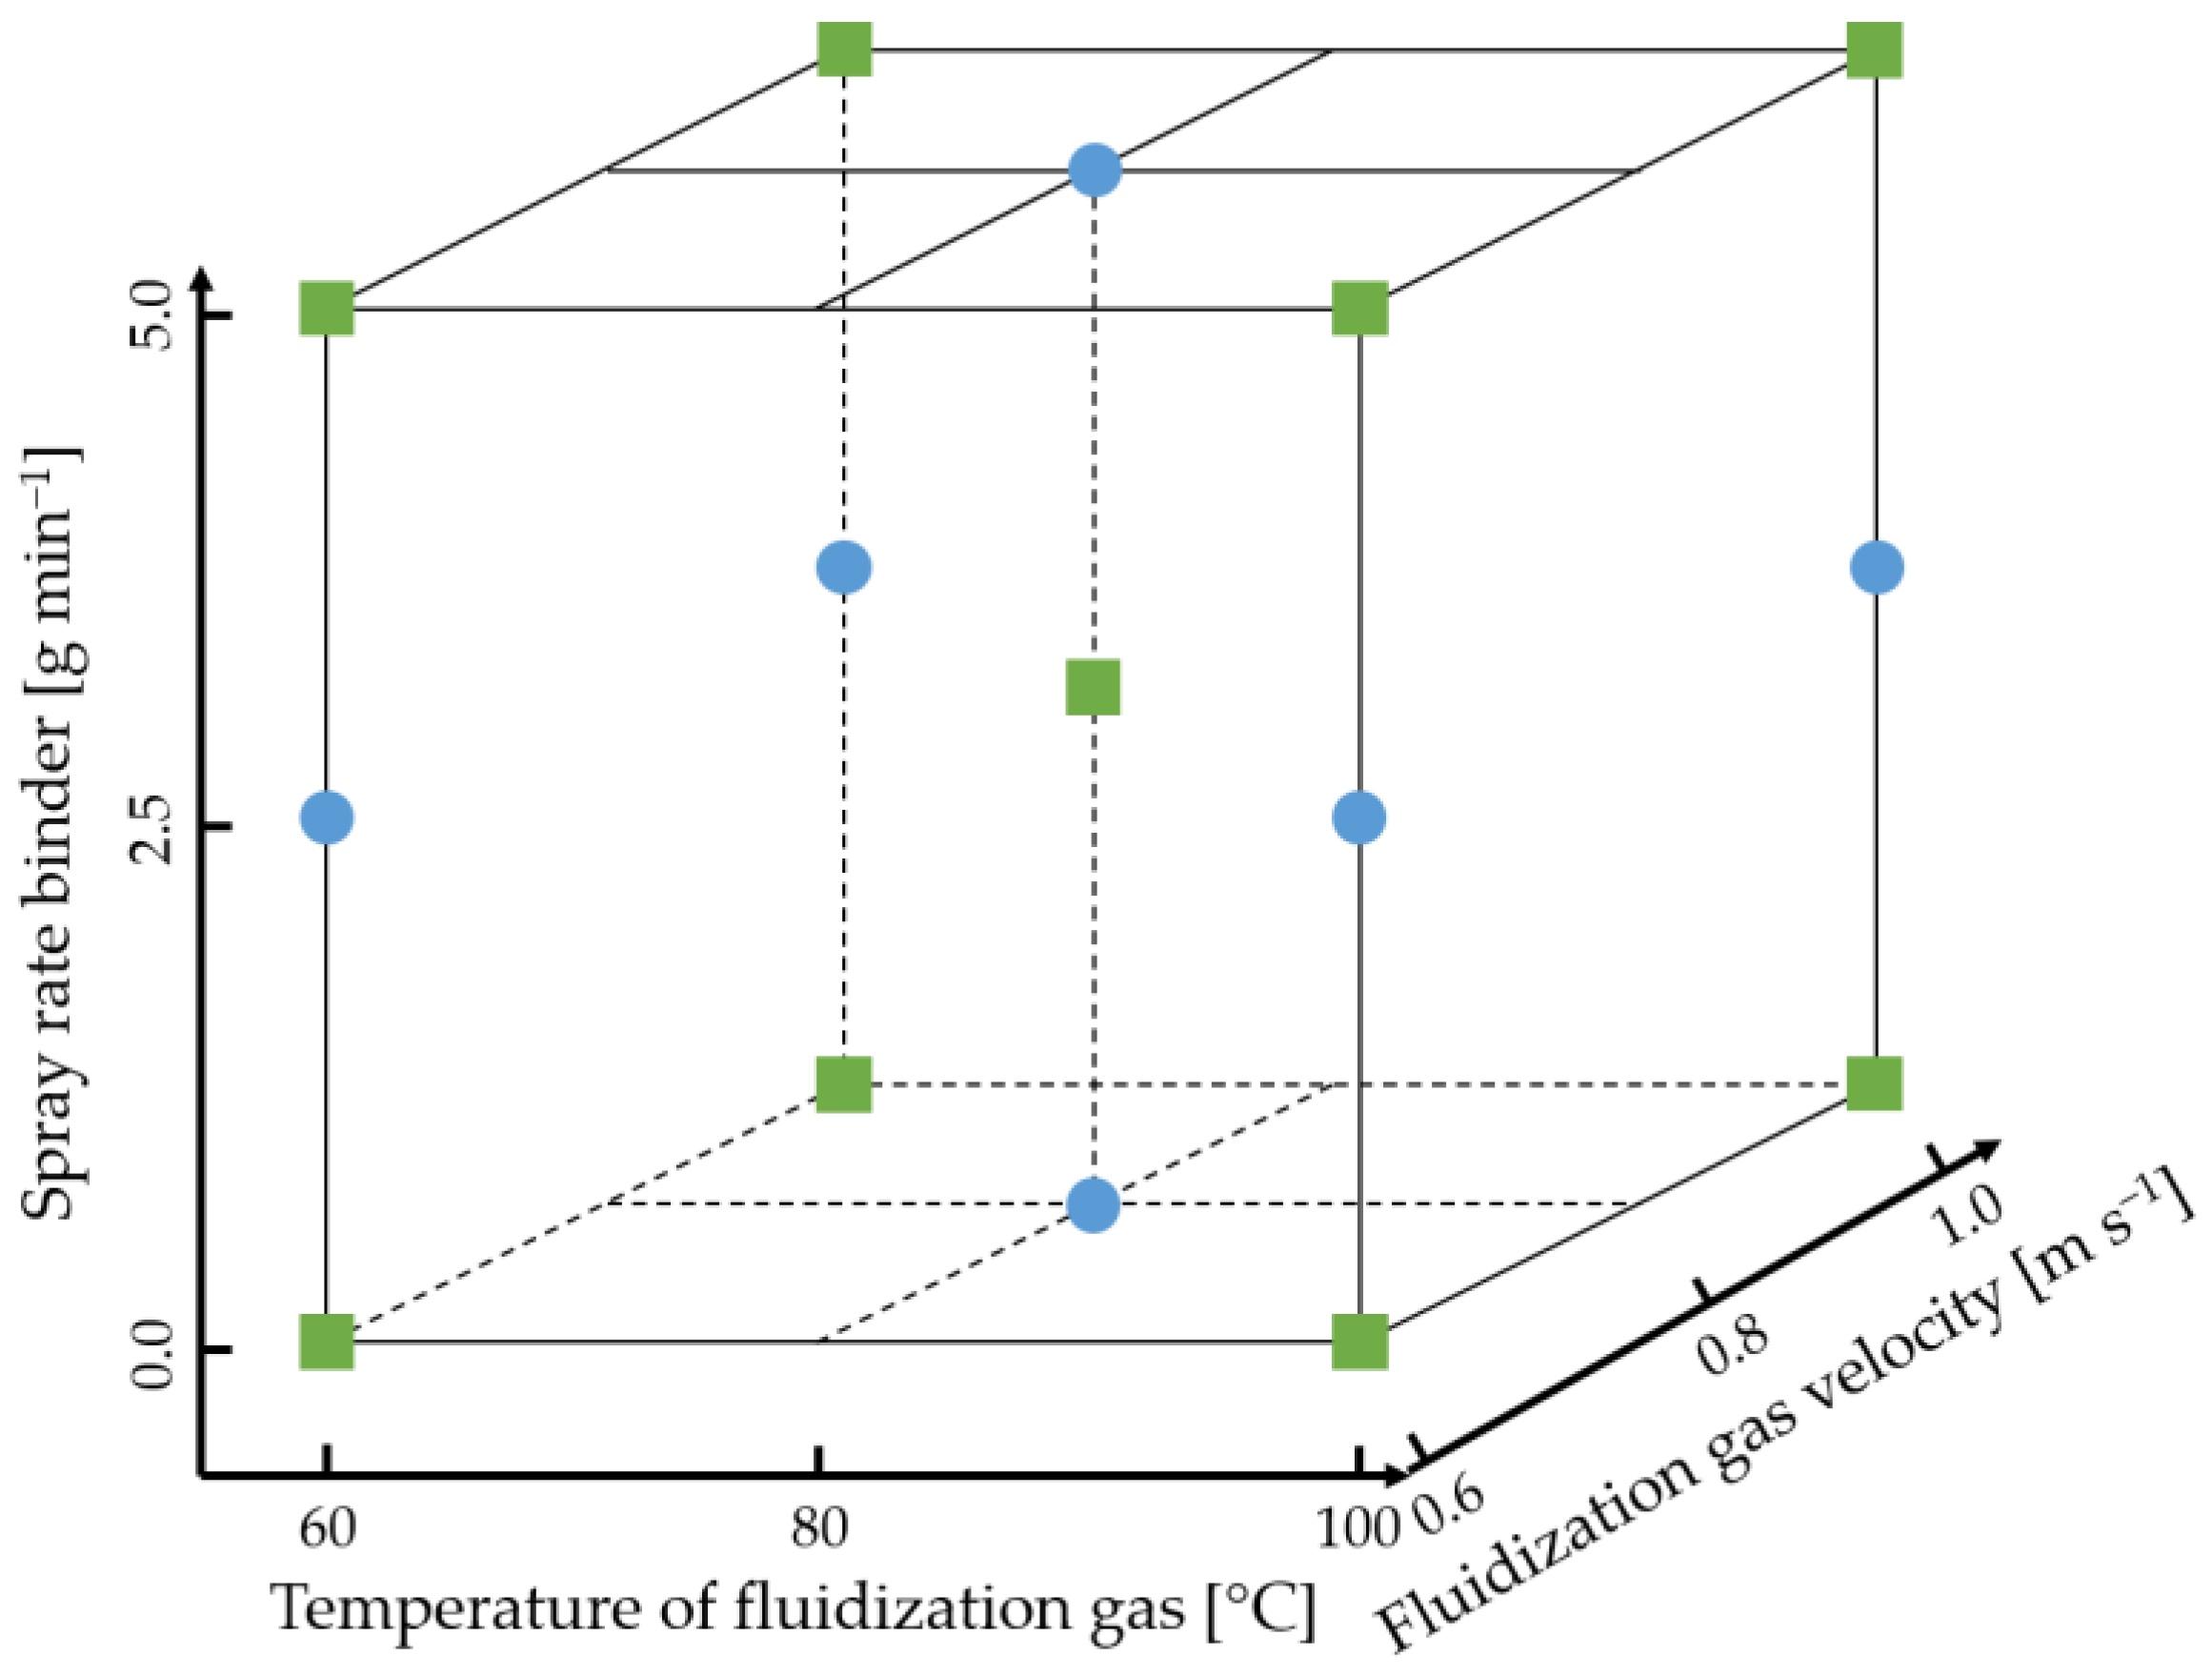
2.2. Experimental Design

A total of N = 85 individual trials were conducted for calibration and validation. Eighteen of these trials were part of a full factorial DoE with three parameters, two levels, and the inclusion of the center point. The DoE was duplicated into two blocks with one block for each nozzle type. The remaining trials were performed as preliminary tests for optimization and additional systematic trials for calibration (blue circles in Figure 2). In total, 26 of the 85 trials were conducted using the high-pressure nozzle. The data were randomly split into calibration and validation sets in a 7:3 ratio, with 60 samples being used for the calibration of the model.
An excerpt from the experimental design is shown in Figure 2. The binder addition rate was varied equidistantly from 0 to 5 g min−1, the temperature was also varied equidistantly from 60 to 100 °C, and the fluidization velocity from 0.6 to 1 m s−1.
A multi-factorial ANOVA with three factors and two levels each was performed. A two-tailed t-test with particle moisture as the dependent variable was used. The model or model terms were considered to be significant at a p-value < 0.05. The null hypothesis that there were no differences between the means was rejected.

2.3. Capacitive Moisture Measurement

The Litronic FMS II system (Liebherr-Mischtechnik GmbH, Bad Schussenried, Germany) was used for capacitive moisture measurements by measuring the dielectric properties of the agglomerates. With changing moisture contents, the dielectric properties of the matrix change, which is represented at the output as a change in voltage [17]. The sensor had a sampling cycle of one measurement per second and was positioned flush with the wall. The corresponding values from the capacitive sensor were collected over 30 s for each measurement and then averaged to obtain an accurate representation of the dielectric properties.

2.4. Near-Infrared Spectroscopy

NIR spectra were recorded via reflection using a Polytec PSS-H-B02 version 1.7 contact probe (Polytec GmbH, Waldbronn, Germany) equipped with a fiber-optic system and a halogen lamp. The probe was connected to a PSS 1720 spectrometer over a 3 m optical fiber cable. The software PAS-LAB version 1.2 was used for settings and exporting the taken NIR spectra. The spectra were obtained with an exposure time of 7 ms and 500 accumulators covering a wavelength range of 850 to 1650 nm with 401 measurement points. Dark and reference measurements were performed prior to each measurement. Offline spectra were taken in triplicate (100 accumulation) with a measurement cylinder, which was filled approximately to a height of 150 mm.
Partial least squares (PLS) regression was used for calibration. The samples were randomly split 70:30 into calibration (C) and validation (V) data sets. An in-house developed MATLAB® (MathWorks, Natick, MA, USA) program automatically tested different number of factors, pre-processings, and responses based on statistical parameters. The statistical parameters were the coefficient of determination (R²), root mean square error (RMSE), standard error (SE), as well as systematic error (bias). Wavelength and sample selections were tested but will not be shown in this work.

2.5. Spatial Filter Velocimetry

The IPP measures the velocity and flight time of particles in a fluidized bed. The data are used to calculate the geometrical length of the particles and stored in a ring buffer. This information is then used to determine the particle size distribution and velocity distributions. The IPP, which is capable of measuring particles ranging from 50 to 6000 µm in size and velocities of up to 50 m s−1, is described in detail, including its technical specifications, in [18]. The internal air flush for dispersion was set to 15 L min−1 and the external channel was flushed for cleaning every 20 s for two seconds at 2.5 L min−1. The adjustment factor was set to one and no offset was defined. The ring buffer was set to 50,000 particles, which was the data set from which the current size distribution curve was calculated. The maximal loading was set to 50%. At an average particle rate of approximately 1550 s−1, depending on the degree of fluidization, the ring buffer was overwritten about every 30 s.
The IPP data were fitted to the cumulative distribution function of the Rosin–Rammler distribution (Equation (1), [19]), and the scale and shape parameters were extracted as output variables for the PLS models. A separate model was developed for each parameter:
Q 3 ( x ) = 1 exp ( ( x x ) n )
with x as the scale and n as the shape parameter.

2.6. Off-Line Powder Analysis

The particle size was measured by laser diffraction with a Mastersizer 2000 particle size analyzer (Malvern Instruments GmbH, Herrenberg, Germany) with a dry dispersion unit at a dispersion pressure of 0.3 MPa. The moisture content on a wet basis (w.b.) was analyzed using volumetric Karl Fischer titration according to the method in [20]. A solvent consisting of 10 mL formamide and 20 mL methanol at a temperature of 50 °C and a titration time of 300 s was used for this purpose. The bulk density was measured according to EN ISO 60 using the SMG 53466 bulk density tester from Powtec Maschinen und Engineering GmbH (Remscheid, Germany). The measurements were performed in triplicate.

3. Results and Discussion

The results are presented in two parts. Firstly, the findings of the DoE are presented and conclusions are drawn regarding the influence of the investigated factors (nozzle type, fluidization temperature and velocity, as well as binder spray rate) on the particle properties. Secondly, in-line monitoring systems for the product moisture content and the particle size distribution are evaluated. Regarding the product moisture content, capacitive moisture measurement and NIR measurement approaches were tested. The particle size distribution was measured in-line via the IPP, fitted to the Rosin–Rammler function, and used for a PLS regression of the NIR spectra.

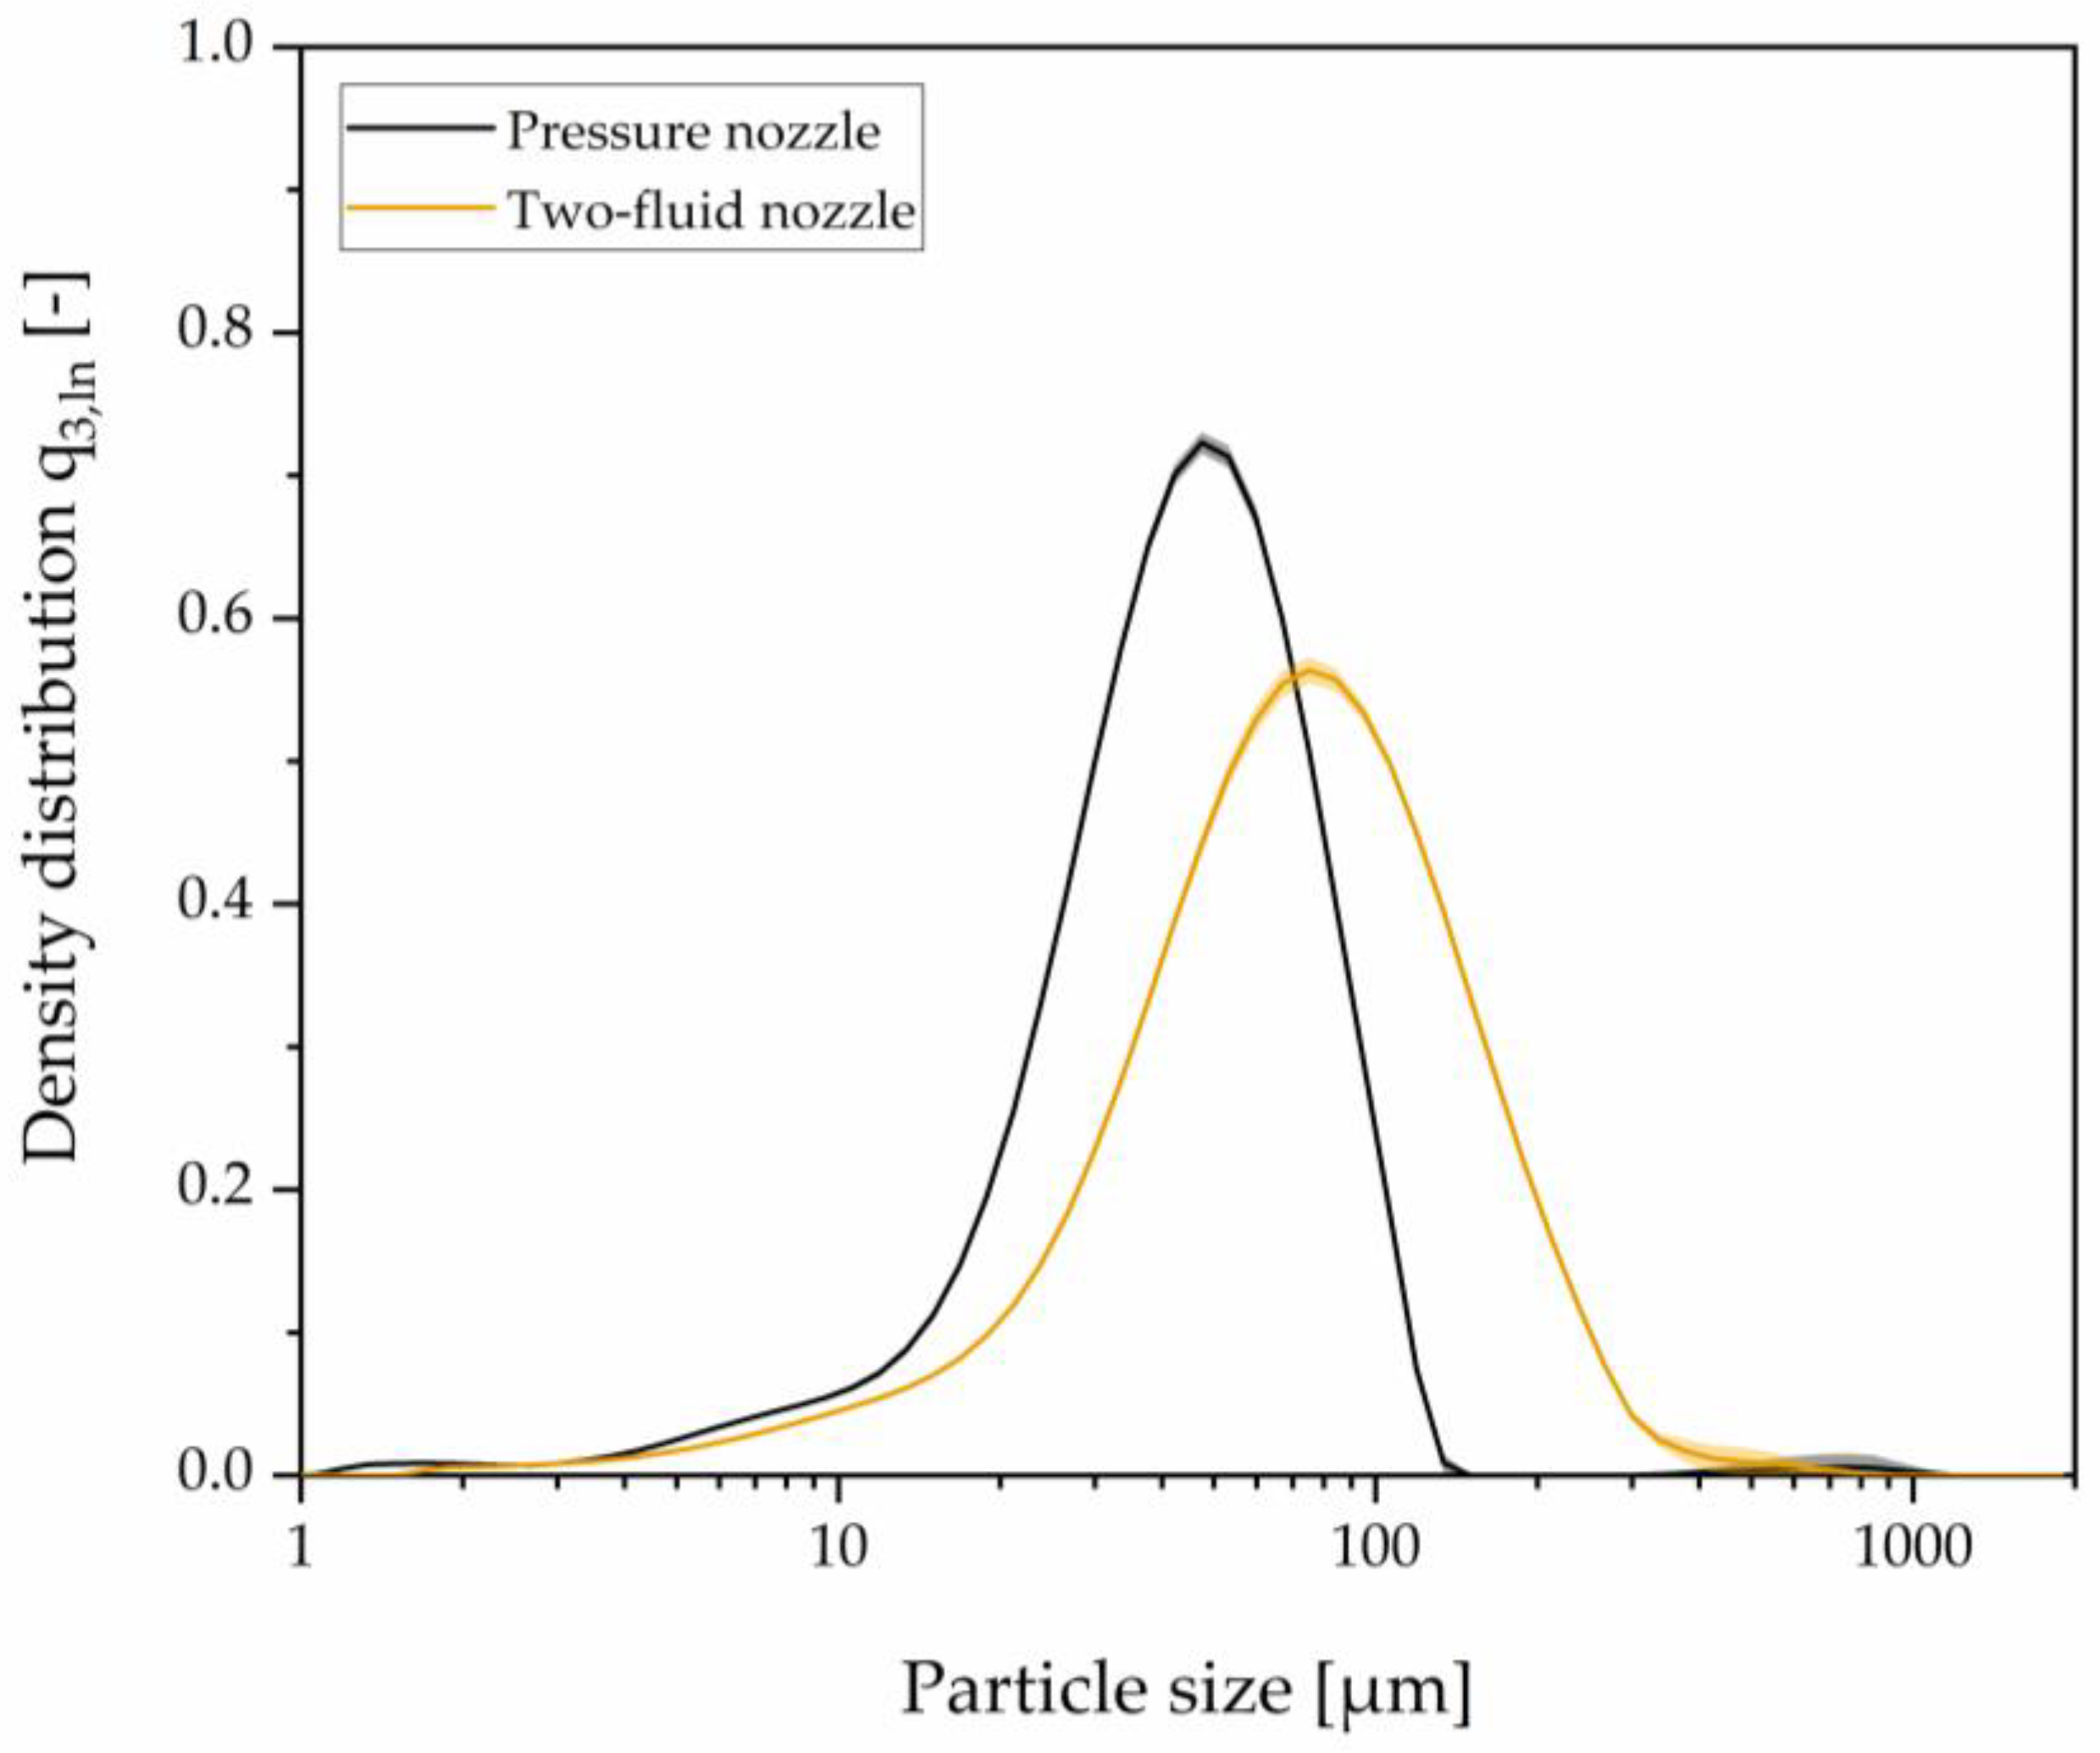
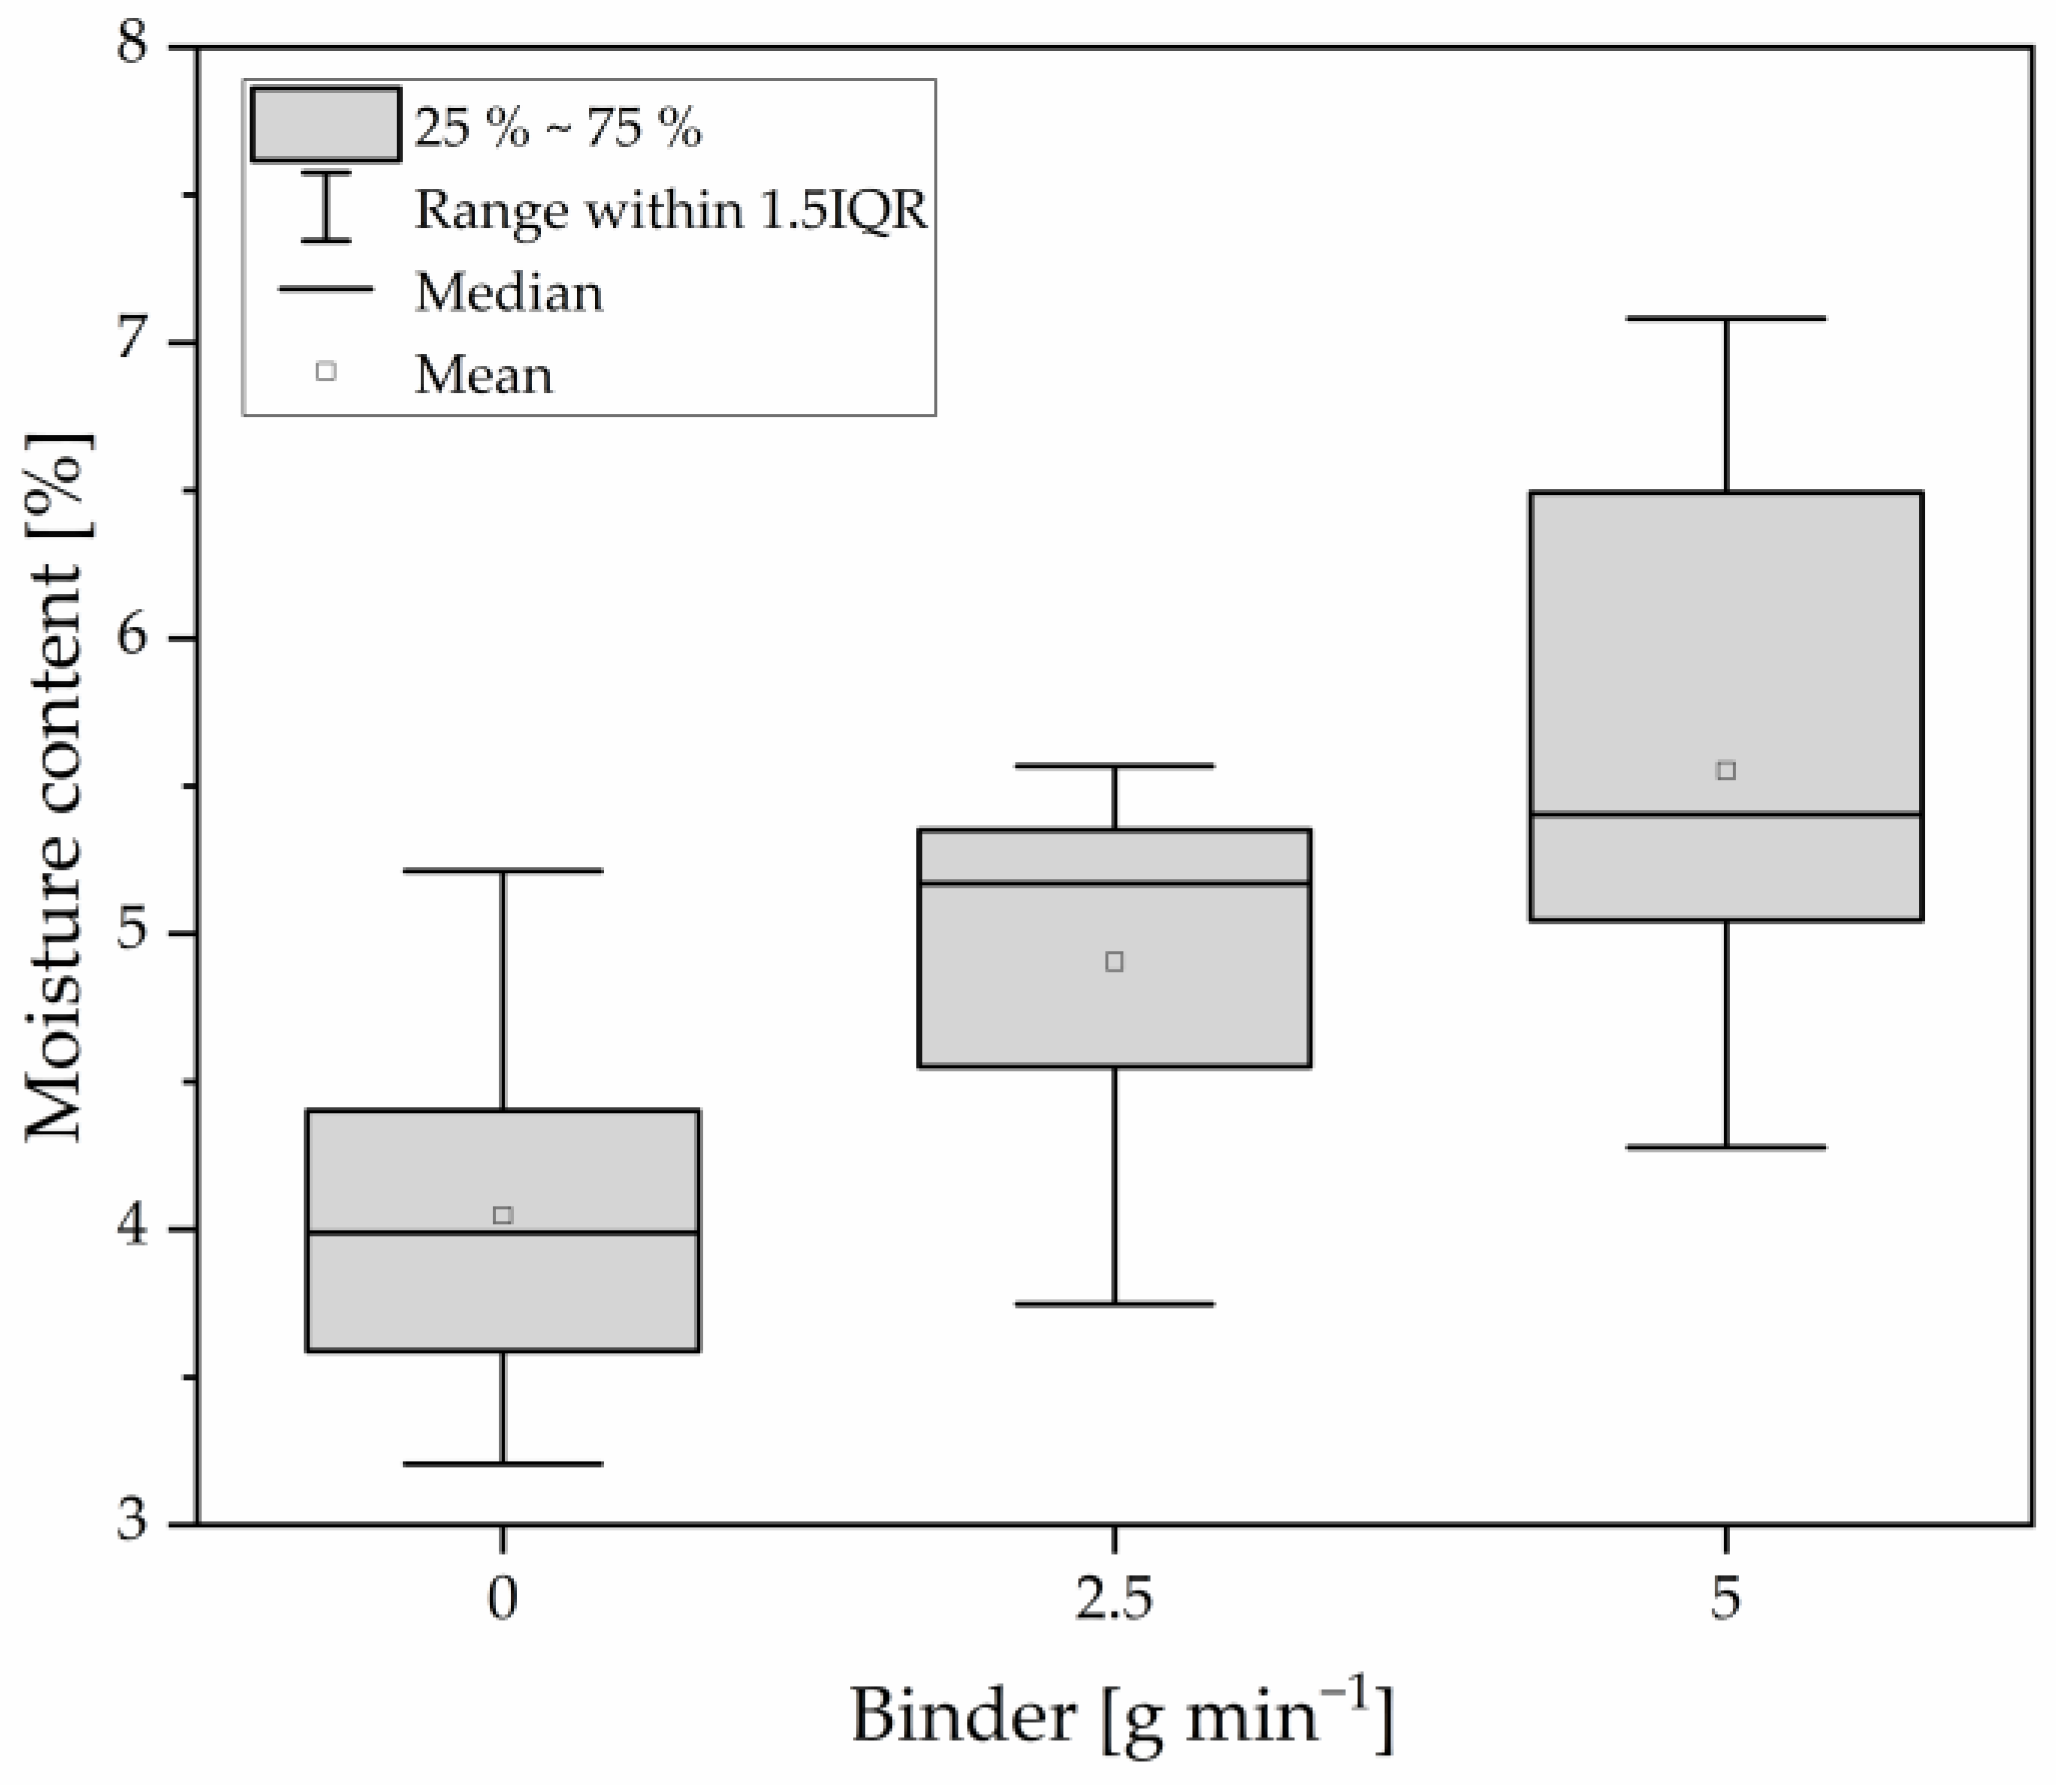
3.1. Spray-Through Agglomeration with an Integrated Fluidized Bed

Agglomeration in an integrated fluidized bed can be optimized by choosing the appropriate combination of process parameters. Therefore, the process conditions were varied in a wide range to give an overview of the spray-through agglomeration process. In the following sections, each investigated factor and its influences on the responses are described separately. Afterwards, correlations between the responses are shown. Lastly, selected DoE results are illustrated.
Firstly, the nozzle type influences the size distribution. For example, the results of the reference trials (80 °C, 0.8 m s−1) under the same process conditions without binder addition are shown in Figure 3. The pressure nozzle (diameter 0.3 mm) produced smaller agglomerates ( d 50 , 3 = 43.82   µ m ) than the two-fluid nozzle ( d 50 , 3 = 70.61   µ m ). The nozzle also affects the resulting bulk density, with the pressure nozzle producing higher bulk densities (535 to 609 kg m−3) than the two-fluid nozzle (469 to 552 kg m−3). The difference can be attributed to changes in the morphology and porosity of the primary particles, as well as the agglomerate structure. As stated in the literature, without atomizing gas, the porosity is lower, which can result in higher bulk densities. The pressure nozzle does not incorporate air into the droplets, resulting in a increase in bulk density. This higher density can result in faster sedimentation into the fluidized bed and potentially longer residence times. However, the smaller size and higher density of the particles produced by the pressure nozzle may also result in smaller agglomerates, probably due to collision probabilities, as sedimentation depends on the size, shape, and density of the particles [21]. The residence time in the system is determined by the powder level, and once this is constant, the powder is discharged.
The second factor to consider is the influence of the fluidization temperature on the particle properties. The results show that the temperature alone had only minor effects on the particle properties. This is indicated by the highest correlations of this factor being found for humidity and water activity, with correlation coefficients of −0.34 and −0.39, respectively. Normally, an impact of temperature on the particle stickiness, as well as the corresponding changes in particle size, is expected due to the glass transition as the thermal binding mechanism [8]. In the trial conducted with the two-phase nozzle at 0.6 m s−1 fluidization, 100 °C, and the maximum binder dosage, a moisture level of 6.49% was achieved. The literature shows that the glass transition temperatures for SMP at this moisture level are around 26 °C. The glass transition temperature depends on the material properties and the amount of plasticizer, e.g. water. In the viscous state above the onset glass transition temperature, the surface viscosity is reduced and material stickiness enables the agglomeration of particles. The sticky point is reached when the surface viscosity of the particles falls below a critical value, typically around 10 to 20 K above the onset glass transition temperature [22]. The fluidizing air was considerably above the sticky point temperature (55 K), indicating a high particle cohesion probability. However, the measured particle size was 60.46 µm, which was similar to all DoE trials using the same nozzle. In addition to the cohesion probability, the collision probability influenced by the fluidization velocity is a factor controlling the agglomeration. Since the fluidization velocity showed only minor effects on particle properties, a better understanding of the cohesion and collision probabilities is necessary.
The amount of binding agent used had an impact on several factors, particularly the moisture content (r = 0.67) and the water activity. With an increasing binder spray rate, the moisture content of the particles increases, considering all samples in a common boxplot (Figure 4). The moisture content can be adjusted via the process parameters without the addition of binders. Median moisture contents of 4% have been achieved, at which efficient agglomeration cannot be expected as the product is not sticky enough at the powder temperatures reached. The addition of a binding agent enables the particles to enter the sticky region for agglomeration.
The responses of the product were further analyzed (Table 1). As expected, a strong correlation was observed between moisture and water activity, which can be described by a product-specific sorption isotherm. Additionally, moisture was also moderately positive correlated moderately with particle size parameters, such as with the D 3 , 2 or the scale parameter. Conversely, the shape parameter correlated moderately negatively with moisture, meaning that the distribution becomes broader with an increasing amount of binding agent. This is further supported by the increase in the span. The bulk density correlated with the offline CM sensor response, while the powder level correlated strongly with the in-line CM sensor response.
To understand the effect of the process on the particle moisture and to determine the major influencing factors, an analysis of variance (ANOVA) was used. To select a suited model description, the center point was included to check for non-linear correlations. The results showed that the moisture content curvature was not significant. Thus, the null hypothesis was rejected and an unadjusted model was formed. The model mainly included the effects of the binder spray rate (56.52%), the fluidized bed temperature (14.22%), and the interaction between the nozzle type and fluidization velocity (10.67%). Non-significant interaction terms were also included to form a physical hierarchical model. The resulting model was significant (p = 0.0002) with an adjusted R² of 0.87. The diagnostic parameters were found to be acceptable; however, the residuals for the two-phase nozzle were observed to be larger but still within acceptable limits. The expected moisture is plotted as a function of the main influencing factors (Figure 5). The moisture content increases with higher binder spray rates and lower temperatures, providing a systematic understanding of how moisture can be influenced. This allows the moisture in the application to be changed if the sensors detect a deviation from the nominal value.
The variation in product moisture values, as shown in Figure 5, covering a range of 3.5 to 6%, is relatively small. However, the product changes within this range from a fully cohesionless material to a highly sticky powder that agglomerates easily. Controlling this critical product change is the challenge to be solved through the use of the implemented in-line measurement and control system. The multi-stage design of the process has the benefit of process integration but also the particular drawback that less control parameters can be adjusted to ensure robust and optimal performance.

3.2. Capacitive Sensor Responses

The objective was to determine if the CM sensor can accurately and reliably measure the moisture content. Firstly, regression was performed for the offline sensor responses but it was found that the coefficients of determination were low. Specifically, the R² value was 0.33 for the pressure nozzle and 0.28 for the two-phase nozzle. Combining the data sets for combined regression did not improve the model (data not shown). Kupfer [23] emphasized the bulk density as one of the most important influences on indirect water determination. When the offline sensor response is correlated to the bulk densities of the powder, an R² of 0.76 is achieved for the pressure nozzle and of 0.91 for the two-phase model (Figure 6). Consequently, the effect of the bulk density on the sensor response is more pronounced than the effect of the moisture content.
The in-line sensor response showed no correlation with the water content, as indicated by an R² of 0.14 for the pressure nozzle trials and of 0.01 for the two-phase nozzle trials. However, it was found to be positively correlated with the pressure drop and filling level of the fluidized material. The correlation was affected by the interval at which pneumatic hammers release material from the spray dryer wall, occurring every 60 s. This relationship is illustrated as an example (Figure 7).
Similar effects with capacitive sensors have been reported in the literature, where it was necessary to calibrate them at high moisture levels (up to 70%), assuming a consistent material thickness and density [24]. Due to variances and a lack of mathematical patterns, corrections for the material thickness and density were unsuccessful. Li et al. [25] summarized the constraints for the moisture measurement of corn related to product properties, i.e. the flow state or pore distribution. In these circumstances, NIR sensors have been favored. The recent research indicates that in fluidized beds, a dependence on process and product conditions is more prevalent for CM sensors compared to NIR sensors [26]. One possible way to gain a better understanding of the underlying mechanisms is using a pressure fluctuation analysis, as demonstrated by J. C. Schouten and colleagues. This method can provide valuable insights that can help refine and optimize the multi-sensor approach for the early detection of system changes [27].

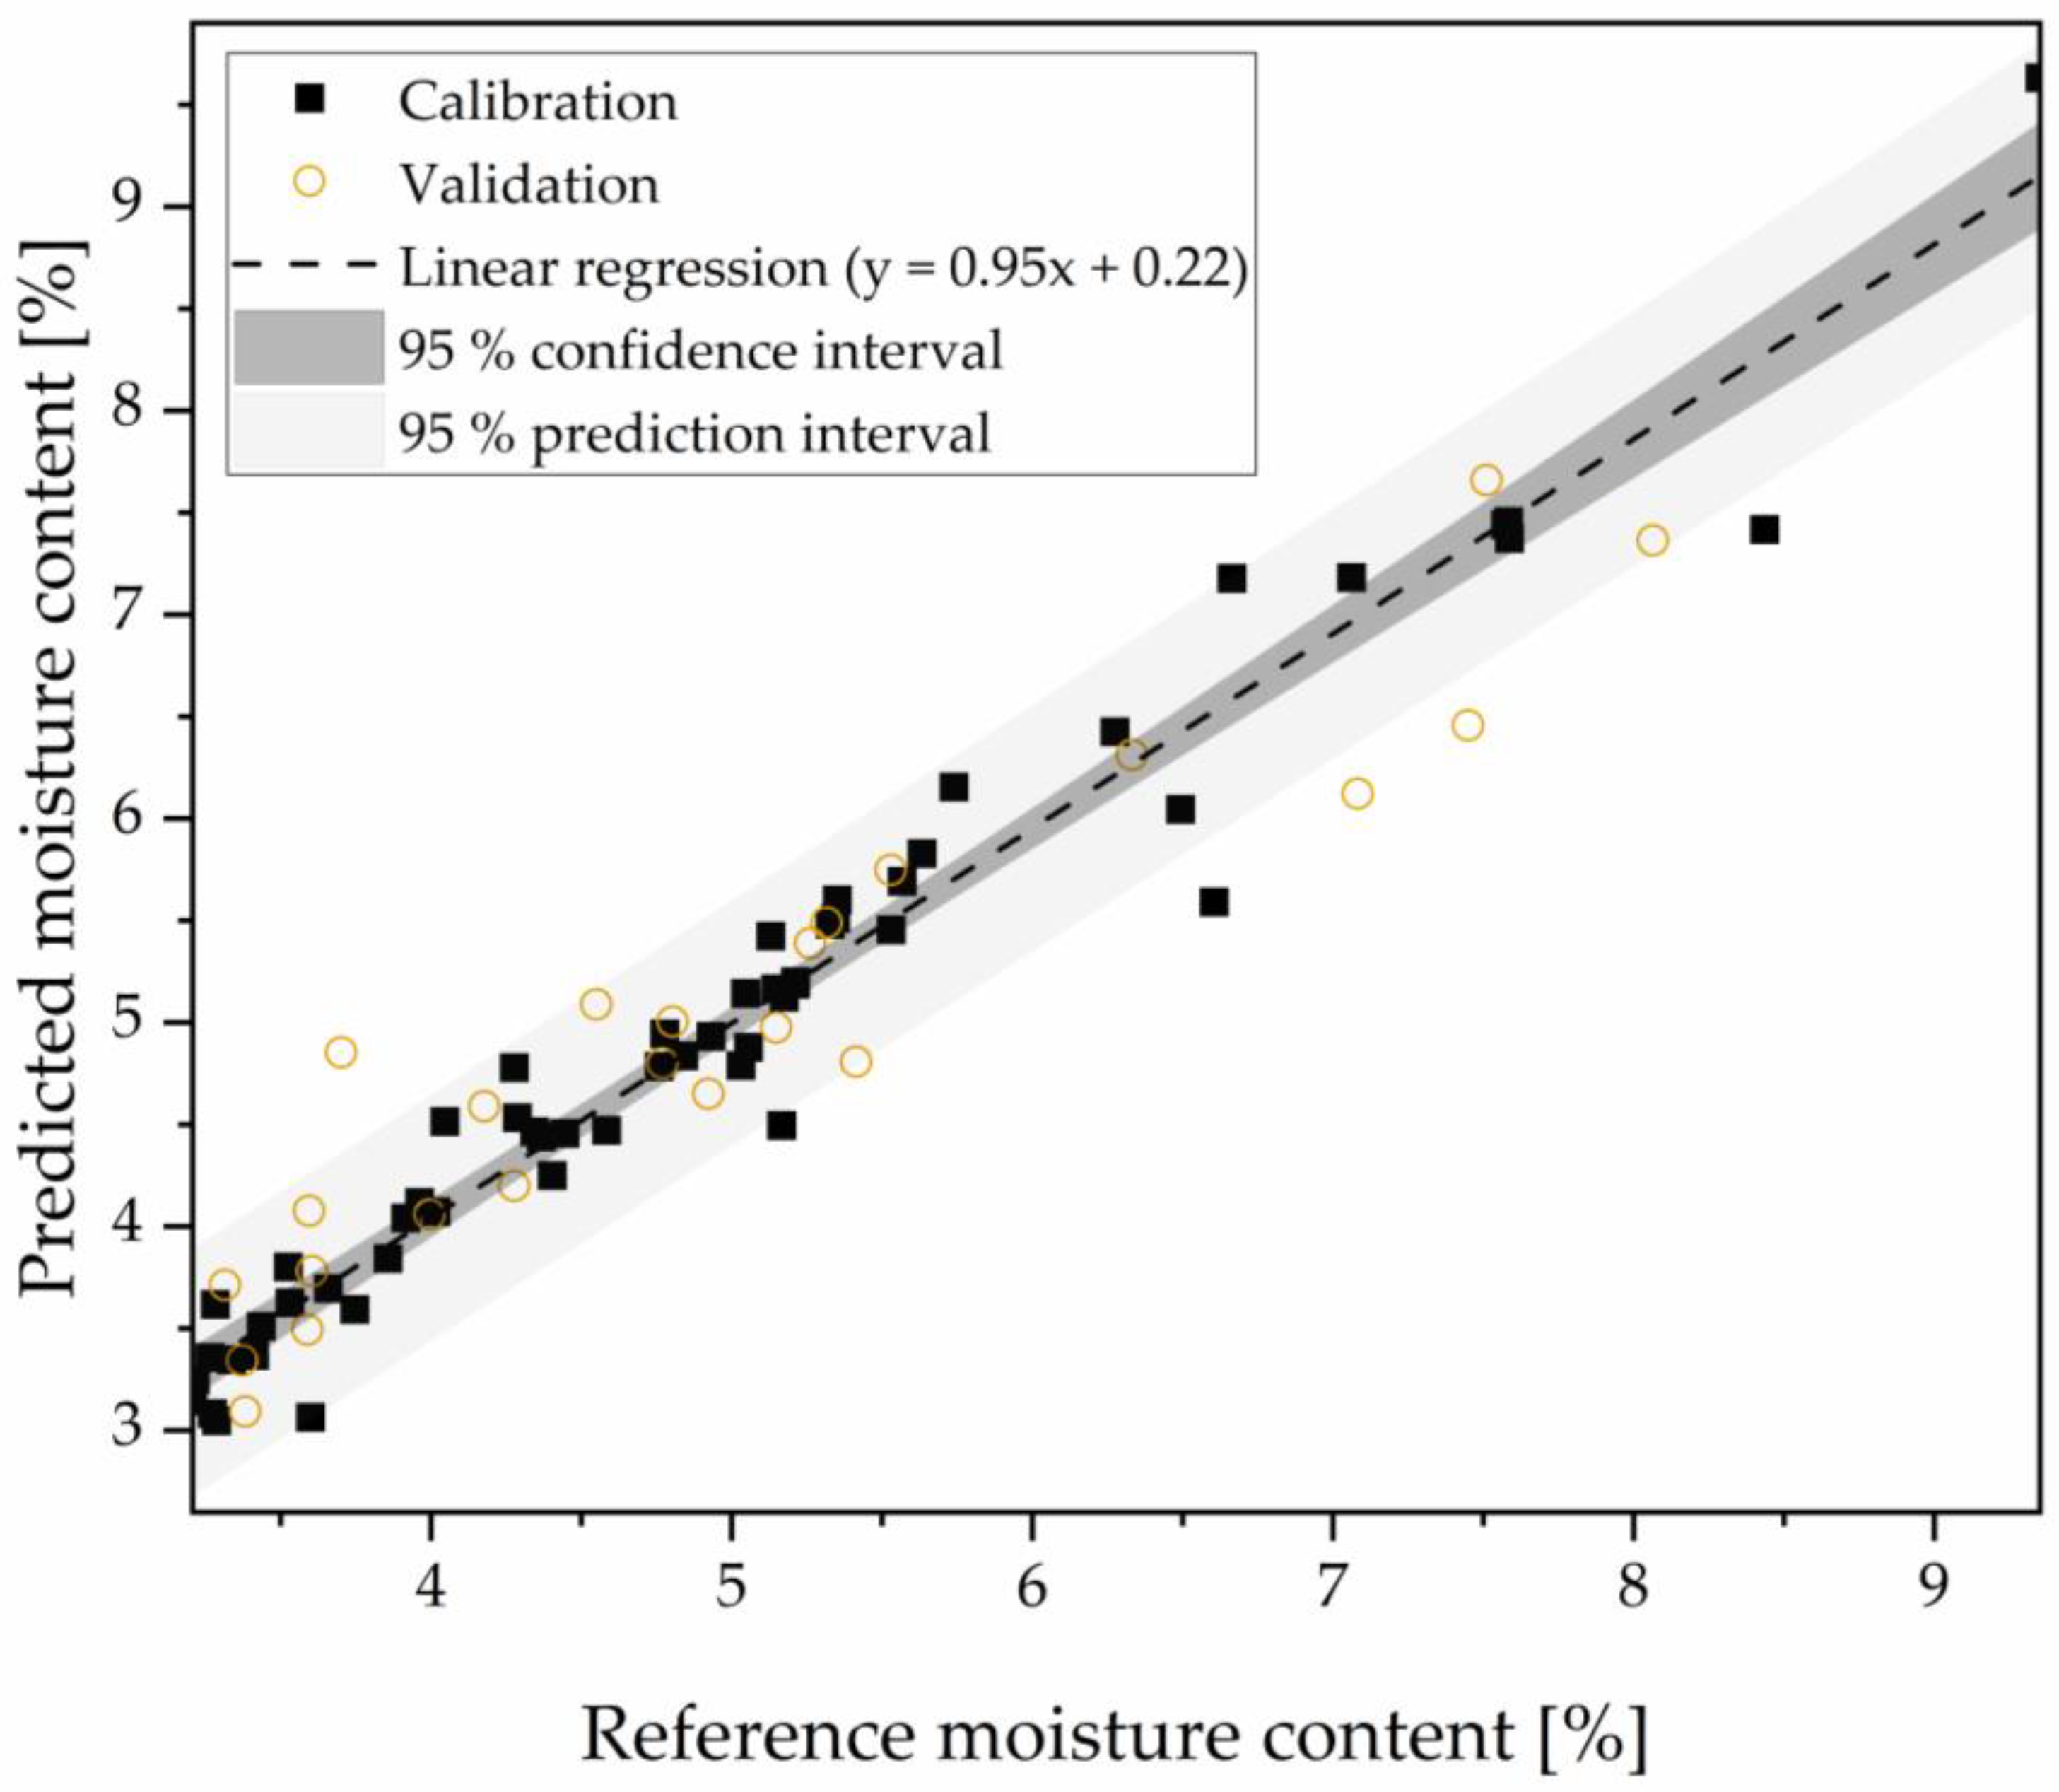
3.3. Calibration of Near-Infrared Spectra to the Moisture Content

In this chapter, the building of the NIR model via PLS regression to predict the moisture content (w.b.) in the integrated fluidized bed in-line is presented. Different selections of spectral data were tested, as the NIR spectra varied with the type of nozzle used to atomize the feed. Despite these differences, a joint model was established to predict the properties of the powder samples independent of the nozzle type used. However, if necessary, better correlations with fewer resulting factors from the PLS can be achieved by using separate models for each nozzle type. The last minute before taking the sample was averaged for further evaluation.
To correct the spectral data for noise, baseline shifts or scaling differences, various pre-processing techniques were tested systematically. This can enhance the model’s robustness or reduce the number of factors needed. The optimum number of factors for each pre-processing technique was evaluated using multivariate statistical parameters (Table 2). Afterwards, a pre-processing technique is suggested according to the lowest number of factors, highest R², and lowest error values of the model, as indicated in the table. The most suitable method chosen was the standard normal variate (SNV) pre-processing with eight factors.
The scores indicate the coordinates of the objects in the factor space. A selection of scores for two factors classified into four groups of different moisture contents (Figure 8a) shows a lower moisture content for lower scores of factors 3 and 6 and vice versa. However, using only two factors, the samples could not be separated clearly in the factor space according to their moisture content. This emphasizes the need for more factors in the PLS model due to various influences in-line in the spray dryer on the spectral data. When considering the loadings for these two factors (Figure 8b), the wavelength region between 1400 and 1500 nm (blue) shows a positive impact on the moisture content. This region correlates with the second overtone of the OH, CH, and CH2 group. The wavelength region between 1350 and 1400 nm (green), where the second overtone of the CH2 and CH3 group is located, has an opposite effect for factors 3 and 6.
The predicted moisture is plotted over the measured moisture based on titration (Figure 9). The R² was 0.94 and the RMSE was 0.33%. In addition to the mean deviation, the maximum deviation of the validation set predictions was 1% moisture content or 16% of the moisture range of 7%. The linear regression with the confidence and prediction interval is illustrated for the calibration data set.
The model predicts a moisture content range for the agglomerates of 3 to 9.5%. From pre-trials, it has been shown that low moisture contents (<3%) can only be achieved without the addition of binders and with extended post-drying, while high moisture contents above about 10% lead to blockage of the fluidized bed. To conclude, the final model includes all relevant process regions for the manufacture of SMP in this spray drying setup.
In the literature, the pre-processings and number of factors vary for comparable PLS models. SNV pre-processing was used in predictions from offline and online built models [28,29]. This standardization method corrects for scattering effects due to differences in the physical properties of the samples, mainly the particle size, and is commonly used for particulate systems. The number of factors depends on the complexity of the samples. While only a few factors were needed for models measured offline [28] or with similar material [30], more than 10 factors were considered for dairy samples with different fat contents, animal types, producers, etc. [29]. Maltesen et al. [28] also found that the morphology of the samples had a significant impact on the predictive ability of the models and recommended using smooth and spherical particles. This explains the number of factors used for the PLS model in this study, as different nozzle types produce different particle morphologies. Further, different process conditions can lead to a change in the in-line NIR signal.

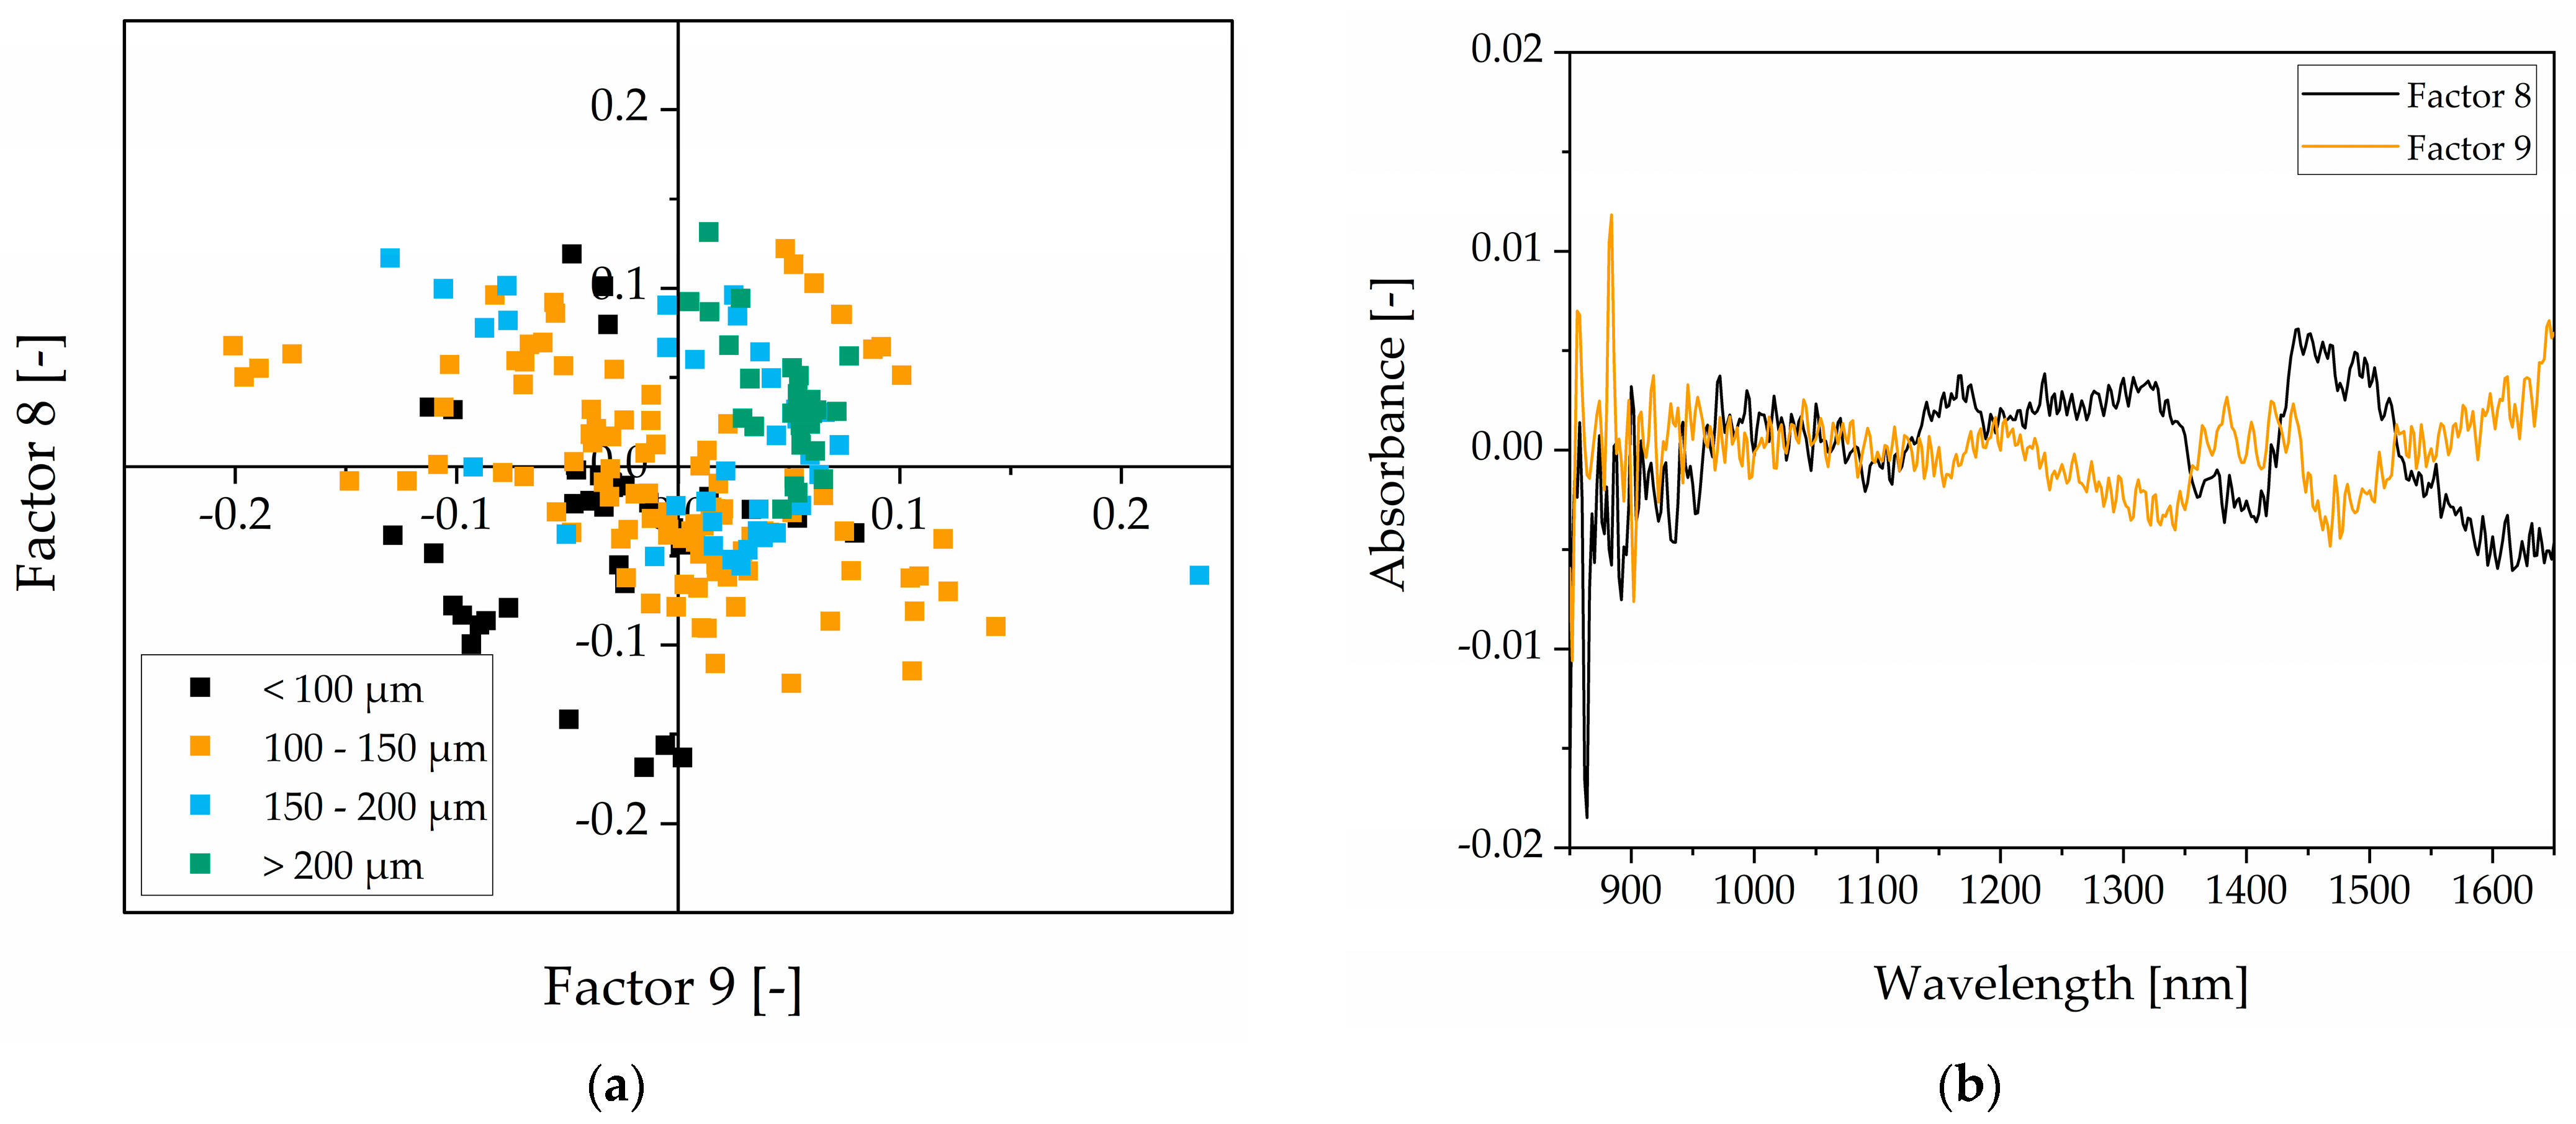
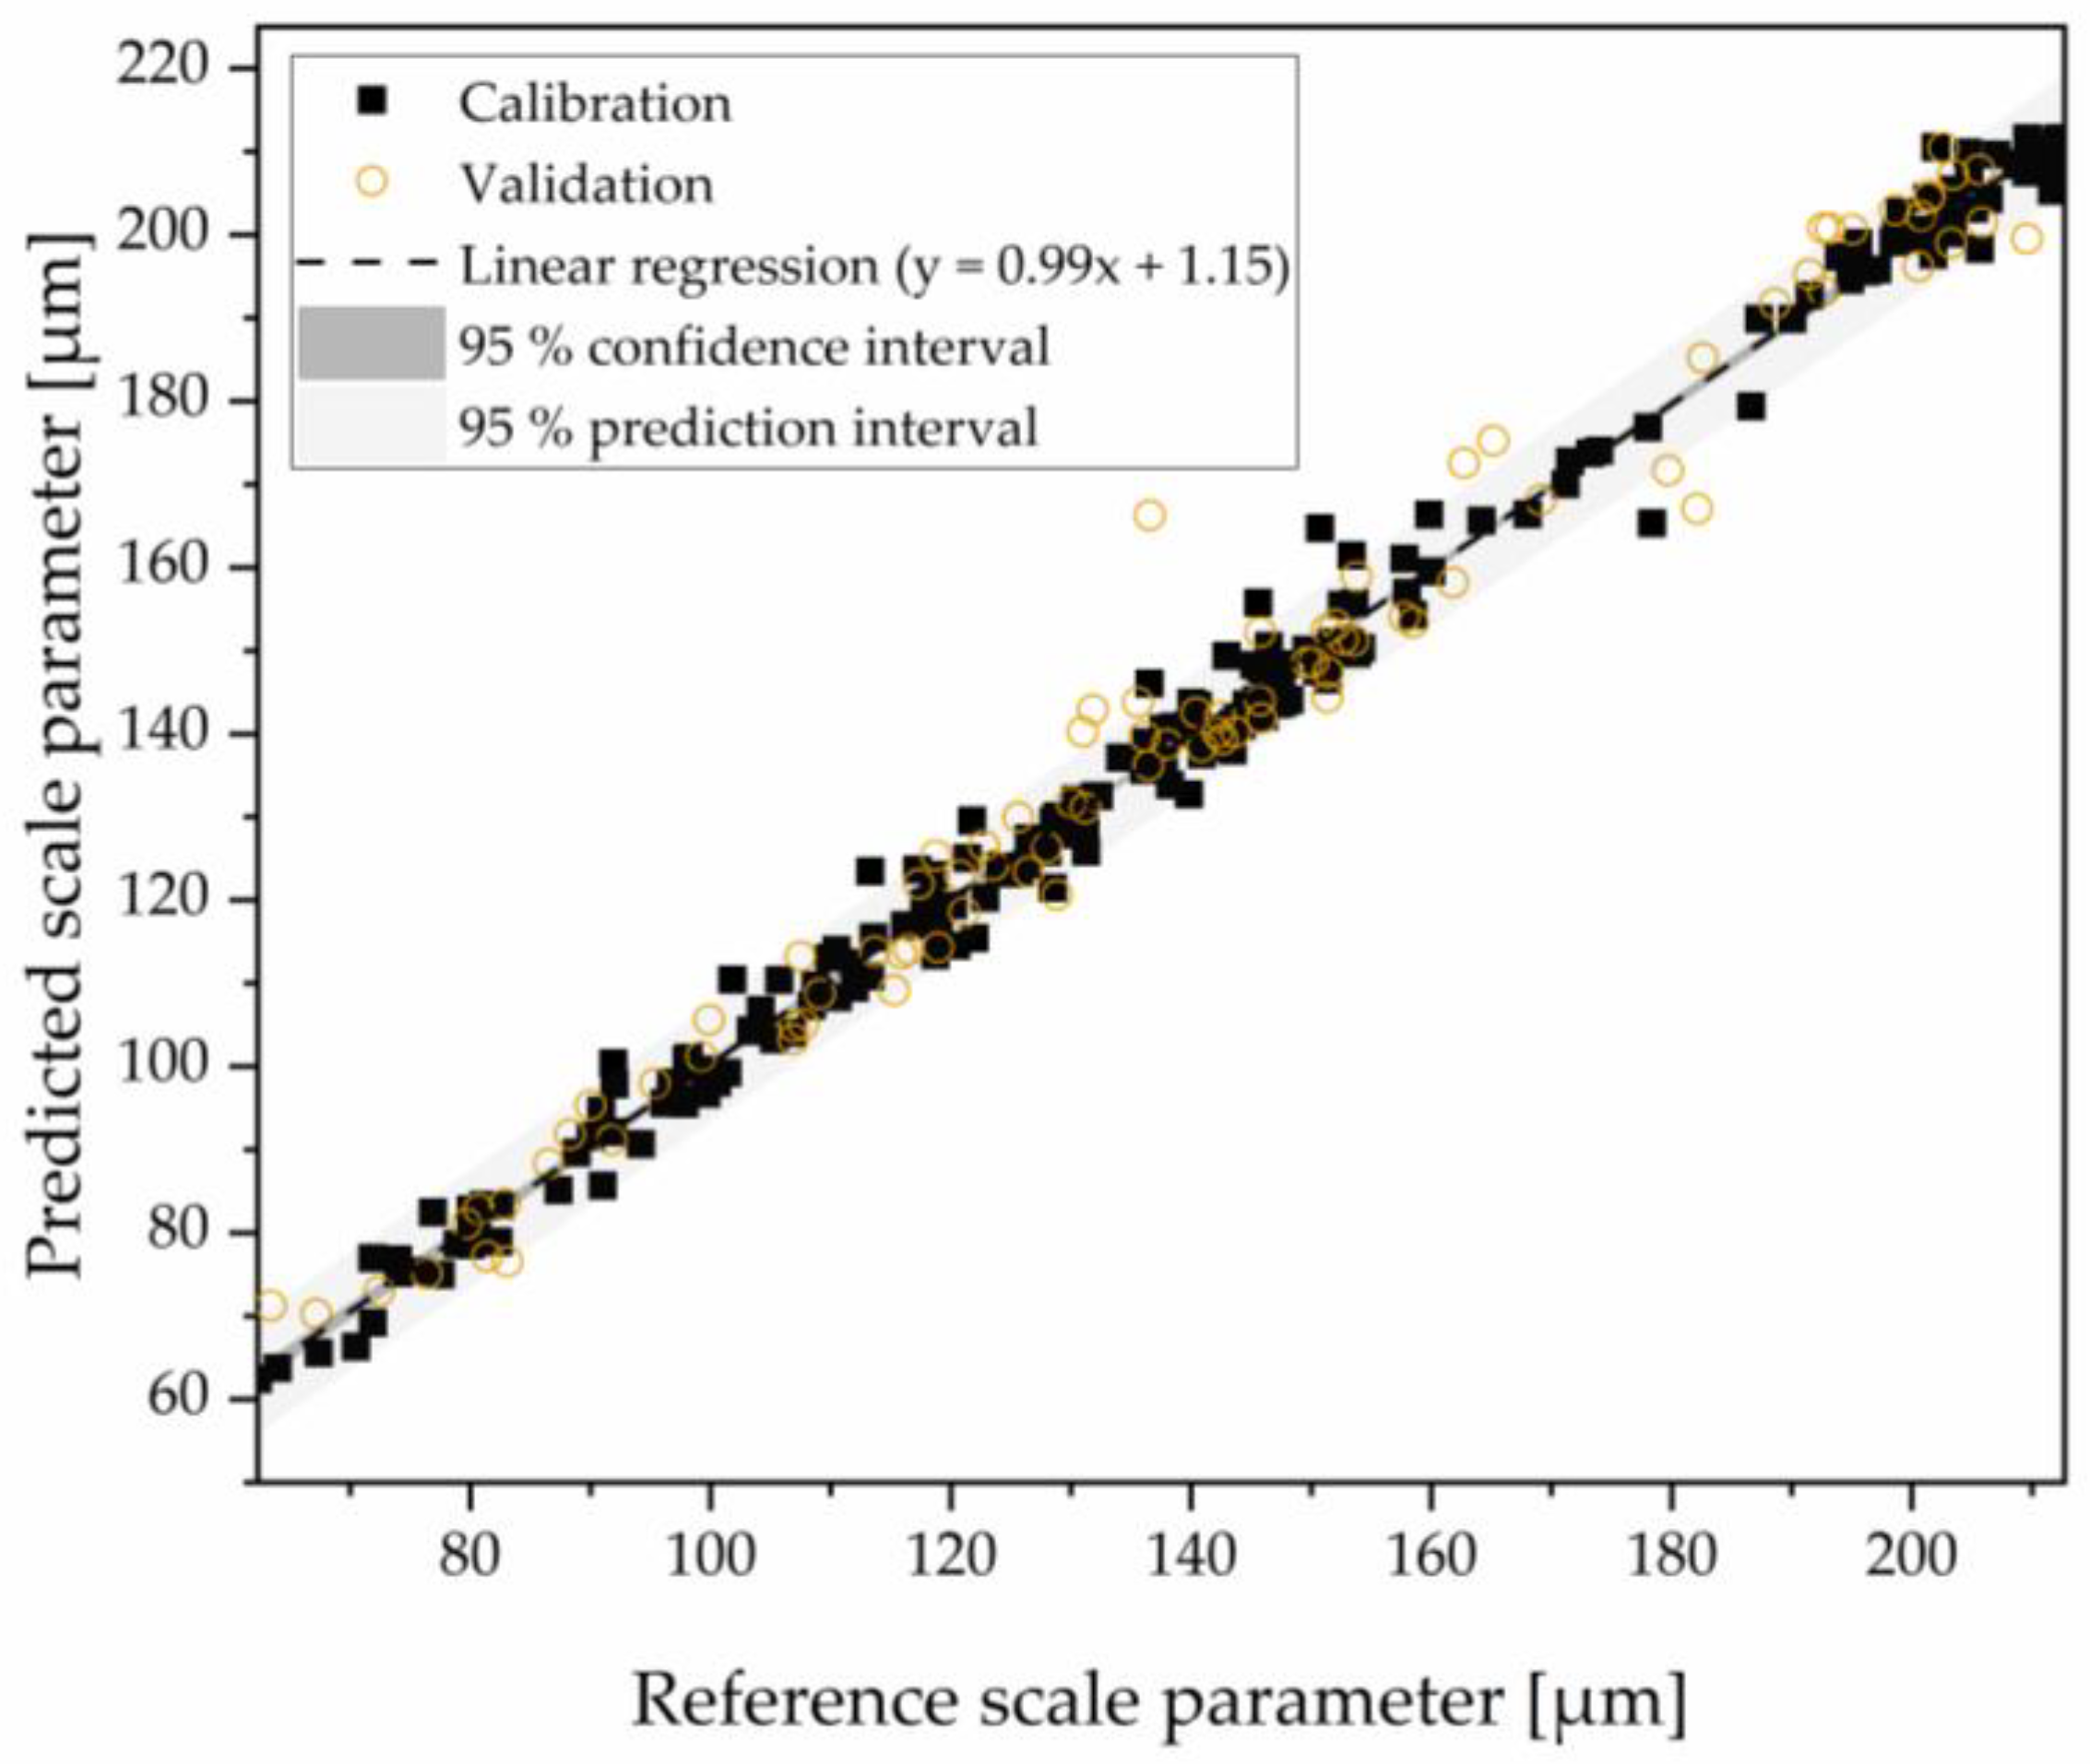
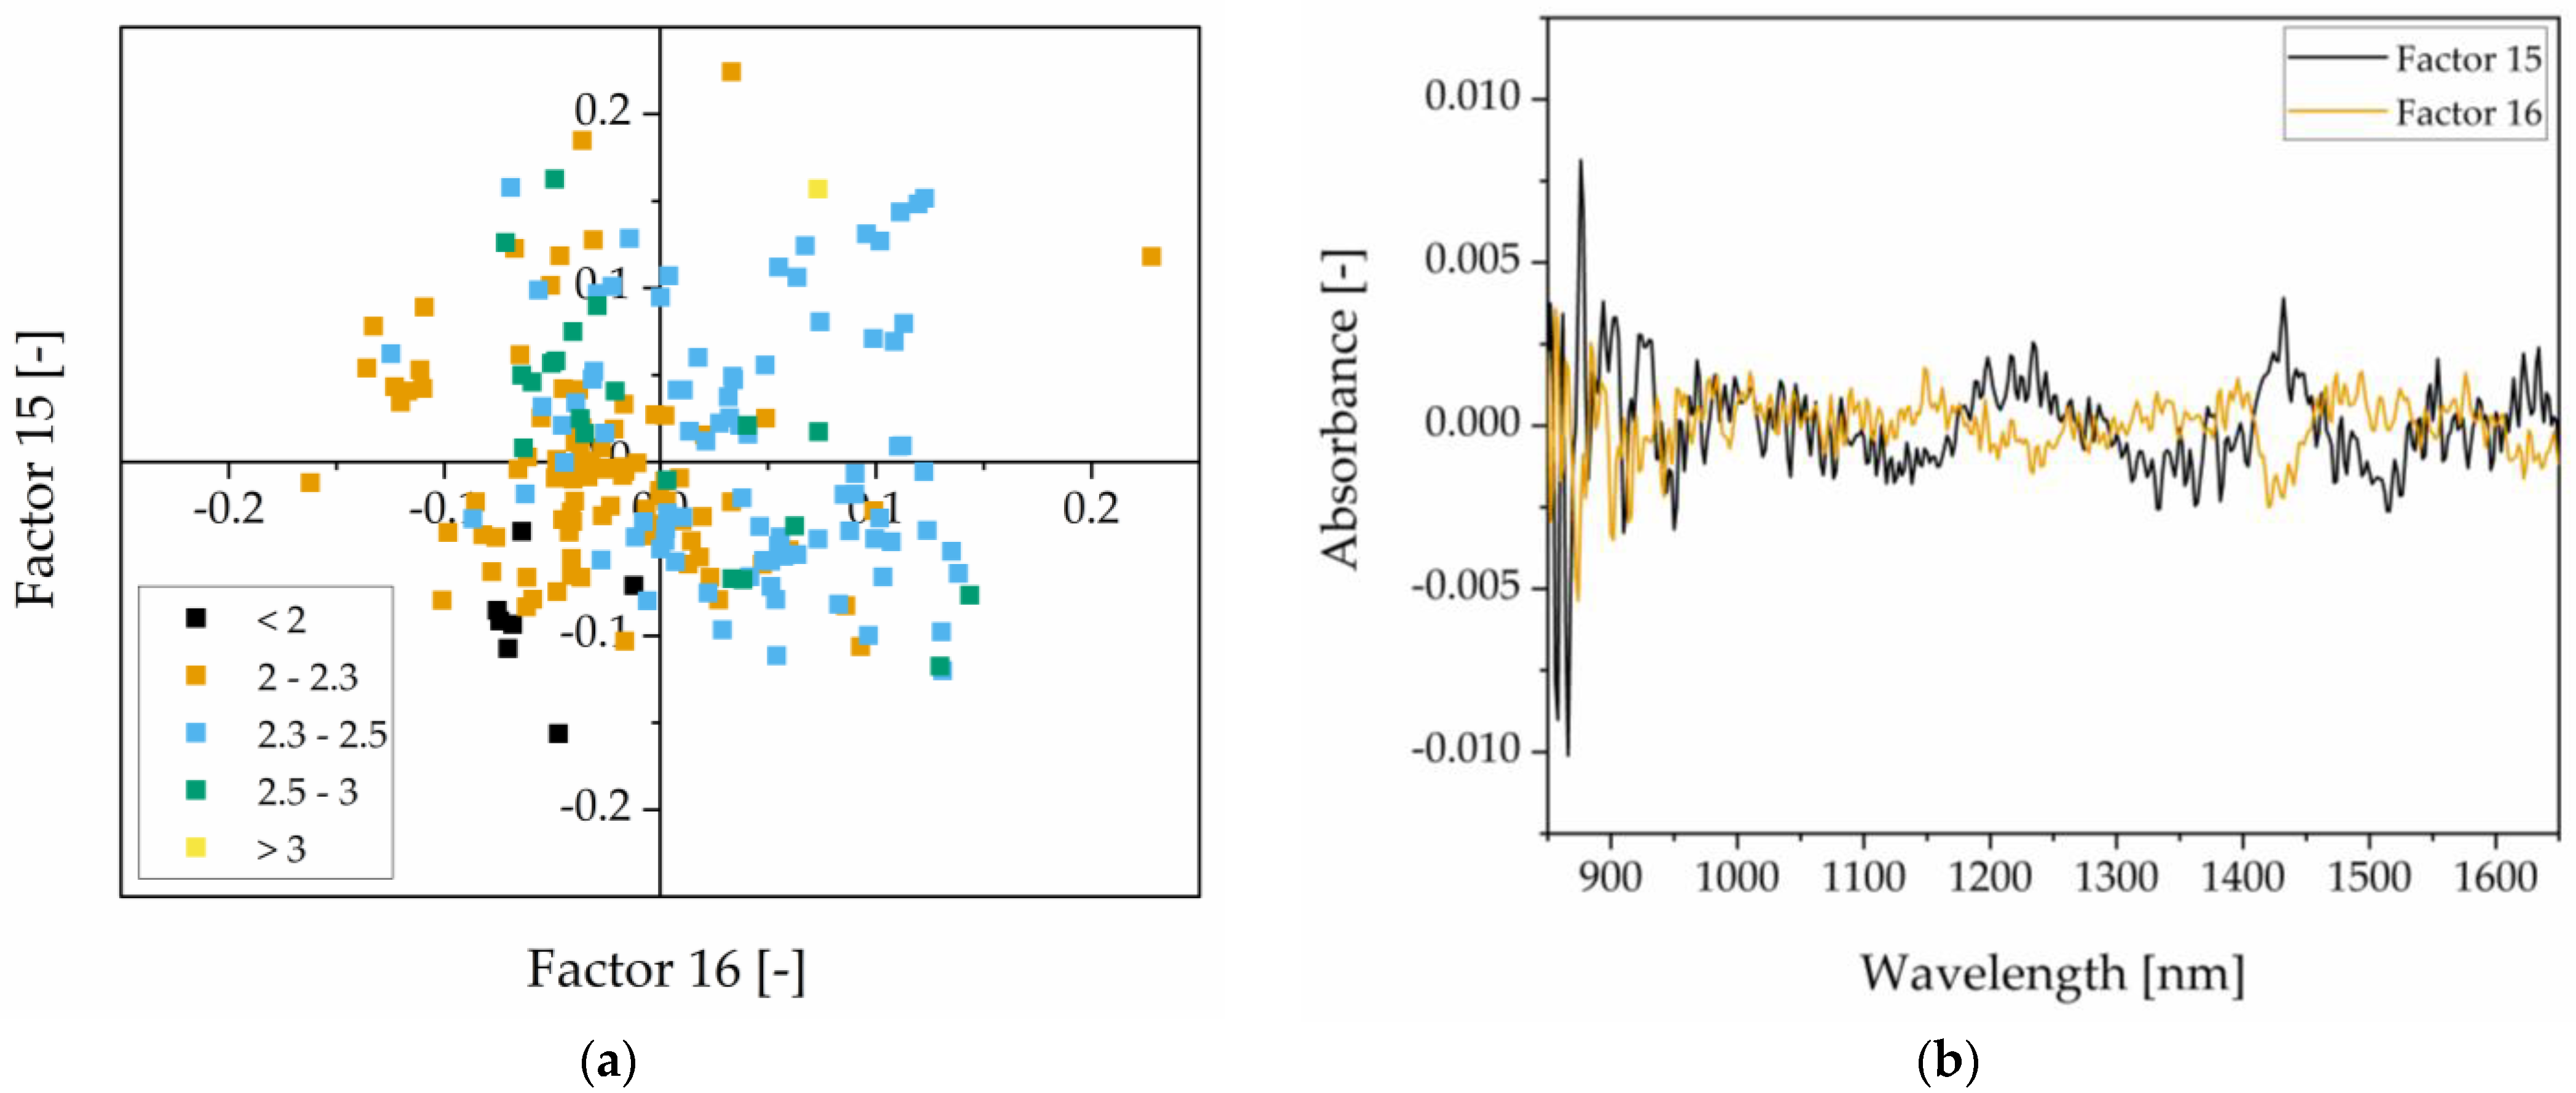
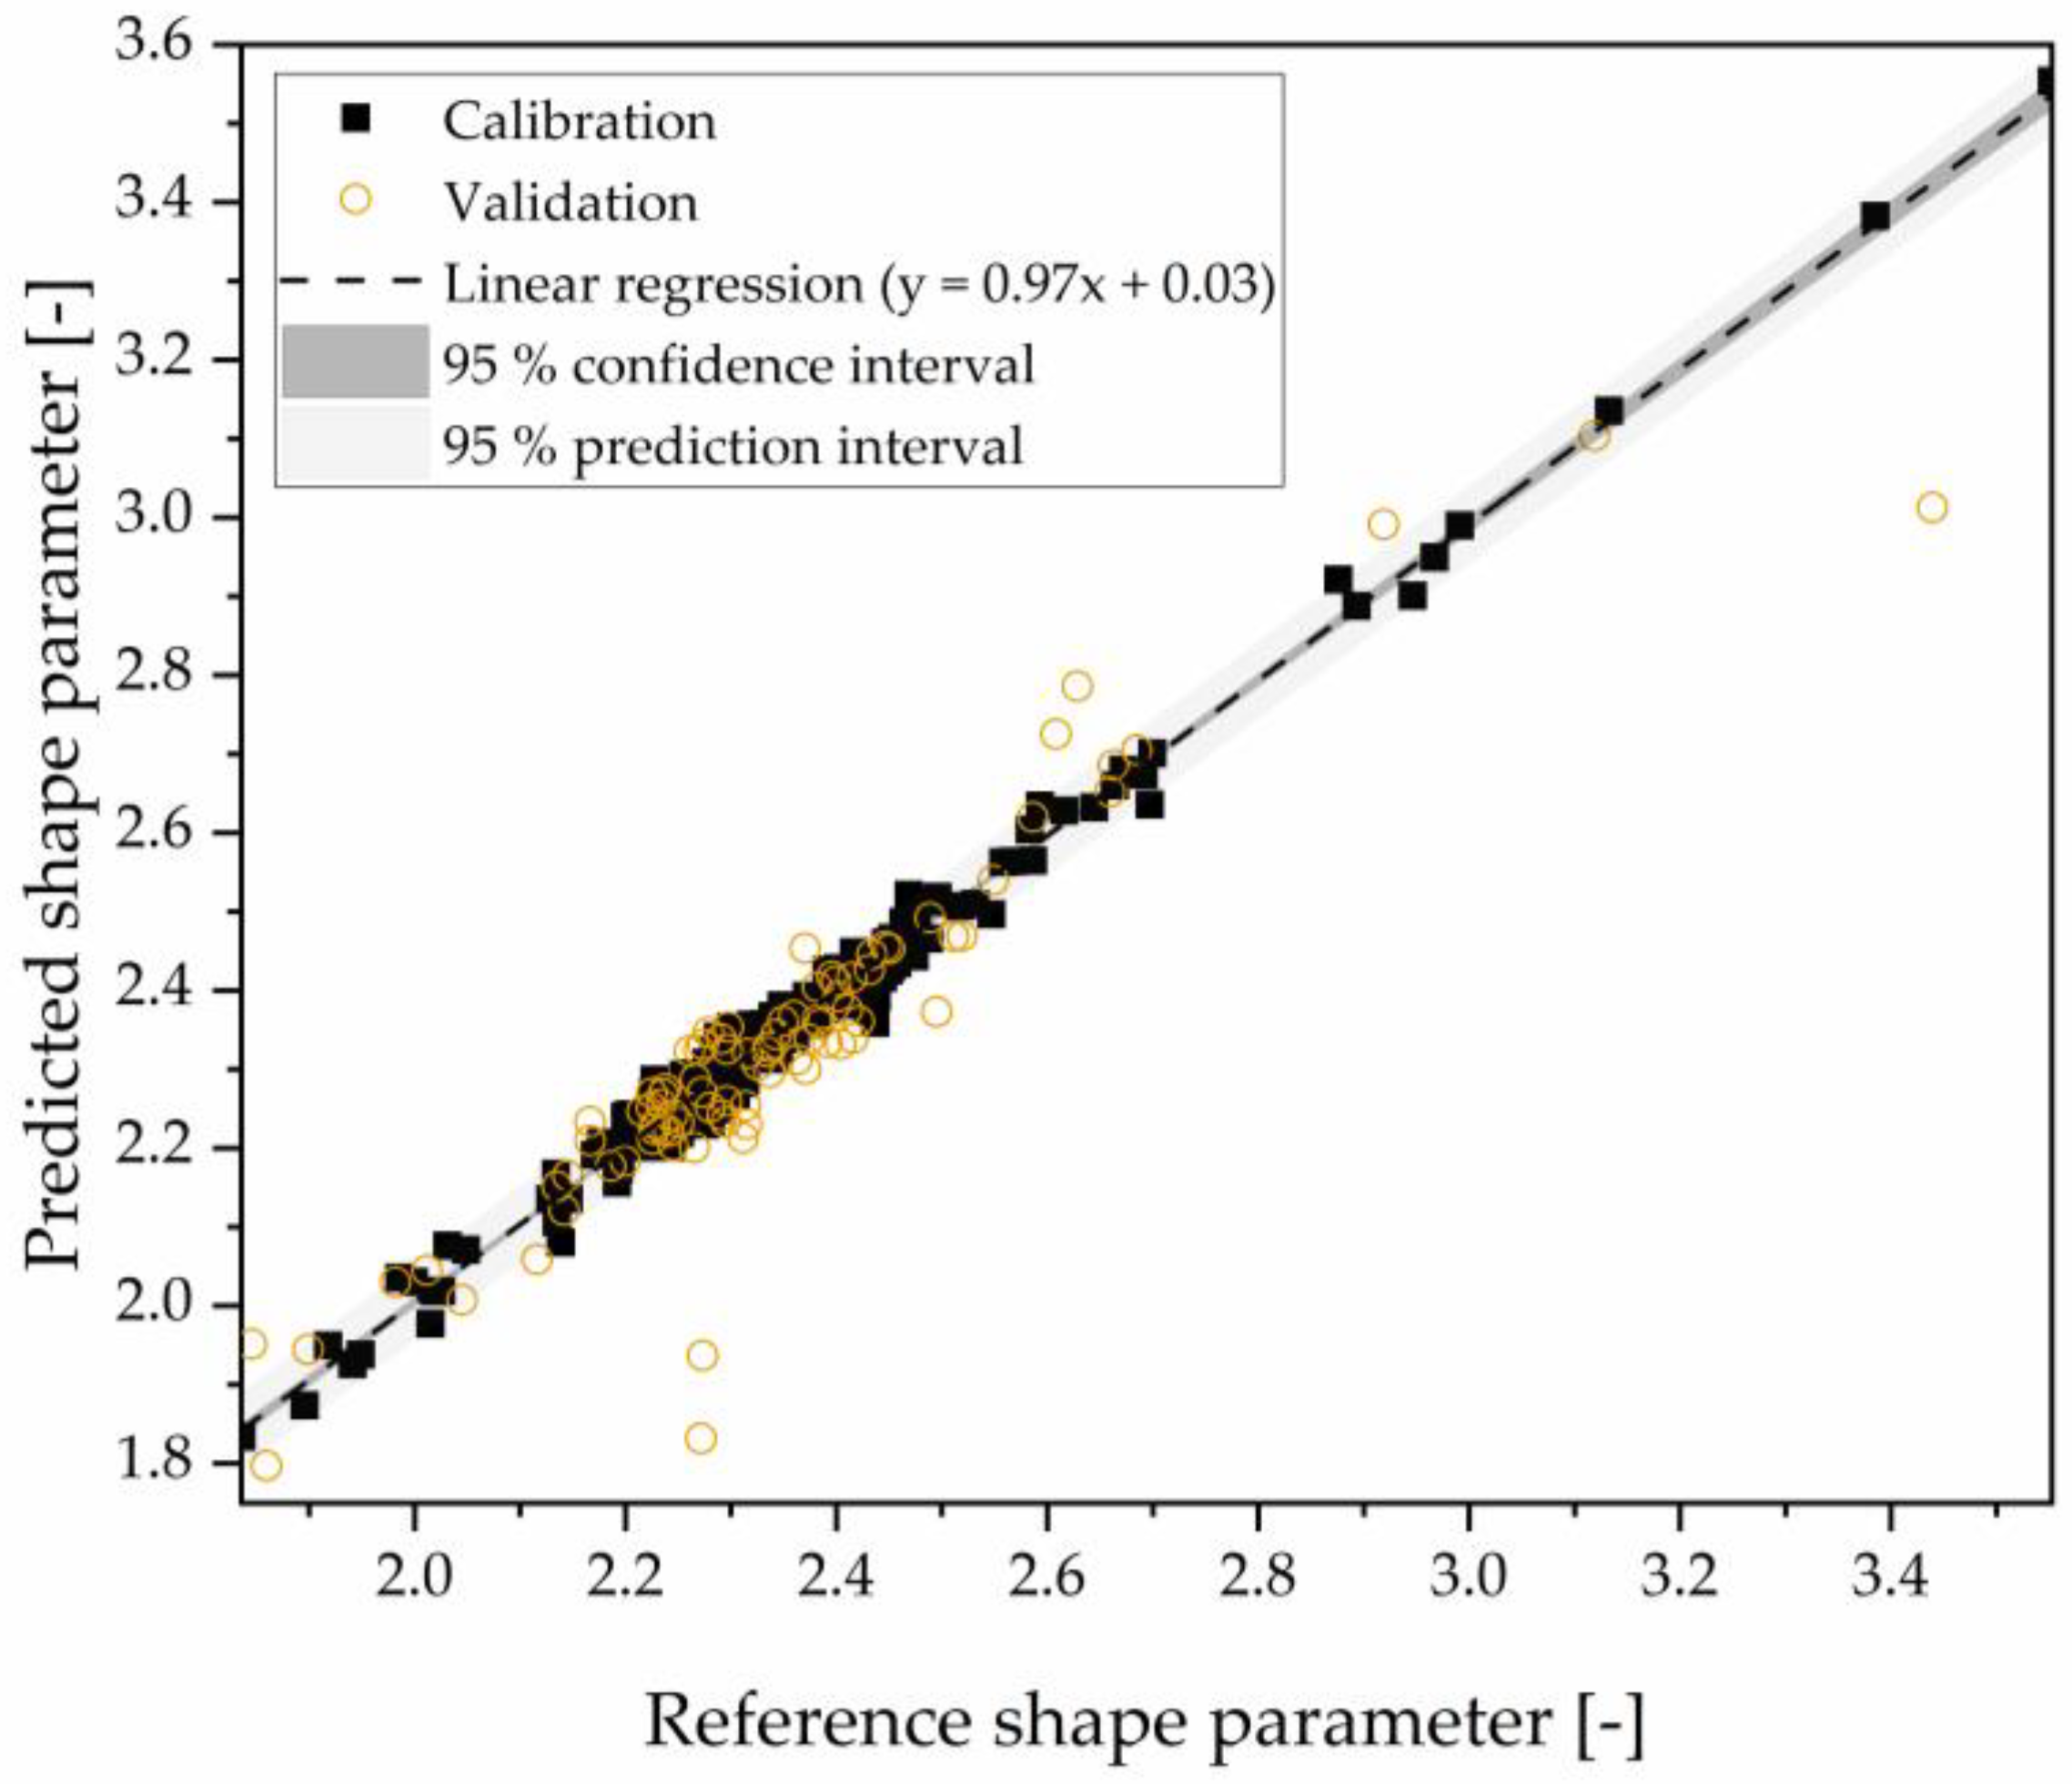
3.4. Calibration of Near-Infrared Spectra to Particle Size Distribution Using Rosin–Rammler Fit

Analogous to the moisture content, the aim was to estimate the particle size within the fluidized bed using the scattered light data from the NIR spectra. Instead of basing the model on the particle sizes measured externally in the laboratory, the model was based on the cumulative distribution curves obtained in-line using the IPP probe. The advantage of this approach is that the process can be continuously reflected and a higher number of samples can be analyzed over time with varying process parameters. Further, the acquisition of the particle size is less complex compared to a subsequent laboratory analysis, as no samples need to be taken. However, it should be noted that the in-line measurement method also deviates from the laboratory results. This deviation is attributed to the different measurement principles as well as the limitations for the lower particle sizes. The measuring position within the fluidized bed may also lead to a non-representative sampling of the particles. The use of a single, non-invasive probe to simultaneously obtain information about both, the moisture and particle size distribution of the sample, holds potential by indicating the success of the agglomeration in real time.
The selected number of factors and the corresponding statistical parameters for the different pre-processing techniques are listed in Table 3. The algorithm suggests no pre-processing and 15 factors. Alternatively, the second derivative with 17 factors could be considered but was excluded here as the model did not show an improvement in the prediction.
The scores and loadings for factors 8 and 9 of the PLS model are evaluated as an example. For those two factors, the scale parameter is lowest with negative score values and increases with increasing score values, which is indicated via 4 differently colored groups (Figure 10a). However, no explicit separation is possible with only two factors. Regarding the loadings, a clear peak over both factors was not noticeable and opposing trends per wavelength can be seen (Figure 10b).
The resulting prediction from the PLS with 15 factors and no pre-processing is compared with the measured values (Figure 11). The scale parameter x in µm is shown and fitted well between 60 and 210 µm. The precision of the fit is represented by an R² value of 0.96 and an RMSE of 8.18. The maximum deviation of the validation set predictions was 24 µm or 16% of the data spread of 150 µm. This indicates that the model is able to make reliable predictions.
The same procedure was followed for the shape parameters n in a range between 1.8 and 3.1. Different pre-processing techniques were compared according to multivariate statistics and the raw spectra with 17 factors, and an R² of 0.92 and an RMSE of 0.06 were suggested by the algorithm (Table 4). The maximum deviation of the validation set predictions was 0.34 or 20% of the data spread of 1.7 µm. The particle size distribution and the resulting fluidization behavior can lead to a changed scattering effect due to changes in the amount and direction of the reflected light. This change results mainly in baseline shifting and noise [31]. As the principle of pre-processing is to reduce the noise and the baseline shift from the spectral data, the information about the particle size is only present in the models without any pre-processing or those without baseline correction.
The scores for factors 15 and 16 are illustrated as an example, grouped by shape parameters via different colors (Figure 12a). The smaller shape parameters < 2 are located in the third quadrant with negative score values for both factors, while the bigger shape parameters > 3 are present in the first quadrant with positive score values. However, no separation in the factor space is possible via two factors. The loadings show no clear peaks and high noise for the lower wavelengths (Figure 12b).
The predicted shape parameter is plotted over the reference shape parameter for the calibration and validation data sets with linear regression and corresponding 95% confidence and prediction intervals (Figure 13). The evaluated range represents similar particle size distributions and shows a lower data density with shape parameters above 2.7. For robust prediction, the extension of the model is necessary.
The model building methodology employed in this study was successful, as it allowed for the fitting of the particle size distribution not only through a single parameter, such as the median particle diameter [32], but also by approximating the entire distribution curve using a Rosin–Rammler fit. The model is able to predict the particle size distribution in application from the raw spectra with 15 and 17 factors, as demonstrated by the results in Figure 11 and Figure 13. The high number of factors needed was expected because physical information about the particle size distribution and morphology can be found in the baseline offset and noise across the entire spectrum [27,31]. In contrast, Higgins et al. [33] were able to predict the d 90 in an online milling process with one factor, as their samples had a broad size range but did not differ in chemical composition. This emphasizes the influence of the particle morphology on the spectrum [27]. In the literature, different effects of the particle size distribution on the spectral data are observed, but additional investigation of the underlying principle is required, especially regarding the influence of the particle morphology. Further, an effect of particle movement in the fluidized bed on the NIR signal cannot be excluded.

4. Conclusions

This study analyzed the spray drying process with forced agglomeration in an integrated fluidized bed in terms of the nozzle type and key influencing factors such as the binder rate, fluidization velocity, and temperature. These factors were varied to examine their effect on the particle moisture and size. The NIR sensor calibration allowed to determine the moisture content with an RMSE of 0.33%, although the CM sensor calibration was insufficient. It is currently believed that the primary effect seen in CM measurements is due to changes in cohesion, resulting in changes in fluidization patterns. Further investigation and validation of these assumptions is necessary to ensure the accuracy and effectiveness of this approach. Surprisingly, the non-invasive NIR sensor enabled the prediction of the particle size distribution with scale and shape parameters of the Rosin–Rammler fit. The use of a multi-sensor approach as a tool for the very early detection of system changes is a promising concept with enormous potential for improving quality control by checking for unexpected deviations in the sensor data. Regarding the process integration, this approach is particularly useful in knife-edge process situations where even small changes in the system may have a significant impact on the product quality or process stability. However, to fully realize the potential of this method, it will be necessary to conduct more detailed analyses of a broader range of systems.

Author Contributions

Conceptualization, J.F., T.V.R. and R.K.; methodology, J.F. and T.V.R.; software, J.F.; validation, L.G.; formal analysis, J.F., T.V.R. and L.G.; investigation, J.F., T.V.R. and L.G.; resources, R.K.; data curation, J.F. and T.V.R.; writing—original draft preparation, J.F., T.V.R. and L.G.; writing—review and editing, J.F., T.V.R. and R.K.; visualization, J.F. and T.V.R.; supervision, J.F., T.V.R. and R.K.; project administration, J.F. and T.V.R.; funding acquisition, R.K. All authors have read and agreed to the published version of the manuscript.

Funding

This IGF project 20952 N of the FEI was supported within the program for promoting the Industrial Collective Research (IGF) of the German Ministry of Economics and Climate Action (BMWK), based on resolution of the German parliament.

Data Availability Statement

The data presented in this study are available on request from the corresponding authors.

Conflicts of Interest

The authors declare no conflict of interest.

Abbreviations

ALRAir-to-liquid ratio
biasSystematic error
CCalibration
CMCapacitance measurement
D 3 , 2 Sauter mean diameter, µm
d 50 , 3 Median particle diameter, µm
DoEDesign of experiments
IPPIn-line particle probe
MSCMultiplicative scattering correction
n Shape parameter
NIRNear-infrared
PPrediction
PLSPartial least squares
rPearson’s correlation coefficient
R2Coefficient of determination
RMSERoot mean square error
SEStandard error
SMPSkim milk powder
SNVStandard normal variate
SpanWidth of distribution
VValidation
w.b.Wet basis
x Scale parameter, µm

References

  1. Encyclopedia of Food and Health, 3rd ed.; Caballero, B.; Finglas, P.M.; Toldrá, F. (Eds.) Elsevier Academic Press: Amsterdam, The Netherlands, 2016; ISBN 9780123849472. [Google Scholar]
  2. Kessler, H.-G. Lebensmittel- und Bioverfahrenstechnik: Molkereitechnologie, 4th ed.; A. Kessler: München, Germany, 2006; ISBN 3-9802378-4-2. [Google Scholar]
  3. Modern Drying Technology: Volume 3: Product Quality and Formulation; Tsotsas, E.; Mujumdar, A.S. (Eds.) Wiley-VCH: Weinheim, Germany, 2007; ISBN 978-3-527-31558-1. [Google Scholar]
  4. Turchiuli, C.; Gianfrancesco, A.; Palzer, S.; Dumoulin, E. Evolution of particle properties during spray drying in relation with stickiness and agglomeration control. Powder Technol. 2011, 208, 433–440. [Google Scholar] [CrossRef]
  5. Palzer, S. Agglomeration of pharmaceutical, detergent, chemical and food powders—Similarities and differences of materials and processes. Powder Technol. 2011, 206, 2–17. [Google Scholar] [CrossRef]
  6. Williams, A.M. Instant Milk Powder Production: Determining the Extent of Agglomeration. Ph.D. Thesis, Massey University, Palmerston North, New Zealand, 2007. [Google Scholar]
  7. Písecký, J. Handbook of Milk Powder Manufacture; GEA Process Engineering A/S: Copenhagen, Denmark, 2012; ISBN 87-87036-74-6. [Google Scholar]
  8. Bück, A.; Tsotsas, E. Agglomeration. In Encyclopedia of Food and Health; Caballero, B., Toldrá, F., Finglas, P.M., Eds.; Elsevier Science: Burlington, UK, 2015; pp. 73–81. ISBN 9780123849533. [Google Scholar]
  9. Schwartzbach, C.; Masters, K. Perfomance of spray dryer with integrated filter and fluid bed. Dry. Technol. 2001, 19, 1909–1923. [Google Scholar] [CrossRef]
  10. Jones, D.M. Factors to consider in fluid-bed processing. Pharm. Technol. 1985, 9, 50–55. [Google Scholar]
  11. Demers, A.-M.; Gosselin, R.; Simard, J.-S.; Abatzoglou, N. In-line near infrared spectroscopy monitoring of pharmaceutical powder moisture in a fluidised bed dryer: An efficient methodology for chemometric model development. Can. J. Chem. Eng. 2012, 90, 299–303. [Google Scholar] [CrossRef]
  12. Fischer, C.; Jaskulski, M.; Tsotsas, E. Inline method of droplet and particle size distribution analysis in dilute disperse systems. Adv. Powder Technol. 2017, 28, 2820–2829. [Google Scholar] [CrossRef]
  13. Burggraeve, A.; Silva, A.F.T.; van den Kerkhof, T.; Hellings, M.; Vervaet, C.; Remon, J.P.; Vander Heyden, Y.; de Beer, T. Development of a fluid bed granulation process control strategy based on real-time process and product measurements. Talanta 2012, 100, 293–302. [Google Scholar] [CrossRef] [Green Version]
  14. Frake, P.; Greenhalgh, D.; Grierson, S.M.; Hempenstall, J.M.; Rudd, D.R. Process control and end-point determination of a fluid bed granulation by application of near infra-red spectroscopy. Int. J. Pharm. 1997, 151, 75–80. [Google Scholar] [CrossRef]
  15. Hede, P.D.; Bach, P.; Jensen, A.D. Top-spray fluid bed coating: Scale-up in terms of relative droplet size and drying force. Powder Technol. 2008, 184, 318–332. [Google Scholar] [CrossRef]
  16. Fröhlich, J.A.; Ruprecht, N.A.; Hinrichs, J.; Kohlus, R. Nozzle zone agglomeration in spray dryers: Effect of powder addition on particle coalescence. Powder Technol. 2020, 374, 223–232. [Google Scholar] [CrossRef]
  17. Qurthobi, A.; Iskandar, R.F.; Krisnatal, A.; Weldzikarvina. Design of capacitive sensor for water level measurement. J. Phys. Conf. Ser. 2016, 776, 12118. [Google Scholar] [CrossRef] [Green Version]
  18. Petrak, D.; Dietrich, S.; Eckardt, G.; Köhler, M. In-line particle sizing for real-time process control by fibre-optical spatial filtering technique (SFT). Adv. Powder Technol. 2011, 22, 203–208. [Google Scholar] [CrossRef]
  19. Stieß, M. Mechanische Verfahrenstechnik—Partikeltechnologie 1; Springer: Berlin/Heidelberg, Germany, 2009; ISBN 978-3-540-32551-2. [Google Scholar]
  20. Isengard, H.-D.; Haschka, E.; Merkh, G. Development of a method for water determination in lactose. Food Chem. 2012, 132, 1660–1663. [Google Scholar] [CrossRef]
  21. Fröhlich, J.A.; Raiber, T.V.; Hinrichs, J.; Kohlus, R. Nozzle zone agglomeration in spray dryers: Influence of total solid content on agglomerate properties. Powder Technol. 2021, 390, 292–302. [Google Scholar] [CrossRef]
  22. Silalai, N.; Roos, Y.H. Roles of water and solids composition in the control of glass transition and stickiness of milk powders. J. Food Sci. 2010, 75, E285–E296. [Google Scholar] [CrossRef]
  23. Kupfer, K. Materialfeuchtemessung: Grundlagen, Messverfahren, Applikationen, Normen: Mit 19 Tabellen und 386 Literaturstellen; Expert-Verlag: Renningen-Malmsheim, Germany, 1997; ISBN 3816913598. [Google Scholar]
  24. Kormann, G. Untersuchungen Zur Integration Kontinuierlich Arbeitender Feuchtemeßsysteme in Ausgewählte Futtererntemaschinen. Ph.D. Thesis, Technische Universität München, Freising-Weihenstephan, Munich, Germany, 2001. Available online: https://mediatum.ub.tum.de/doc/820167/document.pdf (accessed on 22 June 2023).
  25. Li, C.; Zhang, X.; Meng, M.; Li, B.; Li, C. Capacitive Online Corn Moisture Content Sensor Considering Porosity Distributions: Modeling, Design, and Experiments. Appl. Sci. 2021, 11, 7655. [Google Scholar] [CrossRef]
  26. Frank, J.; Schlitter, M.; Hinrichs, J.; Kohlus, R. Fluidized bed drying of dairy gel granules supported by in-line monitoring of the water content. Dry. Technol. 2023, 1–11. [Google Scholar] [CrossRef]
  27. Schouten, J.C.; Vander Stappen, M.L.M.; Van den Bleek, C.M. Scale-up of chaotic fluidized bed hydrodynamics. Chem. Eng. Sci. 1996, 51, 1991–2000. [Google Scholar] [CrossRef] [Green Version]
  28. Maltesen, M.J.; van de Weert, M.; Grohganz, H. Design of experiments-based monitoring of critical quality attributes for the spray-drying process of insulin by NIR spectroscopy. AAPS PharmSciTech 2012, 13, 747–755. [Google Scholar] [CrossRef] [Green Version]
  29. Wang, C.; Reis, M.G.; Waterhouse, G.I.; Hemar, Y.; Reis, M.M. Prediction of dairy powder functionality attributes using diffuse reflectance in the visible and near infrared (Vis-NIR) region. Int. Dairy J. 2021, 117, 104981. [Google Scholar] [CrossRef]
  30. Aoki, H.; Hattori, Y.; Sasaki, T.; Otsuka, M. Comparative study on the real-time monitoring of a fluid bed drying process of extruded granules using near-infrared spectroscopy and audible acoustic emission. Int. J. Pharm. 2022, 619, 121689. [Google Scholar] [CrossRef] [PubMed]
  31. Kessler, W. Multivariate Datenanalyse: Für die Pharma-, Bio- und Prozessanalytik; Wiley-Blackwell: Weinheim, Germany, 2007; ISBN 978-3-527-31262-7. [Google Scholar]
  32. Rantanen, J.; Yliruusi, J. Determination of Particle Size in a Fluidized Bed Granulator with a Near Infrared Set-up. Pharm. Pharmacol. Commun. 1998, 4, 73–75. [Google Scholar]
  33. Higgins, J.P.; Arrivo, S.M.; Thurau, G.; Green, R.L.; Bowen, W.; Lange, A.; Templeton, A.C.; Thomas, D.L.; Reed, R.A. Spectroscopic approach for on-line monitoring of particle size during the processing of pharmaceutical nanoparticles. Anal. Chem. 2003, 75, 1777–1785. [Google Scholar] [CrossRef] [PubMed]
Figure 1. Spray-through agglomeration system with an integrated NIR, CM, or IPP sensor.
Processes 11 01931 g001
Figure 2. Excerpt from the experimental design used in this study. Green squares: full factorial DoE. Blue circles: systematic extension for calibration.
Processes 11 01931 g002
Figure 3. Particle size distributions of the reference (center) trial under the same process conditions with different nozzles used. The central experimental parameters were a fluidized bed temperature of 80 °C, fluidization rate of 0.8 m s−1, and no binding agent.
Processes 11 01931 g003
Figure 4. Boxplot of particle moisture as a function of binder addition. Evaluated are all experiments from the DoE, classified by spray rate.
Processes 11 01931 g004
Figure 5. Contour plot of predicted moisture as a function of process conditions. Nozzle type is set to average and fluidization velocity to the reference condition (0.8 m s−1).
Processes 11 01931 g005
Figure 6. Linear regression of the offline measurement data from the capacitive moisture sensor to the bulk density.
Processes 11 01931 g006
Figure 7. Sensor responses over time for the CM sensor. The 60 s intervals of the pneumatic hammers are reflected in the sensor signal.
Processes 11 01931 g007
Figure 8. Selection of (a) the scores and (b) the loadings of factors 3 and 6 for prediction of the moisture content via PLS regression. The region indicated in green between 1350 and 1400 nm correlates with the second overtone of the CH2 and CH3 group, while the region indicated in blue between 1400 and 1500 nm correlates with the second overtone of the OH, CH, and CH2 group.
Processes 11 01931 g008
Figure 9. Reference compared to the predicted water contents for calibration and validation data sets (80 samples) with linear regression.
Processes 11 01931 g009
Figure 10. Selection of (a) the scores and (b) the loadings of factors 8 and 9 for prediction of the scale parameters via PLS regression.
Processes 11 01931 g010
Figure 11. Reference compared to the predicted scale parameter x for calibration and validation data sets (294 samples) with linear regression.
Processes 11 01931 g011
Figure 12. Selection of (a) the scores and (b) the loadings of factors 15 and 16 for prediction of the shape parameter via PLS regression.
Processes 11 01931 g012
Figure 13. Reference compared to the predicted shape parameter n for calibration and validation data set (294 samples) with linear regression.
Processes 11 01931 g013
Table 1. Correlation matrix of the investigated DoE responses.
Water
Activity
D 3 , 2 x Scale
Parameter
n Shape
Parameter
CM OfflineCM
In-Line
Moisture0.920 **0.596 *0.592 *−0.650 *0.170−0.403
Bulk density−0.1820.070−0.2890.2160.520 *0.968 **
Note: *: moderate correlation, **: strong correlation.
Table 2. Comparison of different pre-processing techniques and the number of factors included in the PLS model.
Pre-
Processing
No. of FactorsR² (C)R² (V)RMSECRMSEPSECSEPBias
None20.300.311.171.161.181.192 × 10−16
Smoothing20.300.301.171.161.181.19−4 × 10⁻¹⁶
Detrending30.750.690.700.780.700.805 × 10−16
SNV80.940.830.330.580.330.59−3 × 10⁻¹⁵
1st derivative50.810.710.620.750.620.767 × 10−16
2nd derivative40.750.650.700.830.700.859 × 10−16
MSC80.950.810.330.610.330.62−3 × 10⁻¹⁴
Table 3. Comparison of different pre-processing techniques and the number of factors included in the PLS model.
Pre-
Processing
No. of FactorsR² (C)R² (V)RMSECRMSEPSECSEPBias
None150.960.948.189.638.209.689 × 10−13
Smoothing130.920.9210.9410.6910.9610.764 × 10−13
Detrending120.940.9310.0910.099.8610.141 × 10−13
SNV30.330.3231.7931.7934.3831.973 × 10−15
1st derivative140.940.939.629.629.549.683 × 10−14
2nd derivative170.940.849.129.127.829.174 × 10−14
MSC120.900.9012.4012.4011.7612.47−9 × 10⁻¹³
Table 4. Comparison of different pre-processing techniques and the number of factors included in the PLS model.
Pre-
Processing
No. of FactorsR² (C)R² (V)RMSECRMSEPSECSEPBias
None170.920.890.060.070.060.07−6 × 10⁻¹⁵
Smoothing40.290.280.180.190.180.196 × 10−16
Detrending170.930.900.050.070.050.07−8 × 10⁻¹⁶
SNV20.220.240.190.190.190.20−2 × 10⁻¹⁶
1st derivative90.820.790.090.100.090.10−8 × 10⁻¹⁶
2nd derivative50.640.680.130.130.130.13−1 × 10⁻¹⁶
MSC20.320.270.170.190.180.196 × 10−16
Disclaimer/Publisher’s Note: The statements, opinions and data contained in all publications are solely those of the individual author(s) and contributor(s) and not of MDPI and/or the editor(s). MDPI and/or the editor(s) disclaim responsibility for any injury to people or property resulting from any ideas, methods, instructions or products referred to in the content.

