Abstract
Large-energy microseismic events, coal bursts, and other abnormal mine stress are often observed in spatial isolated island areas in the roof water-rich gob-side working face during mining operations. In view of this problem, numerical simulation and on-site microseismic monitoring are employed to study the advance abutment stress and strata fracture structure in the spatial island area formed by ‘roof drainage + goaf’ during mining and the method of eliminating the spatial island area. The results show that the lateral stress is distributed in a step-like pattern, and the drainage area and goaf are superimposed to form a high-stress space island area before the mining of the working face along the goaf. The distribution pattern of the advance abutment stress in the spatial island area changes from ‘C’ type to ‘S’ type during the mining process. The strata structure of the roof water-rich gob-side working face is either a single-peak arch or double-peak arch, and the arch peak corresponds to the boundary of the drainage area. The method of local hydraulic fracturing can eliminate the influence of spatial island areas and improve the safety of roof water-rich gob-side working face mining.
1. Introduction
Rock bursts are one of the dominant dynamic disasters that pose a serious threat to the safety of coal mine production [1,2]. The working face of an isolated island in an underground coal mine is an area of great importance for the prevention and control of rock bursts. A conventional island working face may include two, three, or four goafs [3,4,5]. Several scholars have studied the occurrence of dynamic disasters at the conventional isolated island working face.
Sun et al. [6] studied the influence of isolated island coal pillars of unequal width in coal seams #4–5 on the working face #08 of coal seam #9–15. They divided the impact dangerous area of the SIW (9–15) working face #08 and analyzed the evolution of advance stress during the mining process. They determined the critical width for coal pillar instability, and proposed monitoring and pressure relief measures for the SIW (9–15) working face #08.
Ma et al. [7] studied the spatial evolution law of the coal and rock stress field, plastic strain field, and crack field during the mining of the isolated island face 120,502 under close goaf in the Liuzhuang Coal Mine. The advance abutment pressure and vertical displacement of the roof in the overlapping section and non-coincident section of the 120,502 isolated island working face and upper goaf were measured in the field. The study provides support for the safe mining of the isolated island working face #120502 in the Liuzhuang Coal Mine.
Wen et al. [8] conducted a theoretical study on the overlying rock structure and stress distribution characteristics of the isolated island working face LW 10,304 of the Xinglongzhuang Coal Mine in China. They reported that prior to the mining of LW-10304, the overlying rock had a short “T” shape, and the stress increment was in the shape of a “saddle”.
The isolated island working face formed by different strata goaf or geological structures is called a spatial isolated island. It is also sometimes referred to as a similar isolated island or three-dimensional isolated island working face [9]. There has been some research conducted on the spatial island working face.
Cao et al. [10] investigated the dynamic participation of a fault slip in the rock burst occurrence in an island working face adjacent to a fault on one side and a goaf on the other side. They further performed a CT-based back analysis on the rock burst hazard of a working face with a dynamic early warning. Wang et al. [11] investigated the mine pressure manifestations of the quasi-island working face 220 formed by the mining of the diverged/converged working sections 3-2 and 4-2 of the Xiashijie Coal Mine in Tongchuan. They reported that the dynamic pressure manifestation of the working face was closely related to periodic weighting and roof activities.
The drainage in the water-rich area of the roof is similar to that of a liberated layer [12,13]. Extensive research has been conducted on rock bursts caused by drainage, with the main focus being on solid coal roadway driving, the mining of the first mining face, and the combined impact mechanism of a spatial isolated island and square [12,13,14,15,16,17,18]. However, there are scarcely any studies on the stress distribution and rock structure of the spatial isolated island working face with drainage area + goaf type. Thus, the present study aims to investigate the stress distribution characteristics of the spatial isolated island working face, especially the “C” type stress distribution in the isolated island area. The study further examines the special rock structure of the drainage spatial isolated island and the hydraulic fracturing reduction of the spatial isolated island effect. The main objective of the study is to provide support for the prevention and control of rock bursts in the roof water-rich working face along the goaf.
2. Engineering Background
The 2202 working face is a gob-side working face with an abnormal water-rich area in the roof of the mine in Shaanxi and Inner Mongolia. There have been frequent cases of coal bursts and high pressure along the empty side of the working face when mining operations were performed at 200 m–300 m. The layout of the working face, the location of the abnormal water-rich area, and the location of the abnormal pressure area are shown in Figure 1. The distribution of the aquifer and aquitard is shown in Figure 2.

Figure 1.
Spatial relationship of working face and abnormal pressure behavior [17].
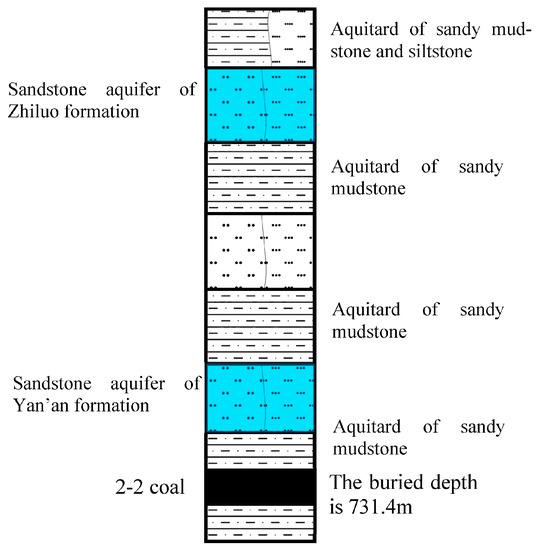
Figure 2.
Distribution of aquifer and aquitard.
The microseismic and coal stress monitoring is carried out, and the microseismic monitoring data and early warning for stress in the dynamically active area are analyzed during the mining operations at the working face. The relationship between microseismic monitoring data and mining distance is shown in Figure 3.
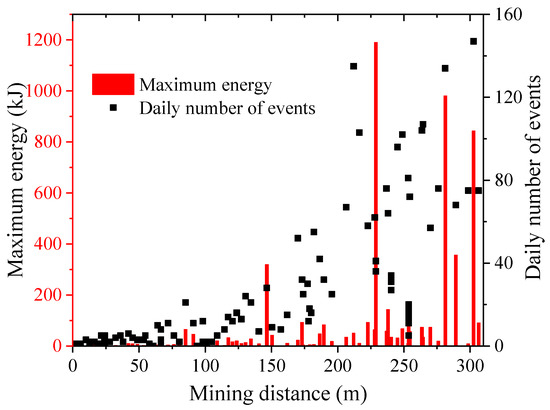
Figure 3.
Microseismic monitoring in dynamic showing area.
The maximum energy of microearthquakes in the dynamically active area is recorded as 8.43 × 10⁵–1.19 × 10⁶ J, which is much higher than the previous maximum value of 3.19 × 10⁵ J. The maximum daily frequency of microquakes is 134–147, which is again much higher than the previous maximum frequency of 52–55.
The early stress warning situation in the dynamically active area is as follows: yellow early warning mining distance (240.6 m, 314.2 m) and red early warning mining distance (218.9 m, 223.3 m, 244.2 m, 248.6 m, 249.0 m).
3. Influence of Roof Confined Water Drainage on Stress of Working Face along Goaf
The numerical simulation method is used to study the overall and local stress characteristics of the gob-side face before and during the mining operation in this section.
- (1)
- Numerical simulation model
The size of the numerical model is 840 m × 800 m × 150 m, as shown in Figure 4. The model parameters are shown in Table 1 and Table 2.
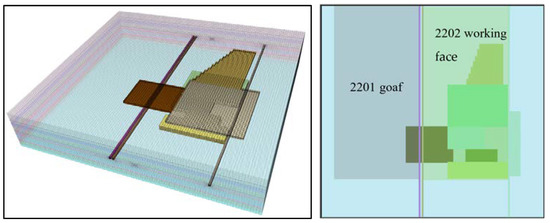
Figure 4.
Numerical simulation model of mining in roof drainage working face along goaf.

Table 1.
Physical and mechanical parameters of coal and rock mass.
Table 2.
Scale table of parameter adjustment for simulation of drainage area [19].
- (2)
- Stress characteristics of spatial isolated island before the mining of the gob-side working face
The drainage stress field and the lateral stress field in the goaf produce the drainage spatial isolated island, which has a significant impact on the highway along the goaf. The stresses in different positions in the numerical simulation are compared and analyzed.
According to the spatial relationship of the abnormal water-rich area in the 2201 goaf, the vertical stress extraction line is set up to extract the vertical stress value after driving along the 2202 auxiliary transport roadway. The horizontal monitoring lines are numbered y180, y240, y370, y450, and y650 along the Y-direction at distances of 180 m, 240 m, 370 m, 450 m, and 650 m. The vertical monitoring lines are numbered x450 and x500 along the X-direction at distances of 450 m and 500 m, as shown in Figure 5.
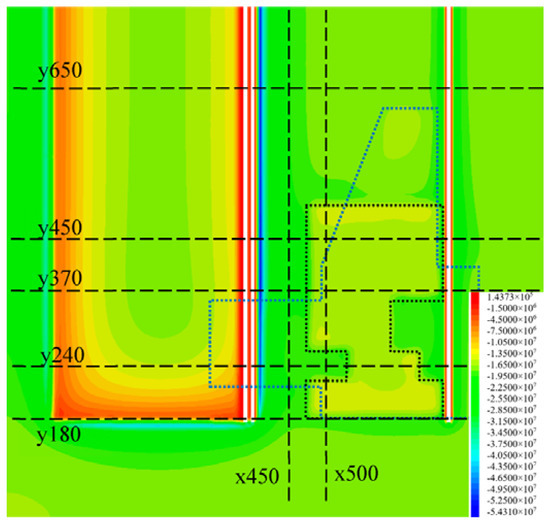
Figure 5.
Stress cloud map of spatial island.
The data from seven monitoring lines and seven profile lines in the same location without drainage are compared and analyzed to verify the existence of a spatial stress island. The data from the five monitoring lines in the Y-direction in the hydrophobic state are plotted in Figure 6, and the data from the two monitoring lines in the X-direction are drawn in Figure 7.
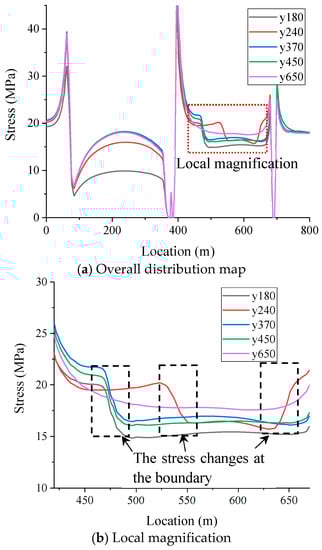
Figure 6.
Lateral stress distribution.
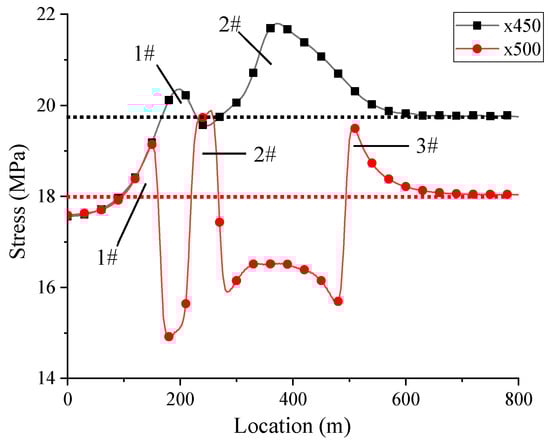
Figure 7.
Strike stress distribution.
As shown in Figure 6, five lateral stress lines are compared and analyzed, which marks the interaction area between the 2201 mined-out area and abnormal water-rich area drainage. There is an evident step distribution in the regions between 450 m and 550 m, as well as at 650 m. To properly depict the existence of spatial islands, the area from 450 m to 650 m is enlarged. The lateral distribution stress line y650 is not affected by the hydrophobicity of the abnormal water-rich area. The interaction between the water-rich abnormal area and the goaf results in the formation of the high-stress area, as indicated by the step stress line crossing through the y650 stress line. However, the majority of the y180 stress line is located below the y650 stress line due to the influence of the mining boundary of the 2201 goaf.
The influence of lateral stress varies due to the varying distance between x450, x550, and the 2201 goaf. The lateral stress at the x450 position is 19.8 MPa, as indicated using the black dotted line in Figure 7, and the lateral stress at the x500 position is 18.0 MPa, as indicated using the red dotted line in Figure 7.
The x450 survey line is affected by the superposition of the 2201 goaf and the abnormal water-rich area of the Zhiluo formation and Yan’an formation. Two peak values of 20.4 MPa and 21.8 MPa high stress are observed for the affected area of the abnormal water-rich area of the Yan’an formation. The difference in stress can be attributed to the fact that the influence width of the Yan’an formation is narrow, the total footage is less, and the superposition of the drainage area in the upper Zhiluo formation is weak. A low-stress area of 19.6 MPa is formed between the #1 and #2 high-stress areas under the influence of the depression boundary of the Yan’an formation.
The formation of three high-stress areas (#1, #2, and #3) along the x500 line is mainly affected by the drainage of the abnormal water-rich area of the Yan’an formation.
The interaction between the roof drainage and the stress field in the goaf is shown to generate the spatial island effect. The stress in the spatial island area is higher than that in the non-spatial island area at the same distance from the goaf.
- (3)
- Characteristics of advance abutment stress of spatial isolated island during the mining process
The spatial structure of the overlying rock in the gob-side working face is in the shape of an ‘S’. The evolution of advance abutment stress in the 2202 gob-side working face is analyzed using numerical simulation. The isoline maps of advance abutment stress before mining at distances of 90 m, 150 m, and 360 m from the working face are extracted, as shown in Figure 8.
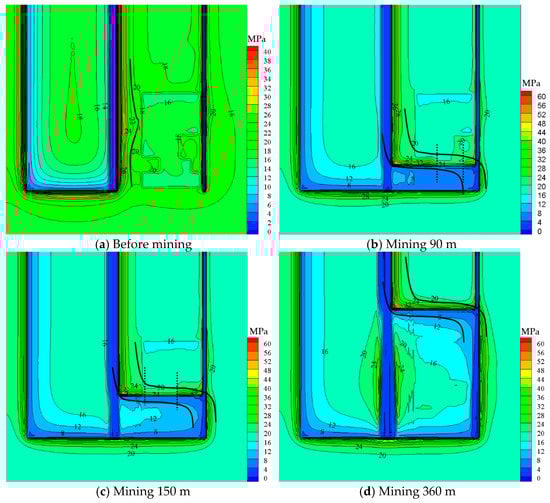
Figure 8.
Stress isoline map at different stages.
The drainage of the water-rich area of the roof has a distinct influence on the stress isoline of the affected zone. As indicated by the black solid line in Figure 8a, the isoline of the lateral stress in the drainage-affected area shifts to the drainage area before mining, which is evidently different from that in the parallel goaf of the non-drainage-affected area.
The distribution of the front and rear abutment pressure isolines of the working face resemble an ‘S-shaped’ distribution after mining, as indicated by the black solid line in Figure 8b–d. However, the ‘S-shaped’ stress isoline is clearly missing in the drainage area, as seen by the change in the two dotted lines in Figure 8b,c.
The stress isoline, such as 24 MPa, 23.5 Mpa, and 23 MPa in Figure 8c, shows a ‘C’ type distribution. The ‘C’ type stress isoline distribution corresponds to the ‘C’ type overburden spatial structure of the isolated island working face. The isoline of advance abutment stress in the “drainage area + goaf” type spatial island area for mining until 150 m and beyond is analyzed. The stress isoline distribution in the spatial island area is shown in Figure 9.
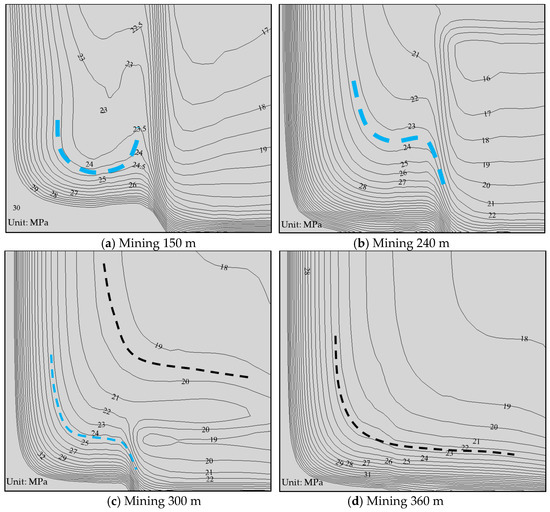
Figure 9.
Stress isoline map of drainage spatial island area.
The stress isoline distribution in the spatial isolated island area is closely related to the drainage influence degree of the water-rich area of the roof. The drainage influence degree is dependent on the distance between the working face and the boundary of the drainage area. Several stress contours in the advance abutment stress show a ‘C’ shaped distribution when the mining activities reach a distance of 150 m, as represented by the blue dotted line in Figure 9a. At this stage, the drainage area is the most affected, and the isoline of advance abutment stress is similar to that of the conventional isolated island face.
The boundary distance between the working face and the drainage area changes as the mining of the working face progresses. The influence of the roof drainage greatly varies, which is evidently reflected by the variation of the isoline of the advance stress. As indicated by the blue dotted line in Figure 9b, when the distance from the boundary of the drainage area decreases, the isoline of the advance stress exhibits an ‘S’ shaped distribution, and the protruding part on the right side of the curve becomes less noticeable. When the working face is close to the boundary of the drainage area, the isoline of the advance abutment stress again shows an ‘S’ shaped distribution. However, the outer part of the drainage zone shows a smooth ‘L’ shaped distribution, which is highlighted by blue and black dotted lines in Figure 9c. Once the working face is past the boundary of the drainage area, the isoline of the advance abutment stress takes the shape of a smooth ‘L’, as indicated by the black dotted line in Figure 9d.
4. Influence of Roof Confined Water Drainage on Overlying Rock Movement in Gob-Side Working Face
In this section, the influence of water-bearing strata drainage on the fracture structure of strata along the goaf is analyzed. The distribution of microseismic events in the working face along the goaf is analyzed. Thereby, the structural characteristics of the fracture in the roof of the drainage working face and the normal working face are compared and analyzed.
- (1)
- Monitoring and analysis of microseismic events in the gob-side working face without drainage area
The 6305 working face of an operational mine in Shandong Province is taken as the research area. The width of the working face is 262.40 m and the cumulative mining thickness is 9.51 m. The mining operations reached a distance of 170.10 m by the end of March. The distribution of the microseismic events recorded at the 6305 working face in March is shown in Figure 10. The distribution of microseismic events tends to exhibit two forms: an enveloping arched shape, as shown in Figure 10a–d, and a layered distribution with a noticeable boundary, as shown in Figure 10c,d,f.
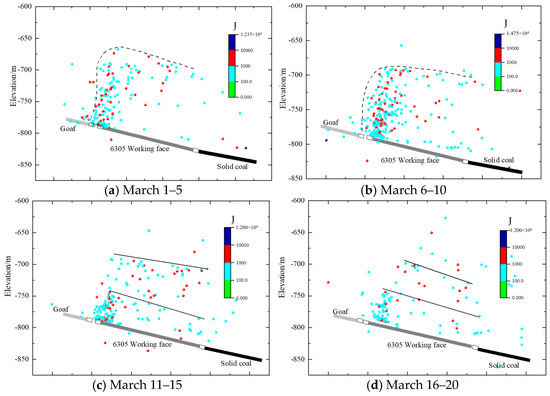
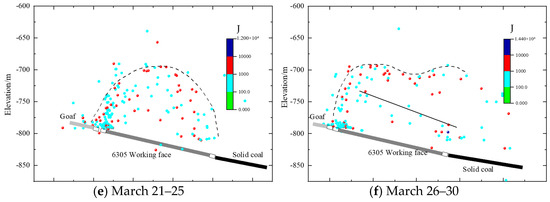
Figure 10.
Tilt direction projection of microseismic events in March [20].
The distribution height of microseismic events ranges between 100 m and 120 m. The boundary of the enveloping arch is smooth and can be categorized into two forms. One of the forms can be seen in Figure 10a,b,f, wherein the event density is high along the empty side and low along the solid coal side. Some key microseismic events are distributed above one side of the roadway along the goaf; thus, the distribution envelope for the lower roadway is not closed. The other form can be seen in Figure 10e. It can be seen from the figure that the distribution envelope on the side of the lower roadway is almost closed, forming a complete arch. Although the overall trend of the distribution of microseismic events is that the density is higher along the empty side and decreases successively towards the solid coal side, the variation range of the density is small.
The distribution of microseismic events has an obvious density boundary in the vertical direction. The first boundary is about 50 m above the roof, and the second boundary is 100 m–120 m above the roof. The difference in the energies of microseismic events between the first and second boundaries is about 103–104 J, which is relatively large considering the source energy, as shown in Figure 10c,d,f.
- (2)
- Microseismic monitoring analysis of gob-side working face with a drainage area
The mining progression in August was 0 m–45.2 m. The mining progression in September was 45.2 m–109.0 m. The mining progression in October was 109.0 m–236.8 m. The mining progression in November was 236.8 m–320.6 m. The microseismic events observed during the mining process from August to November are counted, and the tendency of the distribution of microseismic events is analyzed. Four profile lines are selected according to the mining distance, as shown in Figure 11: 1-1, 2-2, 3-3, and 4-4.
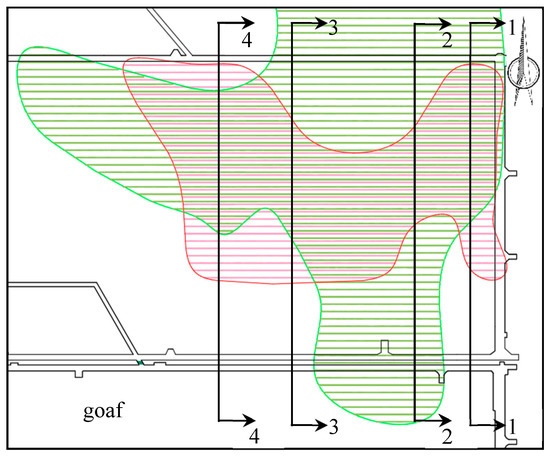
Figure 11.
The corresponding section position of the tilt direction distribution of microseismic events.
The distribution map of microseismic events observed in August, September, October, and November corresponds to profiles 1-1, 2-2, 3-3, and 4-4, respectively. The tendency of various distributions of the monthly microseismic event and the superposition of the corresponding profiles are shown in Figure 12.
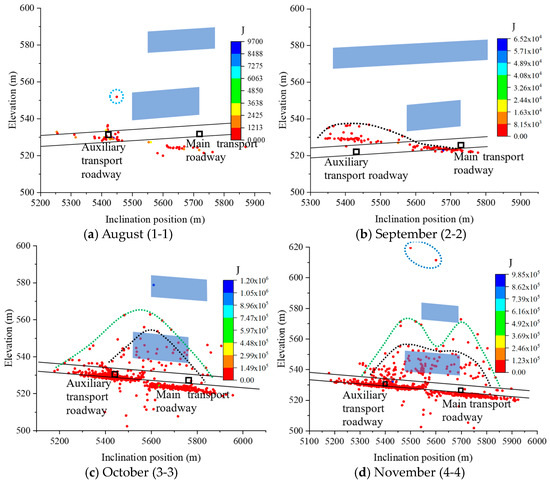
Figure 12.
Tilt direction distribution of monthly microseismic events in 2202 working face.
The two solid black lines in Figure 12 represent the coal seam (the location is determined on the basis of two roadways). The two blue translucent squares represent the drainage areas (the upper layer corresponds to the drainage area of the Zhiluo formation, while the lower layer is the drainage area of the Yan’an formation.). The dotted black, green, and blue lines represent the distribution trend lines of microseismic events.
As shown in Figure 12a, the microseismic events in August are distributed near the floor of the main transportation roadway and the auxiliary transportation roadway. Only one microseismic event was detected on the side roof of the auxiliary transport roadway, outside the drainage area, near the top of the water-rich strata of the Yan’an formation.
As shown in Figure 12b, the microseismic event is significantly affected by the drainage area of the Yan’an formation, and an arch distribution is formed at the roof of the coal seam outside the drainage area.
As shown in Figure 12c, the development height of microseismic events at the roof of the coal seam increases. It can be observed from the density of microseismic events that two arch structures are formed. One arch has a height of over 20 m, with its foot closer to the two grooves. The other arch has a height of more than 30 m and is outside the microseismic event. The vaults of the two arches are located below the left boundary of the drainage area of the Zhiluo formation.
As shown in Figure 12d, the micro-earthquake event altered the geometry of the arch structure, flattening the vault of the inner arch and giving rise to a saddle-shaped bimodal arch structure for the outer arch. The double peaks of the saddle arch structure are located at the two boundaries of the drainage area of the Zhiluo formation.
In general, there is a clear difference in the distribution of microseismic events in the gob-side working face with the drainage area and that without the drainage area. First, there is an evident decrease in the height of development; second, the distribution trend becomes irregular due to the influence of the distribution of drainage areas.
5. Regularized Water-Rich Area Method Based on Drainage Spatial Islands
- (1)
- Background of hydraulic fracturing that regularizes the abnormal water-rich area
The boundary stress distribution in the abnormal water-rich area is closely related to its shape based on the law of stress transfer after drainage in the water-rich abnormal area. The irregular occurrence of the abnormal water-rich area leads to the complexity of the stress state. The complicated stress condition of the mine impacted by drainage can be improved by taking action to alter the situation after drainage in the abnormal water-rich area.
- (2)
- Feasibility analysis of hydraulic fracturing in regularly occurring abnormal water-rich area
The hydraulic fracturing target strata can be divided into low hard strata and high hard strata. The construction sites include surface construction and underground drilling site construction. The borehole comprises both straight and horizontal holes [21]. Research on the implementation and effect of roof hydraulic fracturing is more mature.
The regularized hydraulic fracturing range for a water-rich abnormal area based on its distribution in a 2202 working face is 100 m (fracturing radius of 50 m). At present, the hydraulic fracturing range is more than 110 m [22], which meets the requirements of the fracturing range.
- (3)
- Hydraulic fracturing method for regularizing abnormal water-rich areas
In the roof hydraulic fracturing method, directional initial cracks are formed in the roof and are continuously injected with high-pressure water to make the cracks expand until the cracks are connected with the adjacent fracturing holes to achieve the purpose of destroying the integrity of the roof [23].
Roof hydraulic fracturing is carried out outside of the drainage area. A regular pressure relief protective layer is created between the drainage zone and the hydraulic fracturing zone, which reduces the static load of the fracturing zone and drainage boundary and weakens the fracture dynamic load of high strata. The fracturing area is shown in Figure 13.
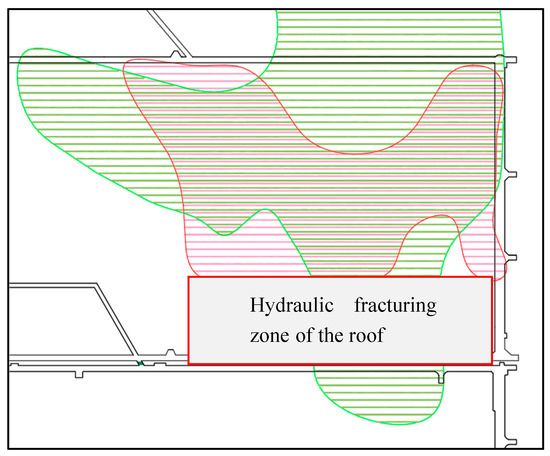
Figure 13.
Hydraulic fracturing area of outer roof of drainage zone [17].
- (4)
- Verification of numerical simulation of hydraulic fracturing outside the drainage area
The measures for hydraulic fracturing are adopted in the spatial isolated island area #1. The advance stress of hydraulic fracturing is compared with that without hydraulic fracturing based on the numerical simulation model of a spatial isolated island during mining. The effect of hydraulic fracturing outside the drainage area is verified.
The leading stress distribution in the mining process after hydraulic fracturing has distinct stages, as shown in Figure 14. There is a significant fluctuation zone in the stress distribution of coal outside the leading influence zone. Furthermore, the peak value of leading stress is low, and there is a jump at the boundary when mining under hydraulic fracturing and water-rich abnormal areas. To better analyze the difference in leading stress between the spatial isolated island group and hydraulic fracturing group, the relationship between the peak value of leading stress and advancing distance between the two groups is analyzed, as shown in Figure 15.
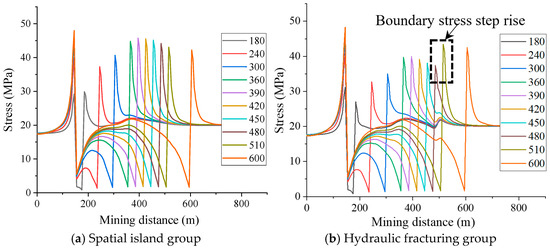
Figure 14.
Relationship between advance stress distribution and propulsion distance.
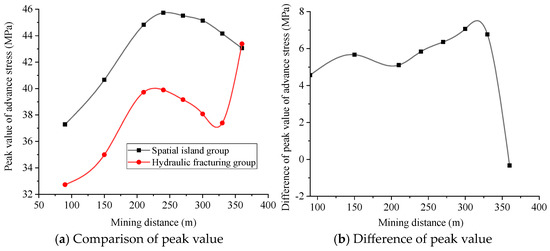
Figure 15.
Comparison of peak value of advance stress and propulsion distance.
As shown in Figure 15, the leading stress peak curves of the spatial isolated island group and the hydraulic fracturing group with varying advancing distances exhibit certain distinct rules when mining in the hydraulic fracturing zone. At the boundary of the hydraulic fracturing zone, the peak value of leading stress increases rapidly, reaching the peak value under the condition of the spatial isolated island.
When the working face is mined in the hydraulic fracturing zone, the peak value of leading stress is always low, reaching a value of 6 MPa, which is lower than that of the spatial isolated island. Hydraulic fracturing can effectively prevent the formation of spatial isolated islands and reduce the overall stress level of the roadway along the goaf.
6. Conclusions
The main conclusions of the study are as follows:
(1) The lateral stress of the gob-side working face exhibits a step-shaped distribution before the initiation of mining operations. The foundation stress of the isolated island area increases by 2.2 MPa. The advance stress in the isolated island area exhibits a ‘C’ shaped distribution. The stress distribution pattern then changes from ‘C’ to ‘S’, and finally to ‘L’ shaped as the influence of the roof drainage zone weakens.
(2) The roof drainage area changes the fracture shape of the smooth arched strata in the gob-side working face. The working face of the roof drainage area along the goaf has two kinds of rock strata fracture patterns: unimodal or bimodal. The vault of the broken enveloped arch of the rock stratum is located at the boundary of the drainage area.
(3) After hydraulic fracturing in the spatial isolated island area, the advance stress in the mining process reduces the leading stress to 6 MPa. Hydraulic fracturing reduces the overall stress level and the range of the high-stress area of the roadway along the goaf.
Author Contributions
Conceptualization, F.L. and Y.C.; methodology, Y.C.; software, F.L.; validation, X.Z. and F.L.; resources, X.Z.; data curation, D.L. and S.H.; writing—original draft preparation, F.L.; writing—review and editing, Y.C. All authors have read and agreed to the published version of the manuscript.
Funding
This research received no external funding.
Data Availability Statement
Not applicable.
Conflicts of Interest
The authors declare no conflict of interest.
References
- Zuo, J.; Song, H.; Jiang, Y.; Zhao, S.; Yu, M.; Li, L. Preliminary Discussion on Comprehensive Research Method for Rock Burst in Coal Mine Based on Newton’s Second Law. Shock Vib. 2020, 2020, 8861306. [Google Scholar] [CrossRef]
- Jiang, Y.; Zhao, Y.; Wang, H.; Zhu, J. A review of mechanism and prevention technologies of coal bumps in China. J. Rock Mech. Geotech. Eng. 2017, 9, 180–194. [Google Scholar] [CrossRef]
- Zhang, S.; Wang, X.; Fan, G.; Zhang, D.; Cui, J. Pillar size optimization design of isolated island panel gob-side entry driving in deep inclined coal seam—Case study of Pingmei No. 6 coal seam. J. Geophys. Eng. 2018, 15, 816–828. [Google Scholar] [CrossRef]
- Chen, Y.; Liu, C.; Liu, J.; Yang, P.; Lu, S. Case Study on Dynamic Identification of Overburden Fracture and Strong Mine Pressure Mechanism of Isolated Working Face Based on Microseismic Clustering. Sustainability 2023, 15, 436. [Google Scholar] [CrossRef]
- Guo, H.; Hu, J.; Qiu, L. Overburden behavour change and gas control of isolated working face of outburst coal seam. J. Xi’an Univ. Sci. Technol. 2022, 42, 227–236. [Google Scholar]
- Sun, B.; Zhu, S.; Jiang, F.; Wang, G. Mechanism and Safety Mining Technology of Overall Instability-Induced Rockbursts of Multi-Coal Seam Spatially Isolated Working Face. Math. Probl. Eng. 2022, 2022, 1038139. [Google Scholar] [CrossRef]
- Ma, S. Research on the Rock Pressure Behavior at Close-Distance Island Working Faces under Deep Goaf. Adv. Civ. Eng. 2021, 2021, 4714012. [Google Scholar] [CrossRef]
- Wen, Y.; Cao, A.; Guo, W.; Xue, C.; Lv, G.; Yan, X. Strata Movement and Mining-Induced Stress Identification for an Isolated Working Face Surrounded by Two Goafs. Energies 2023, 16, 2839. [Google Scholar] [CrossRef]
- Yang, W.; Wei, Q.; Qu, X.; Liu, W.; Zhang, J. Research on classification and application of isolated island working face based on burst prevention. J. Saf. Sci. Technol. 2018, 14, 107–113. [Google Scholar]
- Cao, A.; Wang, C.; Dou, L.; Li, Y.; Dong, J.; Gu, Y. Dynamic manifestation mechanism of mining on the island coalface along fault and dynamic pre-warning of seismic waves with seismic tomography. J. Min. Saf. Eng. 2017, 34, 411–417. [Google Scholar]
- Wang, S.; Jin, S. Analysis study on selective preference of recovery mining project for island-like working face. Coal Sci. Technol. 2021, 49, 9–16. [Google Scholar]
- Wang, B.; Jiang, F.; Zhu, S.; Zhang, X.; Shang, X.; Gu, Y.; Wu, Z. Investigating on the mechanism and prevention of rock burst induced by high intensity mining of drainage area in deep mines. J. China Coal Soc. 2020, 45, 3054–3064. [Google Scholar]
- Li, D.; Jiang, F.; Chen, Y.; Shu, C.; Tian, Z.; Wang, Y.; Wang, W. Mechanism of rockburst induced by “dynamic-static” stress effect in water-rich working face of deep well. Chin. J. Geotech. Eng. 2018, 40, 1714–1722. [Google Scholar]
- Shu, C.; Jiang, F.; Wang, B.; Du, X.; Wen, J. Mechanism and Treatment of Rock Burst on the Deep Working Face Induced by Drainage in Water-Rich Areas. Geotech. Geol. Eng. 2021, 39, 871–882. [Google Scholar] [CrossRef]
- Shu, C.; Jiang, F.; Wei, Q.; Wen, J.; Li, D.; Liu, X.; Zhang, X.; Zhang, Z.; Liu, C. Mechanism and treatment of rockburst inducedby drainage in roadways in deep coal mines. J. Min. Saf. Eng. 2018, 35, 780–786. [Google Scholar]
- Li, D.; Jiang, F.; Wang, C.; Tian, Z.; Wang, Y.; Liu, J. Study on the mechanism of rockburst induced by water inrush from deep. Chin. J. Rock Mech. Eng. 2018, 37, 4038–4046. [Google Scholar]
- Cheng, Y.; Li, F.; Zhang, X.; Li, G.; Xu, L. Mechanism and Control of Rockburst Induced by Draining Spatial Islands and Squaring. Geofluids 2022, 2022, 5633861. [Google Scholar] [CrossRef]
- Cheng, Y.; Li, F.; Zhang, X.; Wang, C.; Li, G. Head-on dynamic manifestations in the roadway driving with small coal pillar under the influence of roof drainage—A case study from Uxin Banner. Geofluids 2022, 2022, 7447423. [Google Scholar] [CrossRef]
- Shu, C. The Mechanism and Prevention of Rock Burst at the Water-Rich Working Face in the Deep Zone of Mine in the Adjacent Area of Shaanxi and Inner Mongolia. Ph.D. Thesis, University of Science and Technology Beijing, Beijing, China, 2018. [Google Scholar]
- Li, G. Acoustic Emission Inversion Analysis of Stope Similar Simulation Roof and Floor Fracture Characteristics. Master’s Thesis, Anhui University of Science and Technology, Huainan, China, 2022. [Google Scholar]
- Xia, Y.; Pan, J.; Xie, F.; Sun, X.; Lu, C.; Zhang, C.; Liu, S. Mechanism and effect of rock burst prevention using overlength horizontal hole staged fracturing technology. J. China Coal Soc. 2022, 47, 115–124. [Google Scholar]
- Shang, X.; Zhu, S.; Jiang, F.; Zhang, X.; Wang, C.; Wang, C.; Xie, H.; Yan, X.; Liu, J.; Wei, Q. Experimental study on the prevention and control of mine earthquake by high pressure water fracturing of huge thick strata in vertical shaft. J. China Coal Soc. 2021, 46, 639–650. [Google Scholar]
- Kang, H.; Lv, H.; Gao, F.; Meng, X.; Feng, Y. Understanding mechanisms of destressing mining-induced stresses using hydraulic fracturing. Int. J. Coal Geol. 2018, 196, 19–28. [Google Scholar] [CrossRef]


Disclaimer/Publisher’s Note: The statements, opinions and data contained in all publications are solely those of the individual author(s) and contributor(s) and not of MDPI and/or the editor(s). MDPI and/or the editor(s) disclaim responsibility for any injury to people or property resulting from any ideas, methods, instructions or products referred to in the content. |
© 2023 by the authors. Licensee MDPI, Basel, Switzerland. This article is an open access article distributed under the terms and conditions of the Creative Commons Attribution (CC BY) license (https://creativecommons.org/licenses/by/4.0/).