Article

Effects of Different Cooking Methods on Glycemic Index, Physicochemical Indexes, and Digestive Characteristics of Two Kinds of Rice

1
School of Biological and Chemical Engineering, Zhejiang University of Science and Technology, Hangzhou 310023, China
2
Department of Civil, Chemical and Environmental Engineering (DICCA), University of Genoa, Via Opera Pia 15, 16145 Genova, Italy
3
Shandong Kedunaopu Environmental Technology Co., Ltd., Zhucheng 262226, China
*
Authors to whom correspondence should be addressed.
Processes 2023, 11(7), 2167; https://doi.org/10.3390/pr11072167
Submission received: 19 June 2023 / Revised: 11 July 2023 / Accepted: 14 July 2023 / Published: 20 July 2023
(This article belongs to the Special Issue Processing Foods: Process Optimization and Quality Assessment (II))

Abstract

:
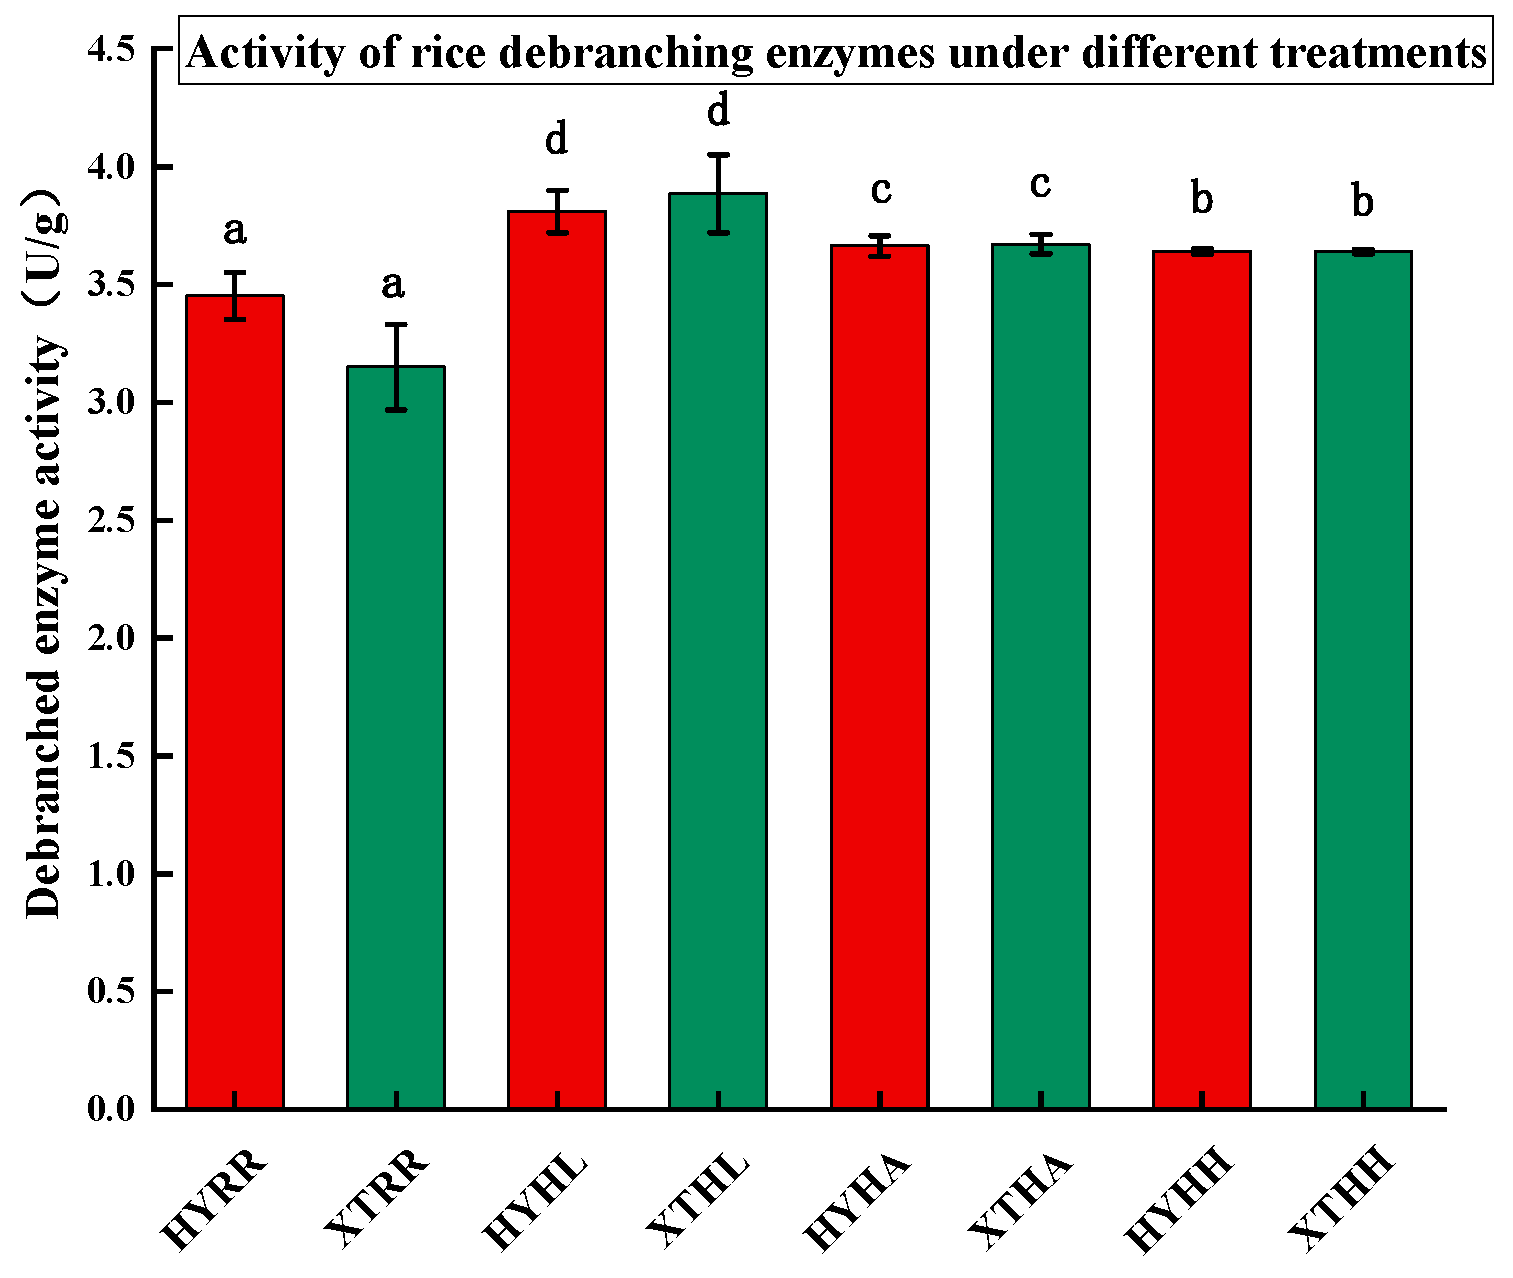
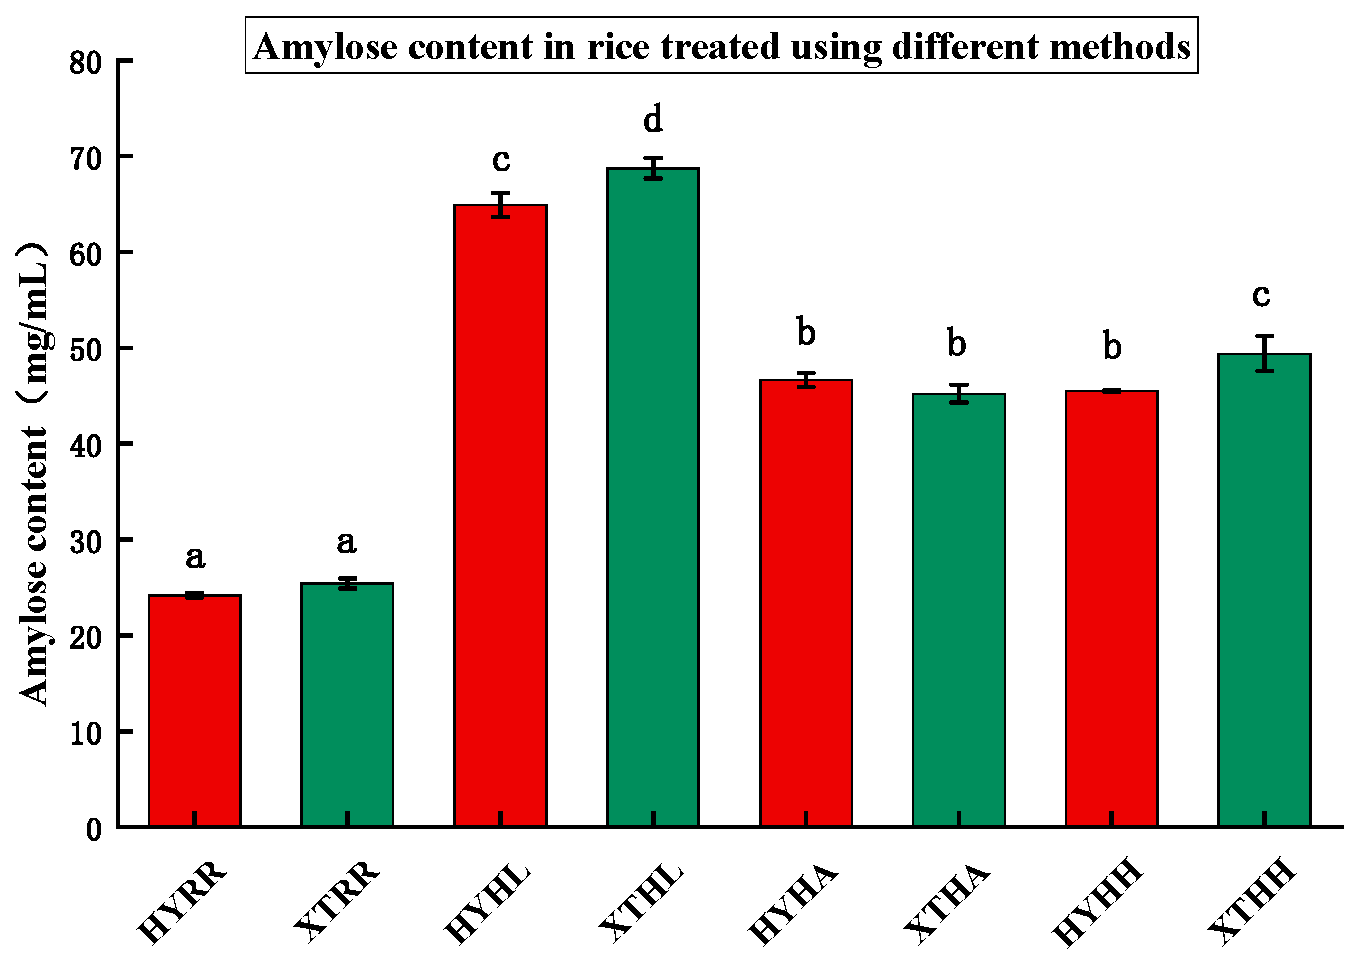
Diets including rice and rice-cooking methods influence digestive processes and blood glucose control. In this research, the effects of three different treatments (high-temperature and low-pressure plasma cooking, high-temperature cooking at atmospheric pressure (traditional method), and high-temperature cooking at high pressure) on the texture, color, molecular structure, infrared spectrum, microstructure, debranching enzyme activity, amylopectin content, glycemic index (GI), and in vitro starch digestibility of two rice varieties were studied. The results showed that the hardness, elasticity, viscosity, and chewability of rice after the high-temperature and low-pressure plasma treatment had no obvious changes compared with the traditional cooking method. A SEM analysis showed that the physical properties of the hydrophilicity on the surface of the rice increased after the high-temperature and low-pressure plasma treatment; the debranching enzyme activity reached 3.88 U/g (Xiantao rice) and 3.81 U/g (Heyuan rice), respectively, the amylose content of raw rice reached 68.77 mg/mL (Xiantao rice) and 64.92 mg/mL (Heyuan rice), which increased by 43.31 mg/mL and 39.46 mg/mL, respectively, and the GI was within the medium glycemic index of 56–69. The resistant starch in the Heyuan and Xiantao rice varieties amounted to 88.60 ± 3.10% and 89.40 ± 3.58%, respectively, after the high-temperature and low-pressure plasma processing method. The results showed positive effects and application potential for the cooking method in respect of diabetic consumers.

1. Introduction

There were over 537 million adult diabetes patients worldwide in 2021 [1], with the prevention and treatment of diabetes having created a heavy burden for patients, families, and societies. According to the prevention and control guidelines for diabetes mellitus type 2 (T2DM), nutritional treatments are an important part of both the comprehensive and basic treatment of diabetes. Foods with a low glycemic index (GI) are beneficial for controlling blood sugar [2,3] compared to high-GI foods [4]. GI was firstly reported by Dr. Jenkins as a relative number, usually referring to white bread or glucose, both belonging to high-GI foods (GI > 70). The long-term consumption of high-GI foods was shown to increase the risk of type 2 diabetes, while a low-GI diet could prevent the occurrence of type 2 diabetes. Rice is largely consumed worldwide, and the main factors affecting the GI value of rice include the variety, cooking method, quantity consumed, etc. [5,6,7].
The effects of the cooking methods on the GI value of rice are mainly influenced by the cooking temperature, time, other ingredients added, and postripening treatment. The gelatinization characteristics and their texture characteristics of hardness, viscosity, taste, etc., are different in varied types of rice. Although the amylose and amylopectin contents are generally of the same level, nonintuitive indexes, such as the starch digestion rate, GI value, total energy supply, etc., are different. The rice starch gelatinization temperature, the required minimum cooking time, the rice volume and weight [8], and rice hardness can change greatly, with rice hardness mainly being affected by the molecular weight of amylose, namely, the degree of the polymerization of glucose chains [9], as well as the protein content and interaction between protein and amylose, etc. [10]. The resistant starch content in rice cooked using different cooking methods varies, and the ratio of resistant starch directly affects the rice digestion rate [11].
Darandakumbura et al. found that three kinds of cooking methods (using a rice cooker, boiling and draining, and the traditional Indian cooking method) had no significant influence on the GI value of different varieties of rice [12]. In order to obtain the best taste, Lee et al. studied the ratio of different brown rice varieties to high-amylose rice and the ratio of water to rice; the results showed that the GI value of rice processed under optimal conditions was lower than that of ordinary white rice (67 vs. 89) [13]. Chiu et al. compared refrigeration effects on rice after cooking using three different methods (oven cooking, traditional rice cooking using a rice cooker, and cooking at high pressure); the resistant starch contents in the rice were different, but the GI values did not show significant differences [14].
Plasma is a gas containing free electrons, ions, and neutral particles. The plasma state can be characterized, for example, by its thermodynamic properties using thermodynamic equations of state. A distinction can be determined between thermal and nonthermal plasmas [15,16]. Plasma technology has been used in microbe sterilization, food preservation [17], activated water production [18], etc.
High-temperature and low-pressure plasma technology is a new food-processing technology that uses a variety of active particles and energy generated via collisions between high-energy electrons excited in plasma and gas molecules. The internal deoxygenation of the ingredients effectively extends the original quality of the food. During food material processing, low-pressure and high-temperature steam (up to 650 °C), as a form of plasma, was instantly released in a closed steam chamber; then, the food material was rapidly processed; for example, the rice was cooked between 12 min and 15 min [19]. In this study, in order to estimate the effects of this new processing method on the digestibility of rice, high-temperature and low-pressure plasma technology was used to process rice, and its effects on the physical properties and in vitro digestive properties of rice were compared with rice cooked with traditional methods and a high-pressure method. The results form the basis for the evaluation of new processing methods for cooking rice in respect of diabetic food production.

2. Materials and Methods

2.1. Materials and Instruments

Xiantao rice and Heyuan rice, harvested in 2019, were vacuum-packed and stored at 4 °C; the samples were provided by Shandong Kedunaopu Environmental Technology Co., Ltd. (Zhucheng, Shandong, China ); α-amylase (E.C.3.2.1.1) (Biological Reagent, BR) and pepsin (E.C.3.4.4.1) (BR) were obtained from Sinopsin Chemical Reagent Co., Ltd. (Shanghai, China); 3,5-dinitrosalicylic acid reagent (DNS) was supplied by Feijing Biotechnology Co., Ltd. (Fuzhou, China). The glucose amylase (E.C.3.2.1.3) (BR), potato amylose (AR), potassium bromide (AR), and iodine indicator (AR) came from Shanghai Aladdin Biochemical Technology Co., Ltd. (Shanghai, China). Porcine pancreatic α-amylase (E.C.3.2.1.1) (BR) was purchased from Shanghai Shifeng Biotechnology Co., Ltd. (Shanghai, China). Pullulan (AR) and anhydrous glucose (BR) were obtained from Shanghai Maclin Biochemical Technology Co., Ltd. (Shanghai, China).

2.2. Experimental Methods

2.2.1. Sample Processing

The two types of rice were cooked using high-temperature and low-pressure plasma equipment (GGT-DZS300, 220 V, 2.0 KW, Shandong Kedunaopu Environmental Technology Co., Ltd. (Zhucheng, Shandong, China)), a household rice cooker (FB50M205, Midea Group Co., Ltd., Foshan, China), and an autoclave (BE219006NF, Hangzhou Saidosi Technology Co., Ltd., Hangzhou, China). In order to study and compare the rice-cooking methods at high pressure and high temperature, the autoclave method was selected.
The conditions of ‘high-temperature and low-pressure plasma’ were set to 380 °C for 15 min, and the rice was cooked with the steam produced by the plasma. The “household rice cooker” processed the rice within 30 min, with the highest temperature being 100 °C. The autoclave parameters were set to 1.02 MPa and 121 °C for 20 min. After cooking, the samples were freeze-dried, crushed using a grinder (WK-2000A, Qingzhou Madsen Pharmaceutical Machinery Factory, Qingzhou, China), and sifted through a 60-mesh sieve as a powder for later use. Raw rice before cooking was crushed and sifted, and was used as the control.
The eight groups of samples after the treatments were as follows: Xiantao raw rice (XTRR), Heyuan raw rice (HYRR), Xiantao rice cooked at high temperature and low pressure using plasma equipment (XTHL), Heyuan rice cooked at high temperature and low pressure using plasma equipment (HYHL), Xiantao rice cooked at high-temperature atmospheric pressure using a household cooker (XTHA), Heyuan rice cooked at high-temperature atmospheric pressure using a household cooker (HYHA), Xiantao rice cooked at high pressure and high temperature (XTHH), and Heyuan rice cooked at high pressure and high temperature (HYHH). All the groups were summarized in Table 1.

2.2.2. Analysis of Texture Characteristics

In order to simulate the state of normal chewing, the texture analysis was slightly modified, based on Zhu et al. [20]. The texture analysis was undertaken using a physical property meter (probe P/5) (Texture analyzer (TA.XT PLUS-c), Stable Micro Systems, Godalming, UK) and the conditions were as follows: operation mode, pressure–time measurement; speed before measurement, 10 mm/s; test speed, 1.0 mm/s; measured speed, 1.0 mm/s; compression ratio, 70%; trigger point, 10 g; residence time, 1 s. The hardness, elasticity, adhesiveness, chewability, and resilience were analyzed using the Texture Exponent Software version 8 (Stable Micro Systems, Godalming, UK).

2.2.3. Color Analysis

The colors of the samples, expressed as L * , a * , and b * , were analyzed using a color difference meter (CR-400, Minolta Corporation, Tokyo, Japan) [21].

2.2.4. Near-Infrared Spectroscopy

The different freeze-dried rice powder samples were characterized via infrared spectroscopy on a Nicolet Nexus Fourier-Transform infrared spectrometer (Nexus 870, Nicolet, Thermo Fisher Scientific, Waltham, MA, USA) [22]. The finely ground rice powder and KBr were pressed into 13 mm diameter slices at a ratio of 1:100 for detection within the scanning range of 300~4000 nm and a resolution of 8 cm−1; the scanning time was 64 times and the wavelength interval was 2 nm.

2.2.5. Microstructure Analysis after Cooking

The microstructures of the cross-sections of the rice samples were obtained via a scanning electron microscope (SEM, JSM-5600LV, Jeol, Tokyo, Japan). The samples were broken with tweezers to obtain the cross-section; then, the samples were glued to the observation plate with a conductive adhesive (with the natural section facing upward as the observation surface) and sprayed with gold; then, the samples were observed via SEM under an accelerated voltage of 10 kV.

2.2.6. Determination of Debranched Enzyme Activity

The standard curve of glucose was obtained by analyzing the standard glucose using the DNS method. A total of 1.4 g of rice lyophilized powder was added to 5 mL of an acetic acid buffer (0.1 mol/L, pH 5.5) at 4 °C for 12 h. After centrifugation at 10,000 r/min and 4 °C for 15 min, the supernatant was collected as the enzyme extraction solution for the activity analysis. After the mixtures of 1.3 mL 0.4% pullulan solution, 0.5 mL acetic acid buffer (0.1 mol/L, pH 5.5), and 0.2 mL enzyme solution reacted in 25 mL test tubes at 35 °C for 30 min, 1.5 mL of a DNS solution was added for the reaction in a boiling water bath (HH-6, Changzhou Langyue Instrument Manufacturing Co., Ltd., Changzhou, China) for 5 min. After quickly cooling the samples, 25 mL of purified water was added, and the absorbance value of the final solution was measured at 540 nm for the glucose analysis. One unit of the debranched enzyme activity was defined as follows: the enzyme quantity of 1 mol/L malt triose produced by hydrolyzing pullulan within 1 min at 35 °C was regarded as an enzyme activity unit.
D e b r a n c h e d   e n z y m e   a c t i v i t y   U g = A × V × N 180 × 30 × 0.1 × W
where:
  • A denotes the corresponding glucose content (mg);
  • V denotes the enzyme extract volume (mL);
  • N denotes the dilution ratio of the extract;
  • 180 denotes the molecular weight of glucose;
  • W denotes the sample weight (g);
  • 30 denotes the reaction time (min).

2.2.7. Determination of Amylose Content

The 1 mg/mL potato amylose standards of 0.25, 0.50, 1.00, 1.50, and 2.00 mL were added to 100 mL volumetric bottles, respectively. A standard solution of 1 mg/mL amylopectin was prepared; then, 5, 4.75, 4.50, 4.00, 3.50, and 3.00 mL of the standard solution was added into different volume bottles, so that the total amount reached 5 mL. Another volume bottle (100 mL) was taken and 5 mL of NaOH (0.09 mol/L) was added into the bottle as the control. Then, 50 mL of distilled water, 1 mL of acetic acid (1 mol/L), and 1 mL of an iodine indicator were added to each bottle successively, and the absorption value was read at 720 nm after 10 min. The standard curve was drawn with the amylose concentration as the horizontal coordinate and the corresponding light absorption value as the vertical coordinate.
A total of 100 mg of freeze-dried rice powder was moistened using 1 mL of anhydrous ethanol in a 100 mL volumetric flask. After the addition of 9 mL of NaOH (1 mol/L), the starch was dispersed for 10 min (boiling water bath); then, the sample was cooled rapidly and purified water was added to amount to 100 mL. A total of 5 mL of the solution was transferred to another 100 mL volume bottle; after the addition of 1 mL acetic acid (1 mol/L), 1 mL of an iodine indicator, and purified water to amount to 100 mL, the mixture solution was set for 10 min; then, the amylose was measured at 720 nm. Different volumes of the potato amylose in 1 mg/mL were used as serial standards for the amylose analysis in the samples.

2.2.8. Determination of In Vitro Glycemic Index of Rice

The method used for the in vitro glycemic index analysis was adopted from Goni [23] and was modified. Briefly, 300 mg of freeze-dried rice sample powder was added to 20 mL phosphate-buffered solution (0.2 mol/L, pH = 7.5), and the pH was adjusted to 1.5 with HCl (1 mol/L). After the addition of 0.4 mL of a pepsin solution (150 U/mL) and reacting in a 37 °C water bath for 30 min, the pH value of the solution was adjusted to 6.9 with NaOH (1 mol/L) at room temperature. Then, 2 mL of an α-amylase solution (140 U/mL) was added and the volume was adjusted to amount to 50 mL with PBS (pH = 6.9). The solution was shaken in a 37 °C water bath and 1 mL of the sample was extracted every 30 min within 0~3 h. Then, the 1 mL sample was shaken in a 100 °C water bath to inactivate the enzyme. After being cooled to room temperature and the addition of 3 mL of a sodium acetate buffer (0.4 mol/L, pH = 4.75) and 40 μL of glucose amylase (110 U/mL), the mixture was oscillated at 55 °C for 45 min. After that, 0.2 mL of the solution was mixed with 0.15 mL DNS and reacted in a boiling water bath for 5 min; then, the solution was quickly cooled, and purified water was added to amount to 2.5 mL. The glucose was analyzed as the absorption value at 540 nm and calculated via the standard method.

2.2.9. Determination of Rice Digestibility

The determination of the digestibility of starch was slightly modified according to Englyst’s method [24]. A sample of 200 mg was accurately weighed and placed in a centrifuge tube. Then, 5 glass beads and 15 mL of an acetic acid–sodium acetate buffer (pH 5.2) were added. After mixing, 10 mL of pancreas α-amylase (350 U/mL) and saccharifying enzyme (20 U/mL) were added and reacted at 37 °C for 150 r/min. After hydrolysis for different times (0, 20, 120 min), 0.5 mL of the reaction solution was added to 4 mL of anhydrous ethanol to terminate the enzyme reaction; then, the glucose content was determined via colorimetric determination using the DNS method at a wavelength of 540 nm. The contents of rapidly digestible starch (RSDS), slowly digestible starch (SDS), and resistant starch (RS) in samples were calculated according to the following Equations (2)–(4):
R S D % = G 20 F G T S × 0.9 × 100
S D S % = G 20 G 120 T S × 0.9 × 100
R S % = T S R S D S D S T S × 100
where:
  • G20 denotes the glucose content (mg) produced after the 20 min hydrolysis of G20-amylase;
  • FG denotes the free glucose content (mg) in starch before the FG enzymatic hydrolysis;
  • G120 denotes the glucose content (mg) produced after the 120 min hydrolysis of G120-amylase;
  • TS denotes the total starch content (mg) in the sample.

2.2.10. Data Analysis

The experiments were carried out three times. SPSS 28.0 (IBM, Armonk, NY, USA) was used for the one-way analysis of variance (ANOVA) data analysis using Duncan’s test (p < 0.05). Origin 2019b (Origin Lab, Northampton, MA, USA) and Microsoft Office Excel 2019 were used for the data collation and mapping.

3. Results and Analysis

3.1. Analysis of Texture Characteristics

The hardness of Xiantao rice and Heyuan rice greatly reduced and the elasticity increased after processing in three ways (Table 2). Moreover, the hardness of the XTHL group (198.69 ± 10.51) was significantly lower than that of groups XTHA (205.32 ± 9.18) and XTHH (445.69 ± 16.92), and the elasticity of the XTHL group was at the same level as that of the XTHH group; these values were both significantly higher than that of the XTHA group, which increased the edible quality of the rice. The adhesiveness of the XTHH group was significantly greater than that of the XTHL and XTHA groups, which was due to the water absorbed during the high-temperature and high-pressure treatment. Chewability (mastication value) refers to the energy required to chew and swallow an elastic sample. After the plasma treatment, the fortified rice starch molecules became loose, and the chewability was higher than that of rice treated using a rice cooker. The hardness and adhesion parameters are related to the hydration process of the starch particles. The higher the hydration degree, the stronger the binding effect, and the better the improvement effect on the texture characteristics of rice. After the high-temperature and low-pressure plasma treatment, the surface of the rice became rough and the hydrophilicity increased. During cooking, water could quickly enter into the rice and combine with starch, which indicated that the plasma technology could effectively improve the texture characteristics of rice.

3.2. Color Analysis

The value of L * from positive to negative indicated that the sample tested was brighter or darker than the standard whiteboard; the a * value from positive to negative indicated that the sample tested contained more color than the standard whiteboard from red to green; the b * value from positive to negative indicated that the sample tested contained more color than the standard whiteboard from yellow to blue. The color of rice changed from milky white to yellowish brown during the aging process. Here, the values of L * and b * were used as evaluation indexes for the color of rice.
The color of rice represents the direct perception of its quality [25]. As can be seen in Table 3, compared with other treatment methods, Xiantao rice and Heyuan rice showed little change in brightness and color in the XTHL group, while the other treated groups showed greater changes in color from bright to dark, with the rice turning yellow after the high-temperature and high-pressure treatment. This was probably because the high-temperature and low-pressure plasma technology allowed the rice to be steamed quickly, so the water stayed firmly in the rice. It could be seen that the plasma-treated rice could retain its original color and quality to a great extent, giving consumers a pleasant visual experience.

3.3. Infrared Spectrum Analysis

It can be seen in Figure 1 that the characteristic peaks of the infrared spectra of rice treated in different ways were almost the same, but the characteristic peaks of rice treated using the high-temperature and low-pressure plasma cooking method showed differences with other groups. The peaks indicated different wave numbers and reflected different chemical bonds. The peaks in the 3300 cm−1 region were specified as stretching vibrations of the O–H and N–H groups, which are related to the presence of polysaccharides and proteins [26]. The signal in the 2920 cm−1 region was due to the asymmetric or symmetrical stretching of –CH2 from unsaturated fats and from small contributions from proteins, carbohydrates, and nucleic acids. The spectral regions at 1650 and 1550 cm−1 were the result of oscillations or the bending of protein-derived bonds. The absorption range near 1024 cm−1 was related to the C–O stretching vibration of polysaccharides [27,28]. This indicated that the hydrophilic groups increased in rice steamed using plasma and the hydrophilicity could be improved, which also explained why the cooking quality of rice improved after the high-temperature and low-pressure plasma treatment. The two groups of HYHL and XTHL were close in Figure 1, indicating that the processing method had the same influence on the two types of rice.

3.4. Microstructure Analysis

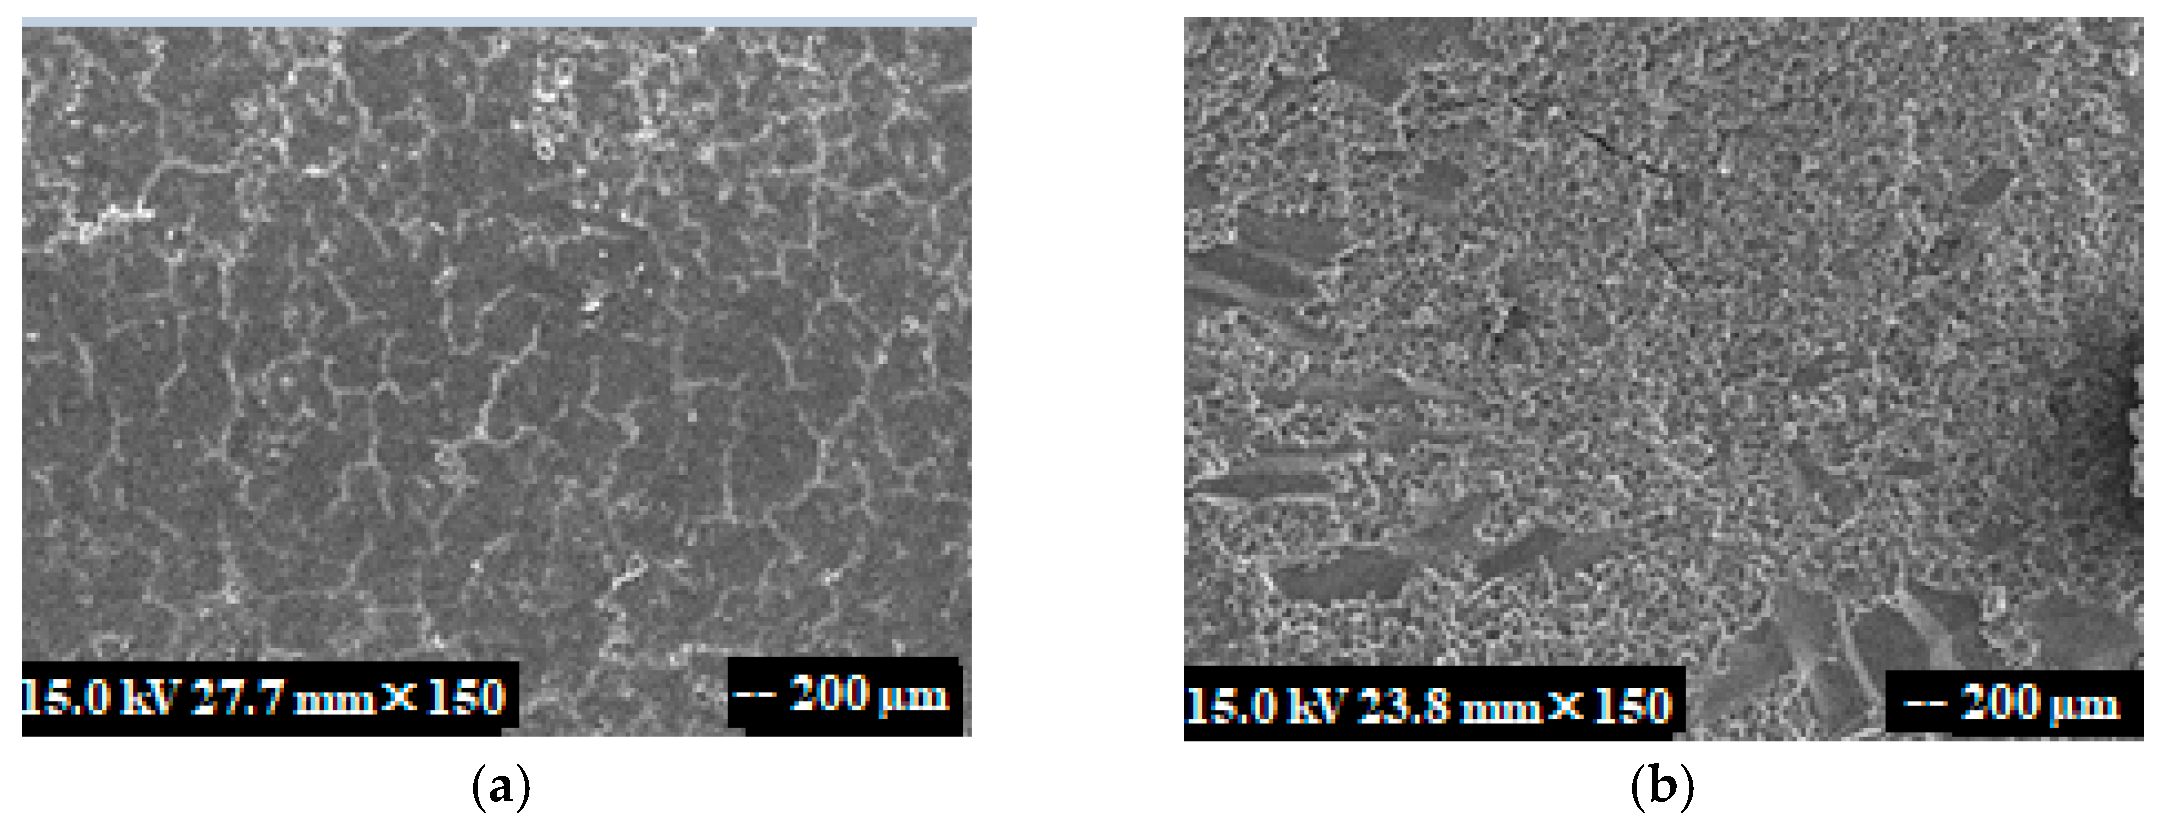
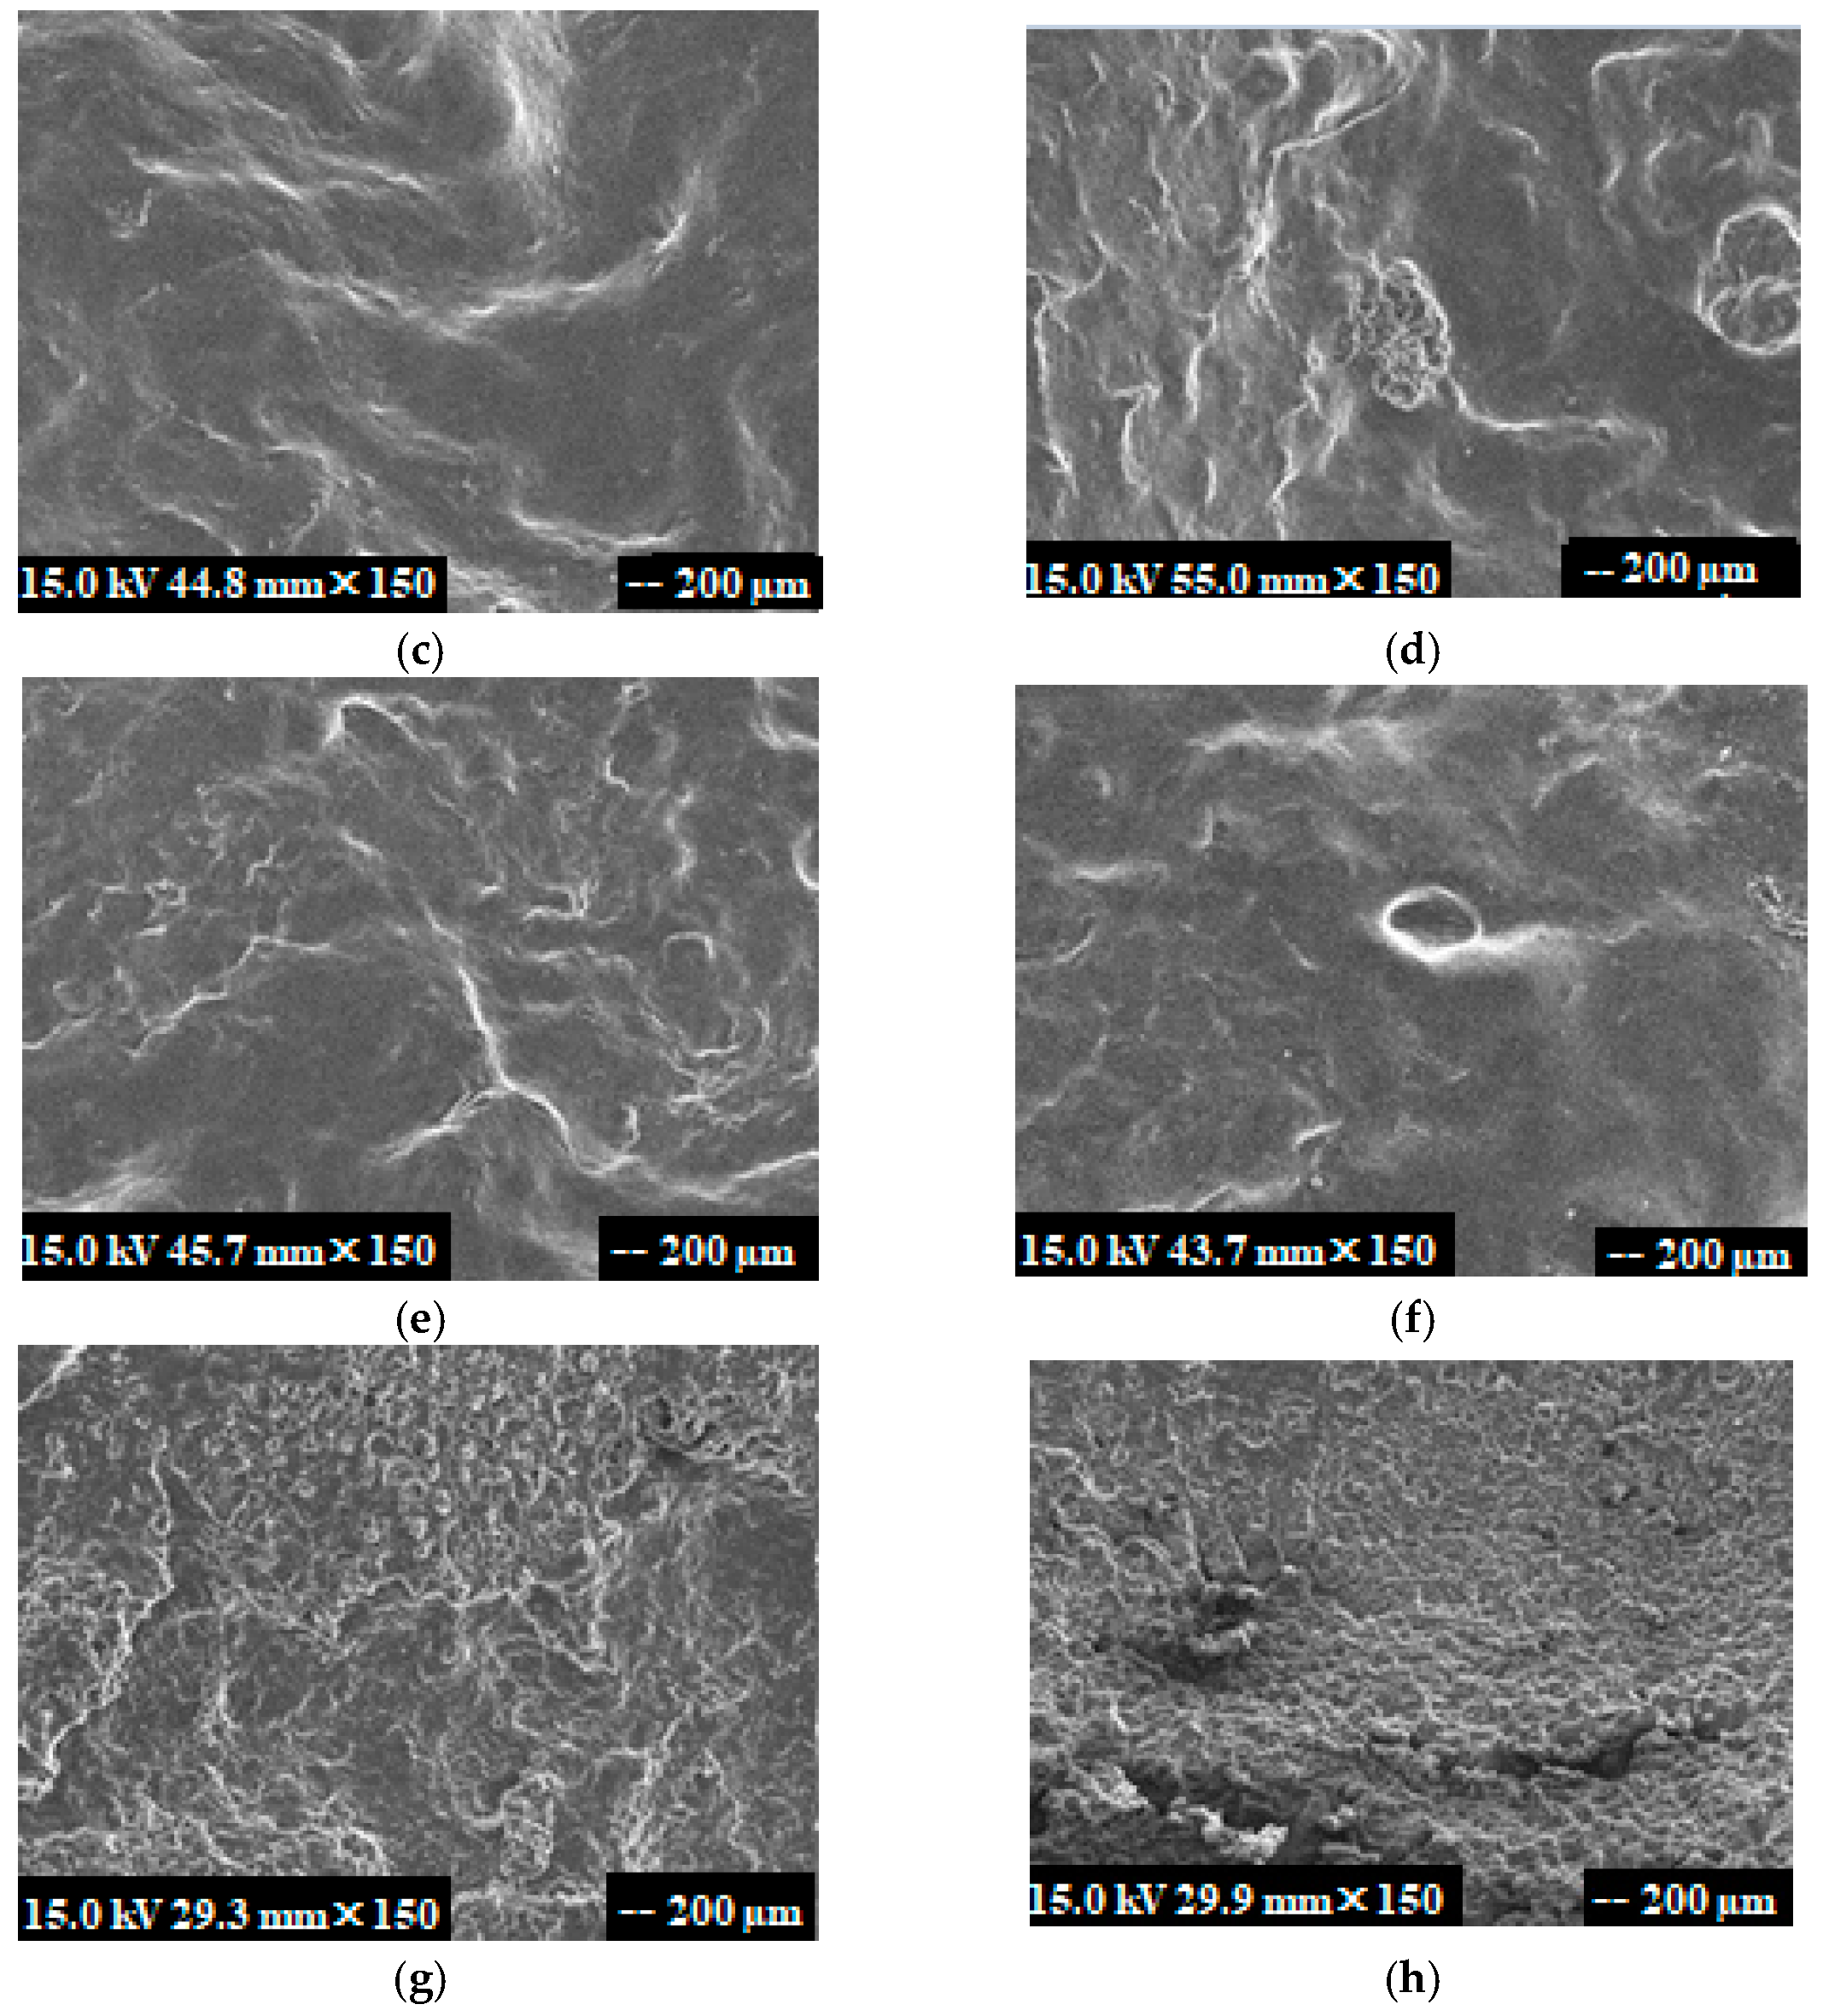
The microstructure of the rice surface after the high-temperature and low-pressure plasma treatment is shown in Figure 2. As can be clearly seen from Figure 2, cracks and dents on the surface of the rice particles after the high-temperature and low-pressure plasma treatment could have been caused by high-energy particles produced by the plasma during cooking. A large number of high-energy particles constantly impacted the surface of the rice, reducing the surface smoothness, changing the physical structure of the surface, and increasing the roughness, so that water could easily enter the inside of the rice, which is beneficial during rice cooking for the improvement of rice quality.

3.5. Determination of Debranched Enzyme Activity

The standard curve regression equation of the glucose content was y = 0.2652x + 0.0341, and the correlation coefficient was R2 = 0.9994, indicating a good linear relationship within the glucose range 0 to 1 mg/mL.
The starch debranched enzyme acted obligately on the α-1,6 glycosideric bonds of the amylopectin or glycogen branch points in the process of starch hydrolysis, promoting the breakdown of starch branch chains to form amylose of varying lengths, which is a key enzyme in respect of the conversion rate or the utilization rate of starch [29]. The debranched enzyme activity in rice can affect the production of insoluble amylose. The debranching enzyme activities in respect of Heyuan rice, Xiantao rice, and the three different treatment conditions were shown in Figure 3. Compared with raw rice, the debranching enzyme contents in Heyuan rice and Xiantao rice increased after being treated in the three ways, among which the plasma treatment represented the most obvious increase.

3.6. Determination of Amylose Content

After the analysis of the amylose contents, the standard curve with the regression equation of the amylose content was y = 0.0013x + 0.0727, and the correlation coefficient was R2 = 0.9957, indicating a good linear relationship. The amylose contents in respect of raw Heyuan rice, raw Xiantao rice, and the two rice varieties under three different treatment conditions are shown in Figure 4. As can be seen in Figure 4, compared with raw rice, the amylose contents of Heyuan rice and Xiantao rice increased after the three treatments, among which the high-temperature and low-pressure plasma technology had the most obvious effect, showing significant differences compared with raw rice and the other treatments.
Starch can be divided into two types: one is amylopectin, which can be easily infiltrated by water, be easily digested and absorbed by the human body, and has great influence on humans’ blood sugar; the other cannot easily be digested and absorbed, and the influence of amylose on humans’ blood sugar is relatively small. If it was possible to remove the amylopectin in rice, retaining the amylose and residual amylopectin, then the effect of the sugar content on diabetic patients would be reduced.

3.7. In Vitro Glucose Index Analysis of Rice

The GI was originally proposed by Dr. Jenkins from the University of Toronto, Canada. It refers to the percentage value of the blood glucose response level in the body within 2 h after consuming food containing 50 g carbohydrate, compared with that of consuming a comparable amount of standard food (white bread or glucose). It is mainly used to evaluate the degree of influence of a certain food or dietary composition on the blood glucose level in the body [30]. The postprandial glucose response is generally represented by the area under the curve of the postprandial glucose response [31]. The GI is a relative number, usually referring to white bread or glucose, both of which have a glycemic index of 100.
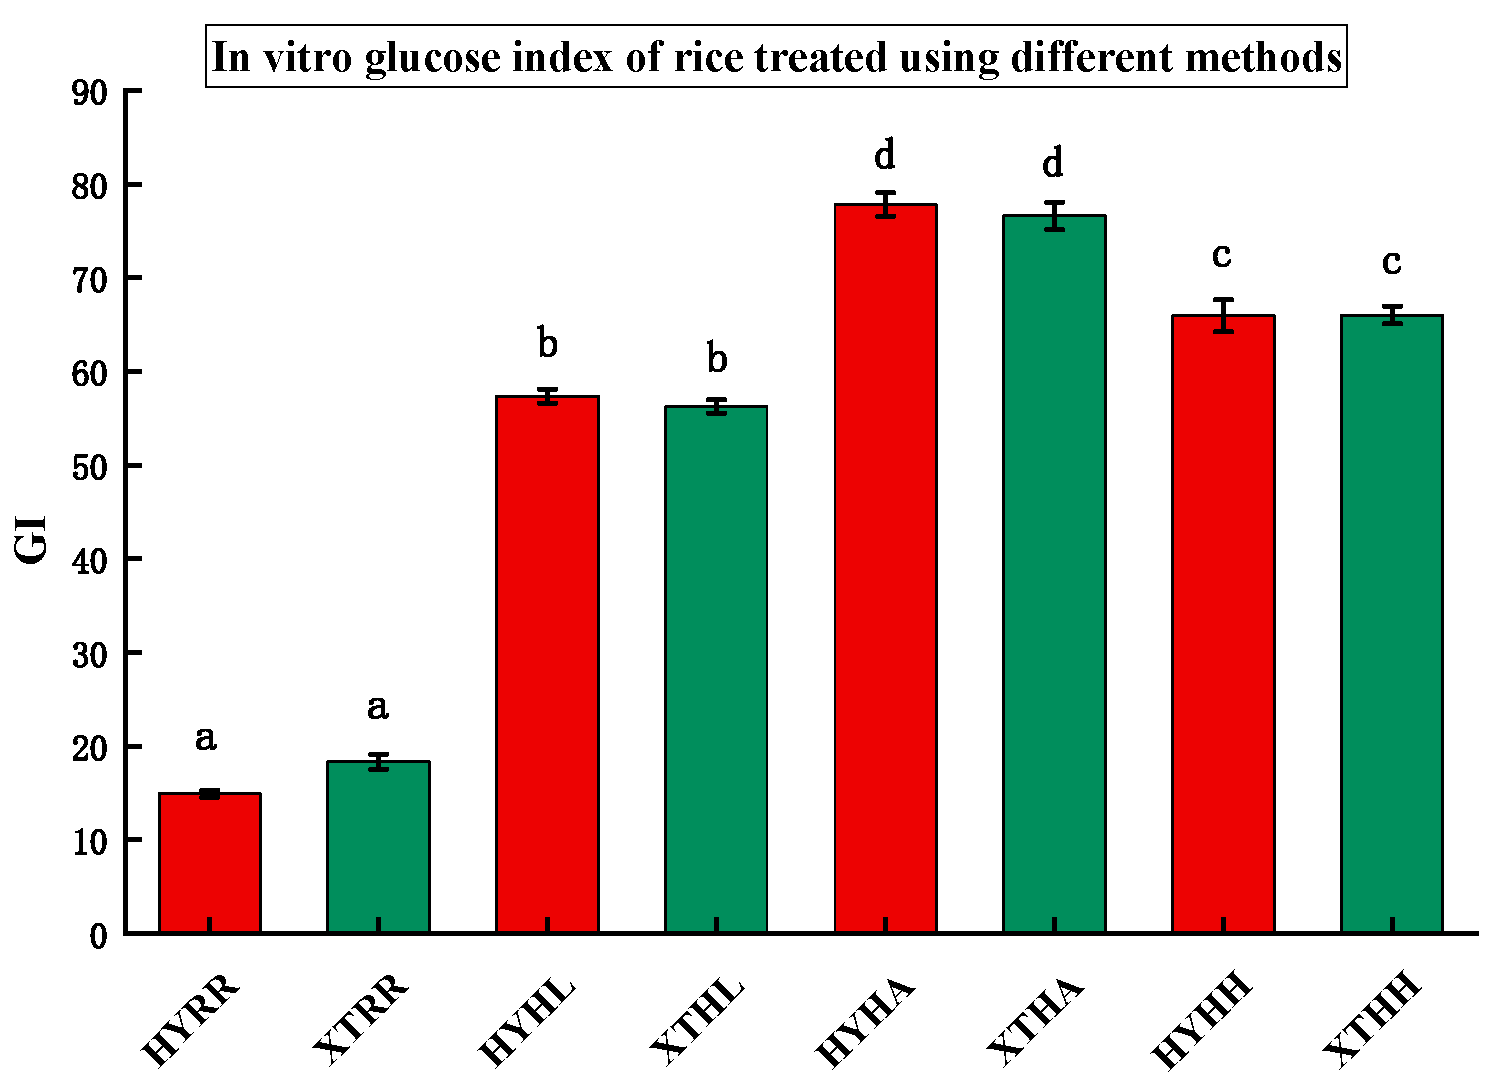
Foods can be divided into three categories based on their GI value: low-GI foods (GI < 55), medium-GI foods (55 < GI < 70), and high-GI foods (GI > 70). After entering the body, due to the fast digestion and complete absorption of high-GI foods, blood sugar increases faster and the peak value increases, stimulating islet cells, accelerating the secretion of insulin, and rapidly decreasing blood sugar, leading to sharp fluctuations in the blood sugar level, which is not conducive to blood sugar control. Due to the slow digestion and absorption of low-GI foods into the body, the blood sugar fluctuation curve becomes relatively smooth, which is conducive to blood sugar control [32]. Liu et al. [33] showed that the long-term consumption of high-GI foods increases the risk of type 2 diabetes, while a low-GI diet can prevent the occurrence of type 2 diabetes. The predicted in vitro glycemic index (GI) of Heyuan raw rice, Xiantao raw rice, and the two kinds of rice under three different treatment conditions is shown in Figure 5. According to the international food GI classification, foods can be divided into three categories: low-GI food (GI ≤ 55), medium GI-food (55 < GI < 70), and high-GI food (GI ≥ 70). As can be seen in Figure 5, the predicted glycemic index of the two rice varieties under the three different treatment conditions ranged from 56.17 to 67.72 within the range 55 < GI < 70, which denoted medium-GI food. The GI value from high to low was as follows: HYHA > XTHA > HYHH > XTHH > HYHL > XTHL.

3.8. Analysis of Digestive Characteristics of Rice

According to its digestibility, starch can be divided into three types: rapidly digestible starch (RDS), slowly digestible starch (SDS), and resistant starch (RS). Table 4 shows the changes in the digestibility of the rice starch granules under the various treatment conditions. By comparing the data in Table 4, it could be seen that the contents of RDS, SDS, and RS of Hyanyuan rice starch were 0.58%, 10.83%, and 23.98%, respectively, and the contents of RDS, SDS, and RS of Xiantao rice starch were 4.33%, 6.27%, and 39.02%, respectively. Compared with raw rice, the contents of RDS, SDS, and RS increased. Among them, the HYHL group and XTHL group showed the largest changes in the three kinds of starches.
It may be that the destruction of the multiscale structure of rice starch due to the high-temperature and low-pressure plasma technology, the loose crystal structure of rice after the treatments, the breaking of starch chains, the transformation of enzyme-binding sites and spatial conformation, and the rearrangement of molecular chains may have promoted the increase in the SDS content.

3.9. Application Feasibility of Plasma Technology

With the change and development of rapid lifestyles in China and some other countries, there exist large opportunities for the development of prepared foods, including low-GI foods. Cooking equipment is a necessary apparatus for canteens and restaurants; due to many consumers wanting to have dishes in canteens and restaurants during their working period, the cost of plasma equipment amounts to approximately RMB 120,000 (Chinese yuan), making it one of the choices in canteens and restaurants. As far as families are concerned, the expected price of current equipment is approximately RMB 6000, with more families being capable of affording plasma equipment. In addition, the energy consumption of the equipment is expected to be approximately 3.0 kW, according to different models, and the cooking of food can generally be completed within 15 min, with the energy consumption of the equipment being relatively low. Therefore, the plasma device is feasible for application following large-scale production.

4. Conclusions

As a new food processing technology, high-temperature and low-pressure plasma has shown great potential in improving the quality of rice products, stimulating high-energy electrons in the plasma to collide with gas molecules, in turn producing a variety of active particles and resulting in a series of complex changes, such as the rearrangement and combination of rice starch molecules and water. From the perspective of texture and color, this method improved the texture and appearance of the rice and increased the benefits to consumers for its positive effects on retarding the digestion of the rice. The infrared spectrum analysis showed that the hydrophilic groups increased and the hydrophilicity improved during the process of rice steaming. The SEM analysis showed that the surface of the rice was damaged after the high-temperature and low-pressure plasma treatment. The numbers of hydrophilic groups and the crystallinity of the rice increased, which destroyed the crystal structure of the starch in brown rice, and confirmed the reason for the improvements in the cooking and physicochemical properties of rice. According to the analysis of the relationship between debranching enzymes and amylose, the high-temperature and low-pressure plasma treatments could effectively improve the amylose content of rice. According to the results in respect of starch digestibility, rice treated with high-temperature and low-pressure plasma could slow the rice digestion and absorption, and the rice cooked with the new method had a medium glycemic index level. The results are not only of great value for diabetic patients and prediabetic people, but also of significance in helping the general population to provide more dietary choices for people in the future.

Author Contributions

Conceptualization, C.C.; methodology, G.C.; software, C.L.; validation, J.L.; formal analysis, F.Y.; investigation, F.Y., C.L. and G.C.; data curation, F.Y.; writing—original draft preparation, F.Y. and C.C.; writing—review and editing, R.C. and P.P.; visualization, R.C. and P.P.; project administration, C.C.; funding acquisition, C.C. and Y.W. All authors have read and agreed to the published version of the manuscript.

Funding

This research was funded by the Key Research and Development Program of Zhejiang province (grant no. 2020C02038) and the Project of Hangzhou Science and Technology (grant no. 202202).

Data Availability Statement

The data presented in this study are available on request from the corresponding author.

Conflicts of Interest

The authors declare no conflict of interest.

References

  1. Sun, H.; Saeedi, P.; Karuranga, S.; Pinkepank, M.; Ogurtsova, K.; Duncan, B.B.; Stein, C.; Basit, A.; Chan, J.C.N.; Mbanya, J.C.; et al. IDF Diabetes Atlas: Global, regional and country-level diabetes prevalence estimates for 2021 and projections for 2045. Diabetes Res. Clin. Pract. 2022, 183, 109119. [Google Scholar] [CrossRef] [PubMed]
  2. Zhi, Z.N.K.Z. Clinical guidelines for prevention and treatment of type 2 diabetes mellitus in the elderly in China (2022 edition). Chin. J. Intern. Med. 2022, 61, 12–50. [Google Scholar]
  3. Buse, J.B.; Wexler, D.J.; Tsapas, A.; Rossing, P.; Mingrone, G.; Mathieu, C.; D’Alessio, D.A.; Davies, M.J. 2019 Update to: Management of Hyperglycemia in Type 2 Diabetes, 2018. A Consensus Report by the American Diabetes Association (ADA) and the European Association for the Study of Diabetes (EASD). Diabetes Care 2020, 43, 487–493. [Google Scholar] [CrossRef] [PubMed] [Green Version]
  4. Wang, L.L.H.; Fan, H.R.; Ye, L.J.; Zhang, P.H. Study on the glycemic Index of rice with high resistance starch and its intervention in the regulation of blood glucose in diabetic patients. Chin. J. Nutr. 2017, 39, 197–199. [Google Scholar]
  5. Fitzgerald, M.A.; Rahman, S.; Resurreccion, A.P.; Concepcion, J.; Daygon, V.D.; Dipti, S.S.; Kabir, K.A.; Klingner, B.; Morell, M.K.; Bird, A.R. Identification of a major genetic determinant of glycaemic index in rice. Rice 2011, 4, 66–74. [Google Scholar] [CrossRef] [Green Version]
  6. Leonora, N.; Thompson, L.U. Blood glucose lowering effects of brown rice in normal and diabetic subjects. Int. J. Food Sci. Nutr. 2006, 57, 151–158. [Google Scholar]
  7. Ranawana, D.V.; Tan, W.J.K.; Quek, Y.C.R.; Henry, C.J. The impact of eating methods on eating rate and glycemic response in healthy adults. Physiol. Behav. 2015, 139, 505–510. [Google Scholar]
  8. Panlasigui, L.N.; Thompson, L.U.; Juliano, B.O.; Perez, C.M.; Greenberg, G.R. Rice varieties with similar amylose content differ in starch digestibility and glycemic response in humans. Am. J. Clin. Nutr. 1991, 54, 871–877. [Google Scholar] [CrossRef]
  9. Li, X.; Jiang, Y.; Tao, Y.; Li, W.Q.; Wang, F.Q.; Chen, Z.H.; Xu, Y.; Wang, J.; Fan, F.J.; Zhu, J.P.; et al. Research Progress of Rice with Low Glycemic Index. Chin. J. Rice Sci. 2022, 36, 336–347. [Google Scholar]
  10. Kunyanee, K.; Luangsakul, N. The impact of heat moisture treatment on the physicochemical properties and in vitro glycemic index of rice flour with different amylose contents and associated effects on rice dumpling quality. LWT 2022, 154, 112694. [Google Scholar] [CrossRef]
  11. Sajilata, M.G.; Singhal, R.S.; Kulkarni, P.R. Resistant starch—A review. Compr. Rev. Food Sci. Food Saf. 2006, 5, 1–17. [Google Scholar] [CrossRef] [PubMed]
  12. Darandakumbura, H.D.K.; Wijesinghe, D.G.N.G.; Prasantha, B.D.R. Effect of processing conditions and cooking methods on resistant starch, dietary fiber and glycemic index of rice. Trop. Agric. Res. 2013, 24, 163–174. [Google Scholar]
  13. Lee, J.S.; Cho, S.M.; Kim, B.K.; Han, J.A. Development of a cooked rice model for bibimbap and resulting physico-digestive properties. Food Sci. Biot. 2016, 25, 489–495. [Google Scholar] [CrossRef] [PubMed]
  14. Stewart, Y.-T.C.M.L. Effect of variety and cooking method on resistant starch content of white rice and subsequent postprandial glucose response and appetite in humans. Asia Pac. J. Clin. Nutr. 2013, 22, 372–379. [Google Scholar]
  15. Liu, M.; Shen, Y.H. A Plasma Low Pressure High Temperature Steam Food Preservation Equipment. Chinese Patent CN114668096A, 28 June 2022. Available online: https://www.cnipa.gov.cn/ (accessed on 20 June 2023).
  16. Schluter, O.; Ehlbeck, J.; Hertel, C.; Habermeyer, M.; Roth, A.; Engel, K.H.; Holzhauser, T.; Knorr, D.; Eisenbrand, G. Opinion on the use of plasma processes for treatment of foods. Mol. Nutr. Food Res. 2013, 57, 920–927. [Google Scholar] [CrossRef]
  17. Mir, S.A.; Shah, M.A.; Mir, M.M. Understanding the role of plasma technology in food industry. Food Bioprocess Technol. 2016, 9, 734–750. [Google Scholar] [CrossRef]
  18. Usman, I.; Afzaal, M.; Imran, A.; Saeed, F.; Afzal, A.; Ashfaq, I.; Shah, Y.A.; Islam, F.; Azam, I.; Tariq, I.; et al. Recent updates and perspectives of plasma in food processing: A review. Int. J. Food Prop. 2023, 26, 552–566. [Google Scholar] [CrossRef]
  19. Oliveira, M.; Fernandez-Gomez, P.; Alvarez-Ordonez, A.; Prieto, M.; Lopez, M. Plasma-activated water: A cutting-edge technology driving innovation in the food industry. Food Res. Int. 2022, 156, 111368. [Google Scholar] [CrossRef]
  20. Zhu, L.; Bi, S.; Wu, G.; Zhang, H.; Wang, L.; Qian, H.; Qi, X.; Jiang, H. Comparative analysis of the texture and physicochemical properties of cooked rice based on adjustable rice cooker. LWT 2020, 130, 109650. [Google Scholar] [CrossRef]
  21. Shen, R.L.; Zhang, W.J.; Dong, J. Preparation, structural characteristics and digestibility of resistant starches from highland barley, oats and buckwheat starches. J. Food Nutr. Res. 2016, 55, 303–312. [Google Scholar]
  22. Wang, S.; Luo, H.; Zhang, J.; Zhang, Y.; He, Z.; Wang, S. Alkali-induced changes in functional properties and in vitro digestibility of wheat starch: The role of surface proteins and lipids. J. Agric. Food Chem. 2014, 62, 3636–3643. [Google Scholar] [CrossRef] [PubMed]
  23. Goni, I.; Garcia-Alonso, A.; Saura-Calixto, F. A starch hydrolysis procedure to estimate glycemic index. Nutr. Res. 1997, 17, 427–437. [Google Scholar] [CrossRef]
  24. Englyst, H.N.; Kingman, K.S.; Cummings, J.H. Classification and measurement of nutritionally important starch fractions. Eur. J. Clin. Nutr. 1992, 46, 33–50. [Google Scholar]
  25. Li, W.Q.; Zhang, K.H. Study on the influence factors of rice color. Grain Process. 2011, 36, 33–35. (In Chinese) [Google Scholar]
  26. Genkawa, T.; Ahamed, T.; Noguchi, R.; Takigawa, T.; Ozaki, Y. Simple and rapid determination of free fatty acids in brown rice by FTIR spectroscopy in conjunction with a second-derivative treatment. Food Chem. 2016, 191, 7–11. [Google Scholar] [CrossRef]
  27. Samyor, D.; Deka, S.C.; Das, A.B. Phytochemical and antioxidant profile of pigmented and non-pigmented rice cultivars of Arunachal Pradesh, India. Int. J. Food Prop. 2015, 19, 1104–1114. [Google Scholar] [CrossRef] [Green Version]
  28. Giang, L.T.; Thien, T.L.T.; Yen, D.H. Rapid classification of rice in northern vietnam by using FTIR spectroscopy combined with chemometrics methods. Vietnam J. Chem. 2020, 58, 372–379. [Google Scholar] [CrossRef]
  29. Wang, Y.F.; Zhang, W.L.; Huang, D.; Dou, Y. The advance of starch-debranching enzyme and the application. China Brew 2008, 27, 25–26. [Google Scholar]
  30. Jenkins, D.J.A.; Wolever, T.M.S.; Taylor, R.H.; Barker, H.; Fielden, H.; Baldwin, J.M.; Bowling, A.C.; Newman, H.C.; Jenkins, A.L.; Goff, D.V. Glycemic index of foods: A physiological basis for carbohydrate exchange. Am. J. Clin. Nutr. 1981, 34, 362–366. [Google Scholar] [CrossRef] [Green Version]
  31. Riccardi, G.; Rivellese, A.A.; Giacco, R. Role of glycemic index and glycemic load in the healthy state, in prediabetes, and in diabetes. Am. J. Clin. Nutr. 2008, 87, 269–274. [Google Scholar] [CrossRef] [Green Version]
  32. Mann, J.; Cummings, J.H.; Englyst, H.N.; Key, T.; Liu, S.; Riccardi, G.; Summerbell, C.; Uauy, R.; van Dam, R.M.; Venn, B.; et al. FAO/WHO scientific update on carbohydrates in human nutrition: Conclusions. Eur. J. Clin. Nutr. 2007, 61 (Suppl. S1), S132–S137. [Google Scholar] [CrossRef] [PubMed] [Green Version]
  33. Liu, J.; Zhang, W.Q. Food glycemic index and glycemic load in the prevention and treatment of chronic diseases. Chin. J. Med. Clin. 2014, 14, 1062–1064. [Google Scholar]
Figure 1. Infrared spectra of rice after different treatments. Xiantao raw rice (XTRR), Heyuan raw rice (HYRR), Xiantao rice cooked at high temperature and low pressure using plasma equipment (XTHL), Heyuan rice cooked at high temperature and low pressure using plasma equipment (HYHL), Xiantao rice cooked at high-temperature atmospheric pressure using a household cooker (XTHA), Heyuan rice cooked at high-temperature atmospheric pressure using a household cooker (HYHA), Xiantao rice cooked at high pressure and high temperature (XTHH), and Heyuan rice cooked at high pressure and high temperature (HYHH).
Processes 11 02167 g001
Figure 2. (a,c,e,g) Electron microscopic images of HYRR, HYHA, HYHH, and HYHL; (b,d,f,h) electron microscopic images of XTRR, XTHA, XTHH, and XTHL. The samples were tested under the conditions of 200 times amplification. Xiantao raw rice (XTRR), Heyuan raw rice (HYRR), Xiantao rice cooked at high temperature and low pressure using plasma equipment (XTHL), Heyuan rice cooked at high temperature and low pressure using plasma equipment (HYHL), Xiantao rice cooked at high-temperature atmospheric pressure using a household cooker (XTHA), Heyuan rice cooked at high-temperature atmospheric pressure using a household cooker (HYHA), Xiantao rice cooked at high pressure and high temperature (XTHH), and Heyuan rice cooked at high pressure and high temperature (HYHH). Different lowercase letters indicate significant differences between treatments (p < 0.05).
Processes 11 02167 g002aProcesses 11 02167 g002b
Figure 3. Activity of rice debranching enzymes under different treatments. Xiantao raw rice (XTRR), Heyuan raw rice (HYRR), Xiantao rice cooked at high temperature and low pressure using plasma equipment (XTHL), Heyuan rice cooked at high temperature and low pressure using plasma equipment (HYHL), Xiantao rice cooked at high-temperature atmospheric pressure using a household cooker (XTHA), Heyuan rice cooked at high-temperature atmospheric pressure using a household cooker (HYHA), Xiantao rice cooked at high pressure and high temperature (XTHH), and Heyuan rice cooked at high pressure and high temperature (HYHH). Different lowercase letters indicate significant differences between treatments (p < 0.05). The two rice groups were compared separately.
Processes 11 02167 g003
Figure 4. Amylose content in rice treated using different methods. Xiantao raw rice (XTRR), Heyuan raw rice (HYRR), Xiantao rice cooked at high temperature and low pressure using plasma equipment (XTHL), Heyuan rice cooked at high temperature and low pressure using plasma equipment (HYHL), Xiantao rice cooked at high-temperature atmospheric pressure using a household cooker (XTHA), Heyuan rice cooked at high-temperature atmospheric pressure using a household cooker (HYHA), Xiantao rice cooked at high pressure and high temperature (XTHH), and Heyuan rice cooked at high pressure and high temperature (HYHH). Different lowercase letters indicate significant differences between treatments (p < 0.05). The two rice groups were compared separately.
Processes 11 02167 g004
Figure 5. In vitro glucose index of rice treated using different methods. Xiantao raw rice (XTRR), Heyuan raw rice (HYRR), Xiantao rice cooked at high temperature and low pressure using plasma equipment (XTHL), Heyuan rice cooked at high temperature and low pressure using plasma equipment (HYHL), Xiantao rice cooked at high-temperature atmospheric pressure using a household cooker (XTHA), Heyuan rice cooked at high-temperature atmospheric pressure using a household cooker (HYHA), Xiantao rice cooked at high pressure and high temperature (XTHH), and Heyuan rice cooked at high pressure and high temperature (HYHH). Different lowercase letters indicate significant differences between treatments (p < 0.05). The two rice groups were compared separately.
Processes 11 02167 g005
Table 1. The processed samples’ names and abbreviations.
Sample NameProcessing Mode
XTRRXiantao raw rice
HYRRHeyuan raw rice
XTHLXiantao rice cooked at high temperature and low pressure using plasma equipment
HYHLHeyuan rice cooked at high temperature and low pressure using plasma equipment
XTHAXiantao rice cooked at high-temperature atmospheric pressure using a household cooker
HYHAHeyuan rice cooked at high-temperature atmospheric pressure using a household cooker
XTHHXiantao rice cooked at high pressure and high temperature
HYHHHeyuan rice cooked at high pressure and high temperature
Table 2. Effects of different treatments on texture characteristics of rice.
Treatment ModeHardness/gElasticityAdhesivenessMasticationResilience
XTRR1214.64 ± 24.19 a0.18 ± 0.01 c10.24 ± 0.58 d3.05 ± 0.19 c0.02 ± 0.00 d
XTHL198.69 ± 10.51 d0.65 ± 0.03 a37.74 ± 1.38 c94.75 ± 4.22 b0.15 ± 0.01 b
XTHA205.32 ± 9.18 c0.46 ± 0.03 b39.73 ± 2.01 b94.02 ± 7.13 b0.10 ± 0.01 c
XTHH445.69 ± 16.92 b0.62 ± 0.03 a48.86 ± 3.17 a129.84 ± 8.48 a0.24 ± 0.02 a
HYRR1393.98 ± 25.82 a0.38 ± 0.02 d18.45 ± 0.84 c2.41 ± 0.16 d0.02 ± 0.00 d
HYHL132.07 ± 4.66 d0.44 ± 0.01 c35.46 ± 2.19 b95.65 ± 5.32 b0.19 ± 0.01 b
HYHA176.69 ± 3.71 c0.47 ± 0.03 b34.62 ± 2.96 b91.67 ± 7.16 c0.16 ± 0.00 c
HYHH276.80 ± 6.19 b0.67 ± 0.04 a53.66 ± 3.98 a153.52 ± 6.73 a0.23 ± 0.01 a
Different letters represent significant differences between the groups. The two rice groups were compared separately for every characteristic.
Table 3. Effects of different treatments on color of rice.
Sample Groups L * a * b * D L * D a * D b *
XTRR88.48 ± 1.54 a−0.80 ± 0.07 b6.45 ± 0.39 b---
XTHL86.68 ± 1.88 b−0.96 ± 0.05 c6.08 ± 0.09 c−1.80 ± 0.03 a−0.16 ± 0.01 b−0.37 ± 0.02 b
XTHA82.76 ± 2.46 c−0.95 ± 0.09 c5.35 ± 0.33 d−5.72 ± 0.19 b−0.15 ± 0.03 b−1.10 ± 0.09 c
XTHH81.88 ± 0.98 d−0.23 ± 0.01 a8.09 ± 0.18 a−6.60 ± 0.32 c0.57 ± 0.03 a1.64 ± 0.11 a
HYRR90.70 ± 1.37 a−0.80 ± 0.05 b6.45 ± 0.39 b---
HYHL82.38 ± 1.83 c−0.79 ± 0.06 b4.74 ± 0.22 d−8.32 ± 0.62 b0.01 ± 0.00 b−1.71 ± 0.09 c
HYHA86.66 ± 1.90 b−0.93 ± 0.06 c6.34 ± 0.51 c−4.04 ± 0.15 a−0.13 ± 0.01 c−0.11 ± 0.01 b
HYHH74.18 ± 0.99 d0.83 ± 0.02 a9.61 ± 0.29 a−16.52 ± 1.19 c1.63 ± 0.09 a3.16 ± 0.23 a
Different letters represent significant differences between the groups. The two rice groups were compared separately.
Table 4. Digestive characteristics of rice starch under different treatment conditions.
Treatment ModeRDS (%)SDS (%)RS (%)
HYRR0.58 ± 0.02 a10.83 ± 0.54 b23.98 ± 0.61 a
XTRR4.33 ± 0.29 b6.27 ± 0.34 a39.02 ± 1.42 b
HYHL12.1 ± 1.06 c63.92 ± 3.50 d88.60 ± 3.10 c
XTHL12.69 ± 1.01 c48.29 ± 2.65 c89.40 ± 3.58 c
HYHA11.35 ± 0.62 d27.24 ± 1.64 a61.42 ± 1.07 d
XTHA8.59 ± 0.40 b34.05 ± 1.10 b57.36 ± 2.54 c
HYHH9.43 ± 0.53 c37.55 ± 1.20 c53.02 ± 1.20 a
XTHH8.16 ± 0.54 a37.29 ± 0.61 c54.55 ± 1.58 b
Different letters indicate significant differences between the groups.
Disclaimer/Publisher’s Note: The statements, opinions and data contained in all publications are solely those of the individual author(s) and contributor(s) and not of MDPI and/or the editor(s). MDPI and/or the editor(s) disclaim responsibility for any injury to people or property resulting from any ideas, methods, instructions or products referred to in the content.